 Yuzhuo Li
 Dongbo Yu
94% of researchers rate our articles as excellent or good
Learn more about the work of our research integrity team to safeguard the quality of each article we publish.
Find out more
ORIGINAL RESEARCH article
Front. Environ. Sci. , 24 May 2024
Sec. Land Use Dynamics
Volume 12 - 2024 | https://doi.org/10.3389/fenvs.2024.1406460
This article is part of the Research Topic The Sustainable Management of Land Systems View all 24 articles
Introduction: With the rapid advancement of industrialization and urbanization in the Yellow River Basin, the number of resource-based cities is constantly increasing, leading to an imbalance in land use structure and the gradual worsening of adverse effects such as damage to the ecological environment. Hence, improving the efficiency of green land use in resource-based cities has extremely crucial ecological and practical meaning for sustainable development.
Methods: This study comprehensively considers interdisciplinary theories such as ecology and management, and combines the actual situation of resource-based cities in the Yellow River Basin to construct a new type of urban field green utilization efficiency assessment index system. To promote the coordinated development of different dimensions, the corresponding spatiotemporal evolution process and related influencing factors were also analyzed.
Results and discussion: The research results indicate that the overall spatial evolution of the Yellow River Basin has active correlation. During the period from 2006 to 2022, the number of high value agglomeration cities in upstream resource-based cities increased by nearly 25%; Nearly 3% of resourcecities exhibit low-value heterogeneity, while the number of resource cities with low value agglomeration has decreased to 0. In addition, population density and scientific education expenditure level are key factors affecting the ratio of green land use in resource-based cities, while the impact of economic indicators is gradually decreasing. In summary, the assessment indicator system for urban land green utilization ratio proposed in the study is more comprehensive, and the spatial distribution results of influencing factors can provide a solid data foundation for decision-makers.
For the past few years, sustainable development strategy and green development have become the primary topics in China. However, the ecological protection function of resource-based cities (ReB-C) in the upper and middle reaches of the Yellow River Basin (YRB) has been disrupted, leading to ecological problems such as soil erosion in midstream. Excessive sediment in the downstream areas can easily form suspended rivers, leading to floods (Zheng H et al., 2021; Jia L et al., 2022; Zhang et al., 2022). The YRB itself belongs to an ecologically fragile area, and the rapid advancement of industrialization and urbanization has formed a development model of high-intensity development and extensive management. This has caused serious obstacles to the ecological environment and land use, and further led to issues such as imbalanced land resource structure, low land use efficiency, and resource waste (Fan et al., 2022; Ning et al., 2022). Therefore, how to coordinate the relationship between different dimensions is the top priority in promoting green land use (GLU) in ReB-C in the YRB. To achieve the above goals, this study is guided by sustainable development and green development, and designs an evaluation index system (EIS) for GLU efficiency (GLU-E) of ReB-C in YRB through multidisciplinary theory and field conditions. The study also explored its space evolution process, related influencing elements, and ranking of influence. This project aims to give a reasonable suggestion for decision-makers to formulate plans, alleviate the pressure of land use and ecological environment, and promote to develop for long and high-quality of various ReB-C in the YRB.
The research targets to solve the problems that hinder the development and improvement of ReB-C in YRB. Guided by the introduction of GLU, the ecological protection concept and sustainable development concept are further applied to the land spatial planning system of the YRB. It hopes to strengthen the ecological security of urban land and stimulate to develop the long-term healthy social economy. There are two main innovative points in the research. The first point is to use multiple disciplines such as ecology, economics, and management to comprehensively design an EIS for GLU rate of ReB-C in the YRB. The second point is to use factor detection to analyze the impact range and spatial distribution differences of relevant influencing factors on the GLU rate of ReB-C. The structure of the study is mainly segmented into four sections. The first part is a review of relevant research results; The second part is to study the natural environment status and existing problems of ReB-C in the YRB, and design corresponding EISs for GLU ratio; The third part is the analysis of the results of the proposed research methods, including spatiotemporal evolution (SE) analysis and influencing factor analysis; The final part is a summary of the research.
Land, as the spatial carrier of all human social activities, is the material guarantee for human development and continuity, and land use efficiency can reflect the scale of human investment in land to obtain output that meets the needs of survival and development. Therefore, many scholars have conducted in-depth discussions on the relevant content of land use efficiency. B. Hung et al. conducted an evaluation of land use efficiency in Danping Township, Dakdoa District, Jialai Province, Vietnam, in order to achieve reasonable and effective land use and make important contributions to the country and local areas. After field research, the following results have been obtained: there are six common types of land use in this area. Among them, the economic benefits of LUT for chili pepper cultivation are the highest, the social benefits of LUT for coffee are the highest, and the overall benefits of LUT for bergamot are the highest. This also provides important scientific basis for achieving effective and sustainable land use efficiency (Hung et al., 2020). Y. Q. Duan et al. constructed an evaluation index for the coordination between rail-transit station operation efficiency and land use to alleviate the contradiction between rail-transit operation and surrounding ground use. The key indicators affecting the coupled development of the two were identified, including land use ratio, plot ratio, land use combination, and parking facility control. The sound control of indicators has promoted the land use efficiency around Xi’an Rail Transit Station (Duan et al., 2020). Silvio et al., to deal with the situation of insufficient nutrient supply of new vegetation in the process of vegetation restoration in the mining area, chose the long stemmed sheep’s hoof beetle and trees from the Amazon rainforest for research. The results showed that the long-stemmed sheep hoof beetle has practical significance for plant restoration in mining areas, and can effectively improve the land use efficiency of mining areas (Ramos et al., 2020). To make the most of water resources, land use efficiency and crop productivity are adopted to improve land technology for surface drip irrigation under arid conditions in India. S. S. Rathore et al. conducted field experiments on Indian mustard and found that Indian mustard also had better growth and yield characteristics in flat planting land configurations of 60/30 and 30/60 cm (Rathore et al., 2020). N. A. Alekseeva evaluated the resource potential and land use efficiency of agricultural production cooperatives, taking the Republic of Udmurt as an example, to promote changes in agricultural land transfer legislation. Finally, the study concluded that the factors underlying the connection between the level of legitimate land registration and land use efficiency are reasonable (Alekseeva, 2020).
The GLU ratio is obtained through the optimization of traditional land utilization efficiency development. Guided by green and sustainable development strategies, it emphasizes the moderate use of land resources to avoid ineffective utilization of land resources. F. Liu et al. found that the green utilization efficiency (GUE) of regional land is an important indicator of ecosystem health. Their research estimate the land-quality of Xinjiang Production and Construction Corps and other regions through the InVEST model, further analyzing the resemblances and distinctions in their space distribution. During 1990–2018, the degree of habitat degradation in Xinjiang decreased first following increased, and the quality of habitat gradually decreased; During 2018–2035, the area of arable and construction area in agricultural and non-agricultural areas will gradually increase, while forest and grassland will decrease. It may cause a gradual decline (Liu F and Xu, 2020). F. Qian et al. used land GUE to study spatial distribution features and balance collaborative spatial patterns in order to scientifically allocate multi-functional arable land. It showed that the multi-function of cultivated land could exhibit a synergistic trend in time, also it exhibited heterogeneity and volatility, giving instructions for new models of cultivated land development or management (Qian F et al., 2020). K. Song et al. found that water blooms threaten water quality and the eco-health of aquatic communities. China is experiencing high-speed economic growth and significant land-use changes in the past few decades. By analyzing the efficiency of land green utilization, it is found that human factors have exceeded the impact of climate elements of absolute atmospheric concentration in China’s soil and water conservation areas. This can provide information for resource management decision-making (Song et al., 2021). Y. Wu et al. discussed that analyzing the efficiency of GLU is greatly meaningful for balancing economic development and ensuring food security. Therefore, they applied the SBM to calculate the land GUE of 126 prefecture level cities in the Yangtze-River Economic-Belt from 2008 to 2017, and revealed their SE characteristics. From the perspective of factor input, the future direction of improving farmland utilization efficiency has been proposed (Wu et al., 2022). Y. U. Chuqiao et al. studied the land use change, landscape pattern, and habitat quality changes in Yunnan Province from 1980 to 2020. The purpose was to explore the SE characteristics of habitat quality in inland ecosystems, using landscape pattern analysis and InVEST habitat quality model. The conclusion is that the habitat quality in Yunnan Province shows a high low high distribution from northwest to southeast, and the overall habitat quality is higher than the average level. It is necessary to develop optimization strategies to improve regional ecological benefits (Chuqiao et al., 2022).
In summary, many studies on land use efficiency and SE analysis are existed, but there has been very little research on the GUE of ReB-C in the YRB. To expand the related surveys about the content mentioned above in the YRB, this article takes 53 ReB-C in the YRB as the research objects. The EIS and influencing factors of land GUE were designed to explore and analyze the degree of influence of different influencing factors.
This chapter introduces the current situation of the natural environment, socio-economic development, and ecological environment pollution in the study area to analyze the actual situation of ReB-C in YRB. Furthermore, it aims to lay a solid foundation for the design of the EIS and related influencing factors for the GUE of ReB-C in YRB.
The YRB is the geographical and ecological area affected by the Yellow River system from its source to the sea (Kouassi et al., 2020; Jian et al., 2022). The mean altitude of the western Heyuan region is over 4000 m, consisting of plenty of high-mountains, with year-round snow covering; The altitude of the central region is loess landform, with serious soil erosion; The east is mainly composed of the Yellow River alluvial plain (Hai-Kun et al., 2020; WangHuang et al., 2021; Zhu et al., 2022). At the symposium on ecological protection in the YRB, General Secretary clarified the extremely important position of the YRB in China’s ecological security. He deeply elucidated the significant significance and made significant deployments to strengthen the governance and protection of the YRB. However, for a long time, there have been problems such as water shortage and soil erosion in the YRB, which would hinder to develop ReB-C. This also determines that there is a significant imbalance in the development level, economic development level, residential environment quality, and ecological environment carrying capacity of ReB-C in the upstream, midstream, and downstream. Thus, 52 resource-based prefecture level cities with fewer missing values and easy data collection were selected as the research objects from 67 prefecture level cities on both sides of the Yellow River. Taking into account regional factors such as macro management, Inner Mongolia Autonomous Region is divided into upstream regions and Henan Province into downstream regions. Figure 1 is the actual division of the YRB.
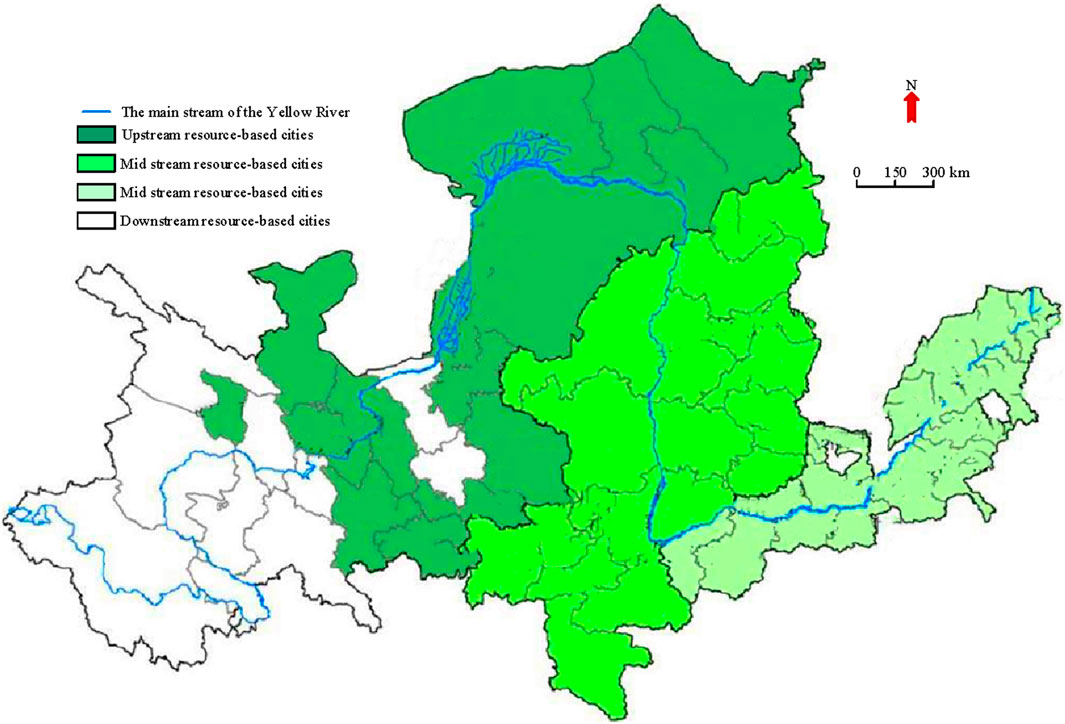
Figure 1. Actual division map of the research area.
The resources collected in this study in YRB are all sourced from the China’s Statistical Yearbook of the provinces where each city is located. Based on these data, the land use status of ReB-C in the YRB is analyzed. Firstly, the evaluation variables of land use structure are determined according to the Urban Land Classification and Planning Construction Land Standard (GB 50137–2011). There are significant differences in terrain, climate, and natural resource distribution among resource cities in the upstream, midstream, and downstream of the Yellow River Basin, which have a significant impact on the land use of resource cities in the Yellow River Basin. Therefore, this study analyzes the land use structure of resource cities in the Yellow River Basin from the upstream, midstream, and downstream perspectives. To ensure the scientific comparison of land use in ReB-C, the study only compared the land use structure of the YRB ReB-C maps from 2016 to 2022 (Table 1).
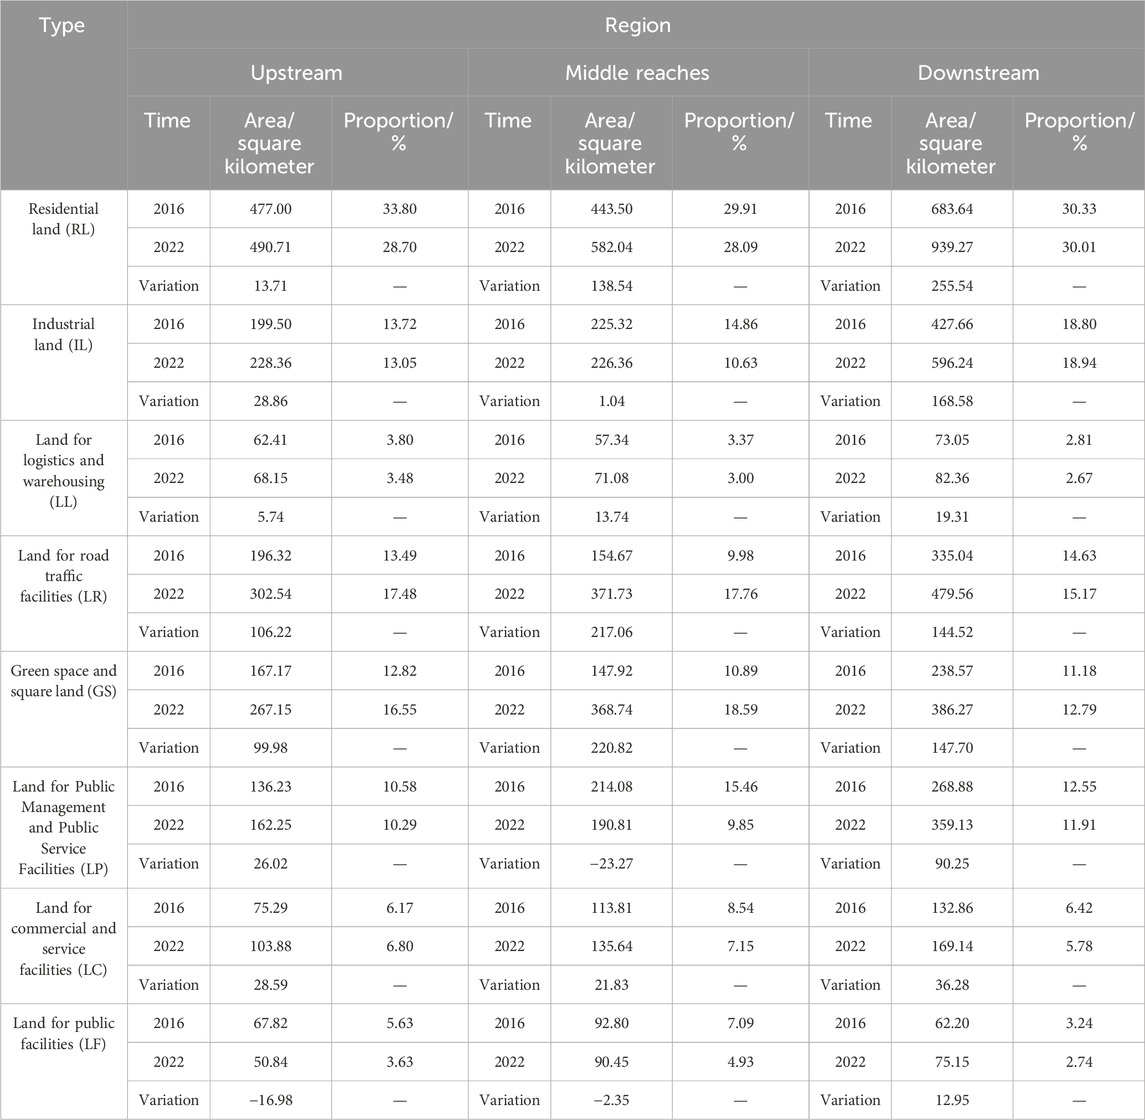
Table 1. Land use structure of regional ReB-C.
In Table 1, from the perspective of land-use changes in upstream, midstream, and downstream ReB-C, the changes in the top three areas from large to small are: LR, FS, and IL; GS, LR, and RL; RL, IL, and GS, respectively. Among them, the area of all downstream land use types has increased. In 2016, the proportion of different types of land use areas in the three sections of the river ranged from high to low: RL, IL, LR, GS, LP, LC, LL, and LF; RL, LP, IL, GS, LR, LC, LL, and LF; RL, IL, LR, LP, GS, LC, LL, and LF. The proportion rankings for 2022 are: RL, LR, GS, IL, LP, LC, LL, and LF; RL, GS, LR, IL, LP, LC, LL, and LF; RL, IL, LR, GS, LP, LC, LL, and LF. From this, upstream cities care more about the construction and expansion of road traffic facilities and green spaces, while the proportion of IL area is relatively high, which will cause significant pressure on the ecological environment. Midstream ReB-C pay more attention to the planning of land space greening and road transportation facilities, but seriously neglect the construction of public service facilities. Compared with ReB-C in the upstream and midstream, the area proportion of RL is higher in the downstream. This indicates that downstream ReB-C are urban agglomeration areas in the YRB, and different types of land use areas are increasing, leading to increased pressure on land use.
Resource oriented cities gather the population of the YRB region. As kinds of activities continue to expand, the necessity for land also increases, which in turn puts significant pressure on land use in the YRB. Table 2 shows the land use status of resource cities in the YRB.
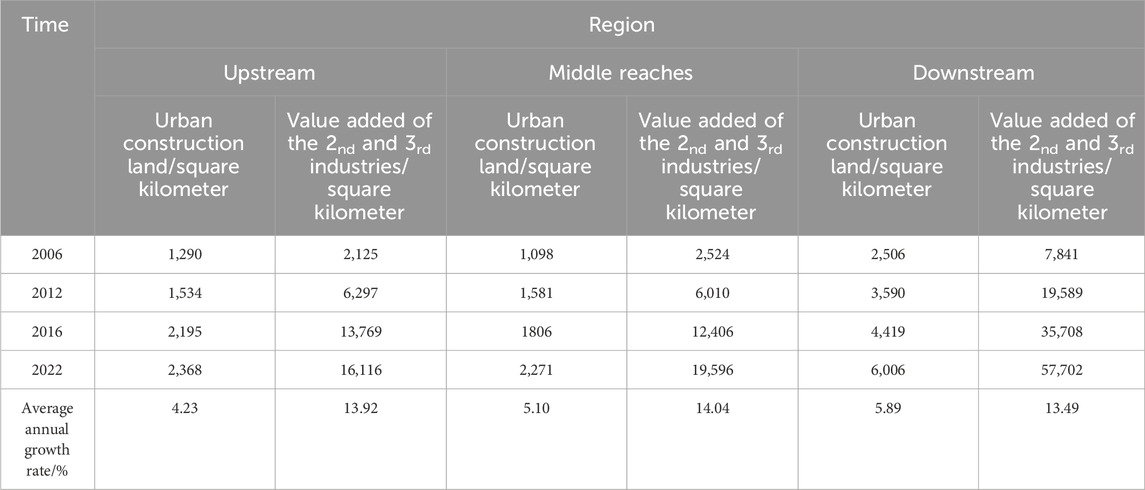
Table 2. Land use status of resource city construction in the YRB.
From Table 2, the construction land area and the added value area of the 2nd and 3rd industries in ReB-C in the YRB are both showing an increasing trend year by year, and the added value area of the 2nd and tertiary industries is higher than the area of urban construction land. This indicates that the economic benefits of the land in the region are extremely significant, with the economic activity intensity of the land ranging from strong to weak in upstream, midstream, and downstream ReB-C. The supply of construction land in upstream ReB-C is relatively small, so there are fewer related resources available for use; The utilization of land in mid stream ReB-C can still be improved; The expansion speed of downstream ReB-C is very fast, but it cannot effectively drive social and economy growth. In addition, the excessive proportion of traditional industries in various resource cities in the YRB will have adverse effects on energy use and ecological environment. Moreover, it also hinders the progress of GLU in cities, but the high-quality development of industries in the region needs to be rapidly promoted. Among the ReB-C in the YRB, the economy has maintained a sustained growth trend, reaching a growth rate of 13% in 2022, with per capita GDP significantly lower than the national level and a poor economic foundation. Previously, the economic growth of the YRB fluctuated greatly, which was affected by natural disasters such as floods and droughts, as well as ecological degradation such as river water interruption and water resource shortage. Therefore, in recent years, the progress of related ecological restoration projects has gradually accelerated, and the economic vigour around the YRB has been restored, ensuring a stable growth trend. In addition, the population of cities around the YRB is relatively dense, and the generation of a large amount of household waste can cause pressure on the ecological environment. Therefore, this project analyzes the pollution situation of the ecological environment of ReB-C in the YRB from the perspectives of production and life. In terms of production, the study observed the growth rate of industrial waste emissions, as listed in Figure 2.
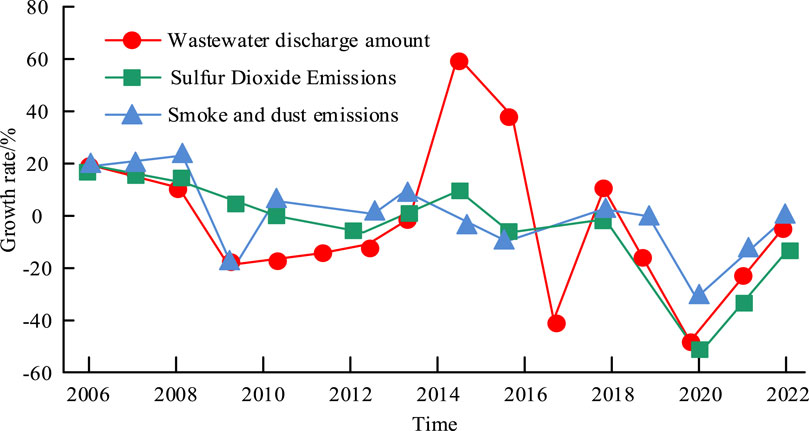
Figure 2. The growth rate of industrial waste emissions from ReB-C in the YRB.
In Figure 2, the fluctuation characteristics of industrial waste emissions in the Yellow River Basin show a continuous downward trend, with negative growth rates in many years. This indicates that the policies and implementation of pollutant control and ecological environment protection in the Yellow River Basin have achieved excellent results. At the same time, the growth rate of emissions of the three pollutants tends to be consistent, which may be due to the neglect of the impact of industrial development on ecological security in the Yellow River Basin, resulting in excessive discharge of industrial waste. From this, there is still a contradiction in the YRB. But with the implementation of relevant policies and work, this contradiction is gradually being improved (Radovanovic et al., 2019; Barma and Modibbo, 2022; Khan et al., 2022). In terms of daily life, the study uses the treatment of pollutants in ReB-C in the YRB to represent the quality of urban ecological environment pollution control, as displayed in Table 3.
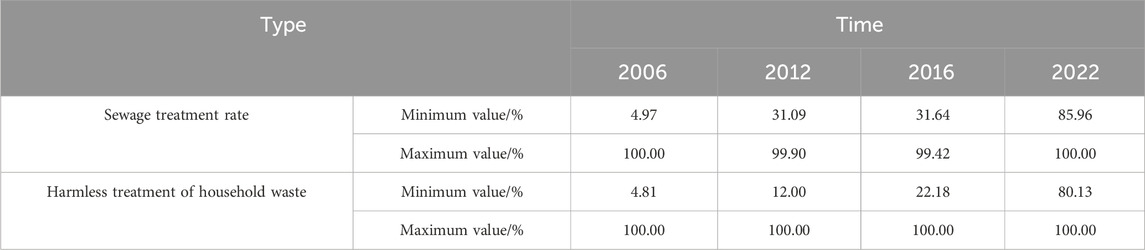
Table 3. Treatment of pollutants in ReB-C in the YRB.
As the years increase in Figure 6, ReB-C in the YRB have significantly improved their treatment of sewage and household waste, thereby significantly reducing the adverse impact of urban sewage and household waste on the ecological environment. In urban sewage treatment, the minimum treatment rate was 4.37% in 2006 and 85.96% in 2022, an increase of 94.92%. In the harmless treatment of urban household waste, the minimum was 4.81% in 2006 and 80.13% in 2022, an increase of 94.00%. Their maximum processing rates are all 100%. Although the treatment level of domestic pollutants has been significantly improved, there are significant differences in the treatment capacity among different ReB-C in the YRB, and excellent treatment plans can be learned through exchange.
This study analyzes the actual situation of ReB-C in the YRB and obtains the internal logic between the construction and development of ReB-C and the efficiency of GLU, that is, changing the extensive use of urban land. Realizing the green utilization of urban land is necessary for developing high-quality ReB-C, as well as an inherent requirement for ecological civilization construction and a guarantee for improving social welfare. High quality cities and ecological civilization will also have an inactive impact on improving GLU, thereby achieving sustainable use of land resources. The research is guided by sustainable development and green utilization, so a land GUE EIS for ReB-C in the YRB has been designed. The content is displayed in Figure 3.
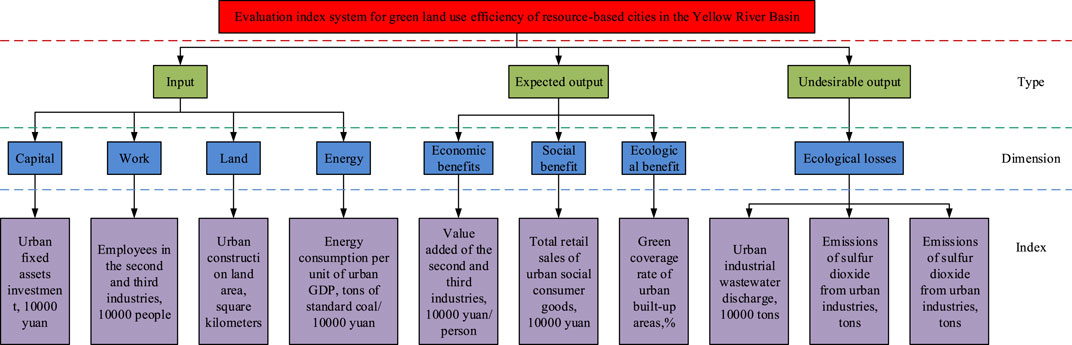
Figure 3. EIS for GLU-E of ReB-C in the YRB
In Figure 3, due to the increasing impact of energy on the ecological environment and social economy, the energy consumption dimension has been added to the input indicators based on the traditional dimension; Furthermore, because the fact that ReB-C not only generate benefits in land use, but also cause losses to the ecological environment due to household waste and pollutants, two output indicators have been designed: expected output and unexpected output. To study the GUE of ReB-C in YRB and analyze the corresponding SE, the study first constructs the Unexpected Output Exceeding Efficiency SBM (UOEES). The UOEES model can not only avoid deviations caused by radial and angular measurements, but also consider the impact of unexpected output factors in the production process. Assuming each city is a decision-making unit, the decision-making unit numbers in the production system are
In Eq. 1,
In Eq. 3,
The larger the value of
In Eq. 5,
In Eq. 6,
In global autocorrelation analysis,
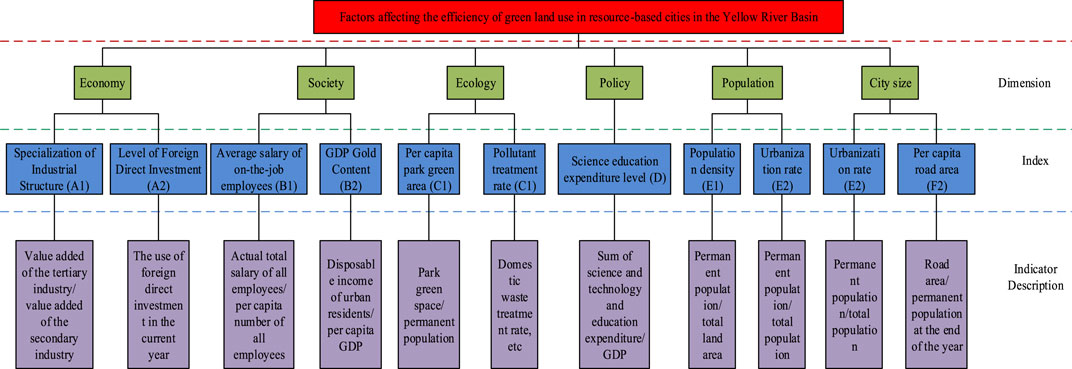
Figure 4. Specific content of factors affecting the efficiency of GLU in ReB-C in the YRB.
In Figure 4, a total of 11 indicators were selected from six dimensions to verify the influencing factors of land green use efficiency in ReB-C in the YRB. Firstly, in order to incorporate the spatial effects of variables into the regression equation, it is necessary to establish a spatial weight matrix through certain standards during the actual model construction process, while also reducing errors and ensuring the scientificity of the results. Therefore, it is necessary to study the use of adjacency space matrix weights for analysis. Secondly, the existence of spatial dependencies in data is a prerequisite for determining the use of spatial econometric models, and the use of Moran’s index to determine the degree of spatial correlation is studied. Finally, construct the required spatial demand panel regression model, which includes Spatial Lag Model (SLM), Spatial Error Model (SEM), and Spatial Durbin Model (SDM). The expression of the SDM model is Eq. 8.
In Eq. 8,
To explain the spatial heterogeneity among ReB-C in the YRB, the factor detector that can analyze the spatial stratification consistency is selected for testing. The expression is Formula (10).
In Eq. 10,
The study aims to explore the SE of land GUE in ReB-C in the YRB under the background of sustainable development. This chapter first analyzes the evolution results of ReB-C in the YRB in terms of time and space, and then qualitatively analyzes the relevant influencing factors that may affect the GLU ratio of ReB-C built on this. Finally, targeted improvement strategies were proposed.
The SE characteristics of land GUE in ReB-C in the YRB need to be obtained. The study first used software Eviews to acquire the kernel density curves of relevant data for 2006, 2012, 2016, and 2022. The temporal evolution of land GUE in ReB-C as a whole, upstream, midstream, and downstream can be expressed.
Figure 5 shows the temporal evolution of land GUE in ReB-C in the YRB. Figure 5A shows the overall temporal evolution of the Yellow River Basin, which shows the rapid increase to slow climb of the green land use efficiency of cities in the Yellow River Basin. At the same time, the shape of the main peak of the curve can reflect the proportion of high-value areas and low value areas. Among them, the difference in land green use efficiency in the Yellow River Basin at different periods is very obvious, and the polarization feature is more obvious. The proportion of high-value areas shows a slow increasing dynamic evolution feature. Figure 5B–D show the temporal evolution curves of land green use efficiency of resource-based cities in the upstream, midstream, and downstream Yellow River Basin, respectively. The upstream resource-based cities show a trend of first decreasing, then increasing, and then decreasing, the midstream cities show a trend of first increasing and then decreasing, and the downstream cities show a trend of first increasing, then decreasing, and then height increasing. In addition, the number and shape changes of the peaks in its variation curve are consistent with the overall trend of the YRB. In summary, the time period and location characteristics jointly determine the temporal characteristics of GLU-E in ReB-C in different regions of the YRB.
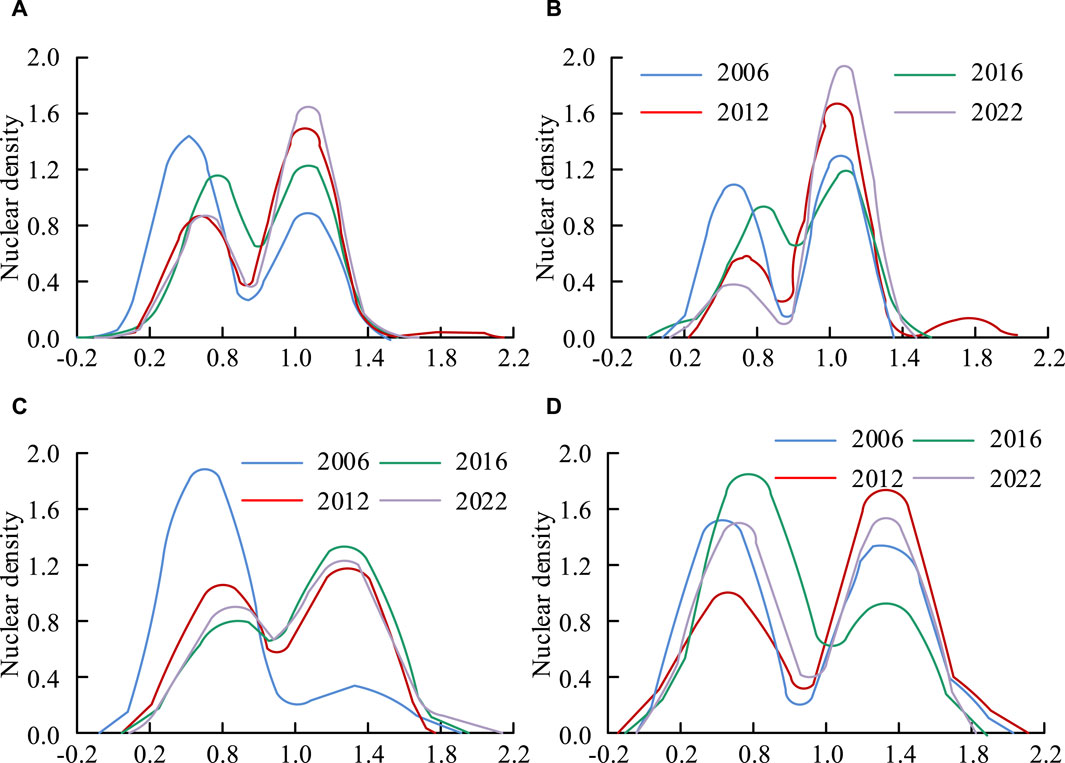
Figure 5. Time series evolution results of land GUE in ReB-C in the YRB. (A) Yellow River Basin, (B) Upstream, (C) Mid stream and (D) Downstream.
To explore the SE characteristics of land GUE in ReB-C in the YRB, the software GeoDa was used for analysis. The global Moran index (GMI) numerical results are exhibited in Table 4. It shows a significant positive correlation in spatial distribution among different years. It indicates that in terms of spatial characteristics of land green use efficiency, adjacent cities in the geographical location of ReB-C in the YRB will interact with each other. The GMI can only verify the spatial-correlation of land GUE in ReB-C in the YRB from a holistic perspective, but cannot identify the spatial clustering of local spaces. Therefore, the study utilizes ArcGIS software to conduct local spatial auto-correlation testing in the YRB.
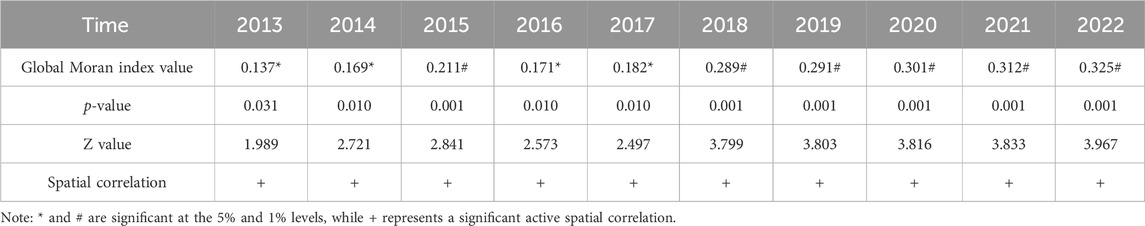
Table 4. Global moran index values of land GUE in ReB-C in the YRB.
Figure 6 shows the local agglomeration type results of land GUE in ReB-C in the YRB under different years. Figure 6A–D show the local agglomeration types of land green use efficiency in resource-based cities in the Yellow River Basin in 2006, 2012, 2016, and 2022, respectively. From Figure 6A, D, it can be seen that the HH type was mainly distributed in resource-based cities in the upper and lower reaches of the Yellow River in 2006, and in 2022, it was mainly distributed in resource-based cities in the upper and middle reaches. According to Figure 6A–D, it can be seen that the HL type is located in upstream resource-based cities in different years, and a small amount is also relatively stable in resource-based cities in the middle reaches of Shanxi Province, with a slow increase in the number of distribution in downstream areas. The LL type is mainly distributed in resource-based cities in the middle reaches, and its quantity continues to increase with the growth of the year. LH type is mainly distributed in resource-based cities in the upstream and midstream, and is relatively stable. Overall, the green land use efficiency of cities in Inner Mongolia Autonomous Region and Gansu Province in the upper reaches of the Yellow River shows two types: HH type and HL type, while Ningxia Hui Autonomous Region and Qinghai show LH type, midstream cities show LL type, and downstream cities mainly show LL type and HL type.
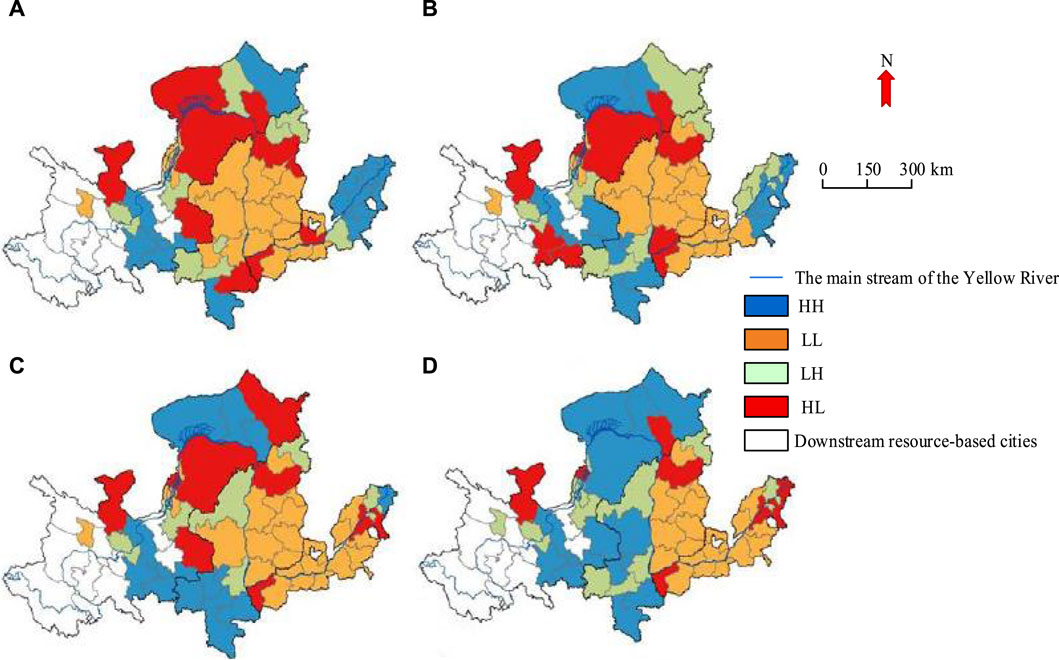
Figure 6. Local agglomeration types of land GUE in ReB-C of the YRB in different years. (A) 2006, (B) 2012, (C) 2016 and (D) 2022.
To test the affecting factors of GLU-E of ReB-C in the YRB, it is necessary to exclude the influence of collinearity among variables on the regression results. Firstly, it is important to make sure the connection between variables based on the VIF.
Table 5 shows the test results of multicollinearity among different variables, and the max VIF value in the variables is 9.76, which is less than 10, indicating that the variables are relatively independent from each other and there is no serious collinearity relationship. Therefore, subsequent factor tests can be conducted. The GLU-E of ReB-C in the YRB and their SE owns an active correlation. Hence, the model chosen in the study is suitable for testing the influencing factors of land green use efficiency in ReB-C in the YRB, but a suitable model needs to be selected.
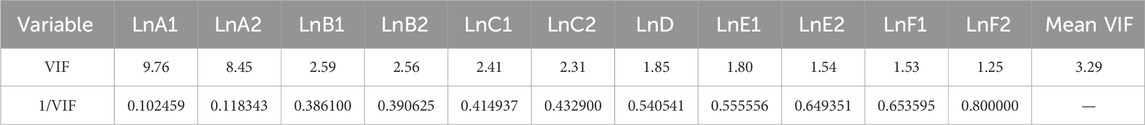
Table 5. Test results of multicollinearity among different variables.
Above is the test details. From Table 6, only Robust LM spatial lag did not pass the LM test, while the rest were significant at the 1% level. Therefore, SLM is more suitable than SEM. then, based on the Hausman test results, it is more appropriate to choose a time and space dual fixed effect model. Finally, according to the test results of LR and Wald, both are at the 1% level, indicating that SDE cannot degenerate into SLM or SEM.
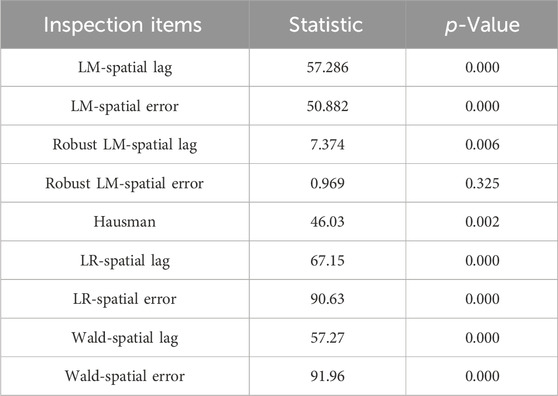
Table 6. Test results of models under different tests.
To increase the reliability of the test results, the OLS was introduced for comparison (Table 7). From Table 7, the sign of the variable is close to the value of the regression coefficient, indicating the credible regression result. SDM is the best through the natural logarithm function value and R2 value. Through the regression analysis of the SDM, A1 and A2 economic dimensions show a negative and positive correlation with the GLU-E of ReB-C in the YRB, respectively; A2 is inactively correlated with the efficiency of GLU in surrounding cities. B1 in the social dimension and E1 and E2 in the population dimension are negatively correlated with the GLU-E of ReB-C in the YRB, and positively correlated with the GLU-E of surrounding cities. B2 is not related to the GLU-E of ReB-C in the YRB. In the ecological dimension, both C1 and C2 are positively correlated with the land GUE of ReB-C and surrounding cities in the YRB. The indicators in the policy dimension are positively correlated with the GLU-E of ReB-C in the YRB, and inactively correlated with the GLU-E of surrounding cities. In the dimension of urban scale, there is a negative correlation between F1 and the GLU-E of ReB-C in the YRB and surrounding cities, while F2 has no significant relationship with ReB-C in the YRB. To further investigate the sensitivity of the 9 influencing factors mentioned above, the study first used KMO values and Bartlett sphericity tests.
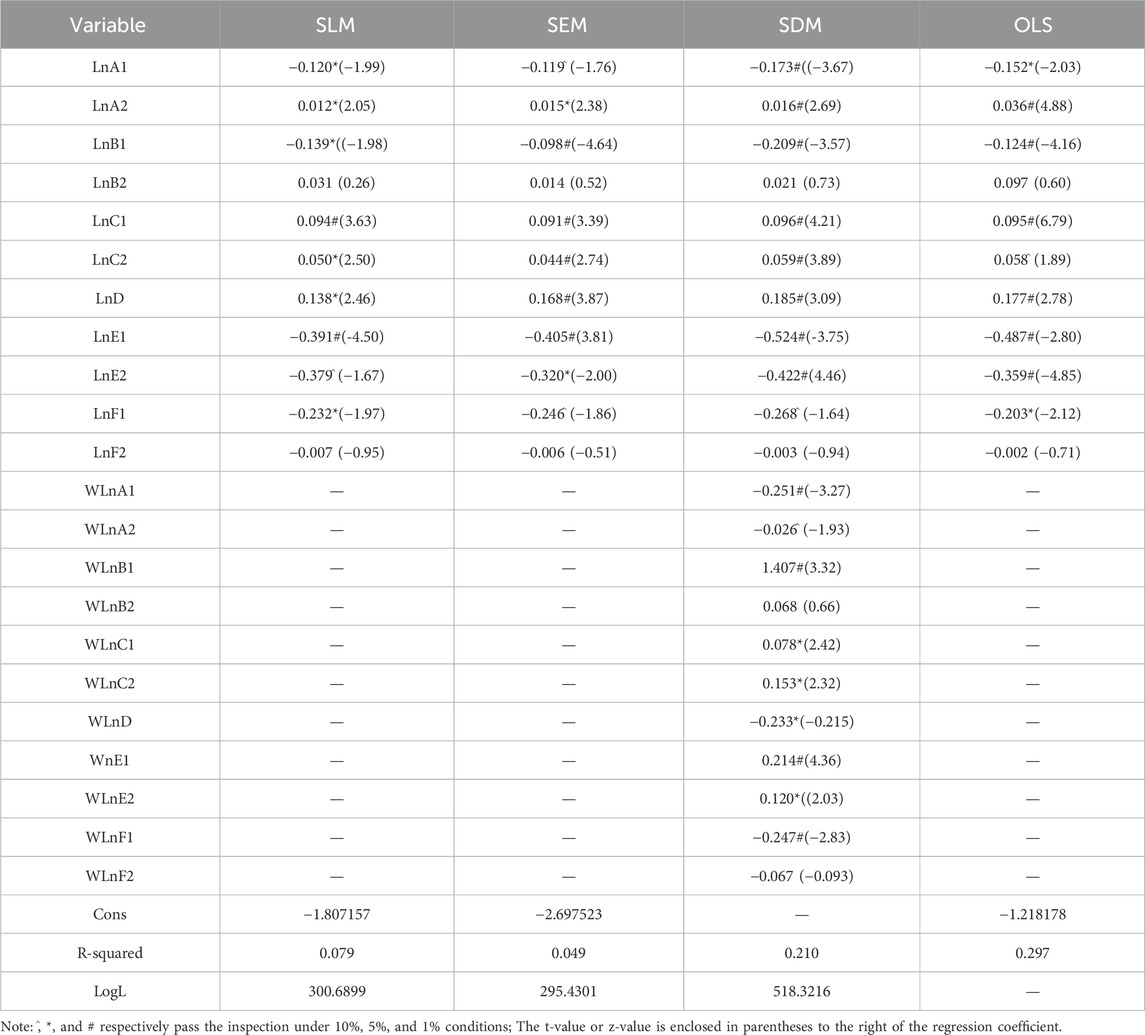
Table 7. Test results of GLU-E in ReB-C in the YRB under different test models.
The KMO value and Bartlett’s sphericity test results are shown in Table 8. It can be seen that the KMO value is 0.842, indicating that the selected influencing factors are very suitable for analysis. The Bartlett’s sphericity test result is 0.000, indicating that the 9 influencing factors meet the requirements for subsequent sensitivity analysis and can be used for principal component analysis. In principal component extraction, all components with eigenvalues exceeding 1 are first used as principal components, and then the correlation between factors and principal components is determined through principal load coefficients.

Table 8. KMO value and Bartlett sphericity test results.
The results of the principal component load matrix are shown in Table 9. From this, it can be seen that Principal Component 1 basically reflects the information of A1 and A2, so it can be regarded as a comprehensive indicator of the economy of resource-based cities. Principal Component 2 basically reflects the information of B1, so it can be regarded as a comprehensive indicator of the society of resource-based cities. Principal Component 3 reflects the information of C1 and C2, which can be regarded as a comprehensive indicator of the ecology of resource-based cities. Principal Components 4, 5, and 6 respectively reflect the information of D, E1, E2, and F1, so they can be regarded as comprehensive indicators corresponding to the policy, population, and urban size of resource-based cities, respectively. By using a linear combination coefficient matrix, the relationship between principal components and influencing factors can be constructed, and principal component scores can be obtained. Finally, the weights and sensitivity ranking of different influencing factors can be obtained.
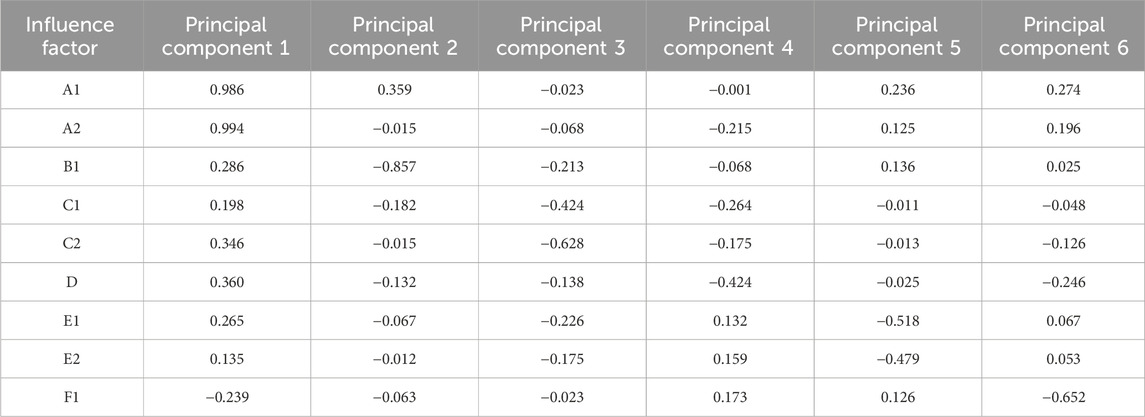
Table 9. Principal component load matrix.
The weight and sensitivity ranking results of different influencing factors are shown in Table 10. It can be seen that the main factors affecting the green land use efficiency of resource-based cities are A2, B1, and A1, with sensitivity ranking from 1st to 3rd, and corresponding weights of 0.1200, 0.1161, and 0.1145, respectively. The weights of other influencing factors are as follows: C2, C1, D, E2, F1, and E1 are 0.1123, 0.1030, 0.1071, 0.1066, 0.1103, and 0.1101, respectively, with sensitivity ranking corresponding to 4th to 9th.
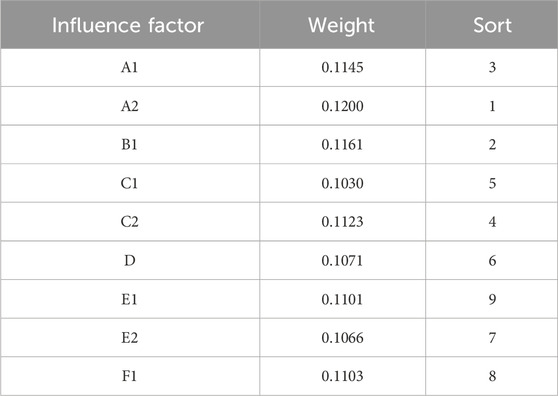
Table 10. The weight and sensitivity ranking results of different influencing factors.
To further explore the differences and changes on the GLU-E of ReB-C in different regions of the YRB, nine significant influencing factors A1, A2, B1, C1, C2, D, E1, E2, and F1 were selected through ArcGIS. After discretization processing, the overall ranking of the impact on GLU-E of ReB-C in the YRB in different years is available (Figure 7). As shown in Figure 7, with the growth of years, the land GUE of ReB-C in the YRB is not only limited to the degree of economic development, but also determined by population factors and scientific education level. And the urbanization rate impact on the GLU-E of ReB-C varies at different time periods. During the period from 2006 to 2012, the urban population increased significantly, providing sufficient labor while also exceeding the threshold of land carrying capacity, with negative effects dominating. From 2016 to 2022, relevant decision-makers alleviated the pressure brought by urbanization level through targeted governance, and industrial spatial planning gradually improved. However, problems such as resource-wasting and environmental pollution have adverse effects on the efficiency of GLU in ReB-C.
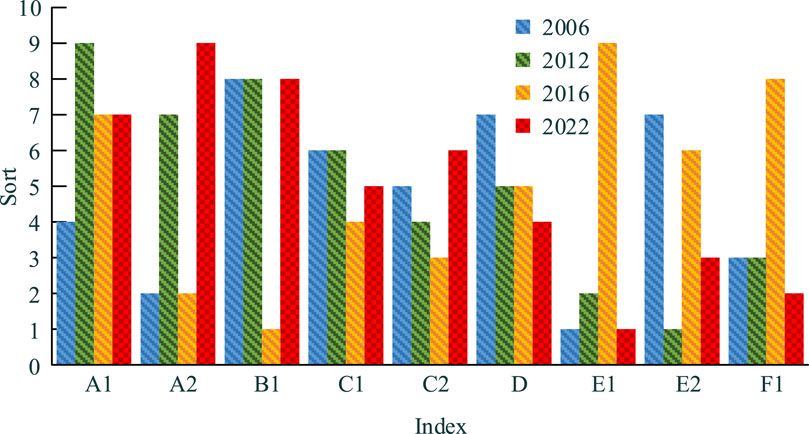
Figure 7. Ranking of the overall impact of GLU-E in ReB-C in the YRB from different years.
Figure 8 shows the ranking results. Figure 8A shows the changes in the impact of green land use efficiency in resource-based cities in the upper reaches of the Yellow River Basin. In 2022, the
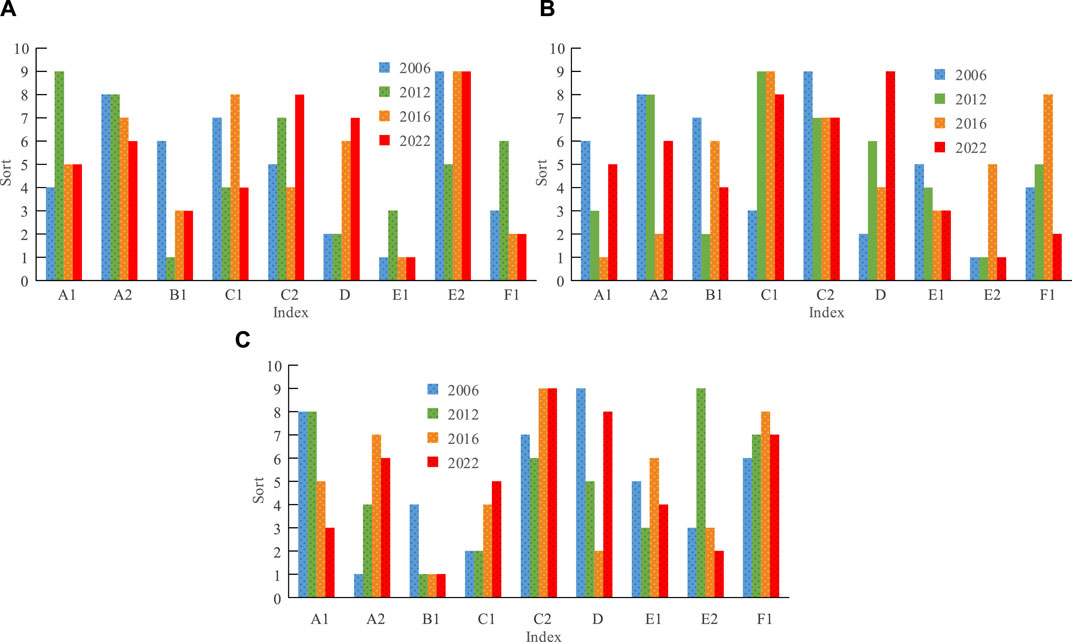
Figure 8. Ranking of the effects of different geographical positions on land GUE of ReB-C in the YRB. (A) Upstream resource-based cities, (B) Mid stream resource-based cities and (C) Downstream resource-based cities.
With the application of sustainable development strategies and green life concepts, the GLU-E in ReB-C has a promoting effect on the sustainable use of land in the YRB. It can also ensure the overall development and eco-protection in ReB-C. Based on a multidisciplinary approach and considering the actual situation of ReB-C in the YRB, a land GUE EIS was designed for ReB-C. The purpose is to improve the GLU-E in ReB-C in the YRB and promote developing that different dimension of the YRB. From the aspect of spatial pattern evolution, the YRB in general is positive. During the period from 2006 to 2022, the number of HH type ReB-C in the upstream increased by nearly 25%, with LH type ReB-C accounting for nearly 3%, and LL type ReB-C decreasing to 0. The midstream ReB-C are mainly scattered among LL type, while downstream ReB-C have evolved from HH type to HL type and LL type. In the DM model testing, factors such as D and E1 are key factors affecting the GLU-E of ReB-C in the YRB, while the impact of economic indicators gradually decreases. In summary, the interdisciplinary research method proposed in the study can promote the sustainable development of the Yellow River Basin, maintain local ecological security, and improve quality development, which has significant implications for improving regional coordination and green development. However, the research still has limitations, mainly in the following two aspects. On the one hand, during the data collection process, due to missing data, using data processing methods to complete may inevitably lead to potential biases; Simultaneously studying voluntary cities in the Yellow River Basin may limit their applicability to other regions. On the other hand, the study only analyzes the significant differences that affect the GUE of land in ReB-C, and the selected influencing factor indicators may lack representativeness. Thus, in future research, more objective methods can be found to optimize the indicator system and expand the selection of relevant influencing factors.
The original contributions presented in the study are included in the article/supplementary material, further inquiries can be directed to the corresponding author.
YL: Investigation, Supervision, Writing–review and editing. DY: Investigation, Writing–original draft. XZ: Investigation, Writing–original draft.
The author(s) declare that financial support was received for the research, authorship, and/or publication of this article. The research is supported by Ministry of Education research on humanities and social sciences, Research on Knowledge, Power and Spatial Justice in Urban Street Transformation, (No. 17YJC810002).
The authors declare that the research was conducted in the absence of any commercial or financial relationships that could be construed as a potential conflict of interest.
All claims expressed in this article are solely those of the authors and do not necessarily represent those of their affiliated organizations, or those of the publisher, the editors and the reviewers. Any product that may be evaluated in this article, or claim that may be made by its manufacturer, is not guaranteed or endorsed by the publisher.
Alekseeva, N. A. (2020). Assessment of the impact of the organizational and legal status of land on the efficiency of land use in agricultural production cooperatives. Bull. Udmurt Univ. Ser. Econ. Law 30 (1), 7–12. doi:10.35634/2412-9593-2020-30-1-7-12
Barma, M., and Modibbo, U. M. (2022). Multiobjective mathematical optimization model for municipal solid waste management with economic analysis of reuse/recycling recovered waste materials. J. Comput. Cognitive Eng. 1 (3), 122–137. doi:10.47852/bonviewJCCE149145
Chuqiao, Y. U., Zhu, S., Li, L. I., Wu, G., and Guo, H. (2022). Spatio-temporal evolution of landscape pattern and habitat quality in yunnan province. Asian Agric. Res. 14 (10), 7–13. doi:10.19601/j.cnki.issn1943-9903.2022.10.003
Duan, Y. Q., Fan, X. Y., Liu, J. C., and Hou, Q. H. (2020). Operating efficiency-based data mining on intensive land use in smart city. IEEE Access 8, 17253–17262. doi:10.1109/ACCESS.2020.2967437
Fan, Y., Shi, X., Feng, X., and Song, Z. (2022). Livelihood vulnerability and its influencing factors of farmers in dryland area of Yellow River Basin. Acta Ecol. Sin. 42 (8), 3133–3143. doi:10.5846/stxb202105261378
Hai-Kun, L. I., Liu, Y., Chun-Hua, L. I., Wang, Y. W., and Rui-Hai, Y. U. (2020). Study on 6-DMAP induced triploid of Crassostrea ariakensis from Huanghe River estuary. Oceanol. Limnologia Sinica 51 (5), 1194–1202. doi:10.11693/hyhz20191200259
Hung, B., Hao, Q., Thanh, N., Lin, N., Long, L., and Zhang, M. (2020). Efficiency assessment of land use types in tan binh Commune,Dak doa District,Gia lai Province,Vietnam. Asian Agric. Res. 12 (10), 29–34. doi:10.19601/j.cnki.issn1943-9903.2020.10.010
Jia L, L., Yu, K., Li, Z., Li, P., Xu, G., Cheng, Y., et al. (2022). The effect of meteorological drought on vegetation cover in the Yellow River basin, China. Int. J. Climatol. A J. R. Meteorological Soc. 42 (9), 4830–4849. doi:10.1002/joc.7506
Jian, Q., Zhu, S. T. S., and Cai-Hong, H. U. (2022). Integrating potential distribution of dominant vegetation and land use into ecological restoration in the Yellow River Basin,China. J. Mt. Sci. 19 (10), 2886–2904. doi:10.1007/s11629-021-6966-1
Khan, R., Ullah, K., Pamucar, D., and Bari, M. (2022). Performance measure using a multi-attribute decision-making approach based on complex T-spherical fuzzy power aggregation operators. J. Comput. Cognitive Eng. 1 (3), 138–146. doi:10.47852/bonviewJCCE696205514
Kouassi, K. H., Konan-Waidhe, A. B., Yao, A. B., Koffi, B., and Kadjo, E. D. (2020). Simulation of the dynamics of land cover and land use in the lobo river watershed upstream of Nibéhibé (Center-West of Côte d’Ivoire). J. Geogr. Inf. Syst. 12 (5), 519–530. doi:10.4236/jgis.2020.125030
Liu F, F., and Xu, E. (2020). Comparison of spatial-temporal evolution of habitat quality between Xinjiang Corps and Non-corps Region based on land use. Ying yong sheng tai xue bao = J. Appl. Ecol. 31 (7), 2341–2351. doi:10.13287/j.1001-9332.202007.014
Ning, Y., Liu Y, Y., Yaqian, D. U. J. Y., and Wang, Y. (2022). Sustainable development assessment of the Yellow River Basin and the coordinated development strategy. Acta Ecol. Sin. 42 (3), 990–1001. doi:10.5846/stxb202012293308
Qian F, F., Chi, Y., and Lal, R. (2020). Spatiotemporal characteristics analysis of multifunctional cultivated land: a case-study in Shenyang, Northeast China. Land Degrad. Dev. 31 (14), 1812–1822. doi:10.1002/ldr.3576
Radovanovic, M., Nanopoulos, A., and Ivanovic, M. (2019). Reverse nearest neighbors in unsupervised distance-based outlier detection. IEEE Trans. Knowl. Data Eng. 27 (5), 1369–1382. doi:10.1109/TKDE.2014.2365790
Ramos, M. J., Gastauer, S., Mitre, C. K., Caldeira, J. F., Silva, A. R., Furtini, E., et al. (2020). Plant growth and nutrient use efficiency of two native Fabaceae species for mineland revegetation in the eastern Amazon. J. For. Res. 31 (6), 2287–2293. doi:10.1007/s11676-019-01004-w
Rathore, S. S., Shekhawat, K., and Rajanna, G. A. (2020). Land configurations in surface drip irrigation for enhancing productivity, profitability and water-use efficiency of Indian mustard (Brassica juncea) under semi-arid conditions. Indian J. Agric. Sci. 90 (8), 1538–1543. doi:10.56093/ijas.v90i8.105960
Song, K., Fang, C., Jacinthe, P. A., Wen, Z., Xu, G. L. X., Shang, Y., et al. (2021). Climatic versus anthropogenic controls of decadal trends (1983–2017) in algal blooms in lakes and reservoirs across China. Environ. Sci. Technol. 55 (5), 2929–2938. doi:10.1021/acs.est.0c06480
WangHuang, H. S., Di, D., Wang, Y., and Zhang, F. (2021). Study on the spatial distribution of water resource value in the agricultural system of the Yellow River Basin. Water Policy 51 (5), 1044–1058. doi:10.2166/WP.2021.176
Wu, Y., Zhang, P., and Li, J. (2022). The spatio-temporal evolution characteristics and improvement paths of farmland utilization efficiency in the Yangtze River economic belt. Res. Agric. Mod. 42 (4), 579–588. doi:10.19601/j.cnki.issn1943-9903.2022.10.003
Zhang, J. H., Ramke, J., Jan, C., Bascaran, C., Mwangi, N., Furtado, J. M., et al. (2022). Advancing the Sustainable Development Goals through improving eye health: a scoping review. Lancet. Planet. health 6 (3), e270–e280. doi:10.1016/S2542-5196(21)00351-X
Zheng H, H., Lin, W., and Cheng, Z. (2021). Influencing factors of regional tourism eco-efficiency under the background of green development in the western China. Acta Ecol. Sin. 41 (9), 3512–3524. doi:10.5846/stxb202002140253
Keywords: sustainable development, the yellow river basin, resource oriented cities, land green utilization efficiency, spatiotemporal evolution
Citation: Li Y, Yu D and Zhang X (2024) The spatiotemporal evolution and impact of green land use efficiency in resource-based cities in the yellow river basin under the background of sustainable development. Front. Environ. Sci. 12:1406460. doi: 10.3389/fenvs.2024.1406460
Received: 25 March 2024; Accepted: 22 April 2024;
Published: 24 May 2024.
Edited by:
Sérgio António Neves Lousada, University of Madeira, PortugalReviewed by:
Grzegorz Straż, Rzeszów University of Technology, PolandCopyright © 2024 Li, Yu and Zhang. This is an open-access article distributed under the terms of the Creative Commons Attribution License (CC BY). The use, distribution or reproduction in other forums is permitted, provided the original author(s) and the copyright owner(s) are credited and that the original publication in this journal is cited, in accordance with accepted academic practice. No use, distribution or reproduction is permitted which does not comply with these terms.
*Correspondence: Yuzhuo Li, bGl5dXpodW8yMDI0QDE2My5jb20=
Disclaimer: All claims expressed in this article are solely those of the authors and do not necessarily represent those of their affiliated organizations, or those of the publisher, the editors and the reviewers. Any product that may be evaluated in this article or claim that may be made by its manufacturer is not guaranteed or endorsed by the publisher.
Research integrity at Frontiers
Learn more about the work of our research integrity team to safeguard the quality of each article we publish.