 Yuqing Li
 Shuwen Yang1,2*
 Yawen Luo
- 1Faculty of Geomatics, Lanzhou Jiaotong University, Lanzhou, China
- 2National-Local Joint Engineering Research Center for Application of Technologies and Applications for National Geographic State Monitoring, Lanzhou, China
- 3Faculty of Architecture and Urban Planning, Lanzhou, China
Introduction: Highly clustered color steel buildings (CSB) have become new impervious surfaces and heat island areas in cities due to their materials, especially in the Northwest. However, the extent of the influence of CSB on land surface temperature (LST) and how they are quantitatively related to each other have not been explored.
Methods: Therefore, this paper takes Urumqi city, which is densely populated with CSB and has a unique topography, as an example. We obtained LST data and CSB data based on Landsat and Google Earth images, and quantitatively analyzed the warming effect of the CSB on the urban LST and the characteristics of regional variability.
Results and discussion: The results of the study showed that from 2005 to 2020, the scale of CSB in Urumqi City has been expanding, with high-density aggregation shifting from urban areas to the suburbs. The urban area of Urumqi city shows a “cool island effect”, with higher temperatures in CSB. The high-density distribution of CSB roughly coincides with the high temperature areas of the city. The density of CSB is highly positively correlated with LST, with the correlation coefficient reaching 0.973 in 2010. For every 0.2 increase in cluster density, the corresponding temperature can rise by 0.4°C. At the same density of aggregation, the average temperature of urban CSB is lower than that in the suburbs. The contribution index of suburban CSB to LST reaches 0.512, significantly higher than the surrounding other buildings, marked it one of the main contributors to the thermal environment in the suburbs.The research results can provide a reference and data support for the sustainable development and planning of cities.
1 Introduction
The increasing areas of impervious surfaces in cities accelerate the rise of localized land surface temperature (LST) in cities (Liu et al., 2023), which negatively affects the comfort and health of urban residents and significantly impacts energy demand, air quality, and overall environmental sustainability (Guo et al., 2020; Fuladlu and Altan, 2021; Chen Y. et al., 2023; Tabatabaei and Fayaz, 2023). Color-coated steel sheets are steel sheets with organic coatings, consisting of a filler material sandwiched between two color-coated steel layers. The substrates of color-coated steel sheets include cold-rolled substrate, hot-dip galvanized substrate, and electro-galvanized substrate. Color steel buildings (CSB) have been used on a large scale in urban villages and industrial parks because of their low cost and fast construction (Yang S. et al., 2018; Wang et al., 2019). The highly aggregated CSB have become the new impervious surfaces and heat sources in cities. Among commonly used building materials, asphalt has a specific heat capacity of 1.55 kJ/(kg·K) and a thermal conductivity of 0.093 W/(m·K), while structural steel has a specific heat capacity of 0.48 kJ/(kg·K) and a thermal conductivity of 58.2 W/(m·K), and cement mortar has a specific heat capacity of 1.05 kJ/(kg·K) and a thermal conductivity of 0.93 W/(m·K). A higher specific heat capacity and lower thermal conductivity result in slower temperature increases. Therefore, in hot summers under sunlight, CSB heat up faster compared to cement buildings and asphalt roads, leading to prolonged high temperatures and contributing to the “heat island effect”. It is essential to study the influence of the CSB on the LST to improve the urban thermal environment and the development planning of industrial parks.
The surface temperatures reflected by different media of urban impervious surfaces vary (Yuan et al., 2018), different land cover types exhibit varying thermal responses to LST (Fuladlu, 2022; Patle and Ghuge, 2024). The area changes of impervious surface can reflect the spatial and temporal processes of urban heat islands (Hua et al., 2020) and can be used as an indicator to quantify the urban surface heat island (Coseo and Larsen, 2019; Shi et al., 2023). Among the various types of impervious surfaces that contribute to urban heat islands, urban buildings are one of the most significant influencing factors (Yang J. et al., 2018), and many studies focus on the relationship between LST and buildings (Hasan et al., 2023). The orientation and height-to-distance ratio of buildings were used to assess the suitability of the living environment (Salehi and Nasrollahi, 2024). Differences in building geometry and surface materials produce different thermal patterns (Nichol, 1996). For example, the absorption of solar radiant energy by roofs leads to a higher urban LST than that of ambient air (Rani et al., 2018). In contrast, using reflective (cold) surfaces on roofs with increased surface albedo can significantly reduce LST (Tahooni et al., 2023). Moreover, the effects of building height and density on the thermal environment are also a research hotspot (Yang and Li, 2015; Li et al., 2022; Wang Z. et al., 2023). Studies have shown that lower building densities improve ground-level heat dissipation, whereas higher building densities improve roof-side heat dissipation. In comparison, a higher building density improved the heat dissipation on the roof surface (Yang et al., 2021a). Due to the materials, CSB have a more pronounced impact on environmental temperatures than other buildings.
Existing studies on the relationship between urban buildings and heat islands are mostly carried out from the aspects of building materials, geometric shapes, building density, and building height (Song et al., 2020; Yang et al., 2021b; Wang and Xu, 2021; Zhu et al., 2021; Luo et al., 2023). All of them are based on the overall urban buildings as the research object. Minimal studies are focusing on the influence of a typical functional building on the urban heat island effect. At the same time, most of the current research on CSB revolves around CSB extraction, fire accident analysis, coating materials and other aspects (Sun et al., 2020; Hou et al., 2021; Samat et al., 2022; Wang W. et al., 2023). While the research on the impact of CSB in shaping the urban microclimate environment is very limited. Zhang et al. (2022) initially explored the response of the CSB to the urban heat island. Analyzing the entire study area at the urban scale tends to underestimate the variations in local temperature differences (Wang and Ouyang, 2017). Therefore, existing research lacks fine-scale, small-scale studies, leading to insufficient exploration of local temperature heterogeneity.
In summary, this paper aims to study the correlation between CSB and LST, and further analyze the differences in the influence of CSB on LST at a regional scale. The impact of the density of CSB on the LST is investigated with Pearson’s correlation coefficient, regression analysis, the contribution index, and other methods. The LST was extracted by Landsat image, combined with the data of CSB. We explored the degree of temperature increase of CSB in different regions and the heterogeneity of the contribution of CSB, and other landscape types to the LST at a fine scale. The results can provide a reference basis for the development of urbanization and urban planning.
2 Study area and data
2.1 Study area
Urumqi (86°37′33″E−88°58′24″, 42°45′32″N-45°00′00″N) is located in the hinterland of the Asian-European continent (Chen B. et al., 2023). The city is surrounded by mountains on three sides, with a high relief in the southeast and a low relief in the northwest. It is with a temperate continental arid climate with long winter and summer seasons. The temperature difference between day and night is significant (Xing et al., 2022). The topography of the urban area slopes from southeast to northwest, with an average elevation of 800 m and a drop of 300–400 m (Ayitikan et al., 2023). In order to study the impact of CSB on urban LST, we chose areas with high CSB coverage, including Midong District, Toutunhe District, New Downtown District, Shayibak District, Tianshan District and Shuimogou District. The location of the study area is shown in Figure 1. It can be seen that the CSB are concentrated in the city’s suburbs, and the city center is sporadically distributed with fewer CSB. The CSB occupy a certain proportion of the city and are a representative type of buildings in Urumqi.
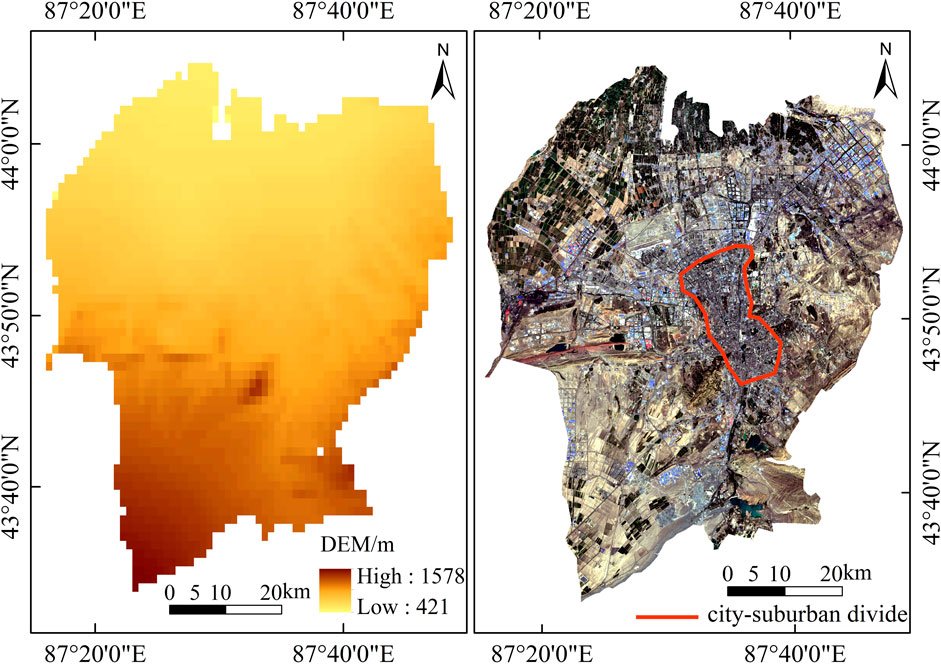
Figure 1. Location map of the study area.
2.2 Data
2.2.1 Land surface temperature data
The LST data was acquired from the Google Earth Engine (GEE) platform through the integration code provided by Ermida (Ermida et al., 2020). LST is computed with the Statistical Mono-Window (SMW) algorithm. The SMW algorithm calculates LST by representing the empirical relationship between the apparent bright temperature of the atmosphere and the LST obtained from a single thermal infrared band by means of a simple linear relationship. The algorithm is derived using the same calibration database for each Landsat coefficient, thus ensuring consistency between satellites. Validation based on in situ LST obtained at 12 stations shows th at the overall accuracy is 0.5 K. Esearch Fuladlu et al. (2021) indicates that scenes in summer months have the least cloud coverage, the most stable meteorological conditions, and can better distinguish between forested, agricultural, and urban areas. Additionally, due to the unique material of CSB, they heat up quickly and maintain high temperatures for a long-time during summer, causing localized temperature increases in the city. Table 1 shows the resolution of all images as well as specific information on transit times.
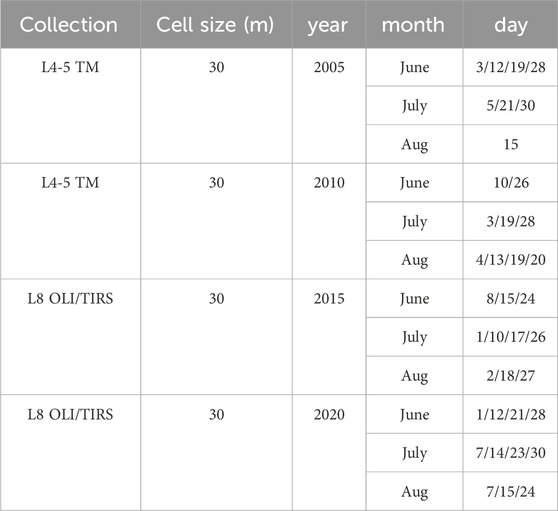
Table 1. Image transit time.
We used station data to validate LST. Two stations in Urumqi, numbered 51463 (D1) and 51369 (D2), were selected for daily temperature data collection during the summer months of June to August. This data included daily average temperature, daily maximum temperature, and daily minimum temperature. Since LST are derived by averaging summer image temperatures, we calculated the daily average values from the station observations for June to August. We invert the Land Surface Temperature (LST) data for June-August of each biennial period from 2005 to 2020, obtaining the maximum, minimum, and average temperatures for each year. These inversion results are then fitted to the observational station data to ensure the accuracy of the research findings.
From the trend lines (Figure 2), although there are differences in spatial distribution and numerical values between the LST inversion results and the monitored temperature data, the trend lines of the inverted temperatures for minimum, maximum, and average values closely approximate the observed temperature trends. This indicates that the algorithm’s temperature inversion results are stable, suggesting a high reliability of the LST inversion results in this study, which can be used for subsequent analyses.
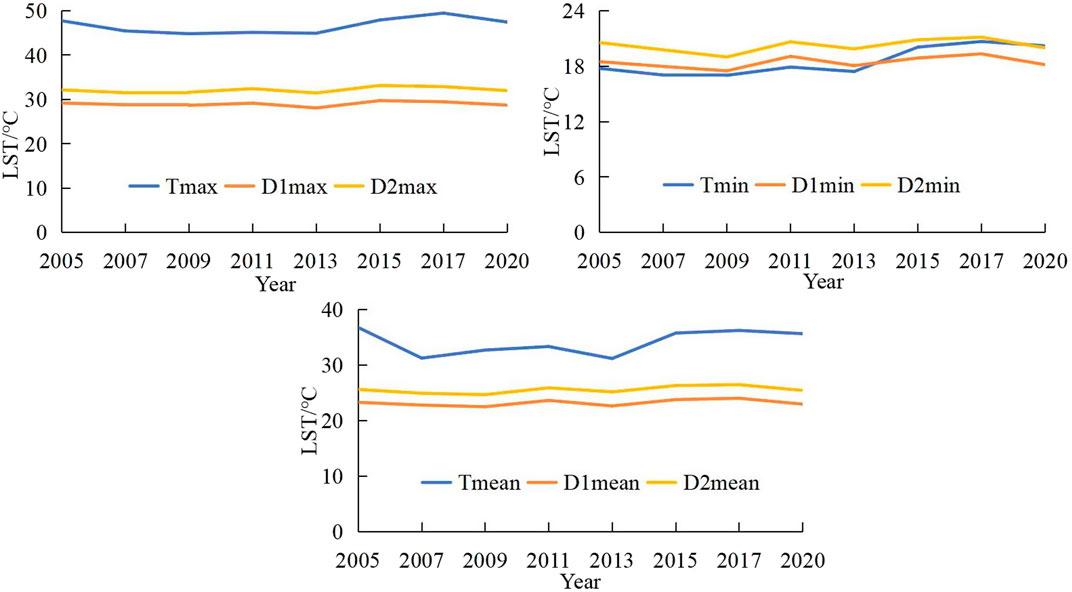
Figure 2. LST fitting with Station Temperatures.
2.2.2 Color steel buildings data
In this paper, the improved U-net model improved by deep learning based on Google Earth images can effectively extract the information of CSB. This model is an enhanced version of the U-net model, incorporating scSE (spatial squeeze and channel excitation) and SPP (spatial pyramid pooling) pooling techniques. The network still adheres to the fundamental U-net framework, with the inclusion of scSE attention modules after each convolutional layer to emphasize CSB building features. Moreover, by utilizing pooling layers with strides of 2, 4, and 8, it’s possible to mitigate high-frequency information interference and maintain change invariance. This approach involves pooling the input feature map to derive multi-scale features of the CSB. Subsequently, these features are connected to features of the same size in the coding path via skip connections, facilitating the integration of deep semantic and shallow information from remote sensing images. This integration improves the transfer of target features and detail information along the coding path, reducing losses due to convolution and pooling operations, thereby enhancing the CSB extraction efficiency. Specific realization process with reference to Shen (2022). The extraction results for CSB were 25,273 in 2020, 26,678 in 2015, 18,906 in 2010, and 2,087 in 2005. The local extraction effect of CSB is shown in Table 2.
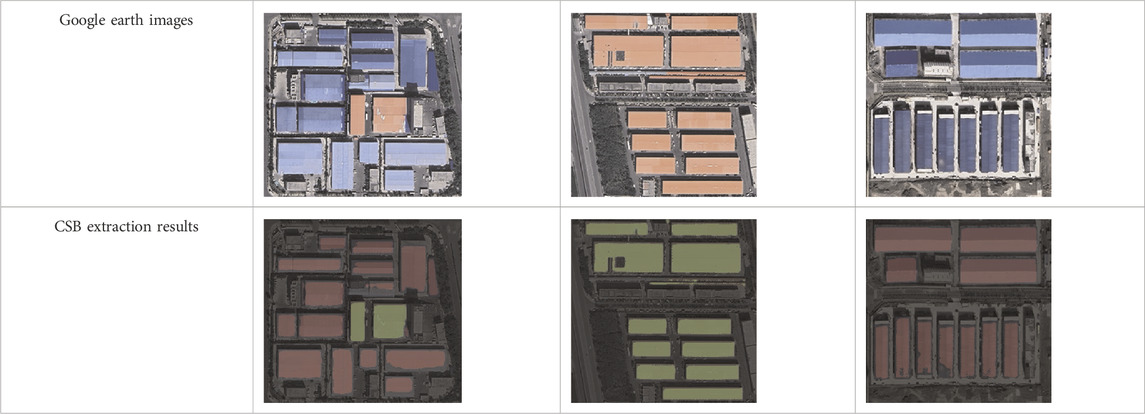
Table 2. Local extraction effect of CSB.
Three areas in Urumqi City are selected as test areas. Mean Intersection over Union (MIoU), Precision, Recall and Mean Pixel Accuracy (MPA) are applied to evaluate the precision of extraction results. The evaluation indexes are mIou = 87.58, mpA = 92.22, mPercision = 94.96, mRecall = 92.22, respectively, indicating that the application of improved U-net neural network can extract the CSB accurately and retain the detail features of the CSB better, and its extraction accuracy rate is more than 92%. Then we conducted field surveys in Urumqi, Xinjiang, and other cities in Northwest China. We measured and statistically analyzed the number and area of CSB in the extraction areas, which were found to be largely consistent with the extraction results.
3 Methods
In this paper, Landsat images were retrieved and inverted for LST with GEE during 2005–2020. Google Earth images were used to extract CSB data. The density of the CSB and the Mean-standard deviation were adopted to analyze the evolution of the CSB and the spatial trends of the LST. The correlation between LST and density of CSB was investigated by Pearson correlation analysis and regression analysis. The differences in the warming effect of CSB in urban and suburban areas were analyzed by comparing the statistical data. At the same time, the contribution index was used to estimate the contribution of various feature types to LST in the suburbs. The flowchart of the study is shown in Figure 3.
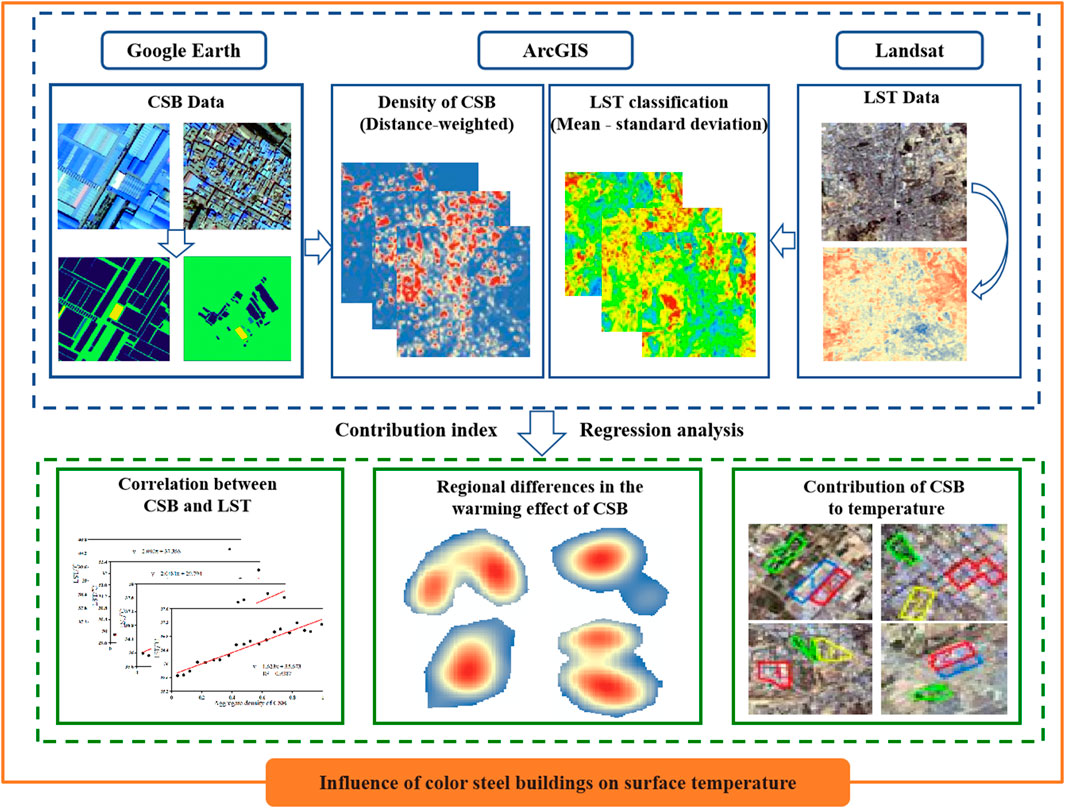
Figure 3. Research flowchart.
3.1 LST class classification
In order to accurately present the number and distribution characteristics of LST values in the study area, it is necessary to select a suitable method to classify the temperature data obtained from the inversion. In particular, the mean-standard deviation method shows the difference between the values of elemental attributes and the mean. The use of equivalent ranges proportional to the standard deviation to create classification intervals shows the different temperature classes and spatial distribution patterns, which better reflect the differences in LST in different impervious surface. In this paper, the LST distribution range is set to be between 0 and 1 with the goal to reflect the LST distribution in the study area more systematically (Liu et al., 2020). The calculation formula is as follows:
where NLSTi is the value of the normalized image element i, Ti is the LST inversion value of the image element i, Tmin and Tmax are the minimum and maximum values of LST within the map width, respectively.
Based on the actual LST inversion result values, a 1x standard deviation equivalent classification interval was created to classify the LST into five different classes (Shi et al., 2015; Liu et al., 2020), and the specific classification method is shown in Table 3 (Tmean is the normalized LST mean value and std is the standard deviation).
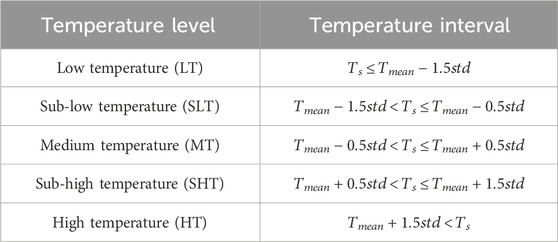
Table 3. LST class classification.
3.2 Distance-weighted
Densely populated building areas have higher thermal intensity (Chen et al., 2024), and the contiguous distribution of buildings can lead to an increase in local LST (Morabito et al., 2017), and it is found that the aggregation density of buildings significantly affects the LST. Density (R) of aggregation of CSB is the degree and density of distribution of CSB in the area around the pixel within a specific radius. The distance-weighted approach substitutes the value of the average aggregated density of CSB within the radius for the value of the region, which was weighted by the distance and reduced from the center pixel point to the surrounding (Meng et al., 2018). This method can measure the density of the distribution of CSB within the radius. The calculation formula is as follow:
where Pi and di are the value (0 or 1) of the i th image element within radius R and the Euclidean distance between its centroid image elements, respectively; m is the total number of image elements within radius R.
3.3 Impact of CSB with LST
For the purpose of study, the contribution of Urumqi’s CSB to the urban LST and to compare and analyze the difference between the Contribution of the CSB and other typical land use types to the LST. We adopts the Contribution Index (CI) constructed by YuanBin C (Chen et al., 2020; Cai et al., 2021). The formula is as follows:
Where
4 Results
4.1 Spatial and temporal evolution of CSB
4.1.1 Overall changes in the CSB
The study summarized the overall evolution of color steel buildings (CSB) in Urumqi city from 2005 to 2020, presenting statistical data on the number and area of CSB (Figure 4). During the period of 2005–2015, the number of CSB increased from 2087 to 26,678, representing a 12.7-fold increase. While the CSB area exhibited a year-on-year growth trend, there was a slight decrease in the number from 2015 to 2020. The new urban area had the highest CSB count annually, averaging 30%. Midong District showed the most significant growth in CSB area, followed by Toutunhe, attributed to active industrial development since 2010. Industrial parks emerged, utilizing color steel plate materials extensively.
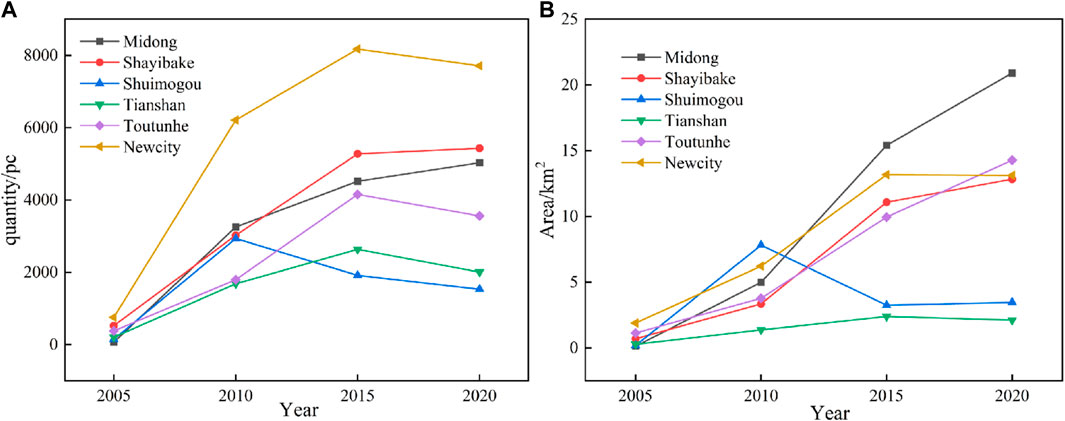
Figure 4. Statistics on the number of color steel plate complexes (A); statistics on the area of color steel plate complexes (B).
Since 2015, there has been a slight decrease in the number of CSB. The combination of high-resolution imagery and field research indicates that many small-scale CSB have been removed from certain urban areas since 2015, while the number of large-scale CSB used for industrial and other purposes in suburban areas has increased. As a result, the total number of CSB in 2020 was fewer than in 2015.
4.1.2 Changes in the density of CSB
This study utilizes the distance weighting method to determine the gathering density of the CSB for the purpose of examining the gathering area and spatial distribution condition of the CSB. The paper had employed the binarization process on the CSB vector map. In this binarized map, a specific image element point had been the center, with distance as the weight. Using the radius R as the calculation window, the average value of CSB image element values had been identified, representing the aggregation density D(R) of CSB within the radius R. In the study, to ensure that the extraction scale of the CSB is close to the scale of the surface temperature map, the pixel value size and the search radius r of the binary image output are both set to the size of the image resolution. The results of the aggregation density calculation of the CSB were shown in Figure 5. According to the proportion of the density value, the aggregation areas were divided into three levels,
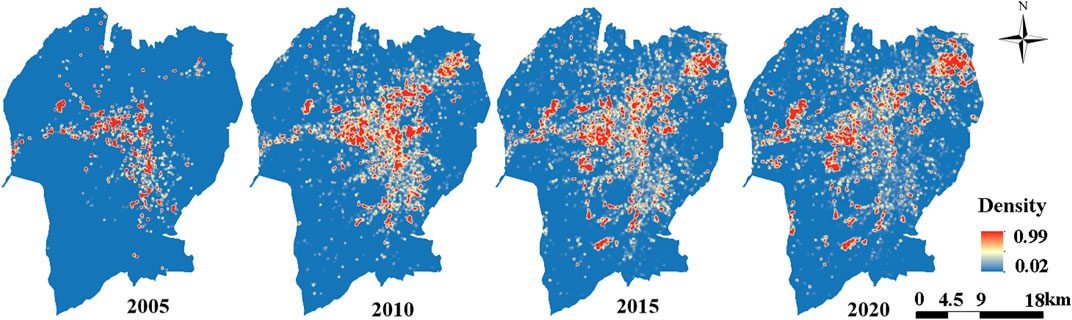
Figure 5. Aggregation density of CSB.
Figure 5 showed that in 2005, CSB were mainly gathered in the urban area, especially near the international airport in the new downtown area and the Tutunhe Industrial Park as the main high-density gathering area. After 2005, CSB gradually expanded to the suburbs, and by 2010, there was a noticeable increase in the medium-low-density and high-density gathering areas, and the urban area is dotted with CSB. Among them, the newly identified high-density gathering areas were in the northern suburb and along the S104 and S107 roads. Google map shows these two areas have many industrial parks, logistics parks, and entrepreneurial parks, so the CSB in the above areas have been widely used.
High-density CSB in urban areas decreased significantly in 2015, while in suburban areas still increased. Meanwhile, medium-density and low-density agglomerations increased throughout the study area, indicating a more comprehensive range of CSB uses. Due to the temporary nature of CSB and their tendency to cause fires and affect the cityscape, they were removed in large amounts in urban areas, so the main high-density aggregation areas of CSB in 2020 were in the suburbs. High-density, medium-density, and low-density aggregation areas in urban regions were all significantly reduced. Overall, from 2005 to 2020, the cluster of CSB has shifted from an urban aggregation state to a suburban dispersal expansion, with high-density aggregation areas moved from the city to the suburbs.
4.2 Temporal and spatial evolution of LST
The LST in Urumqi city was high in summer. Based on the GEE platform, the paper selected the summer June-July images of 4 years, 2005, 2010, 2015, and 2020, respectively, for the inversion of the LST mean. Mean value calculation is also utilized to eliminate the chance effect of cloudy and rainy weather. The temperature range of each year was further counted and classified into temperature classes according to the mean, standard deviation method (Table 4). The results showed that the average temperature from 2005 to 2020 decreased first and then increased. The maximum and mean of the LST in 2005 were the highest, and the temperature in 2010 was generally lower than in other years. There was not much difference between the LST in 2015 and 2020, however, the average temperature in 2020 was higher than that in 2015. The temperature difference value of the CSB was around 20°C, and the maximum value reached 47.29°C. Influenced by the local weather, building shading, and other factors, there was an extensive range of temperature differences in the CSB, most of which were high temperatures.
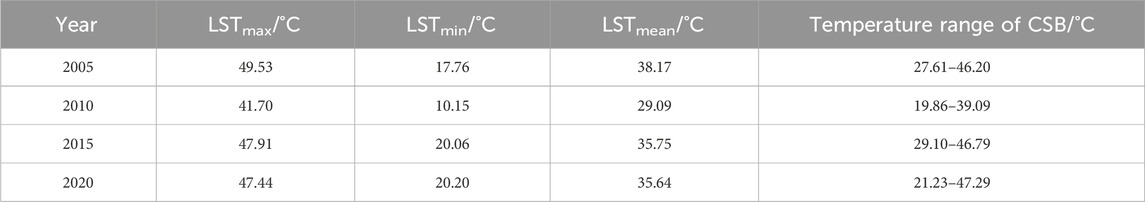
Table 4. LST statistics.
The results of the spatial distribution of heat islands in Urumqi City from remote sensing inversion from 2005 to 2020 were shown in Figure 6. Further analysis revealed that the heat island grades showed an irregular ring-shaped distribution. LST grades can be roughly divided into three levels: the first level is the mountainous terrain, which is dominated by high-temperature zones; the second level is the mountainous basins and hills, which is dominated by low and medium temperatures; and the third level is the plains, which is dominated by low-temperature zones. The highest temperatures were all found in rocky mountainous areas with large areas of bare land and in areas with dense industrial buildings, such as Steamed Bun Mountain, Yamalik Mountain, and Midong Industrial Park. Some waters and the northwestern and northern agricultural growing areas have the lowest temperatures. According to the three-phase time-series map comparison, it was found that from 2005 to 2020, the sub-high-temperature areas and high-temperature areas alternated in their patterns of change, and the built-up areas exhibited a “cold-island effect”.
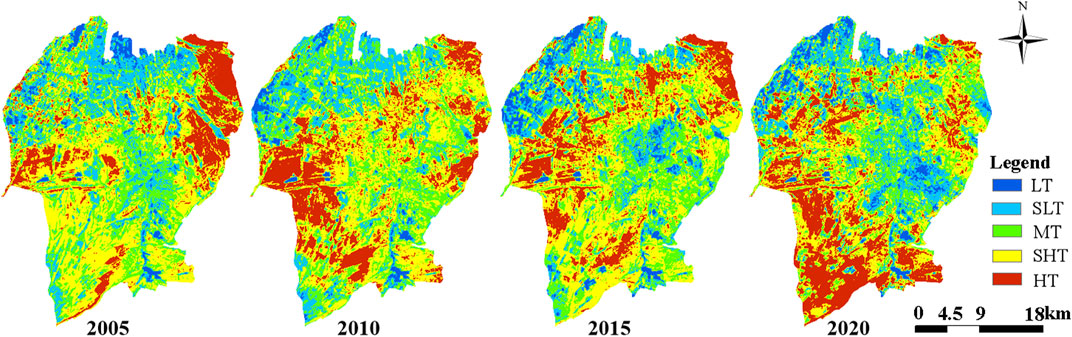
Figure 6. Results of LST classification.
In 2005, the urban heat island in Urumqi City covered a small area; the average summer LST in the urban heat island area was 38.17°C. The LST grading map showed that the high LST area was concentrated in mines in the northeastern part of Midong District and Xishan Katsuwa Stone Factory in Tutunhe District. The maximum LST reached 49.53°C, which contrasted with the “cold source” in the urban area, with a difference of 20.3°C in LST. 2010 high-temperature zone coverage in the built-up area was expanded in an irregular ring compared with 2005. Although the average LST was 9.08°C lower than that of 2005, most of the urban center area is covered by heat islands, with high-temperature, sub-high-temperature, and medium-temperature zones accounting for the significant part. The economic and technological development zone, the Toutunhe Industrial Park, and the business district of the railway station in the city are apparent high-temperature agglomeration zones, with the highest LST of 41.7°C. In 2015, the heat island effect was more evident in the form of a circle; the area of the cold island is increased, and the heat island effect in the city is weakened, with some of the densely built-up areas being low-temperature zones. By 2020, the low-temperature zone in the urban area of Urumqi had further expand, with the lowest temperature close to 20°C, while the southern mountain range still dominated the high-temperature zone.
Overall, the central city of Urumqi was characterized by low and sub-low temperature zones, and most suburban mountains were characterized by high or sub-high temperature zones. In addition, green areas and water bodies in the urban area also showed lower temperatures. This indicated that the temperature in the central urban area of Urumqi was significantly affected by factors such as altitude and geographic location, and the central urban area presented a cold island effect.
4.3 The response of LST to CSB
4.3.1 Correlation between CSB and LST
By analyzing the temporal and spatial variation rules of CSB and LST, it can be found that the LST grade is high in the area with a high density of CSB. However, it can only be seen from the space that the distribution of high-density and high-temperature areas has a sure consistency. However, it is not possible to determine the specific correlation between the two. In order to explore the influence of the aggregation density of CSB on LST, this paper further determines the correlation between the two through the calculation of the Pearson correlation coefficient. The correlation coefficients were 0.832, 0.937, 0.970, and 0.969 for the years 2005–2020 at p < 0.01. Pearson’s correlation coefficients of all 4 years reached a high positive correlation, in which the correlation increased significantly from 2005 to 2010, and the correlation decreased slightly from 2010 to 2020, which was related to the change in the number and area of the CSB.
In order to more accurately quantify the influence of the CSB on the LST, the density of the CSB aggregation is divided into 20 grades, with an interval of 0.05, and the average density value of each grade and the corresponding average temperature value of the interval are found respectively. The regression analysis is utilized to further explore the degree of correlation between the two, and the results are shown in Figure 7.
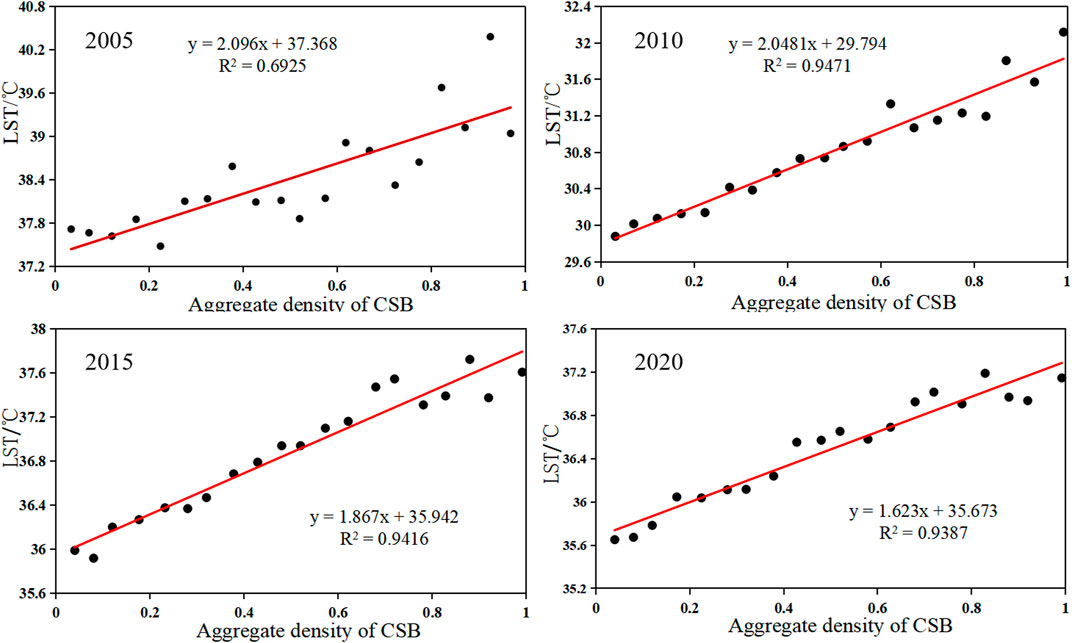
Figure 7. Relationship between aggregation density and LST of CSB.
Analysis of Figure 7 shows that between 2005 and 2020, the density of aggregation of CSB and the LST shows a high positive correlation, indicating that the higher the degree of aggregation of CSB, the stronger the warming effect on the surface. The warming effect of the CSB in different stages shows that the temperature rises 0.21°C, 0.4°C, 0.38°C, and 0.33°C for every 0.2 of the aggregation densities of the CSB.
From the fitting results, the point of 2005 is more discrete, and R2 is 0.6925, indicating that the influence of the CSB on the LST in this period is negligible. The reason is that in 2005, the number of CSB was small and primarily distributed in the city center; its high gathering density does not coincide with the distribution of high-temperature areas in the city, so it has less influence on the LST. 2010, the CSB gradually developed to the suburbs, but the overall center of gravity was still in the urban area. During the same period, the LST in the urban area was dominated by medium and high temperatures. Hence, the density of CSB has the highest degree of influence on LST in this period—the highest degree of influence. From 2015 to 2020, the center of gravity of the CSB shifted to the suburbs, which coincides with the high-temperature region more, so the degree of influence is slightly reduced compared with 2010. Overall, R2 increases and decreases, which is consistent with the change in density of CSB and Pearson’s correlation coefficient, which further indicates that the warming effect of CSB is very significant.
4.3.2 Regional variability of the warming effect of CSB
Some studies indicate significant differences in land surface temperature between urban and rural areas (Badugu et al., 2023; Ramsay et al., 2023), while the heat island effect varies across the urban-rural gradient (Xie et al., 2024). Urban areas generally exhibit higher temperatures compared to suburban areas (Raj et al., 2020). The differences in land surface temperature between urban and rural areas arise from variations in land cover types (Yang et al., 2020). However, the urban area of Urumqi exhibits a “cool island effect,” suggesting that there may be differences in the warming effect of CSB between the urban and suburban areas of Urumqi. Suburbs refer to areas within urban regions, outside the boundaries of major central cities, with lower land use density (De Vidovich, 2019).Research on the division between suburbs and urban areas involves various aspects, such as built-up area, population density, block density, and more (Airgood-Obrycki et al., 2021). Some studies determine their own criteria based on their research focus. Ding (Ding et al., 2024) use the ratio of undeveloped land in buffer zones to total area to distinguish suburban and urban attributes. However, traditional suburban definitions do not apply to the scope of this study. Therefore, we have classified the main urban area and urban outskirts of Urumqi in 2020 based on PD (population density) data, where PD ≥ 10000 km2 are considered the main urban area, and areas with PD < 10000 km2 are considered suburbs. The boundaries of the urban and suburban divisions are visible in Figure 1.
In order to explore the heat island effect of CSB in different regions in a refined way, we take 2020 as an example. Three high-density aggregations (D(R) > 0.5) samples were selected in each of the urban and suburban, respectively, with the sample image value of 749, and the proportion of the heat island intensity within the sample area was statistically shown in Figure 8.
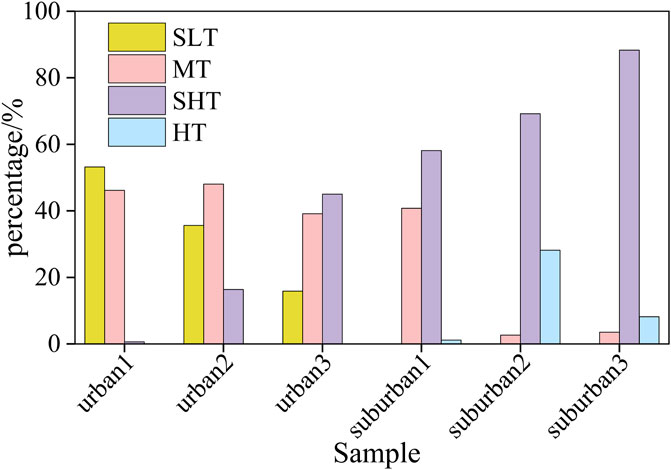
Figure 8. Percentage of sample temperature levels.
As can be seen from Figure 8, under the same aggregation density, the temperature corresponding to the CSB of the urban sample is mainly concentrated in the sub-low temperature and medium temperature, of which the sub-low temperature accounts for 34.9%, the medium temperature accounts for 44.4%. The sub-high temperature accounts for 20.7%. The temperatures of the suburban sample are concentrated in sub-high and medium temperatures, with the proportion of sub-high temperatures as high as 71.8%, which is almost three times as high as the sum of medium and high temperatures. By comparing the temperatures of the urban and suburban samples, it was found that the warming effect of the urban CSB was significantly lower than that of the suburban CSB, indicating that the warming effect of the suburban CSB on the surface was more significant. This result is consistent with the overall temperature distribution in Urumqi city.
4.3.3 Differences in the contribution of localized CSB
There are temperature differences between different built-up areas and regions of other land cover types (Khamchiangta and Dhakal, 2019). In order to deeply understand the warming effect of the CSB on the LST, different types of areas in the suburbs are selected to compare with the CSB. The suburban landscape is divided into areas with and without CSB, and typical landscape types are selected. Four samples were selected for each of the four landscape categories: CSB, other buildings, bare soil, and vegetation. In order to minimize the errors caused by elevation and other natural factors, we try to select similarly numbered samples close to the sample areas of the CSB to make comparisons. The locations of these sample zones in the original image, LST, and aggregated density maps are shown in Figure 9.
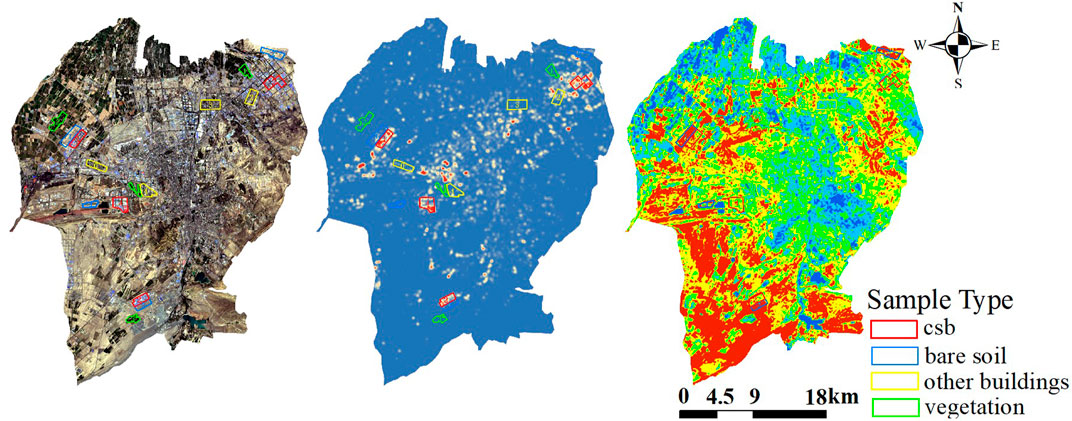
Figure 9. Schematic diagram of the suburban sample area.
The sample zone statistics are shown in Table 5. From the average and maximum and minimum values of the sample temperatures, the temperatures are in descending order: bare soil, CSB, other buildings, and vegetation. The maximum value of the sample temperature of CSB reaches 47°C, and the range of temperature values belongs to the sub-high and high-temperature zones. By comparison, it is found that all the samples in the CSB samples have a positive Contribution, and the contribution index is around 0.1. Other buildings have three negative contributions and one positive Contribution; all four samples of bare soil have positive contributions, and the opposite is true for the vegetation.
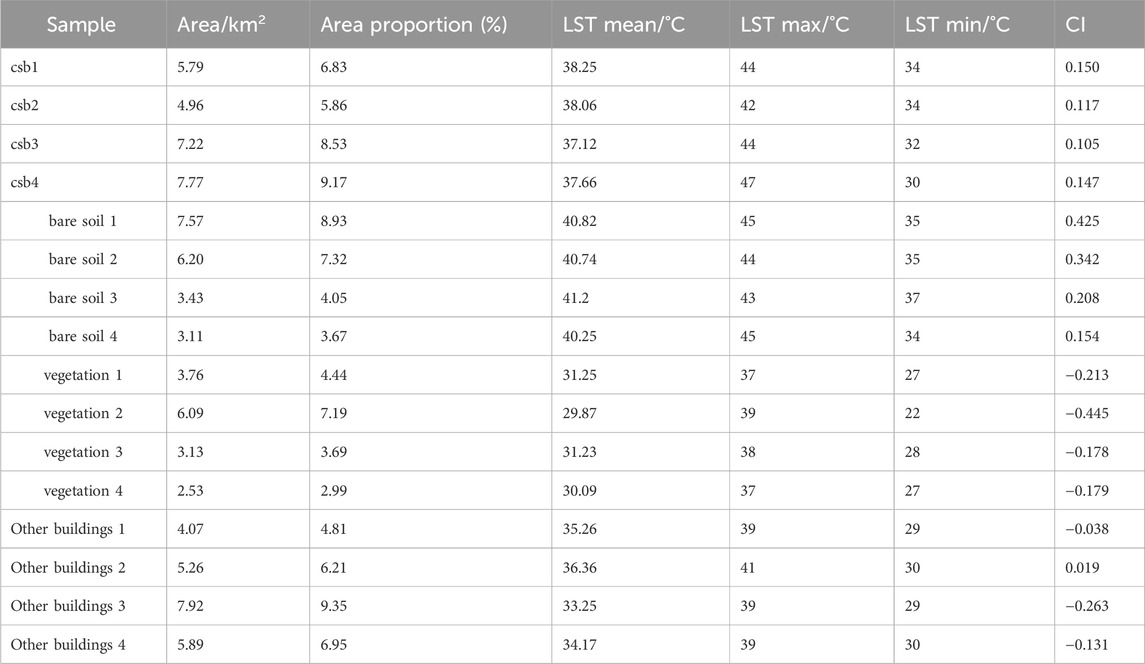
Table 5. Suburban sample contribution index.
Due to the random nature of the sample selection, there is no guarantee that the sample area is uniform in size. Table 5 shows that the contribution value of sample CSB is relatively uniform, while there are significant differences in the contribution value of other landscape types. In order to effectively compare the difference in Contribution to LST between the CSB and other landscape types, we assumed that the sample area is of uniform size, the total area of the color plate sample is used as a reference, and the other types of samples are multiplied by a scale factor. We obtained a contribution index of 0.512 for the CSB area, −0.407 for the other buildings, 1.470 for the bare soil, and −1.707 for the vegetation area. The contribution of bare rock areas is the greatest, and existing studies have shown that LST increases with the expansion of bare land and human settlements, and there is a significant positive correlation between LST and bare land (Tabassum et al., 2023).
Under the same coverage area, the positive Contribution of bare soil is much higher than that of other areas. At the same time, vegetation plays a noticeable cooling effect on the LST. The index of the Contribution of other buildings to the temperature is negative, and this result is inconsistent with that in other studies, i.e., urban buildings can increase the LST to varying degrees (Hao et al., 2016; Morabito et al., 2017; Zheng et al., 2023). The reason for this phenomenon is that the overall high temperature in the suburbs of Urumqi, surrounded by mountains on three sides and covered by large areas of bare soil and rock, is the main factor for the increase in LST in the suburbs. In contrast, the temperature of other buildings is much lower than that of bare earth and rocks, so the other buildings area shows a negative contribution. Overall, except for the bare soil sample, the warming effect of the CSB zone on LST is much higher than that of other surrounding factors, which further indicates that the CSB has a significant degree of influence on surface warming and is a factor that cannot be ignored for the healthy development of the city.
5 Discussions
This paper takes CSB as an entry point to quantitatively study their impact on LST through their aggregation density and evolution pattern, and comparatively analyzes the difference between the temperature increasing effect of CSB in urban and suburban areas. The article strongly proved that the CSB is related to the LST increase. CSB are made of special materials, and the steel absorbs heat quickly and dissipates it quickly. Chiu mentioned in their study that steel plate buildings, such as science and technology factories and large construction companies, have high indoor temperatures in the middle of the day during the summer due to solar radiation (Chiu and Cheng, 2012). In terms of material, the argument that CSB contribute to the increase in LST is feasible.
The conclusion that the higher the density of aggregation of CSB, the higher the LST, is related to the search radius R. We set the search radius to 10 m, 30 m, 60 m and 90 m. By comparison, we found that the correlation R2 between the aggregated density of CSB and LST reaches the maximum when R = 30 m. When R > 30m, the correlation decreases significantly with the increase of radius, indicated that the greater the density of the coverage of CSB, the stronger the warming effect is within R = 30 m. The correlation between the density of the aggregated density of CSB and LST reaches the maximum. This may be related to the resolution of the LST image. Since the extraction of the CSB is based on Google Earth images, and the temperature inversion is based on the conventional Landsat series images, the spatial resolution of the two is quite different. Therefore, we used resampling to unify the color steel plate data at the same scale, which may also result in the best results at the 30-m scale for the correlation between the two.
Furthermore, we know that the urban heat island effect is the result of a combination of multiple influences (Hao et al., 2016; He et al., 2020). Airborne particulate matter (Biswas et al., 2020), urban form, building density and street configuration have a decisive influence on the local urban climate, especially during heat waves (Stache et al., 2022). The temperatures of the CSB in the suburbs of Urumqi are all higher than those in the urban area. Considering the suburban differences, we found through our research as well as press materials that the urban area’s CSB are more fine-grained, dominated by temporary factories or residential areas, and the area of individual CSB is smaller. The gathering area of CSB in the suburbs is dominated by large factory parks. Color steel plate is mainly used to build warehouses, large-scale factory buildings and so on, and the area of single-color steel room is large. Therefore, the size and compactness of the CSB itself will make a difference in the warming effect.
In addition to differences in the area size of the CSB themselves, building heights in the suburbs may also contribute to suburban differences. Taller monolithic buildings create larger shadow areas (Han et al., 2023). Considering the lower LST in the shaded area, all the CSB in urban areas are lower than other surrounding buildings. Therefore, CSB in urban areas may have low temperatures. In suburban areas, which are relatively empty and do not have a large number of other buildings around the CSB, the shadow coverage is small, and the contribution of the CSB to the temperature is more pronounced. The research indicates a significant relationship between landscape indices and land surface temperature (Ding et al., 2024). Therefore, studying the relationship between landscape indices of CSB and LST is also a part that needs to be considered in subsequent research.
One of the most important and dominant reasons may be the differences caused by differences in elevation. Altitude is usually taken into account as a factor affecting the urban heat island (Mathew et al., 2016).Mathew’s study showed that the LST in the study area tended to increase with increasing altitude (Mathew et al., 2017). Urumqi is surrounded by mountains on three sides, and the elevation of the suburbs is higher than that of the urban area, so the temperature of CSB in the suburbs is higher than that of the urban area. The article only superficially discusses the influence of CSB on LST, and in the future, the building height, building layout and environment of CSB can be taken into account to more comprehensively and accurately analyze the influence of CSB on LST.
Although the aggregation density of CSB and LST as a whole shows a positive relationship, but in the local area there is a non-correlation of special cases, the reason may be related to a certain range of building layout or vegetation coverage (Mohajerani et al., 2017; Yao et al., 2018). The results of the article show that the contribution index of the samples in the vegetation coverage area is negative, and we know that water bodies and vegetation usually can mitigate the urban heat island when they are used as blue-green space in cities (Pan et al., 2023; Zhou et al., 2023). Suburban CSB are less affected by blue-green covered areas. In addition, some studies have shown that the temperature in urban areas is higher than that in non-urban areas, while the opposite is true for Urumqi, which may also explain the localized non-positive correlation between the two. Further exploration of the more complex inner-city structure is needed to achieve a more refined study of the CSB.
6 Conclusion
Taking the stage buildings that appeared in the development process of Urumqi City as the research object, this study focuses on analyzing the influence of the spatial pattern and spatial and temporal changes of the CSB, which are the typical building clusters, on the LST of the city. The study qualitatively analyzes the spatial distribution of CSB and LST using the distance-weighted method and the mean-standard deviation method. The results show that during the period of 2005–2020, the scale of the CSB is enlarged, and the spatial distribution is gradually dispersed from the center to the surrounding area, and the high-density gathering area is gradually shifted from the urban area to the suburban area. The high-density gathering area of CSB and the high LST area of Urumqi city show the consistency of spatial distribution, which qualitatively indicates that there is a certain correlation between the CSB and the increase of urban LST.
It was further observed that the density of CSB was highly positively correlated with LST, indicating that their dense distribution would exacerbate LST. Notably, at equivalent densities, temperatures of CSB in urban areas were lower than those in suburban areas. Consequently, urban planners may need to focus on planning and distributing large industrial areas, reasonably controlling the density of CSB, and mitigating the concentrated distribution of CSB to enhance the local thermal environment. Furthermore, the contribution index to LST from CSB samples in suburban areas reached 0.512, significantly higher than in other building areas, suggesting that these clusters are a key factor driving LST increases in suburban regions. Therefore, reducing the thermal impact of CSB emerges as a crucial strategy in mitigating the urban heat island effect. This necessitates improving the influence of CSB on LST through initiatives such as energy-efficient building design, utilization of green building technologies, and enhancement of building materials and colors.
Data availability statement
The original contributions presented in the study are included in the article/supplementary material, further inquiries can be directed to the corresponding author.
Author contributions
YuL: Formal Analysis, Investigation, Visualization, Writing–original draft. SY: Supervision, Writing–review and editing. YaL: Conceptualization, Investigation, Writing–review and editing. ZZ: Formal Analysis, Visualization, Writing–review and editing. PH: Visualization, Writing–review and editing.
Funding
The author(s) declare that financial support was received for the research, authorship, and/or publication of this article. This research work is co-funded by National Natural Science Foundation of China (No. 42161069), the National Key R&D Program of China (Grant No. 2022YFB3903604) and Gansu Province Outstanding Graduate Student Innovation Star Project (2023CXZX-507).
Acknowledgments
We are very grateful to the editors and anonymous reviewers for their valuable comments and suggestions.
Conflict of interest
The authors declare that the research was conducted in the absence of any commercial or financial relationships that could be construed as a potential conflict of interest.
Publisher’s note
All claims expressed in this article are solely those of the authors and do not necessarily represent those of their affiliated organizations, or those of the publisher, the editors and the reviewers. Any product that may be evaluated in this article, or claim that may be made by its manufacturer, is not guaranteed or endorsed by the publisher.
References
Airgood-Obrycki, W., Hanlon, B., and Rieger, S. (2021). Delineate the US suburb: an examination of how different definitions of the suburbs matter. J. Urban Aff. 43 (9), 1263–1284. doi:10.1080/07352166.2020.1727294
Ayitikan, M., Li, X., He, Q., Musha, Y., Tang, H., Li, S., et al. (2023). Characteristics and establishment of objective identification criteria and predictors for foehn winds in Urumqi, China. Atmosphere 14 (8), 1206. doi:10.3390/atmos14081206
Badugu, A., Arunab, K., Mathew, A., and Sarwesh, P. (2023). Spatial and temporal analysis of urban heat island effect over Tiruchirappalli city using geospatial techniques. Geodesy Geodyn. 14 (3), 275–291. doi:10.1016/j.geog.2022.10.004
Biswas, K., Chatterjee, A., and Chakraborty, J. (2020). Comparison of air pollutants between Kolkata and Siliguri, India, and its relationship to temperature change. J. Geovisualization Spatial Analysis 4 (2), 25. doi:10.1007/s41651-020-00065-4
Cai, Y.-B., Li, K., Chen, Y.-H., Wu, L., and Pan, W.-B. (2021). The changes of heat contribution index in urban thermal environment: a case study in fuzhou. Sustainability 13 (17), 9638. doi:10.3390/su13179638
Chen, B., Zhu, Y., He, X., and Zhou, C. (2023a). Analysis of high-quality tourism destinations based on spatiotemporal big data—a case study of Urumqi. Land 12 (7), 1425. doi:10.3390/land12071425
Chen, D., Xu, X., Jiang, H., Sun, Z., Liu, L., and Qiao, Z. (2020). Contribution of spatial heterogeneity and temporal-spatial change of ecosystems to the thermal environment of tourist destinations: a case study of sichuan-chongqing region, China. Adv. Meteorology 2020, 1–15. doi:10.1155/2020/6798958
Chen, Y., Yang, J., Yu, W., Ren, J., Xiao, X., and Xia, J. C. (2023b). Relationship between urban spatial form and seasonal land surface temperature under different grid scales. Sustain. Cities Soc. 89, 104374. doi:10.1016/j.scs.2022.104374
Chen, Y.-C., Lo, T.-W., Shih, W.-Y., Lin, T.-P., and Hung, K.-A. (2024). Assessment of urban thermal environments using a combination of the local climate zone and landscape ecological metrics in taipei city. J. Urban Plan. Dev. 150 (2), 05024004. doi:10.1061/jupddm.upeng-4890
Chiu, R.-S., and Cheng, S.-T. (2012). The improvement of heat insulation for roof steel plates by triz application. J. Mar. Sci. Technol. 20 (2), 2. doi:10.51400/2709-6998.1830
Coseo, P., and Larsen, L. (2019). Accurate characterization of land cover in urban environments: determining the importance of including obscured impervious surfaces in urban heat island models. Atmosphere 10 (6), 347. doi:10.3390/atmos10060347
De Vidovich, L. (2019). Suburban studies: state of the field and unsolved knots. Geogr. Compass 13 (5), e12440. doi:10.1111/gec3.12440
Ding, J., Ren, C., Wang, J., Feng, Z., and Cao, S.-J. (2024). Spatial and temporal urban air pollution patterns based on limited data of monitoring stations. J. Clean. Prod. 434, 140359. doi:10.1016/j.jclepro.2023.140359
Ermida, S. L., Soares, P., Mantas, V., Göttsche, F.-M., and Trigo, I. F. (2020). Google earth engine open-source code for land surface temperature estimation from the landsat series. Remote Sens. 12 (9), 1471. doi:10.3390/rs12091471
Fuladlu, K. (2022). Thermal response to land-use land-cover patterns: an experimental study in famagusta, Cyprus. CLEAN–Soil, Air, Water 50 (9), 2100284. doi:10.1002/clen.202100284
Fuladlu, K., and Altan, H. (2021). Examining land surface temperature and relations with the major air pollutants: a remote sensing research in case of Tehran. Urban Clim. 39, 100958. doi:10.1016/j.uclim.2021.100958
Fuladlu, K., Riza, M., and Ilkan, M. (2021). Monitoring urban Sprawl using time-series data: famagusta region of Northern Cyprus. Sage Open 11 (2), 215824402110074. doi:10.1177/21582440211007465
Guo, J., Han, G., Xie, Y., Cai, Z., and Zhao, Y. (2020). Exploring the relationships between urban spatial form factors and land surface temperature in mountainous area: a case study in Chongqing city, China. Sustain. Cities Soc. 61, 102286. doi:10.1016/j.scs.2020.102286
Han, S., Hou, H., Estoque, R. C., Zheng, Y., Shen, C., Murayama, Y., et al. (2023). Seasonal effects of urban morphology on land surface temperature in a three-dimensional perspective: a case study in Hangzhou, China. Build. Environ. 228, 109913. doi:10.1016/j.buildenv.2022.109913
Hao, P., Niu, Z., Zhan, Y., Wu, Y., Wang, L., and Liu, Y. (2016). Spatiotemporal changes of urban impervious surface area and land surface temperature in Beijing from 1990 to 2014. GIScience Remote Sens. 53 (1), 63–84. doi:10.1080/15481603.2015.1095471
Hasan, M. A., Mia, M. B., Khan, M. R., Alam, M. J., Chowdury, T., Al Amin, M., et al. (2023). Temporal changes in land cover, land surface temperature, soil moisture, and evapotranspiration using remote sensing techniques—a case study of kutupalong Rohingya refugee camp in Bangladesh. J. Geovisualization Spatial Analysis 7 (1), 11. doi:10.1007/s41651-023-00140-6
He, B.-J., Ding, L., and Prasad, D. (2020). Relationships among local-scale urban morphology, urban ventilation, urban heat island and outdoor thermal comfort under sea breeze influence. Sustain. Cities Soc. 60, 102289. doi:10.1016/j.scs.2020.102289
Hou, D., Wang, S., and Xing, H. (2021). A novel benchmark dataset of color steel sheds for remote sensing image retrieval. Earth Sci. Inf. 14, 809–818. doi:10.1007/s12145-021-00593-7
Hua, L., Zhang, X., Nie, Q., Sun, F., and Tang, L. (2020). The impacts of the expansion of urban impervious surfaces on urban heat islands in a coastal city in China. Sustainability 12 (2), 475. doi:10.3390/su12020475
Khamchiangta, D., and Dhakal, S. (2019). Physical and non-physical factors driving urban heat island: case of Bangkok Metropolitan Administration, Thailand. J. Environ. Manag. 248, 109285. doi:10.1016/j.jenvman.2019.109285
Li, J., Zheng, B., Bedra, K. B., Li, Z., and Chen, X. (2022). Effects of residential building height, density, and floor area ratios on indoor thermal environment in Singapore. J. Environ. Manag. 313, 114976. doi:10.1016/j.jenvman.2022.114976
Liu, F., Zhang, X., Murayama, Y., and Morimoto, T. (2020). Impacts of land cover/use on the urban thermal environment: a comparative study of 10 megacities in China. Remote Sens. 12 (2), 307. doi:10.3390/rs12020307
Liu, Z., Wang, J., Ding, J., and Xie, X. (2023). Analysis of spatial–temporal evolution trends and influential factors of desert-oasis thermal environment in typical arid zone: the case of Turpan–Hami region. Ecol. Indic. 154, 110747. doi:10.1016/j.ecolind.2023.110747
Luo, P., Yu, B., Li, P., Liang, P., Liang, Y., and Yang, L. (2023). How 2D and 3D built environments impact urban surface temperature under extreme heat: a study in Chengdu, China. Build. Environ. 231, 110035. doi:10.1016/j.buildenv.2023.110035
Mathew, A., Khandelwal, S., and Kaul, N. (2016). Spatial and temporal variations of urban heat island effect and the effect of percentage impervious surface area and elevation on land surface temperature: study of Chandigarh city, India. Sustain. Cities Soc. 26, 264–277. doi:10.1016/j.scs.2016.06.018
Mathew, A., Khandelwal, S., and Kaul, N. (2017). Investigating spatial and seasonal variations of urban heat island effect over Jaipur city and its relationship with vegetation, urbanization and elevation parameters. Sustain. Cities Soc. 35, 157–177. doi:10.1016/j.scs.2017.07.013
Meng, Q., Zhang, L., Sun, Z., Meng, F., Wang, L., and Sun, Y. (2018). Characterizing spatial and temporal trends of surface urban heat island effect in an urban main built-up area: a 12-year case study in Beijing, China. Remote Sens. Environ. 204, 826–837. doi:10.1016/j.rse.2017.09.019
Mohajerani, A., Bakaric, J., and Jeffrey-Bailey, T. (2017). The urban heat island effect, its causes, and mitigation, with reference to the thermal properties of asphalt concrete. J. Environ. Manag. 197, 522–538. doi:10.1016/j.jenvman.2017.03.095
Morabito, M., Crisci, A., Georgiadis, T., Orlandini, S., Munafò, M., Congedo, L., et al. (2017). Urban imperviousness effects on summer surface temperatures nearby residential buildings in different urban zones of Parma. Remote Sens. 10 (1), 26. doi:10.3390/rs10010026
Nichol, J. E. (1996). High-resolution surface temperature patterns related to urban morphology in a tropical city: a satellite-based study. J. Appl. Meteorology Climatol. 35 (1), 135–146. doi:10.1175/1520-0450(1996)035<0135:hrstpr>2.0.co;2
Pan, Z., Xie, Z., Wu, L., Pan, Y., Ding, N., Liang, Q., et al. (2023). Simulation of cooling island effect in blue-green space based on multi-scale coupling model. Remote Sens. 15 (8), 2093. doi:10.3390/rs15082093
Patle, S., and Ghuge, V. V. (2024). Urban fragmentation approach for assessing thermal environment dynamics: a case study of semi-arid city from a comfort perspective. Urban Clim. 53, 101784. doi:10.1016/j.uclim.2023.101784
Raj, S., Paul, S. K., Chakraborty, A., and Kuttippurath, J. (2020). Anthropogenic forcing exacerbating the urban heat islands in India. J. Environ. Manag. 257, 110006. doi:10.1016/j.jenvman.2019.110006
Ramsay, E. E., Duffy, G. A., Burge, K., Taruc, R. R., Fleming, G. M., Faber, P. A., et al. (2023). Spatio-temporal development of the urban heat island in a socioeconomically diverse tropical city. Environ. Pollut. 316, 120443. doi:10.1016/j.envpol.2022.120443
Rani, M., Kumar, P., Pandey, P. C., Srivastava, P. K., Chaudhary, B., Tomar, V., et al. (2018). Multi-temporal NDVI and surface temperature analysis for Urban Heat Island inbuilt surrounding of sub-humid region: a case study of two geographical regions. Remote Sens. Appl. Soc. Environ. 10, 163–172. doi:10.1016/j.rsase.2018.03.007
Salehi, A., and Nasrollahi, N. (2024). Assessing vegetation distribution based on geometrical and morphological characteristics of the urban fabric to provide thermal comfort for pedestrians: a case study in Sanandaj. Sustain. Cities Soc. 104, 105297. doi:10.1016/j.scs.2024.105297
Samat, A., Gamba, P., Wang, W., Luo, J., Li, E., Liu, S., et al. (2022). Mapping blue and red color-coated steel sheet roof buildings over China using sentinel-2A/B MSIL2A images. Remote Sens. 14 (1), 230. doi:10.3390/rs14010230
Shen, S. (2022) Recognition and extraction of color steel building information based on deep learning[D]. Lanzhou Jiaotong University.
Shi, T., Huang, Y., Wang, H., Shi, C.-E., and Yang, Y.-J. (2015). Influence of urbanization on the thermal environment of meteorological station: satellite-observed evidence. Adv. Clim. Change Res. 6 (1), 7–15. doi:10.1016/j.accre.2015.07.001
Shi, Z., Li, X., Hu, T., Yuan, B., Yin, P., and Jiang, D. (2023). Modeling the intensity of surface urban heat island based on the impervious surface area. Urban Clim. 49, 101529. doi:10.1016/j.uclim.2023.101529
Song, J., Chen, W., Zhang, J., Huang, K., Hou, B., and Prishchepov, A. V. (2020). Effects of building density on land surface temperature in China: spatial patterns and determinants. Landsc. Urban Plan. 198, 103794. doi:10.1016/j.landurbplan.2020.103794
Stache, E. E., Schilperoort, B. B., Ottelé, M. M., and Jonkers, H. H. (2022). Comparative analysis in thermal behaviour of common urban building materials and vegetation and consequences for urban heat island effect. Build. Environ. 213, 108489. doi:10.1016/j.buildenv.2021.108489
Sun, M., Deng, Y., Li, M., Jiang, H., Huang, H., Liao, W., et al. (2020). Extraction and analysis of blue steel roofs information based on CNN using gaofen-2 imageries. Sensors 20 (16), 4655. doi:10.3390/s20164655
Tabassum, A., Basak, R., Shao, W., Haque, M. M., Chowdhury, T. A., and Dey, H. (2023). Exploring the relationship between land use land cover and land surface temperature: a case study in Bangladesh and the policy implications for the global south. J. Geovisualization Spatial Analysis 7 (2), 25. doi:10.1007/s41651-023-00155-z
Tabatabaei, S. S., and Fayaz, R. (2023). The effect of facade materials and coatings on urban heat island mitigation and outdoor thermal comfort in hot semi-arid climate. Build. Environ. 243, 110701. doi:10.1016/j.buildenv.2023.110701
Tahooni, A., Kakroodi, A., and Kiavarz, M. (2023). Monitoring of land surface albedo and its impact on land surface temperature (LST) using time series of remote sensing data. Ecol. Inf. 75, 102118. doi:10.1016/j.ecoinf.2023.102118
Wang, J., and Ouyang, W. (2017). Attenuating the surface urban heat island within the local thermal zones through land surface modification. J. Environ. Manag. 187, 239–252. doi:10.1016/j.jenvman.2016.11.059
Wang, J., Yang, W., Yang, S., and Yan, H. (2019). Spatial distribution characteristics of color steel plate buildings in Lanzhou City. Mod. Environ. Sci. Eng. 5, 583–589. doi:10.15341/mese(2333-2581)/07.05.2019/009
Wang, M., and Xu, H. (2021). The impact of building height on urban thermal environment in summer: a case study of Chinese megacities. Plos one 16 (4), e0247786. doi:10.1371/journal.pone.0247786
Wang, W., Shi, Y., Zhang, J., Hu, L., Li, S., He, D., et al. (2023a). Traditional village building extraction based on improved mask R-CNN: a case study of Beijing, China. Remote Sens. 15 (10), 2616. doi:10.3390/rs15102616
Wang, Z., Zhu, P., Zhou, Y., Li, M., Lu, J., Huang, Y., et al. (2023b). Evidence of relieved urban heat island intensity during rapid urbanization through local climate zones. Urban Clim. 49, 101537. doi:10.1016/j.uclim.2023.101537
Xie, J., Zhou, S., Chung, L. C. H., and Chan, T. O. (2024). Evaluating land-surface warming and cooling environments across urban–rural local climate zone gradients in subtropical megacities. Build. Environ. 251, 111232. doi:10.1016/j.buildenv.2024.111232
Xing, D., He, H., Xie, G., Zhou, Z., He, C., and Li, L. (2022). Spatial and temporal change assessment and driving force analysis of Urumqi ecological environment based on RSEI. Environ. Resour. Ecol. J. 6 (5), 66–78. doi:10.23977/erej.2022.060508
Yang, C., Yan, F., and Zhang, S. (2020). Comparison of land surface and air temperatures for quantifying summer and winter urban heat island in a snow climate city. J. Environ. Manag. 265, 110563. doi:10.1016/j.jenvman.2020.110563
Yang, J., Shi, Q., Menenti, M., Wong, M. S., Wu, Z., Zhao, Q., et al. (2021a). Observing the impact of urban morphology and building geometry on thermal environment by high spatial resolution thermal images. Urban Clim. 39, 100937. doi:10.1016/j.uclim.2021.100937
Yang, J., Su, J., Xia, J., Jin, C., Li, X., and Ge, Q. (2018a). The impact of spatial form of urban architecture on the urban thermal environment: a case study of the Zhongshan District, Dalian, China. IEEE J. Sel. Top. Appl. Earth Observations Remote Sens. 11 (8), 2709–2716. doi:10.1109/jstars.2018.2808469
Yang, J., Yang, Y., Sun, D., Jin, C., and Xiao, X. (2021b). Influence of urban morphological characteristics on thermal environment. Sustain. Cities Soc. 72, 103045. doi:10.1016/j.scs.2021.103045
Yang, S., Ma, J., and Wang, J. (2018b). Reserch on spatial and temporal distribution of color steel building based on multi-source high-resolution satellite imagery. Int. Archives Photogrammetry, Remote Sens. Spatial Inf. Sci. 42, 2101–2105. doi:10.5194/isprs-archives-xlii-3-2101-2018
Yang, X., and Li, Y. (2015). The impact of building density and building height heterogeneity on average urban albedo and street surface temperature. Build. Environ. 90, 146–156. doi:10.1016/j.buildenv.2015.03.037
Yao, R., Wang, L., Huang, X., Zhang, W., Li, J., and Niu, Z. (2018). Interannual variations in surface urban heat island intensity and associated drivers in China. J. Environ. Manag. 222, 86–94. doi:10.1016/j.jenvman.2018.05.024
Yuan, Y., Wei, C., and Jing, Q. (2018). Research progress on urban surface thermal environment. Acta Ecol. Sin. 38, (03), 1134–1147.
Zhang, N., Yang, S., Fu, Y., Yan, H., and Xue, Q. (2022). Spatio-temporal agglometration characteristics of color steel plate buildings in Lanzhou and their influence on urban heat island effect. Geogr. Geogr. Inf. Sci. 38 (3). doi:10.3969/j.iss.1672-0504.2022.03.007
Zheng, D., Huang, X., Qi, M., Zhao, X., Zhang, Y., and Yang, M. (2023). Impact of built environment on urban surface temperature based on multi-source data at the community level in Beilin District, Xi’an, China. Environ. Sci. Pollut. Res. 30, 111410–111422. doi:10.1007/s11356-023-30119-1
Zhou, W., Cao, W., Wu, T., and Zhang, T. (2023). The win-win interaction between integrated blue and green space on urban cooling. Sci. Total Environ. 863, 160712. doi:10.1016/j.scitotenv.2022.160712
Keywords: color steel buildings (CSB), land surface temperature (LST), spatial and temporal evolution, contribution index (CI), correlation
Citation: Li Y, Yang S, Luo Y, Zhang Z and He P (2024) Influence of color steel buildings on urban land surface temperature: a case study in Urumqi, Xinjiang, China. Front. Environ. Sci. 12:1405581. doi: 10.3389/fenvs.2024.1405581
Received: 23 March 2024; Accepted: 23 May 2024;
Published: 20 June 2024.
Edited by:
Penghai Wu, Anhui University, ChinaReviewed by:
Subhanil Guha, National Institute of Technology Raipur, IndiaKamyar Fuladlu, Eastern Mediterranean University, Türkiye
Copyright © 2024 Li, Yang, Luo, Zhang and He. This is an open-access article distributed under the terms of the Creative Commons Attribution License (CC BY). The use, distribution or reproduction in other forums is permitted, provided the original author(s) and the copyright owner(s) are credited and that the original publication in this journal is cited, in accordance with accepted academic practice. No use, distribution or reproduction is permitted which does not comply with these terms.
*Correspondence: Shuwen Yang, eXN3MDQwOTY2QDE2My5jb20=