 Guoyu Wang
 Jie Shen
 Minghong Jin1*
- 1Southwest Electric Power Design Institute Co., Ltd., China Power Engineering Consulting Group, Chengdu, China
- 2Nanjing Atmospheric Environment and Green Development Research Institute, Nanjing, China
With the increase of extreme weather events such as cold waves, power transmission line icing has become more and more severe, affecting the safe and stable operation of power systems. Thus, icing prediction has become crucial for power grids. In this study, we collect multi-source data including the historical observations of meteorological elements and transmission line icing in Sichuan during 2017–2019, and develop an artificial intelligence (artificial intelligence)-based integrated model to achieve icing thickness prediction according to meteorological elements. Using the Weather Research and Forecasting model and the three-dimensional variational data assimilation method, we analyze the weather conditions in Sichuan of China during the 2020 winter, and obtain the high-precision meteorological element fields that are related to icing prediction. The forecasted meteorological elements are then combined with the AI-based integrated model to predict icing conditions, assisting in the warning of transmission line icing. The results indicate that the AI-based integrated model displays superior performance on the accurate prediction of icing thickness in the test set, with only two samples having prediction errors of more than 3 mm. Data assimilation can effectively improve the forecast accuracy of meteorological elements near icing observation stations and thus enhance the accuracy of icing thickness prediction. In particular, icing thickness prediction is remarkably improved at Gaoqiao, Laolinkou and Erlangshan stations.
1 Introduction
In the context of global warming, extreme events such as low temperature and cold waves have become more frequent, leading to an increase in the probability of transmission line icing in recent years (Li, 2023). Power transmission line icing can increase the load on transmission line conductors and towers, expand windward area and induce unstable oscillations of wires. These phenomena could lead to tower collapse and the breakage, torsion and flashover of transmission lines, and may further cause power accidents, posing a serious threat to the safe and stable operation of power grids (Wang et al., 2021) and resulting in severe socio-economic losses (Huo et al., 2021; Niu et al., 2021). China, one of the countries with the most frequent transmission line icing disasters, has always been concerned with icing disasters (Li et al., 2008). In 2008, a widespread freezing rain and snow disaster in southern China caused serious icing accidents on power grids, resulting in more than 8,000 damaged towers, over 20,000 disconnected power lines, and the shutdown of more than 1,000 substations. The direct economic losses reached 15 billion RMB, and the indirect socio-economic losses were incalculable (Li et al., 2008). Only accurate prediction and effective early warnings of transmission line icing conditions can realize the transition of icing prevention from “passive defense” to “active mitigation” (Zeng et al., 2022). Therefore, scholars have begun to extensively investigate the prediction of transmission line icing (Xiong et al., 2022).
Previous research on transmission line icing mainly includes two aspects. One is the theoretical analysis and numerical simulation of icing formation mechanisms and evolution laws (Xie, 2005; Jiang et al., 2010; Liu and Liu, 2011). The other is the analysis of the relationships between icing formation and different meteorological factors, which can be used to develop icing prediction models (Jones, 1998; Fu et al., 1998; Makkonen, 2000; Liao and Duan, 2010; Wu et al., 2012). Previous studies indicate the close relationships of transmission line icing to micro-meteorology, micro-topography and the transmission line itself. Various meteorological elements, such as temperature, humidity, wind speed and precipitation, have a certain correlation with the growth of wire icing thickness (Li, 2012). They found that icing forms when the environmental temperature is below the freezing temperature. Specifically, glaze occurs between −5°C and 0°C, rime forms between −15°C and −10°C, and mixed rime appears between −9°C and −3°C (He, 2022). Ambient humidity is also essential for icing formation. Only when atmospheric relative humidity exceeds 80%, transmission line icing is possible. The magnitude of relative humidity can affect the type of icing. Additionally, Hou et al. (2014) found that the growth of transmission line icing and ambient wind speed are not completely positive correlated. When the wind speed exceeds 6 m/s, it displays a hindering effect on icing growth.
The prediction models for transmission line icing can be mainly categorized into two types: physical mechanism-based prediction models and data-driven prediction models. Physical mechanism-based prediction models include the Imai model (Imai, 1953), Lenhard model (Lenhard, 1955), Goodwin model (Goodwin et al., 1983), Jones model (Jones, 1998) and Makkonen model (Makkonen, 1985). For instance, the Makkonen model, a combination of thermodynamics, fluid dynamics and meteorology, is able to provide a relatively accurate icing prediction. The Jones model is often used to predict glaze-type icing, focusing on the effects of precipitation and wind speed on wire icing. However, the microphysical processes of icing formation are determined by various factors. These physical models simplify the formation mechanisms of icing to some extent and are limited to specific types of icing. Hence, there are distinct shortcomings in the practical applications of these physical prediction models.
Data-driven prediction models predict icing thickness primarily by the correlation between various meteorological factors and icing formation. Based on the Markov chain model, Liu (2014) applied meteorological elements such as temperature, pressure, wind speed and relative humidity to predict future icing conditions of transmission lines, and the accuracy reached 80%. Historical observations from icing observation stations and Invariant Risk Minimization signals were employed to develop linear icing prediction models, yielding satisfactory results (Farzaneh and Savadjiev, 2005). Huang et al. (2017) applied a genetic algorithm for hyper-parameter optimization in the icing prediction model, in order to improve model accuracy. However, these basic statistical methods typically use linear models for icing prediction, without considering nonlinear conditions (Hao et al., 2019). With the advent of the era of big data and artificial intelligence (AI), more and more machine learning methods have been applied to various fields. Machine learning has certain advantages in dealing with model (Li, 2023). This hybrid model approach can dramatically improve the accuracy of transmission line icing prediction. Based on the historical observations of icing thickness and meteorological elements, Chen et al. (2020) predicted future icing thickness using a Long Short-Term Memory (LSTM) neural network model, and their prediction results were better than several other models.
Most of the studies mentioned above analyzed the performance of these models on icing prediction through historical data, and few focused on improving the forecast of meteorological elements that are related to wire icing. Accurate meteorological forecast data can provide better inputs to models, which is crucial for icing prediction. Yang (2021) optimized the forecasts of meteorological elements such as temperature, wind speed and precipitation based on numerical simulation and data assimilation techniques, aiming to provide accurate input fields for icing prediction. Some studies achieved certain results in icing thickness prediction by combining the Weather Research and Forecasting (WRF) numerical model with statistical forecasting models. Nevertheless, there has been limited research on combining numerical simulation methods and assimilation techniques to improve the performance of meteorological forecast models, and on integrating machine learning methods to build an icing prediction system.
Consequently, to address the limitations of previous research, we propose a method for simulating and forecasting transmission line icing based on data assimilation and an integrated model in this study. This method fully uses the long-term continuous observation data to conduct Frontier research on multi-source meteorological data assimilation methods, in order to output refined meteorological forecast fields. On this basis, an AI-based integrated model is employed to capture the relationships between historical meteorological forecast data and transmission line icing observations, which can obtain the real-time spatial distribution of power line icing and output the prediction results of icing thickness (Figure 1). These predictions of icing thickness can assist in solving the problem of power line icing warnings. The remainder of this paper is organized as follows. The data and methods are introduced in Section 2, including a stacking integrated model constructed by using historical observations of meteorological elements and power line icing in the Sichuan region during 2017–2019. In Section 3, based on a selected icing process in Sichuan during 2020, the WRF numerical model coupled with the Gridpoint Statistical Interpolation (GSI) system is used in this study to conduct an assimilation and simulation analysis for meteorological elements associated with icing. In section 4, the forecasted meteorological elements from the data assimilation are input into the integrated model for icing prediction. The main conclusions are summarized in section 5.

Figure 1. Technical flowchart of icing prediction based on the integrated model and assimilation forecast.
2 Materials and methods
2.1 Data
The data used in this study mainly include the model driving data, meteorological observations and icing observation data. The model driving data are the forecast data from the National Centers for Environmental Prediction Global Forecast System (GFS), with a horizontal resolution of 0.25° × 0.25° and a temporal resolution of 3 h. Additionally, the Moderate-Resolution Imaging Spectroradiometer digital elevation model dataset with a spatial resolution of 1 km is used for model initialization. The historical meteorological data and the icing observation data are employed to establish the nonlinear relationships between meteorological elements and icing thickness in the multi-model integration framework. The data used for data assimilation are derived from ground-based meteorological stations and alpine icing observation stations in the Sichuan region (Figure 2). The primary meteorological elements at these stations include air temperature, air pressure, wind speed, wind direction and moisture-related variables, with a temporal resolution of 1 h. The meteorological data and icing thickness observation data from these stations are also used for later verification and evaluation of the model forecast performance.
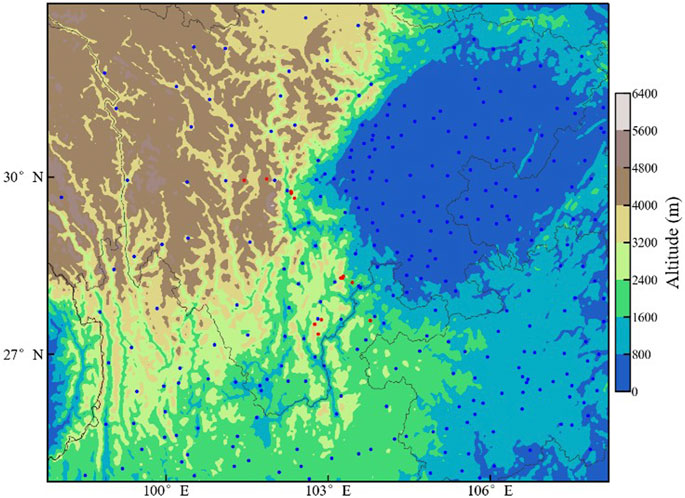
Figure 2. Topographic height (shade, m) and observation stations (red dots denote alpine icing observation stations; blue dots denote ground-based meteorological stations) in the simulation area.
2.2 Numerical model and data assimilation method
In this study, based on the regional numerical weather forecasting model (i.e., Advanced Research WRF (ARW) version 4.2.1) and the GSI version 3.5 assimilation system (Xu et al., 2016; Shen et al., 2018; Shen et al., 2019; Shen et al., 2020; Xu et al., 2021; Shen et al., 2024), we develop a multi-source data assimilation and forecasting system suitable for icing simulation in southwestern China. The overall framework consists of four modules (Figure 3), i.e., preprocessing modules for observations and model data, assimilation and model forecasting module, and icing calculation module. In this system, driven by the GFS global forecast field, the model performs data assimilation according to the data from ground-based meteorological stations and alpine icing observation stations, aiming to achieve fine-scale forecasts of meteorological elements within the simulation area and providing reliable inputs for icing thickness calculation.
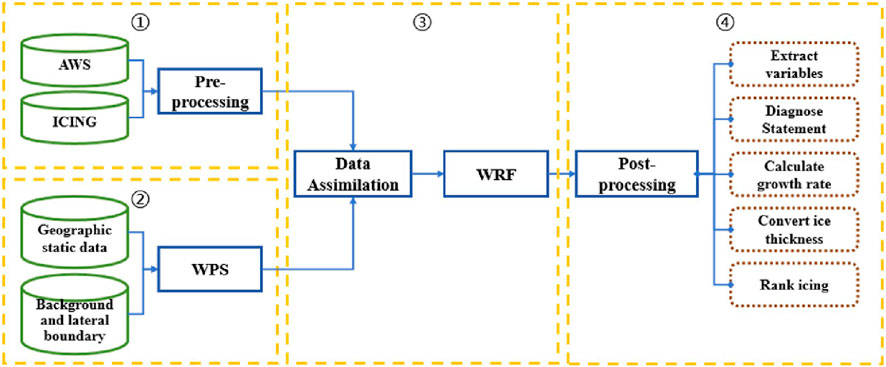
Figure 3. Framework for transmission line icing prediction based on assimilation and forecast model. There are four modules, namely, preprocessing for observation, preprocessing for model data, assimilation and forecast, and icing diagnosis.
In the WRF model, the model domain covers the region of 27°N–31°N, 101°E−105°E (Figure 2), the horizontal resolution of the single-layer grid is 3 km, and the grid size is 352 × 302. The vertical layers in the WRF model are set to 41, and the model top is at 50 hPa. The parameterization scheme configuration of the WRF model refers to multiple classic schemes (Liu et al., 2019; Shen et al., 2021; Shen et al., 2022; Wang et al., 2023; Xu et al., 2023), i.e., the Thompson microphysics scheme (Thompson et al., 2008), the Rapid Radiative Transfer Model longwave radiation scheme (Mlawer et al., 1997), the Dudhia shortwave radiation scheme (Dudhia, 1989), the Mesoscale Model 5 Monin-Obukhov near-surface layer scheme (Chen and Dudhia, 2001), the Noah Land Surface Model scheme (Ek et al., 2003) and the Yonsei University boundary layer scheme (Hong et al., 2006).
2.3 The prediction system
The flowchart of the transmission line icing forecast system is shown in Figure 4. There are mainly three modules, namely, historical dataset processing module, meteorological data assimilation and forecasting module, and the training and prediction module of the AI-based integrated model. The integrated model is primarily constructed and trained by historical meteorological and icing observations. Accurate meteorological forecast field data are obtained from the WRF model and the GSI assimilation system, and then they serve as the inputs of the trained integrated model, ultimately realizing icing thickness predictions.
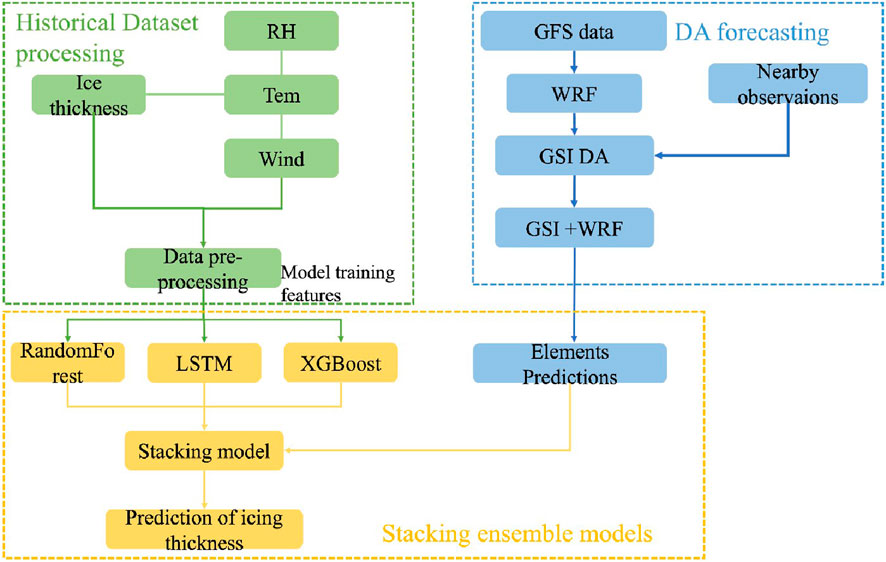
Figure 4. Flowchart of the prediction system for transmission line icing. There are three parts, namely, historical dataset processing, DA forecasting and stacking ensemble models.
3 Results and discussion
3.1 Icing thickness prediction based on the integrated model
3.1.1 Effects of meteorological elements on icing thickness
In this research, 360 pieces of icing data from 2017 to 2019 are collected to analyze the correlations of historical icing observations to meteorological elements, as shown in Figure 5. It can be found that air temperature, wind speed and relative humidity play essential roles in the growth of icing thickness, consistent with previous studies (Li, 2012). Particularly, air temperature and dew point temperature have considerable influences, with correlation coefficients of 0.54 and 0.56, respectively. The correlation coefficients of relative humidity and specific humidity with the icing observations are 0.38 and 0.51, respectively. Ambient temperature and relative humidity affect icing types. Therefore, despite the presence of lower temperature in many northern regions, transmission line icing may not appear due to the lack of relative humidity. In contrast, southern regions are relatively humid and are more prone to icing in low-temperature environment. In addition, ambient wind may increase the probability of collision between super-cooled water vapor and transmission lines, thus making icing phenomena more likely to occur.
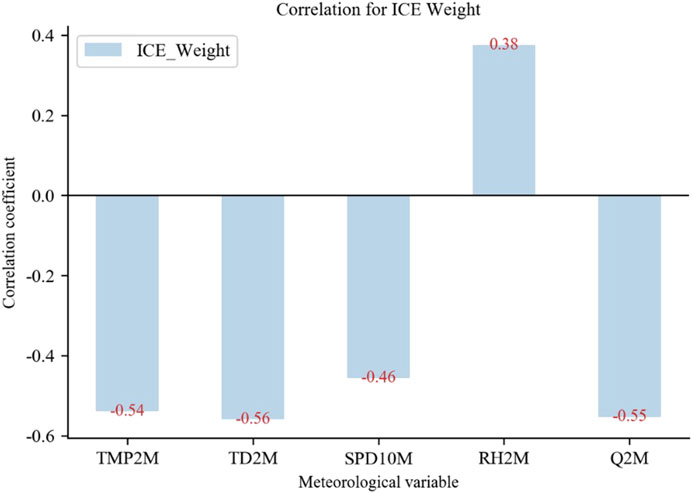
Figure 5. Correlation coefficients between observed icing thickness and different meteorological elements.
3.1.2 Construction of the icing prediction model
Among the 360 pieces of icing observation data from 2017 to 2019, the first 240 samples are selected for model training, while the remaining 120 samples are used for testing.
To construct the relationship between primary influencing factors and icing thickness, an integrated nested model is trained by using the historical feature data. This model adopts a stacking framework (Figure 6) and uses basic models such as Random Forest (RF), Extreme Gradient Boosting (XGBoost) and LSTM. The RF algorithm consists of multiple individual decision trees, and utilizes the voting mechanism to make decision classification and regression prediction. The number of nodes in each decision tree is randomly determined based on the number of sample features, which makes ensemble decision trees can have better prediction performance (Li and Zhou, 2020; Shi et al., 2020; Guan et al., 2021; Yu et al., 2021). The RF algorithm is widely applied due to its strong generalization ability and classification prediction performance (Lu et al., 2020). The XGBoost is a tree-based Boosting serial ensemble learning algorithm, which is an improved algorithm based on the Gradient Boosting Decision Tree. By optimizing objective functions, the XGBoost reduces the complexity of the model and improves the computational accuracy (Zhuang et al., 2021). Since the XGBoost performs well for low-dimensional data and can process nonlinear data, it is often used to analyze power-related data (Lu et al., 2023). The LSTM neural network is a deep learning algorithm optimized based on temporal recurrent neural networks. This algorithm was proposed to solve the spanning of long time series, which primarily addresses the gradient vanishing problem that exists in traditional recurrent neural networks in carrying out information memory (Huang and Luo, 2011). Icing variations exhibit obvious periodic patterns, and thus the features of time series should be considered when predicting transmission line icing (He, 2022). Through the stacking method, the integrated model comprehensively utilizes the advantages of individual models, which can obtain more accurate outputs of icing thickness based on the monitoring data.
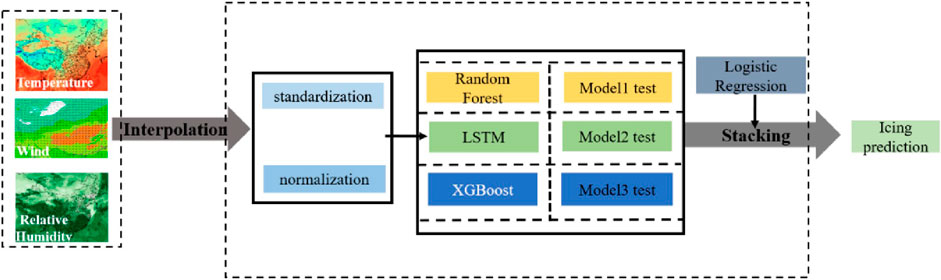
Figure 6. Schematic diagram of the multi-model integration framework. The left column shows the input features; the middle column shows the model stacking; the right column shows the model output.
Combining multiple processors, the framework works as a pipeline. From the input of basic feature to the final output of model prediction, all data can be transmitted through this pipeline. Each processor is responsible for processing data in certain way and transmitting the results to the next processor for the final prediction results.
The first part of this framework is the data preprocessing module, whose function is to separately normalize and standardize various input data with different features according to Eqs 1, 2.
where
where
The second part is a model stack of two model layers. The first model layer is named the base model layer, including three different models. Diverse meteorological element fields serve as input data for training labels in this layer. The second model layer is named the stacking layer, which is an embedded model built based on the base models.
The final part is the prediction output of the entire model. Model integration contributes crucially to the prediction results of the entire model. In this part, the base model layer consists of different basic model types, which can be selected from various modeling approaches. The predictions of these three base models are organized and merged to form a new feature set, which serves as an input to the next model layer. The stacking layer is trained based on the newly generated feature set. To ensure that the feature set adequately represents the features of the original training data, we consider the fitting ability of models when selecting training models in the base model layer. The primary objective of the base model layer is to automatically and effectively extract the characteristics of nonlinear variations from the original data. To avoid overfitting, we set relatively simple parameters in the stacking layer to enhance the generalization capability and accuracy.
The specific processes of stacking are as follows. First, the training dataset is randomly divided into five parts. Then, the XGBoost, RF and LSTM models are selected and trained by the five-fold cross-validation method in the base model layer. Actually, referred to previous studies (Ma et al., 2024), 5-fold cross validation (CV) is also used to adjust the model and to avoid the over-fitting problem in this study. The five sets of predictions are vertically stacked and concatenated to form a new feature dataset (Figure 7).
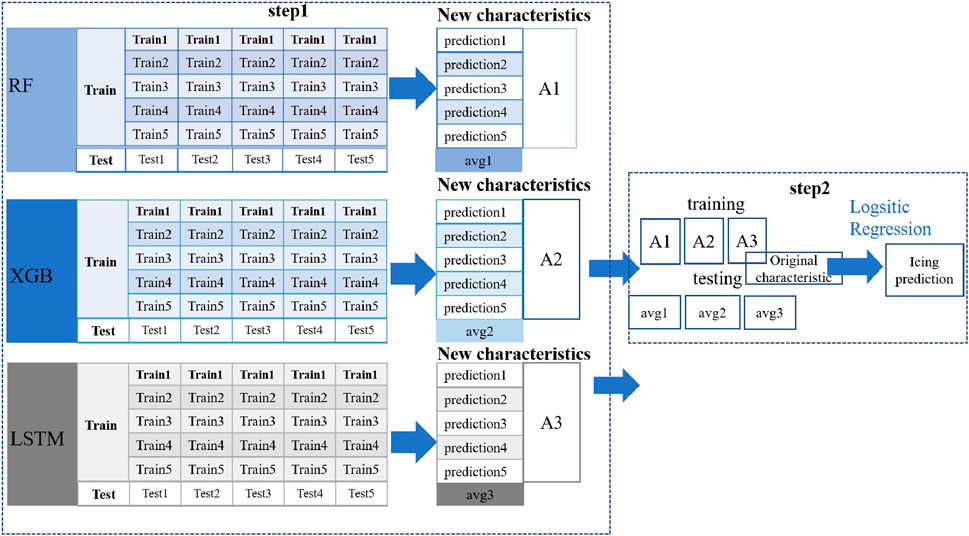
Figure 7. The special integration processes of the stacking model.
Subsequently, in the base model layer, the three basic models generate three new feature sets, denoted as A1, A2 and A3. The gradient boosting model then predicts the test set using these new feature sets and the original input feature set.
In the process of model stacking, the predictions in the base model layer and the original features are merged and incorporated into the training of the stacking-layer model to achieve nesting. This approach enhances the prediction accuracy of the model and simultaneously avoids overfitting.
Through model integration, it can be found that the predicted icing thickness is close to the actual values in the test set, as shown in Figure 8. There are 42 samples with errors smaller than 0.5 mm, and only two samples with errors exceeding 3 mm. The stacking model results are better than the three single models due to the integration. These relatively small errors between the predictions and actual values indicate a good agreement between them.
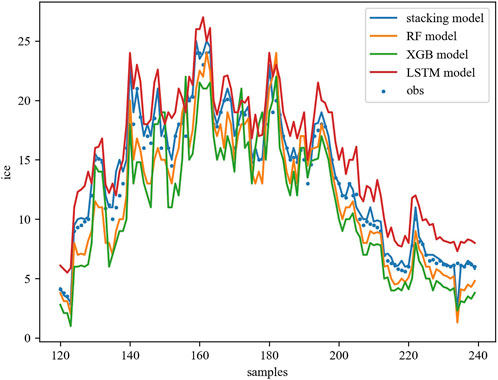
Figure 8. Icing thickness predictions from the stacking model (line) and the icing thickness observations (dots).
3.2 Fined forecasts of meteorological elements
3.2.1 Numerical simulation of icing process
Through the numerical assimilation framework of the WRF + GSI system, the icing process during December 12–20, 2020 is simulated. Table 1 presents the daily accumulated icing thickness observations from several icing observation stations in Southwest China during this period. It can be observed that the icing thickness at multiple icing observation stations exceeded 30 mm and persisted for a considerable duration.
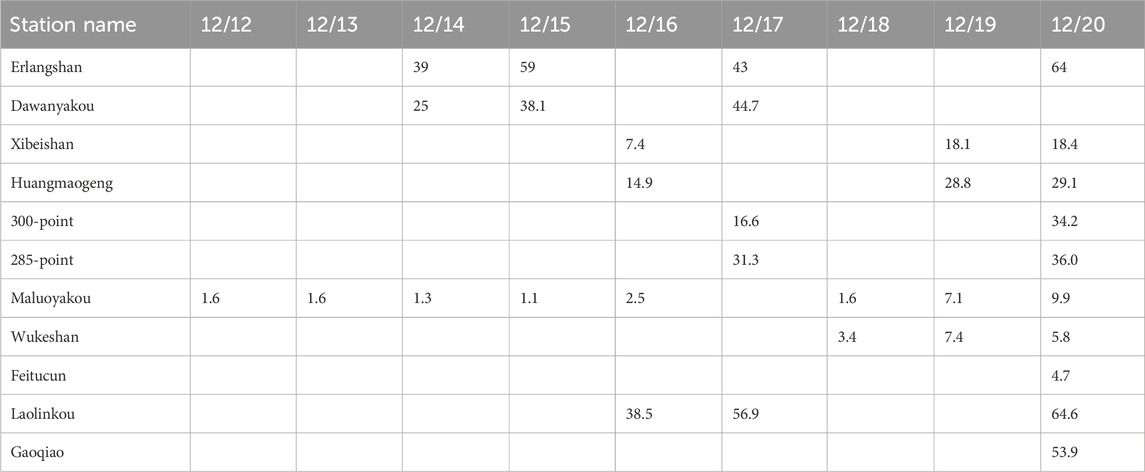
Table 1. Accumulated icing thickness observations (mm) from several icing observation stations during December 12–20, 2020.
To analyze the impact of assimilating observation data on model simulations, we conduct a comparison experiment, namely, the control (CTL) experiment without assimilation and the comparative (VAR) experiment with data assimilation. Except for the differences in assimilation, all parameterization schemes of the model remain identical. Both experiments use the GFS forecast data as the model initial and boundary conditions. The “cold-start” assimilation is performed every 12 h, and the forecasts are conducted at the leading time of 72 h. Subsequently, the impact of data assimilation on the analysis and forecast fields is discussed according to the model results.
3.2.2 Forecast results of the model
Figure 9 illustrates the spatial distributions of the maximum, minimum and average increments of horizontal wind, temperature and specific humidity in the VAR experiment relative to the CTL experiment across the domain. The results indicate that assimilating conventional observation data increases the wind speed in the southern-central parts of Yunnan and Guizhou, adjusts the temperature distribution in southern Qinghai and northern Sichuan, and has a certain weakening effect on the specific humidity in the central part of the study area. Figure 10 shows the variation of the zonal mean of these four meteorological elements with model levels and longitude. It can be observed that the influence of assimilating surface observation data is concentrated in the lower layers. The vertical affected areas for temperature and moisture are considerably lower than those for wind speed, which is determined by the scale factor of the variational assimilation.
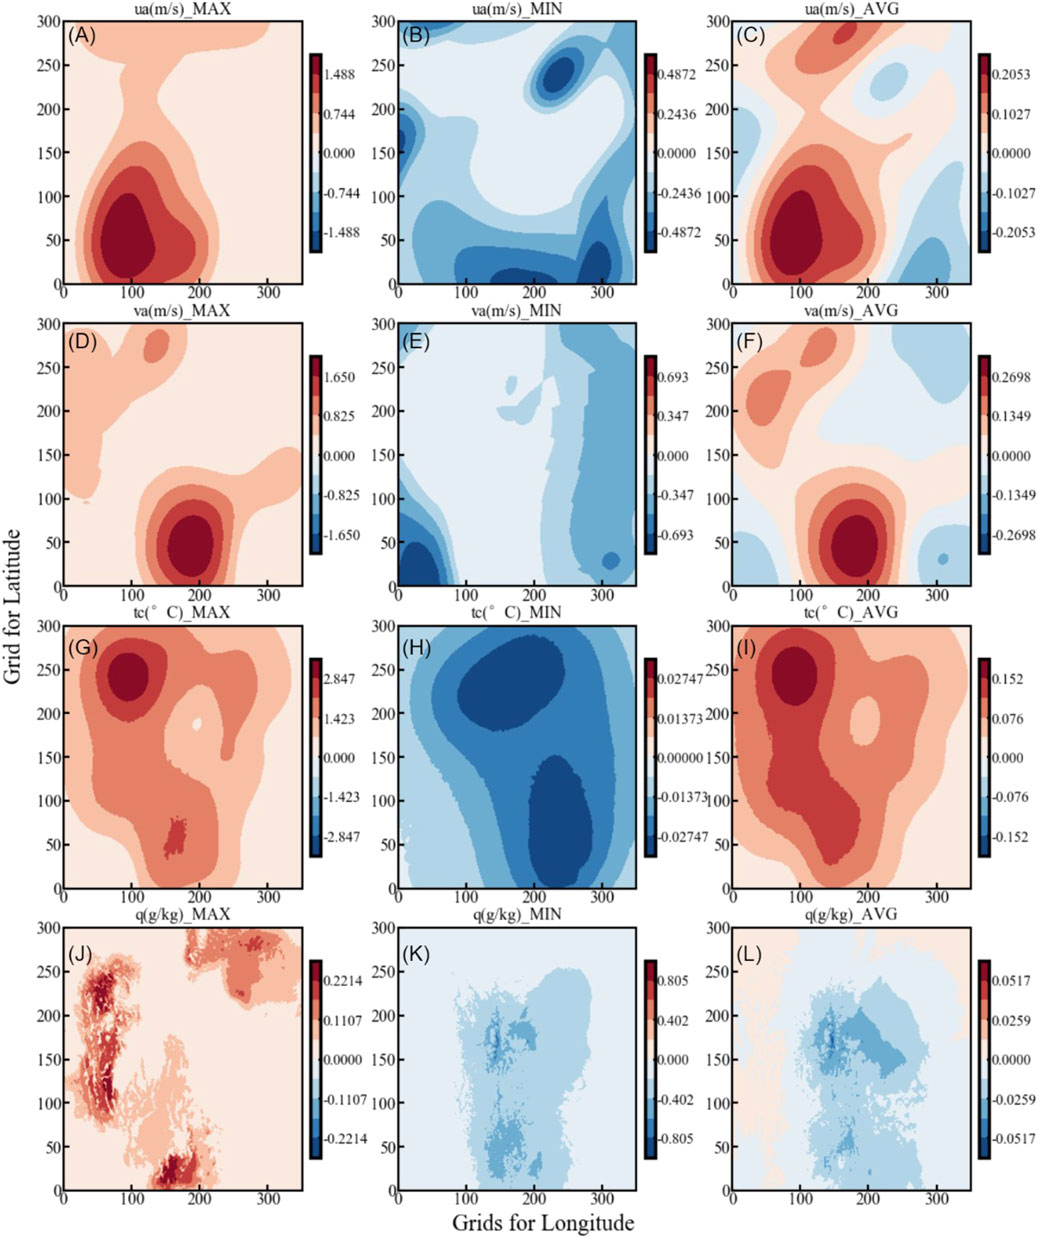
Figure 9. Distributions of maximum (left column), minimum (central column), and average (right column) analysis increments (VAR-CTL) for meteorological variables in the vertical direction.
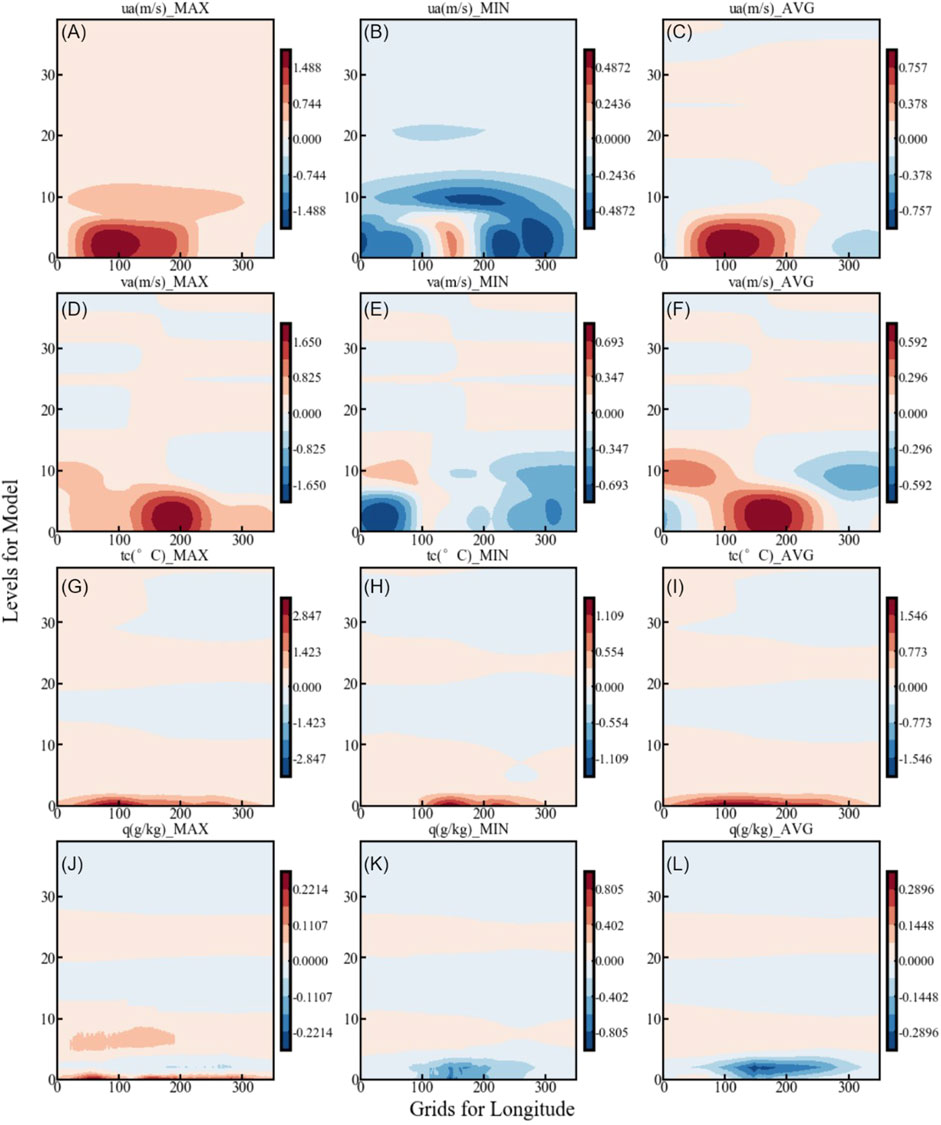
Figure 10. Distributions of maximum (left column), minimum (central column), and average (right column) analysis increments (VAR-CTL) for meteorological variables in the zonal direction.
3.2.3 Evaluation of the meteorological element forecasts
Due to the remarkable correlations of meteorological elements with icing thickness, the improvement of their forecast accuracy is crucial for icing thickness prediction. The region of 27°N–31°N, 101°E−105°E is selected as the focus area, and the mean error (ME, Eq. 3) and the root mean square errors (RMSE, Eq. 4) would been calculated based on formulas as follows,
where
Figure 11 depicts the variations in the MEs from ground-based meteorological stations of the four meteorological elements (horizontal wind speed, temperature, relative humidity and specific humidity) near the icing observation stations with forecast leading time. Both the CTL and VAR experiments exhibit certain diurnal variations in the MEs of the four elements. Specifically, the error of temperature and wind speed shows notable peaks before 1000 UTC and after 2000 UTC each day, while the maximum MEs of relative humidity and specific humidity appear before 1000 UTC and around 2000 UTC. In terms of the magnitude of errors, the MEs of the temperature and wind speed forecasts remain less than 2°C and 2 m·s−1, respectively, whereas the moisture-related elements show negative MEs. Overall, the forecasts tend to be warmer and drier than the observations, and they tend to overestimate wind speed. Furthermore, comparing the results of the two experiments, the VAR experiment (with the assimilation of observation data) shows advantages in simulating the moisture-related elements, such as specific humidity, especially in the first 24 h of forecasts. Similar results can be found in the statistical results of the RMSE presented in Figure 12. However, the effects of assimilation on the 2-m temperature forecasts and 10-m wind speed forecasts are not obvious. It can be concluded that data assimilation improves the forecast accuracy of meteorological elements and can enhance the accuracy of the subsequent calculations of the icing thickness model.
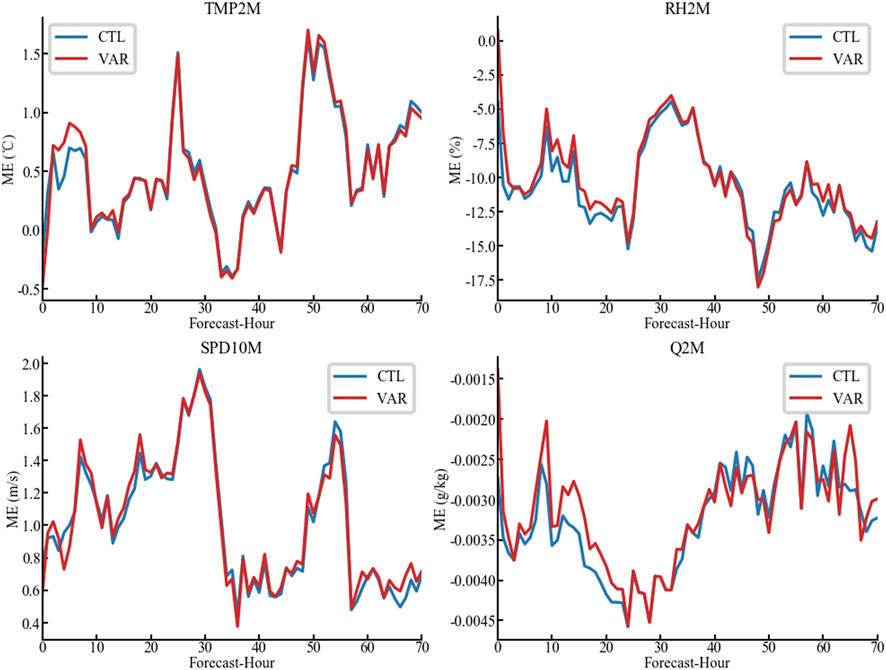
Figure 11. Time series of ME for TMP2M, RH2M, SPD10M and Q2M calculated from CTL (blue) and VAR (red).
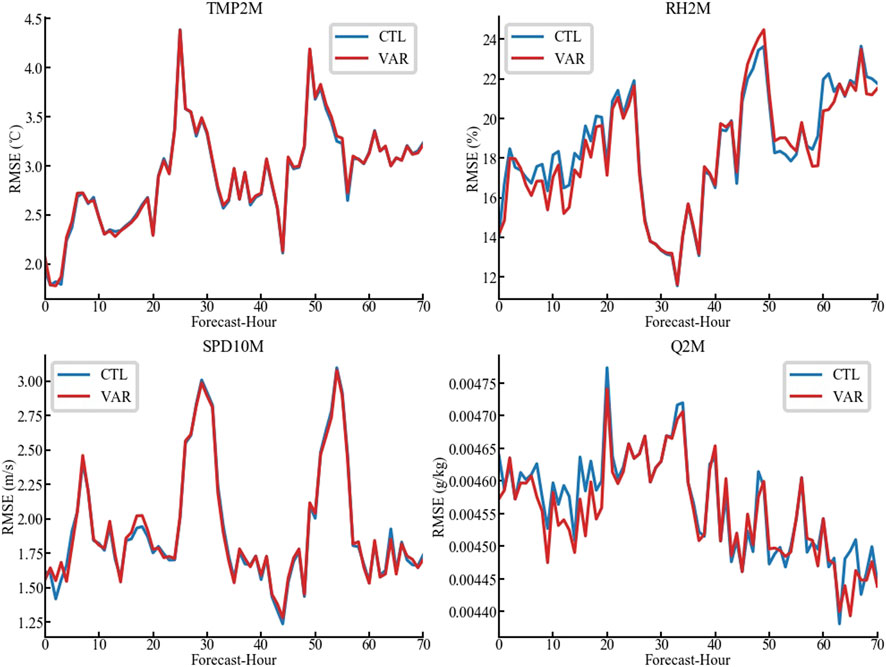
Figure 12. Time series of RMSE for TMP2M, RH2M, SPD10M and Q2M calculated from CTL (blue) and VAR (red).
3.3 Icing prediction system
The forecast results from the WRF + GSI assimilation system are input into the trained integrated icing thickness forecast model based on meteorological elements, which finally outputs the icing thickness and warning levels in the study region.
Figure 13 presents the icing thickness predictions from the CTL and VAR experiments initiated from 0000 UTC on December 14 with different forecast leading times, as well as the difference between the two experiments (VAR−CTL). The results suggest that the icing during the simulation period is mainly distributed along the mountain ranges in Sichuan Province, roughly located between the mountain ranges and the basin, extending southward to the Yunnan-Guizhou Plateau, which is consistent with the spatial distribution of historical icing observations. Furthermore, regarding the variations in the icing thickness distribution with different forecast leading times, icing during the study period mainly appears around Erlangshan, Huangmaogeng, and Laolinkou stations, whereas icing is not observed near Feitu Village and Zheduo Mountain. This result is consistent with the station observations (the icing thickness has diurnal variations starting on December 14 shown in Table 1.
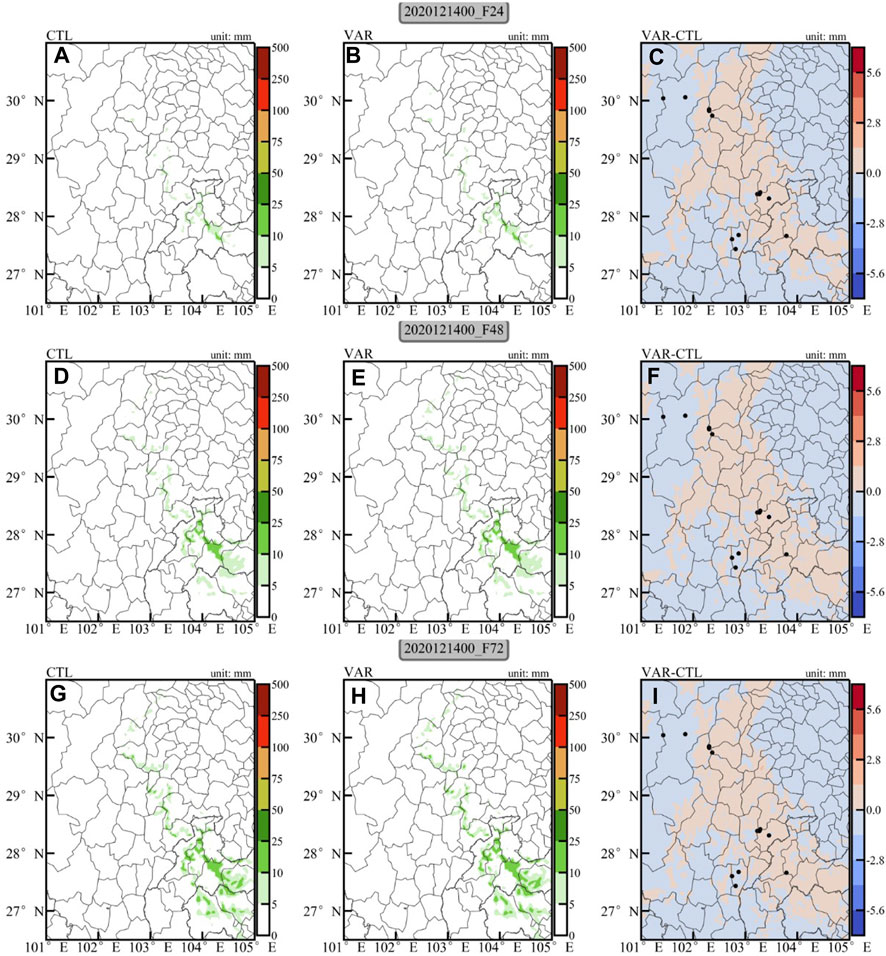
Figure 13. Distributions of ice thickness (mm) forecast calculated from CTL (left column), VAR (middle column) and their differences (VAR-CTL, right column) initiated from 0000 UTC on 14 December 2020. Black dots denote alpine icing observation stations.
Overall, the CTL experiment successfully forecasts the general distribution of icing observations during the simulation period, but the icing thickness is underestimated. The assimilation of conventional observation data adjusts the meteorological element fields near the icing observation stations to a certain extent, thereby improving the predictions of icing thickness. Positive adjustment is particularly notable at Gaoqiao, Laolinkou and Erlangshan stations.
According to the icing thickness forecasts, icing warning can be divided into four levels: no-icing level (icing thickness
Figure 14 illustrates the warning distribution of the 24-h, 48-h and 72-h icing forecasts initiated from 0000 UTC on December 14. Apparently, with the increase of forecast leading time, the predominant icing warning levels of the forecasts near Huangmaogeng, Erlangshan and Gaoqiao stations tend to be the light-icing level, while Laolinkou station exhibits the moderate-icing level. The forecasted icing warning levels are relatively weaker than the actual observations. In terms of the forecasted icing warning levels at each observation station, the results from the two experiments are close, with relatively small differences, which may be determined by the characteristics of this icing process.
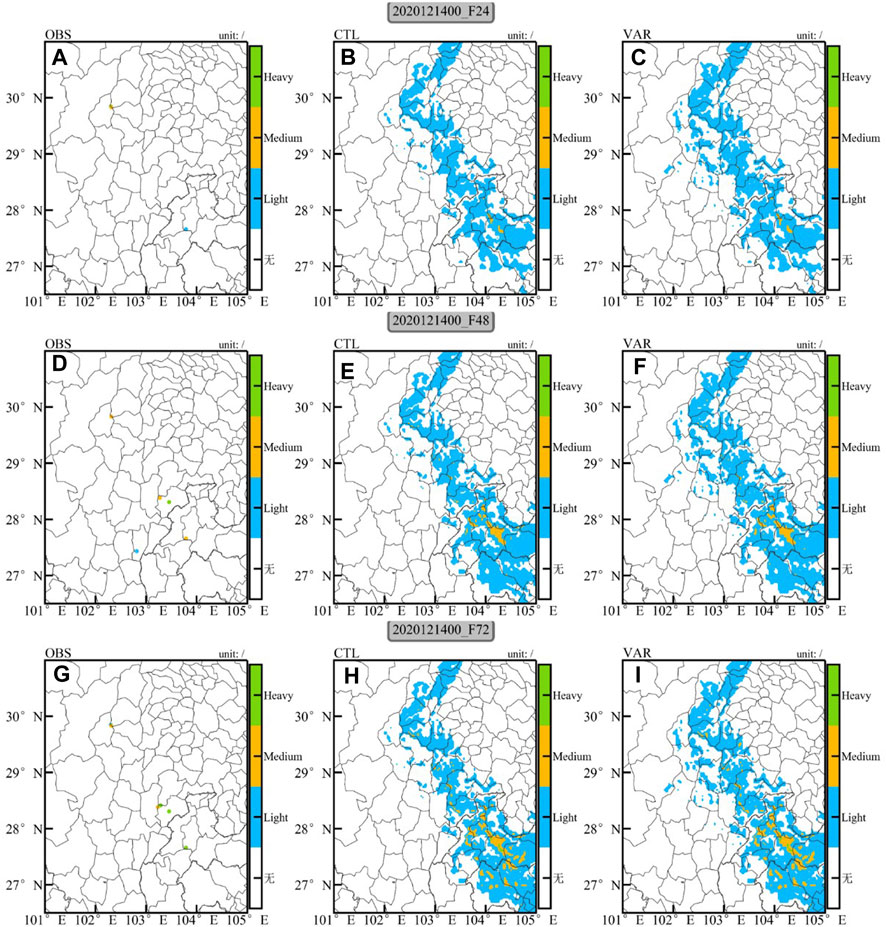
Figure 14. Distributions of ice level forecast calculated from OBS (left column), CTL (middle column) and VAR (right column) initiated from 0000 UTC on 14 December 2020.
4 Conclusion
Meteorological elements may effect the formation of transmission line icing. Particularly, temperature, wind speed and relative humidity contribute considerably to icing thickness growth. Based on the historical observations during 2017–2019, we employ an integrated nested framework with Random Forest, XGBoost and LSTM methods, and combine the advantages of different models to establish the nonlinear relationships between different meteorological elements and icing thickness. The predicted data from the integrated model can be well fitted to the actual icing thickness in the test set, with 42 samples exhibiting small errors (less than 0.5 mm) and only two samples exhibiting the errors more than 3 mm.
The numerical forecast and assimilation framework based on the WRF + GSI system is used to simulate and analyze the weather conditions in the Sichuan region during an icing event in 2020. The numerical forecasts slightly overestimate the temperature and wind speed while underestimate the humidity. After the assimilation of observation data, the numerical model exhibits clear advantages in simulating moisture-related variables such as specific humidity, particularly within the first 24-h. Although the model can predict the general distribution of icing area, the icing thickness is notably underestimated. The assimilation of conventional observation data can adjust the meteorological element fields near icing observation stations to a certain extent, thus improving the icing thickness prediction, especially at Gaoqiao, Laolinkou and Erlangshan stations. With the increase of forecast leading time, the forecasted icing warning at Huangmaogeng, Erlangshan and Gaoqiao stations is primarily the light-icing level, while the moderate-icing level at Laolinkou station and its vicinity. The forecasted icing warning levels are relatively weaker than the actual observations. In addition, the forecasted icing levels from both experiments at all observation stations tend to be close, with relatively small differences, which is likely attributed to the specific characteristics of this icing process.
In summary, the assimilation experiment improves the icing thickness prediction by adjusting the forecasts of meteorological elements near the icing observation stations. The predicted icing warning levels are similar at all icing observation stations, and their differences are smaller between the two experiments with and without data assimilation, which may be determined by the specific characteristics of this icing event. However, the results from the numerical simulations with data assimilation and the stacking model for long-term icing thickness forecasts differ from the actual observation to some extent, and the icing thickness prediction still needs to be further optimized. One reason for this result is the errors in the forecasted meteorological factors by numerical simulations with data assimilation, and the other reason is the errors in the forecasts from the integrated model.
Data availability statement
The original contributions presented in the study are included in the article/supplementary material, further inquiries can be directed to the corresponding author.
Author contributions
GW: Writing–original draft, Writing–review and editing. JS: Writing–original draft, Writing–review and editing. MJ: Writing–original draft, Writing–review and editing. SH: Writing–original draft, Writing–review and editing. ZL: Writing–original draft, Writing–review and editing. XG: Writing–original draft, Writing–review and editing.
Funding
The author(s) declare that no financial support was received for the research, authorship, and/or publication of this article.
Acknowledgments
The valuable comments and suggestions of editors and reviewers are gratefully acknowledged.
Conflict of interest
Authors GW, MJ, SH, ZL, and XG were employed by Southwest Electric Power Design Institute Co., Ltd., China Power Engineering Consulting Group.
The remaining author declares that the research was conducted in the absence of any commercial or financial relationships that could be construed as a potential conflict of interest.
Publisher’s note
All claims expressed in this article are solely those of the authors and do not necessarily represent those of their affiliated organizations, or those of the publisher, the editors and the reviewers. Any product that may be evaluated in this article, or claim that may be made by its manufacturer, is not guaranteed or endorsed by the publisher.
References
Chen, F., and Dudhia, J. (2001). Coupling an advanced land surface–hydrology model with the Penn State–NCAR MM5 modeling system. Part I: model Implementation and Sensitivity. Mon. Wea. Rev. 129 (4), 569–585. doi:10.1175/1520-0493(2001)129<0569:caalsh>2.0.co;2
Chen, Y. G., Gao, W., Lin, H. W., Ruan, Z. H., Zheng, W. C., Lin, F., et al. (2020). Study of an icing prediction model for transmission line based on long and short-term memory network. Electrotech. Electr. (3), 5–11.
Dudhia, J. (1989). Numerical study of convection observed during the winter monsoon experiment using a mesoscale two-dimensional model. J. Atmos. Sci. 46 (20), 3077–3107. doi:10.1175/1520-0469(1989)046<3077:nsocod>2.0.co;2
Ek, M. B., Mitchell, K. E., Lin, Y., Rogers, E., Grunmann, P., Koren, V., et al. (2003). Implementation of Noah land surface model advances in the national Centers for environmental prediction operational mesoscale eta model. J. Geophys. Res. 108 (22). doi:10.1029/2002jd003296
Farzaneh, M., and Savadjiev, K. (2005). Statistical Analysis of field data for precipitation icing accretion on overhead power lines. IEEE Trans. Power Deliv. 20 (2), 1080–1087. doi:10.1109/tpwrd.2004.838518
Goodwin, E., Mozer, J. D., Digioia, A. M. J., and Power, B. A. (1983). Predicting ice and snow loads for transmission line design (Hanover: Proceedings of the First IWAIS).
Guan, X. Q., Wang, W. J., Pang, J. F., and Meng, Y. F. (2021). Space transformation based random forest algorithm. J. Comput. Res. Dev. 58 (11), 2485–2499.
Hao, Y., Yao, Z., Wang, J., Li, H., Liang, W., Yang, L., et al. (2019). A classification method for transmission line icing process curve based on hierarchical k-means clustering. Energies 12 (24), 4786. doi:10.3390/en12244786
He, J. Z. (2022) Research on stacking model and prediction of ice cover on transmission lines. Yunnan: Kunming University of Science and Technology.
Hong, S. Y., Noh, Y., and Dudhia, J. (2006). A new vertical diffusion package with an explicit treatment of entrainment processes. Mon. Wea. Rev. 134 (9), 2318–2341. doi:10.1175/mwr3199.1
Huang, J., and Luo, X. S. (2011). Application of BP neural network in ice accretion over transmission line. J. Guangxi Normal Univ. Nat. Sci. Ed. 29, 25–27. doi:10.16088/j.issn.1001-6600.2011.04.004
Huang, X. B., Li, H. B., Zhu, Y. C., Wang, Y. X., Zheng, X. X., and Wang, Y. G. (2017). Short-term forecast for transmission line icing by times series analysis and Kalman Filtering. High. Volt. Eng. 43 (06), 1943–1949. doi:10.13336/j.1003-6520.hve.20170527027
Huo, Z. G., Li, C. H., Kong, R., Mao, H. D., Jiang, M. Y., and Song, Y. L. (2021). Review on disaster of wire icing in China. J. Appl. Meteor. Sci. 32 (5), 513–529.
Jiang, X. L., Sun, C. X., Gu, L. G., and Lu, C. H. (1998). Power lines icing characteristics of the Three Gorges District and a model of the accumulation of ice on electric on electric power lines. J. Chongqing Univ. Nat. Sci. Ed. 21 (2), 16–19.
Jiang, Z. H., Liu, D., Liu, Y., Xiong, H. X., and Ju, X. H. (2010). Study on the probability distribution simulation of conductor icing and its application test. Trans. Atmos. Sci. 33 (4), 385–394. doi:10.13878/j.cnki.dqkxxb.2010.04.001
Jones, K. F. (1998). A simple model for freezing rain ice loads. Atmos. Res. 46 (1), 87–97. doi:10.1016/s0169-8095(97)00053-7
Lenhard, R. W. (1955). An indirect method for estimating the weight of glaze on wires. Bull. Amer. Meteor. Soc. 36 (1), 1–5. doi:10.1175/1520-0477-36.1.1
Li, C. X. (2023) Research on prediction of transmission line icing thickness based on WRF and a hybrid model of machine learning. Lanzhou: Lanzhou University.
Li, F. Y., and Zhou, G. (2020). Data reconstruction in wireless network based on feature selection and optimized random forests. J. Shanghai Univ. Electr. Power 36 (3), 251–258. doi:10.3969/j.issn.2096-8299.2020.03.009
Li, Q. (2008). Analysis of the freezing rain and frost disaster of Year 2008 and its significance to power grid. Electr. Power Constr. 29 (6), 18–21.
Li, Q. F., Fan, Z., Wu, Q., Gao, J., Su, Z. Y., and Zhou, W. J. (2008). Investigation of ice-covered transmission lines and analysis on transmission line failures caused by ice-coating in China. Power Syst. Technol. 32 (9), 33–36.
Li, Q. M. (2012) Research on Data-driven method of ice load forecasting Model for transmission lines. Yunnan: Yunnan University.
Li, T., Shi, X., and Cao, N. (2021) Combined prediction method of transmission line icing based on ARIMA-CSSVR, 63–69.
Liao, Y. F., and Duan, L. J. (2010). Study on estimation model of wire icing thickness in Hunan Province. Trans. Atmos. Sci. 33 (4), 395–400. doi:10.13878/j.cnki.dqkxxb.2010.04.016
Liu, C. (2014). Research of transmission lines icing thickness prediction model based on Markov process (Beijing: North China Electric Power University).
Liu, C. C., and Liu, J. (2011). Ice accretion mechanism and glaze loads model on wires of power transmission lines. High. Volt. Eng. 37 (1), 241–248. doi:10.13336/j.1003-6520.hve.2011.01.034
Liu, S. F., Lu, Z. Q., Han, Y. X., Li, Z., and Liang, Y. (2019). Simulation on ice thickness of transmission line in Guizhou Province in early 2008 – based on weather research and forecasting (WRF) model couple with ice acceleration forecast system. Sci. Technol. Eng. 19 (8), 303–309.
Lu, C. G., Ge, M. L., Song, L., Wu, J. L., and Pan, G. B. (2023). A prediction method of provincial power substitution potential based on Lasso-XGBoost-Stacking. Zhejiang Electr. Powe 42 (9), 9–16. doi:10.19585/j.zjdl.202309002
Lu, M., Zhao, S. J., Liu, Z. S., Yang, X. H., Li, Z., and Song, L. B. (2020). Early warning method of transmission line galloping based on random forest optimized by grey relation projection. Electr. Meas. Instrum. 57 (9), 45–51. doi:10.19753/j.issn1001-1390.2020.09.007
Ma, X. X., Liu, H. N., Dong, Q. S., Chen, Q. Z., and Cai, N. H. (2024). Statistical post-processing of multiple meteorological elements using the multimodel integration embedded method. Atmos. Res. 301, 107269. doi:10.1016/j.atmosres.2024.107269
Makkonen, L. (1985). Heat transfer and icing of a rough cylinder. Cold Regions Sci. Technol. 10 (2), 105–116. doi:10.1016/0165-232x(85)90022-9
Makkonen, L. (2000). Models for the growth of rime, glaze, icicles and wet snow on structures. Phil. Trans. R. Soc. Lond. A 358 (1776), 2913–2939. doi:10.1098/rsta.2000.0690
Mlawer, E. J., Taubman, S. J., Brown, P. D., Iacono, M. J., and Clough, S. A. (1997). Radiative transfer for inhomogeneous atmospheres: RRTM, a validated correlated-k model for the longwave. J. Geophys. Res. 102 (d14), 16663–16682. doi:10.1029/97jd00237
Niu, S. J., Wang, T. S., Lv, J. J., Zhou, Y., and Wang, Y. (2021). New advances in research on power line icing and pavement temperature. Trans. Atmos. Sci. 44 (4), 485–495. doi:10.13878/j.cnki.dqkxxb.20210309001
Shen, F. F., Shu, A. Q., Liu, Z. Q., Li, H., Jiang, L. P., Zhang, T., et al. (2024). Assimilating FY-4A AGRI Radiances with a channel-sensitive cloud detection scheme for the analysis and forecasting of multiple typhoons. Adv. Atmos. Sci. 41, 937–958. doi:10.1007/s00376-023-3072-z
Shen, F. F., Song, L. X., Li, H., He, Z. X., and Xu, D. M. (2022). Effects of different momentum control variables in radar data assimilation on the analysis and forecast of strong convective systems under the background of northeast cold vortex. Atmos. Res., 01698095.
Shen, F. F., Xu, D. M., Li, H., and Liu, R. X. (2021). Impact of radar data assimilation on a squall line over the Yangtze-Huaihe River Basin with a radar reflectivity operator accounting for ice-phase hydrometeors. Meteorol. Appl. 28 (2). doi:10.1002/met.1967
Shen, F. F., Xu, D. M., and Min, J. Z. (2019). Effect of momentum control variables on assimilating radar observations for the analysis and forecast for Typhoon Chanthu (2010). Atmos. Res. 230, 104622. doi:10.1016/j.atmosres.2019.104622
Shen, F. F., Xu, D. M., Min, J. Z., Chu, Z. G., and Li, X. (2020). Assimilation of radar radial velocity data with the WRF Hybrid 4DEnVar system for the prediction of Hurricane Ike (2008). Atmos. Res. 234, 104771. doi:10.1016/j.atmosres.2019.104771
Shen, F. F., Xu, D. M., Xue, M., and Min, J. Z. (2018). A comparison between EDA-EnVar and ETKF-EnVar data assimilation techniques using radar observations at convective scales through a case study of Hurricane Ike (2008). Meteorol. Atmos. Phys. 130, 649–666. doi:10.1007/s00703-017-0544-7
Shi, J. Y., Yang, Z. Y., and Xie, X. (2020). Algorithm of random forest based on fuzzy decision. Comput. Eng. Des. 41 (8), 2207–2212. doi:10.16208/j.issn1000-7024.2020.08.019
Sun, W., and Wang, C. (2019). Staged icing forecasting of power transmission lines based on icing cycle and improved extreme learning machine. J. Clean. Prod. 208, 1384–1392. doi:10.1016/j.jclepro.2018.10.197
Thompson, G., Field, P. R., Rasmussen, R. M., and Hall, W. D. (2008). Explicit forecasts of winter precipitation using an improved Bulk microphysics scheme. Part II: implementation of a new snow parameterization. Mon. Wea. Rev. 132 (12), 5095–5115. doi:10.1175/2008mwr2387.1
Wang, Q., Zhou, S., Zhang, H., Su, H., and Zheng, W. (2021) “Prediction of conductor icing thickness based on random forest and WRF models,” in International conference on intelligent computing, automation and applications (ICAA).
Wang, S., Li, J. S., Yuan, H., Lu, Z. M., Hu, F., and Zhao, Q. (2023). Simulation study on ice thickness of transmission line in complex terrain based on WRF model couple with CALMET downscaling model. Trans. Atmos. Sci. 234.
Wu, X., Sun, P. J., Xiong, H. X., and Yuan, Q. (2012). A conductor icing model based on parameters of conventional meteorological observations. Trans. Atmos. Sci. 35 (3), 335–341. doi:10.13878/j.cnki.dqkxxb.2012.03.001
Xie, Y. H. (2005). The relation between meteorological elements and ice accretion in Three Gorges region. Electr. Power 38 (3), 35–39.
Xiong, W., Xu, H., Xu, L. X., Zhu, K. F., and Yi, B. S. (2022). Combined model of icing prediction of transmission lines based on RF-APJA-MKRVM considering time cumulative effect. High. Volt. Eng. 48 (3), 948–957. doi:10.13336/j.1003-6520.hve.20210151
Xu, D. M., Liu, Z. Q., Fan, S. Y., Chen, M., and Shen, F. F. (2021). Assimilating all-sky infrared radiances from Himawari-8 using the 3DVar method for the prediction of a severe storm over North China. Adv. Atmos. Sci. 38, 661–676. doi:10.1007/s00376-020-0219-z
Xu, D. M., Min, J. Z., Shen, F. F., Ban, J. M., and Chen, P. (2016). Assimilation of MWHS radiance data from the FY-3B satellite with the WRF Hybrid-3DVAR system for the forecasting of binary typhoons. J. Adv.Model. Earth Sy. 8 (2), 1014–1028. doi:10.1002/2016ms000674
Xu, D. M., Zhang, X. W., Liu, Z. Q., and Shen, F. F. (2023). All-sky infrared radiance data assimilation of FY-4A AGRI with different physical parameterizations for the prediction of an extremely heavy rainfall event. Atmos. Res. 293, 106898. doi:10.1016/j.atmosres.2023.106898
Yu, A. C., Chu, M. X., Yang, Y. H., and Dong, X. (2021). Decision tree algorithm with reinforcement learning strategy. J. Hefei Univ. Technol. Nat. Sci. 44 (5), 616–620.
Zeng, H. R., Yang, Q., Ma, Q. F., Cao, J., Gao, Z. H., Wu, J. R., et al. (2022). Design of auxiliary decision-making system for transmission lines icing disposal based on tisk rating and pre-scheduling of power grid. Power Syst. Big Data 25 (04), 9–17. doi:10.19317/j.cnki.1008-083x.2022.04.007
Keywords: WRF model, three-dimensional variational data assimilation, icing prediction, artificial intelligence model, model integration
Citation: Wang G, Shen J, Jin M, Huang S, Li Z and Guo X (2024) Prediction model for transmission line icing based on data assimilation and model integration. Front. Environ. Sci. 12:1403426. doi: 10.3389/fenvs.2024.1403426
Received: 21 March 2024; Accepted: 06 May 2024;
Published: 27 May 2024.
Edited by:
Feifei Shen, Nanjing University of Information Science and Technology, ChinaCopyright © 2024 Wang, Shen, Jin, Huang, Li and Guo. This is an open-access article distributed under the terms of the Creative Commons Attribution License (CC BY). The use, distribution or reproduction in other forums is permitted, provided the original author(s) and the copyright owner(s) are credited and that the original publication in this journal is cited, in accordance with accepted academic practice. No use, distribution or reproduction is permitted which does not comply with these terms.
*Correspondence: Minghong Jin, bWhqQHN3ZXBkaS5jb20=