 Xin Ma
 Jie Li2
- 1College of Science of Gansu Agriculture University, Lanzhou, China
- 2College of Forestry of Gansu Agriculture University, Lanzhou, China
Introduction: The Gansu section of the Yellow River Basin is an important water resource conservation and replenishment area for the entire Yellow River Basin. With urbanization and socio-economic development, it is urgent to study the characteristics of land-use change and its future simulation in order to realize the coordinated ecological and economic development.
Methods: Based on the patch-generating land-use simulation (PLUS) model, this paper investigated the main drivers of land-use type expansion with a comprehensive consideration of natural and socio-economic aspects; moreover, the study simulated land-use change in 2030 under the four scenarios of natural development, cultivated land protection, ecological priority, and economic construction.
Results: The results showed the following: 1) the prediction of land-use types continued the historical evolution since 1980. Grassland, cultivated land, and forest land were still the dominant land types, accounting for more than 87% of the basin’s total area. Water bodies and wetlands remained relatively stable, and there was an obvious increase of approximately 20% in construction land. 2) Construction land and grassland were primarily driven by the social factor of the distance from the primary road and the distance from the secondary road, respectively. The cultivated land was greatly affected by the economic factor of population density. 3) The cultivated land protection scenario was the only one of the four scenarios that could make the cultivated land area increase positively, with an increase rate of 0.5%. This scenario also restricted effectively the conversion of cultivated land into construction land. The ecological priority scenario can expand grassland obviously with a proportion of 1.82% and slow down oasis desertion. The economic construction scenario can increase the construction land area the most by a rate of 25.5% to accelerate the economic development of specific regions in the study area.
Discussion: Therefore, implementing policies on the basis of choosing suitable scenarios in different areas was significant for optimizing the land-use structure, promoting the efficient use of land resources and ecological environment in the Gansu section of the Yellow River Basin.
1 Introduction
Research on land use/cover change (LUCC) focuses on simulating and exploring its spatiotemporal evolution at the regional or global scales, analyzing the dynamic mechanism of its development, and modeling its dynamic trend (Guo et al., 2009; Perring et al., 2016; Li et al., 2017; Wan et al., 2017; Liu et al., 2018a; Islam et al., 2018; Liu et al., 2020; Fu et al., 2020; Shah et al., 2022; Jing et al., 2023). The Gansu section of the Yellow River Basin is an important water conservation and replenishment area for the entire Yellow River Basin, taking on the important tasks of clean water recharge, ecological restoration, soil and water resource conservation, and pollution control in the upper reaches of the Yellow River (Gansu Provincial government, 2021). Therefore, LUCC of the Gansu section of the Yellow River Basin has become a focal point of national strategic importance and academic attention (Wang Rui, 2023; Zhang, 2023), especially after the ecological protection and high-quality development of the Yellow River Basin were elevated to a major national strategy in 2019.
Scholars have constructed various land-use change models based on different modeling objectives and realized land-use simulation in different regions. The Markov model and system dynamics rely on the past land quantity to reasonably predict the future land quantity, but they lack the ability to simulate the spatiotemporal land-use change. Cellular automaton (CA) can represent complex LUCC systems and have been widely used for simulating and forecasting of land use (Li and Yeh, 2000; Wu, 2002; Feng and Tong, 2018). The SLEUTH model (Clarke et al., 1997), CLUE-S model (Verburg et al., 2002; Verburg et al., 2004; Liu G. et al., 2017; Zhang et al., 2018; Huang et al., 2019), agent-based model (Chebeane and Echalier, 1999; Huang and Song, 2019), and FLUS model (Liu X. P. et al., 2017; Wang et al., 2019) are all extended version of the CA model. Because the SLEUTH and agent-based models do not easily integrate socio-economic factors in the simulation process, they are not widely used. The CLUE-S model is based on systems theory, including the non-space requirements module and space allocation module. The non-space demand module calculates the total demand for different types of land, but it needs to be completed by independent mathematical models. The FLUS model introduces the adaptive inertia coefficient and roulette mechanism; the roulette mechanism can better reflect the competition and uncertainty among different land types in the process of land-use change so as to enhance the accuracy of the simulation. However, it lacks the ability to model patch evolution of natural land-use types. In this paper, we select a patch-generating land-use simulation (PLUS) model coupling a novel land expansion analysis strategy (LEAS) with a CA model (CARS) based on multi-type random patch seeds (Liang et al., 2021). Compared to other models, the PLUS model can further reveal potential land-use conversion rules and identify the drivers of land expansion; moreover, it can get higher simulation accuracy and more similar landscapes (Li C. et al., 2021; Liang et al., 2021).
This paper’s aims were the following: 1. analyzing the spatiotemporal change characteristics of land-use types from 1980 to 2020. 2. Exploring the driving forces behind the expansion of land-use types in the Gansu section of the Yellow River Basin. 3. Simulating land-use changes for the year 2030 under four scenarios, namely, natural development, cultivated land protection, ecological priority, and economic construction. Although some studies on the land-use change of the Yellow River Basin were conducted (Zhang and Miao, 2020; Huang et al., 2022; Wu et al., 2022; Yu et al., 2023), future simulation of the land-use change and the driving factors of land type expansion were still not fully investigated in the context of the Gansu section of the Yellow River Basin. This paper will provide the scientific decision-making foundations for sustainable land use and ecosystem management, and moreover, it will provide the optimization basis for land spatial development and protection pattern aimed at high-quality development.
2 Study area and research methods
2.1 Study area overview
The Gansu section of the Yellow River Basin is located in the central and eastern part in Gansu Province (E92°13′–108°46′, N32°11′–42°57′). It is in the upper reaches of the Yellow River, with an average elevation of approximately 2,200 m, and most of the areas are in 400 mm isoprecipitation west. The Gansu section of the Yellow River Basin is an important ecological security barrier in western China. It contains more than one-fifth of the water volume of the Yellow River and accounts for approximately 80% of the population and GDP in the whole Gansu Province and is the core area of the province’s politics, economy, and culture. This study area consists of nine cities and prefectures, including Lanzhou, Baiyin, Wuwei, Dingxi, Tianshui, Pingliang, Qingyang, Gannan, and Linxia. The total area is approximately 1.8 × 10⁵ km2, constituting 42.9% of the total area of Gansu Province. The main course of the Gansu section of the Yellow River Basin flows through four cities and prefectures, namely, Baiyin, Lanzhou, Linxia, and Gannan, covering a total length of 913 km, which accounts for approximately 16.7% of the total length of the main course of the Yellow River and covers roughly 19% of the entire area of the Yellow River Basin. Additionally, the Yellow River tributaries flow through five cities, including Wuwei, Qingyang, Pingliang, Tianshui, and Dingxi (Gansu Provincial government, 2021). (Figure 1)
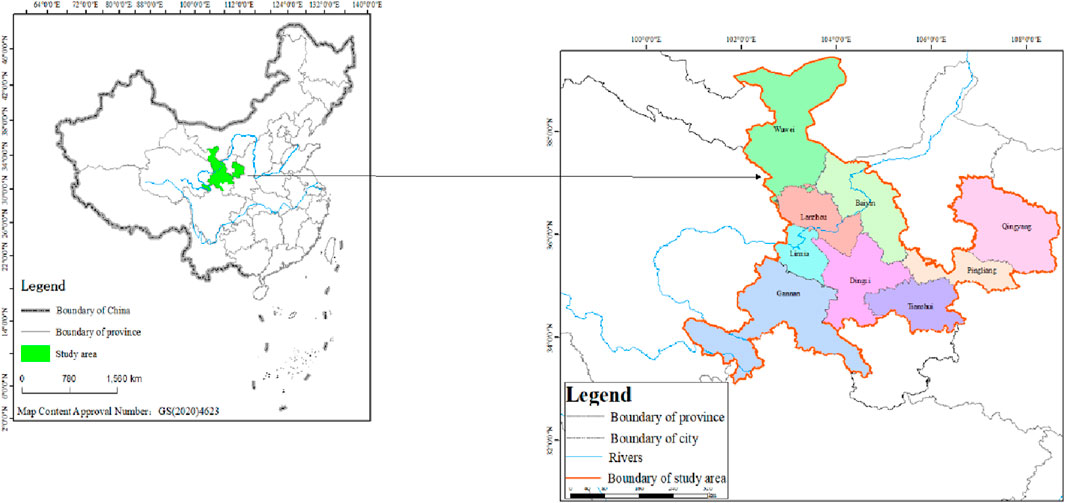
Figure 1. Location of the Yellow River Basin in Gansu Province.
2.2 Data sources and processing
LUCC data from the years 1980, 1990, 2000, 2010, and 2020 were classified into cultivated land, forest land, grassland, water bodies, construction land, and unused land, with an accuracy of at least 94.3% (Liu et al., 2018b; Liu et al., 2020) (http://www.resdc.cn/). We separated beaches and marshland from the secondary level and classified them as wetlands; thus, there were seven categories of land-use types in the study area. We can get DEM (digital elevation model) data on the study area by processing DEM data on nine cities (http://www.gscloud.cn) with the mosaic function in the raster dataset of ArcGIS 10.8 software. We can also get slope from DEM data by means of ArcGIS 0.8. Annual average precipitation, annual average temperature, GDP, NDVI (normalized difference vegetation index), population density, and soil type data were acquired (http://www.resdc.cn/). Road, highway, railway, and river data were derived from the National Catalog Service for Geographic Information (https://www.webmap.cn/), and Municipal government headquarters data were obtained from BIGMAP (https://www.bigemap.cn). All data were resampled to a 30-m grid for consistent analysis.
2.3 Research methods
2.3.1 Change of land use
2.3.1.1 Land-use dynamic degree
The land-use dynamic degree model reveals the level and trend characteristics of land structure changes, directly reflecting the speed and amplitude of land change (Wang and Bao, 1999).
where
2.3.1.2 Land-use development degree
Land-use development degree refers to the actual development level of a certain land type within a unit of time (Sun et al., 2018).
where
2.3.1.3 Land-use consumption degree
Land-use consumption degree represents the actual reduction in the utilization of a specific land type within a unit of time (Yang et al., 2015).
where
2.3.2 Land-use transition matrix
Land-use transition matrix (Table 1) describes the mutual transformation relationship between different land-use types in a region, which can reflect the loss direction of each type of land at the beginning of the study period and the source composition of each type of land at the end of the study period (Wu et al., 2022). We obtain the transition matrix by utilizing the raster calculator function of ArcGIS 10.8 software based on two-period land-use data.
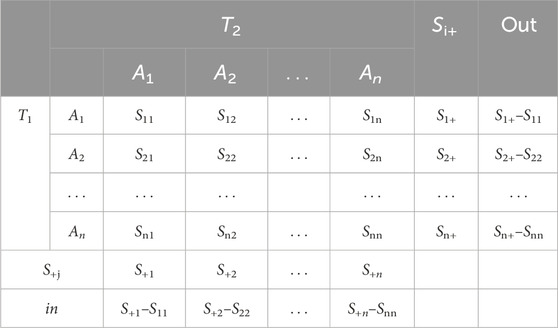
Table 1. Land-use transition matrix.
Here, Ai is the ith land-use type. n is the number of land types. Sij denotes the conversion area from the ith land type at time T1 to the jth land-use type at time T2. Si+ represents the total area of the ith land type at T1. S+i represents the total area of the ith land type at time T2 (i = 1,2, … , n).
2.3.3 Scenario description
Under the policy support of the “Outline of the Plan for Ecological protection and high-quality development in the Yellow River Basin,” “Ecological protection and high-quality development plan for the Yellow River Basin in Gansu Province,” and “General planning of land use in Gansu Province,” based on the relevant scenario setting methods of previous studies and combined with the historical land-use change characteristics and future land-use planning in study area, we set four scenario models to simulate and predict the spatial distribution pattern of land use in 2030.
2.3.3.1 Natural development
ND was based on land-use transition probability matrix from 2000 to 2010 and from 2010 to 2020. This scenario had no other restrictions on the conversion of different land-use types or government and market interventions. It was the basis for considering other scenarios.
2.3.3.2 Cultivated land protection
The quality and quantity of cultivated land are crucial for a country’s food security; therefore, rigorously controlling the conversion of cultivated land into construction land and other land types is a vital step. We assumed a reduction of 80% in the probability of cultivated land conversion to construction land, a 30% reduction in the probability of conversion to forest land or grassland, and a 100% reduction in the probability of conversion to unused land.
2.3.3.3 Ecological priority
Ecological conservation zones, hydropower stations, rivers, and lakes were set as restricted areas in order to prevent the uncontrolled urban expansion from causing damage to the ecological environment. We assumed a 60% reduction in the probability of conversion from forest land, grassland, water bodies, or wetlands to construction land; a 90% reduction in the probability of conversion to unused land; and a 60% reduction in the probability of conversion to cultivated land. The probability of converting cultivated land to construction land or unused land was decreased by 60%. The probability of conversion from unused land to forest land, grassland, water bodies, or wetlands was increased by 20%.
2.3.3.4 Economic construction
In this scenario, ecological conservation zones, hydropower stations, rivers, and lakes were still set as restricted areas referring to the “Ecological protection and high-quality development plan of the Yellow River Basin in Gansu Province.” The possibility of converting cultivated land, forest land, and grassland into construction land increased by 20%. The conversion probability of construction land to other types of land except the cultivated land was reduced by 30%.
2.3.4 Description of the PLUS model
2.3.4.1 PLUS model and operation
The PLUS model (Liang et al., 2021), integrating a land-expansion analysis strategy (LEAS) module and a cellular automaton (CA) module based on multi-class random patch seeds, is a patch-based future land-use change simulation model. The LEAS module extracts the expansion of various land-use types between two dates of land-use data and takes samples from the expanded portions, and then, it employs the random forest algorithm to obtain the development probabilities for each land-use type and determine the contributions of the driving factors to the expansion of various land-use types during the study period. The CA model generates patches of land use in the way of spatial and temporal dynamics while adhering to the constraints imposed by the development probabilities and the total number of pixels of each land-use type that is predicted by the Markov chain module.
The land-use simulation process in the Gansu section of the Yellow River Basin based on the PLUS model needs to experience three steps: 1) simulating land-use data from 2020 by the CA module and achieving Kappa coefficient and FOM value through comparing simulation data with the real data from 2020 by the validation module. Thus, we can get the accuracy to determine whether future land use change can be simulated. 2) Computing land-use quantity of each land-use type for 2030. 3) On the premise of overall accuracy, based on historical data from 2020, we simulated the spatial pattern distribution of the study area in 2030 by the CA module under the condition that the predicted land-use quantity, development probability of various types of land use, neighborhood weight, and conversion matrix are set.
2.3.4.2 Quantitative driving factors
This study selected 15 driving factors consisting of natural factors, social factors, and economic factors, of which the natural factors included annual average temperature, annual average precipitation, DEM, slope, NDVI, and soil types; social factors involved the distances from primary road, secondary road, tertiary road, railway, highway, water area, and prefecture-level city government station; and economic factors included population density and GDP (Figure 2). We quantified these driving factors by converting the vector data of all the driving factors into 30 m × 30 m raster data and calculating the distance from each grid point to each driving factor with the help of the Euclidean geometric distance by ArcGIS 10.8 software. Through the correlation analysis, we know that the correlation coefficients among the driving factors are relatively small, and we can regard them as independent.
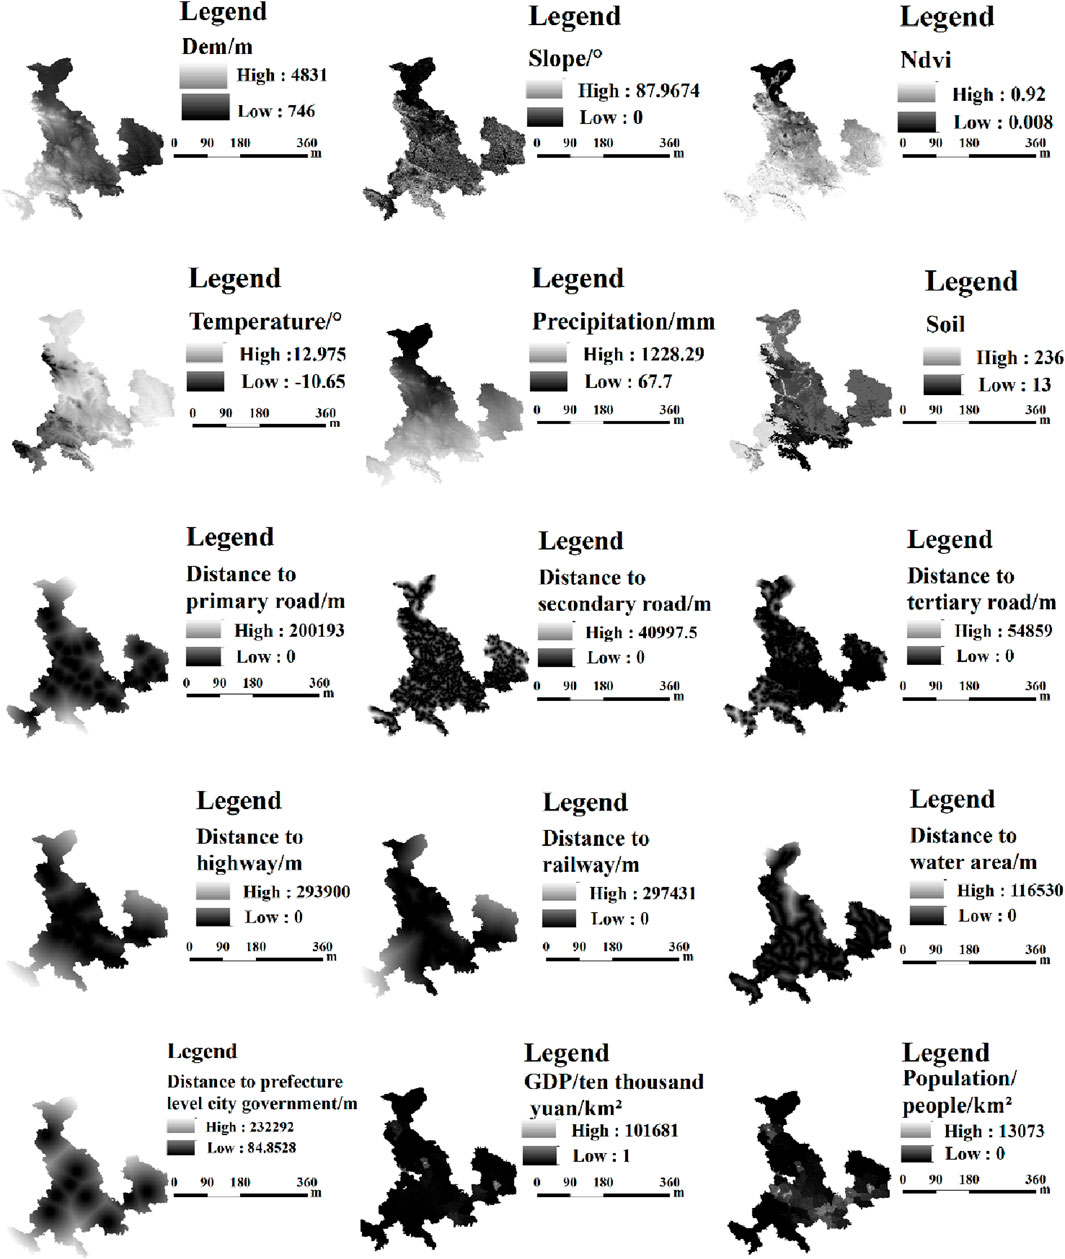
Figure 2. Spatial distribution map of each driving factor.
2.3.4.3 Land-use demand forecast
In the natural development scenario, we predicted the quantity of various land-use types in 2030 based on the starting year 2010 and ending year 2020 by using the Markov chain module embedded in the PLUS model. In other scenarios, based on previous studies and combined with the historical land-use change characteristics and future land-use planning in the study area, we revised land-use transfer probability matrix from 2010 to 2020 and obtained the transfer probability matrix from 2020 to 2030. Subsequently, we calculated the area of each land type for the year 2030 (Table 7).
2.3.4.4 Land-use conversion matrix
Based on the historical land-use transfer situations, land-use conversion matrixes in different scenarios were established (Table 2), where 0 indicates disallowing transition and 1 signifies allowing transition.
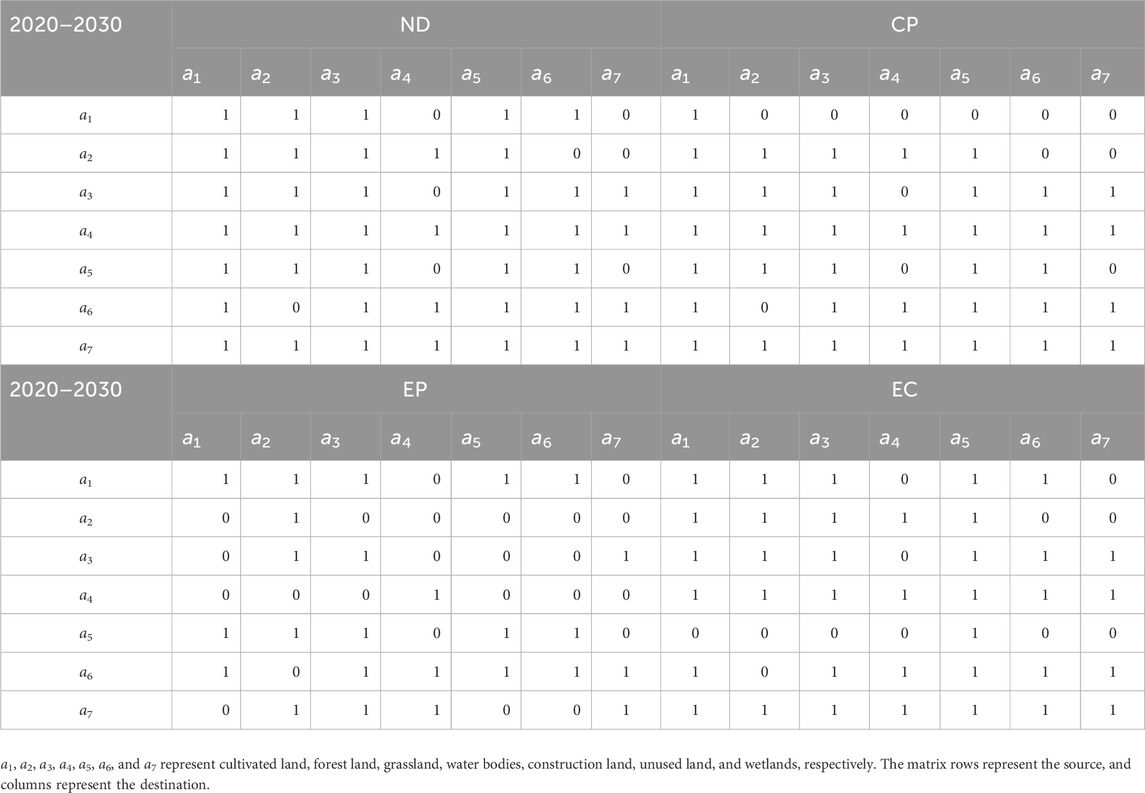
Table 2. Scenario simulation conversion matrix.
2.3.4.5 Neighborhood weight parameters
This indicator represents the expansion intensity of a certain land-use type in the research period. Its value ranges from 0 to 1. The closer the value is to 1, the larger the value is, and the stronger the land-use type expansion ability is. In this study, land-use quantity in 2020 and 2030 was used to calculate the expansion intensity of each land-use type (Wang et al., 2019),
where
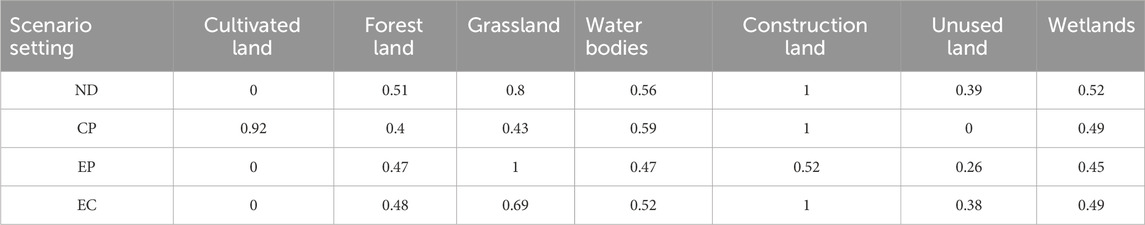
Table 3. Neighborhood weights for simulated scenarios.
2.3.4.6 Restricted development areas
In the cultivated land protection scenario, all cultivated lands were assumed not to participate in land-use transfer. In the ecological priority scenario, natural reserves, hydropower stations, rivers, and lakes were set as restricted areas, which did not involve the land-use transfer. In the economic construction scenario, the restricted areas were still set the same as in the ecological priority scenario. At the same time of economic construction, we must also ensure ecological protection (Gansu Provincial government, 2021).
2.3.4.7 Accuracy validation
We evaluated the accuracy of the simulation results using the Kappa coefficient and FOM value.
The Kappa coefficient was 0.94, FOM value was 0.2, and the overall accuracy was 95.93%. These results indicated that the model’s accuracy in simulating land-use changes in this study was relatively high, demonstrating the reliability and stability of the model. Therefore, it can be used for simulating land-use changes in the year 2030.
3 Results and analysis
3.1 Spatiotemporal changes in land use
3.1.1 Land-use spatial distribution characteristics
From 1980 to 2020, grassland, cultivated land, and forest land were the dominant land types in the Gansu section of the Yellow River Basin, reaching at 87%, of which grassland occupied the highest proportion, consistently accounting for approximately 47%, followed by cultivated land and forest land, accounting for approximately 27% and 13%, respectively. Cultivated land was mainly distributed in all the areas except for Gannan. Forest land was mainly distributed in Gannan and a small part of Tianshui, Wuwei, and Qingyang. Construction land was mainly concentrated in Lanzhou and Baiyin. Most of the unused land was located in Wuwei (Figure 3).
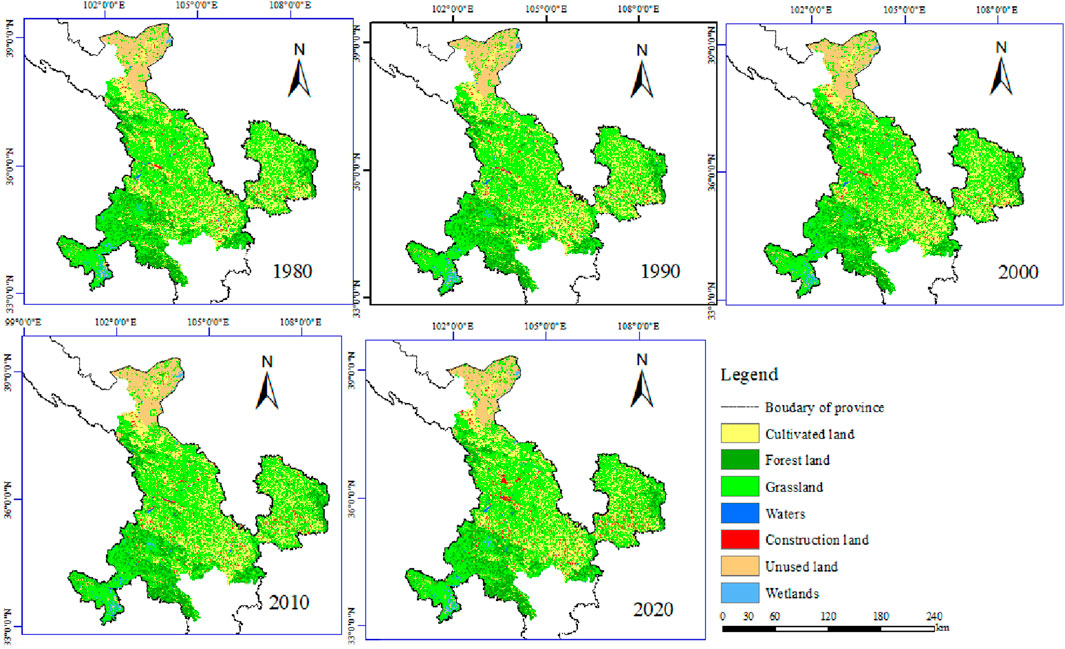
Figure 3. Spatial change of land-use types in the Gansu section of the Yellow River Basin from 1980 to 2020.
3.1.2 Analysis of land-use quantity change characteristics
The cultivated land area initially increased and then decreased. From 1980 to 2000, the cultivated land area increased by 351.4 km2. However, from 2000 to 2020, cultivated land witnessed the most significant decline, with a total reduction of 3,052.3 km2. The construction land area increased continuously during the study period, and especially from 2000 to 2020, the construction land area had the largest increase with a total of 1,372.74 km2 for rapid urbanization, accounting for approximately 55%. Although the area of grassland had a little increase from 2000 to 2020, it was relatively stable. The area of forest land was also initially decreased during 1980 and 2000 and then increased after 2000 (Table 4).
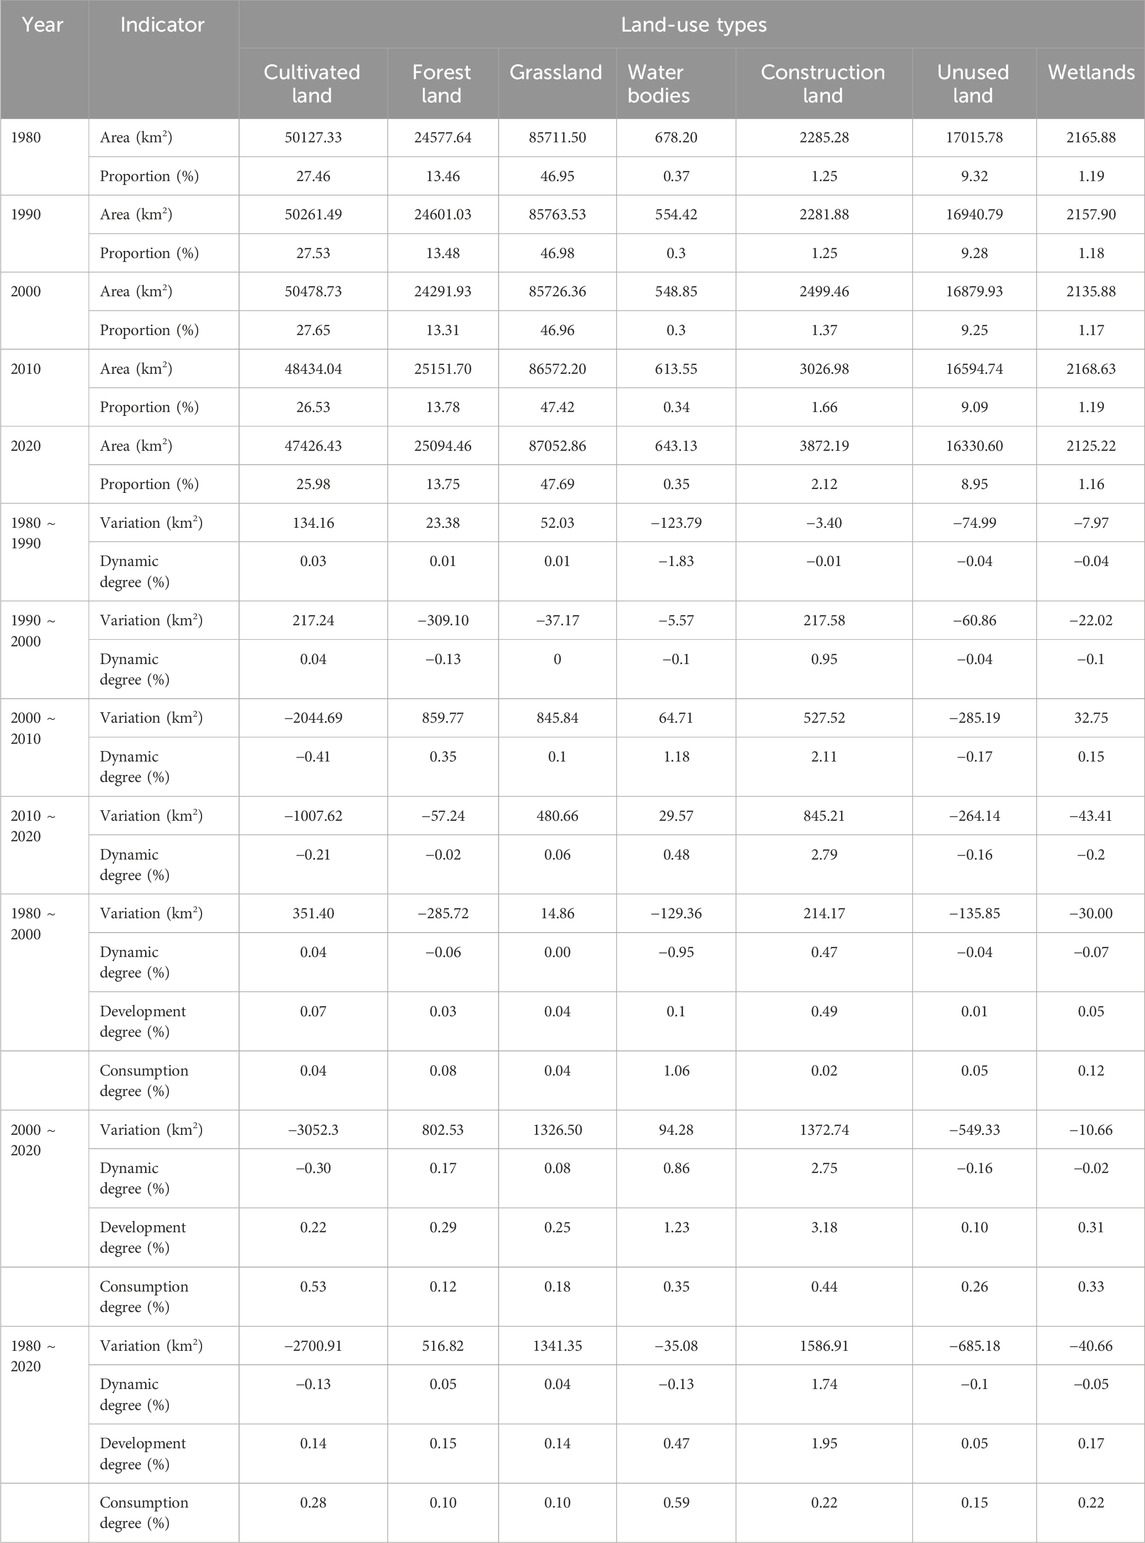
Table 4. Change of the land-use type from 1980 to 2020.
3.1.3 Analysis of the land-use change rate
The amount and proportion of various land-use types from 1980 to 2020, variation in the area between different years, dynamic degree, development degree, and consumption degree of various land types calculated by Equations 1–3, respectively, are detailed in Table 4. We have seen that the dynamic degrees of all land-use types from 1980 to 2000 were lower than that from 2000 to 2020, except for water bodies and wetlands, which indicated that they changed more dramatically from 2000 to 2020. The dynamic degree of construction land was the highest from 1980 to 2020, which reached 1.74%. Water bodies showed the highest dynamic degree, with a negative growth rate of 0.95% from 1980 to 2000 but a positive growth rate of 0.86% from 2000 to 2020. The important reason for this was likely that the largest area in the secondary classification of water bodies was permanent glacial snow, which doubled during 2005 and 2010 (Xiao et al., 2021). Forest land also showed a negative dynamic degree of –0.06% from 1980 to 2000 and a positive 0.17% from 2000 to 2020. Grassland had a higher dynamic degree of 0.08% from 2000 to 2020 than 0.04% from 1980 to 2000. Cultivated land had the dynamic degree of 0.04% from 1980 to 2000 and −0.3% from 2000 to 2020.
During the entire study period, the development degree of land-use types in descending order was as follows: construction land, water bodies, wetlands, forest land, grassland, cultivated land, and unused land. The consumption degree in descending order is as follows: water bodies, cultivated land, wetlands, construction land, unused land, grassland, and forest land (Table 4).
3.1.4 Analysis of the land-use transition matrix
Based on the spatial analysis tools of ArcGIS 10.8 software, we used a raster calculator on the vector classification maps of land-use types for the two periods 1980–2000 and 2000–2020 in the study area and obtained transition matrixes of the two periods. From the land-transfer situation of the two periods, the main outflow direction of cultivated land was grassland and construction land, and the outflow area was 101.14 km2 and 204.72 km2, respectively, from 1980 to 2000 and 3,526.91 km2 and 1,093.76 km2, respectively, from 2000 to 2020. The outflow directions of forest land and unused land were also grassland, and the outflow area was 375.89 km2 and 140.86 km2, respectively, from 1980 to 2000 and 375.77 km2 and 342.27 km2, respectively, from 2000 to 2020. The main outflow direction of grassland was cultivated land, and the outflow area was 547.62 km2 from 1980 to 2000 and 1,545.62 km2 from 2000 to 2020.
Through analysis, we have seen that the conversion of land type mainly occurred between cultivated land and grassland. After 2000, the transfer of cultivated land to grassland led to an increase in the grassland area. The transfer of cultivated land to grassland and construction land led to a decrease in the area of cultivated land. The transition matrix from 2000 to 2020 dominated the whole study period (Tables 5, 6).
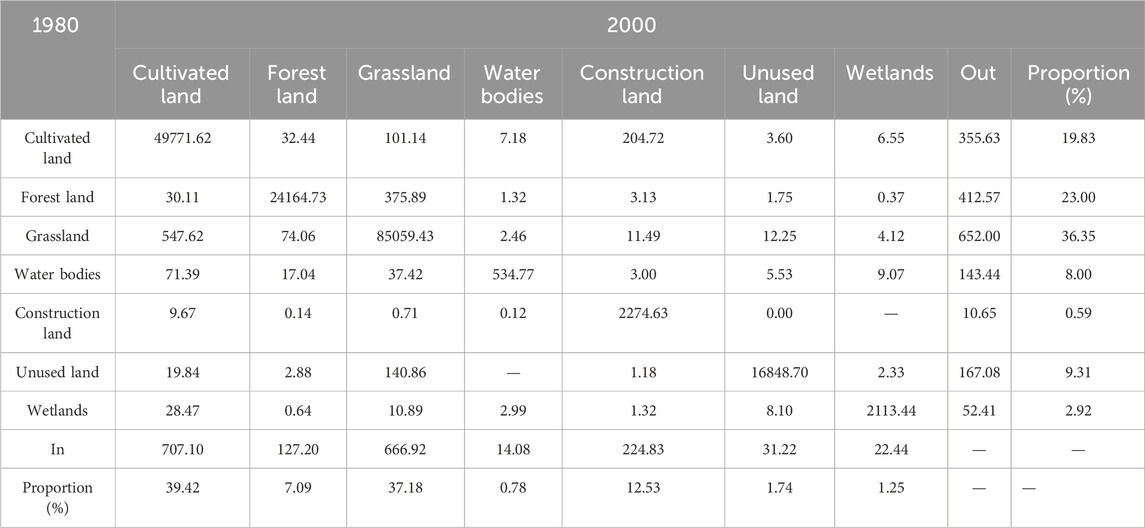
Table 5. Land-use transition matrix from 1980 to 2000.
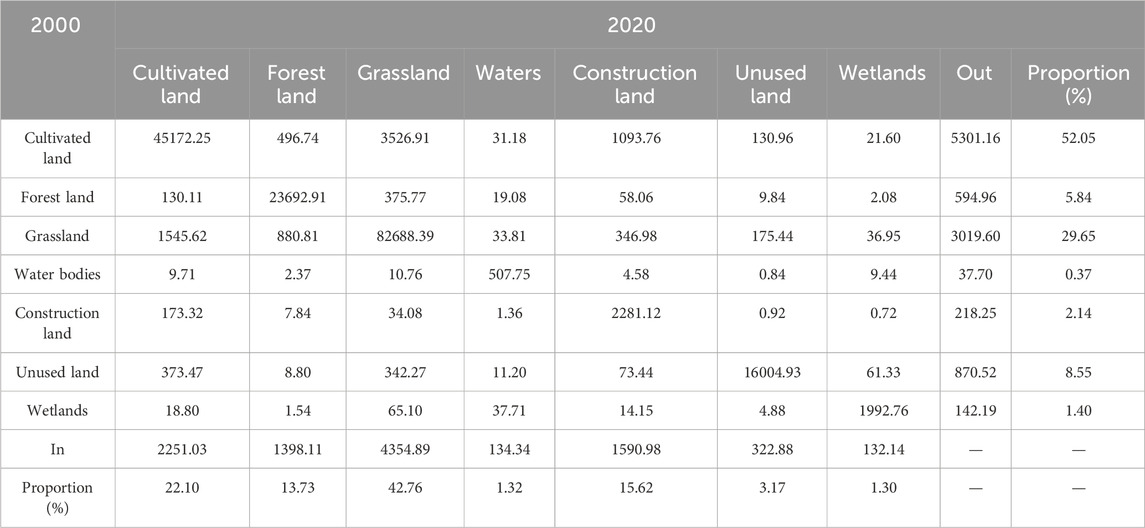
Table 6. Land-use transition matrix from 2000 to 2020.
3.2 Analysis of driving factors in land-use expansion based on the PLUS model
Cultivated land, grassland, and construction land changed dramatically from the transition matrix from 1980 to 2020. Through the LEAS module embedded in the PLUS model, it can be concluded that the driving factor of cultivated land expansion with the highest contribution was population density, followed by annual average precipitation and the distance from the primary road. Overlaying the data on cultivated land expansion in the study area and population grids, it can be concluded that the increasing area of cultivated land was mainly distributed in regions with a relatively low population density. The driving factor of construction land with the maximum contribution was the distance from the primary road, followed by the population density and the distance from the secondary road. Overlaying the data of construction land expansion in the study area and raster data of the distance from the primary road, it can be verified that regions with increased construction land are primarily distributed around the primary and secondary roads with dense population; in other words, expansion of construction land was near the city. The main driving factor affecting the increase in the grassland area was the distance from secondary road, followed by NDVI and annual average precipitation (Li et al., 2005; ZHANG, 2017; HAN C. L. et al., 2021; HAN HQ. et al., 2021). Overlaying the data on grass land expansion in the study area and raster data on the distance from the secondary road, it can be verified that most of the grassland growth areas are concentrated in the areas with high NDVI and rainfall near the secondary road.
For other land-use types, forest land expansion was mainly affected by annual average temperature, population density, and DEM; the expansion of water bodies was mainly affected by DEM, the distance from water areas, and soil types; the expansion of unused land was influenced by population density, GDP, and annual average precipitation; and the expansion of wetlands was affected by GDP, the distance from the highway, and water areas (Figure 4).
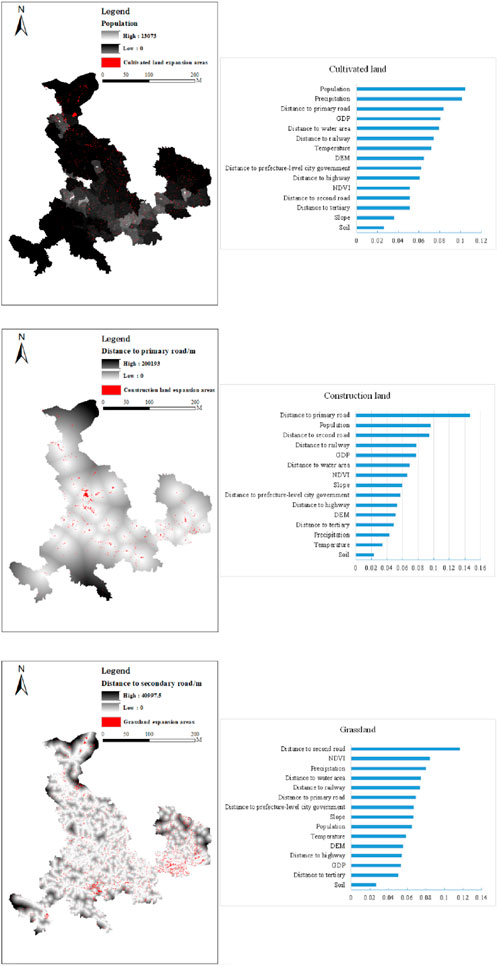
Figure 4. Increasing areas of cultivated land, grassland, and construction land superimposed with their highest contributing factors.
3.3 Analysis of multi-scenario land-use simulation
The PLUS model had high accuracy, with an average accuracy of 95.94%. The simulation accuracies of water bodies and construction land were a little low, with 79.81% and 75.91% accuracy, respectively. The accuracies of the five other land types were high. The results could accurately reflect the change of land-use demand in the Gansu section of the Yellow River Basin, which can be used for the following simulation and prediction. Based on the area of various land types under four scenarios, variation of area, and proportion (Table 7), we simulated the spatial pattern distribution of the study area in 2030 under four scenarios by the CA module of the PLUS model (Figure 5).
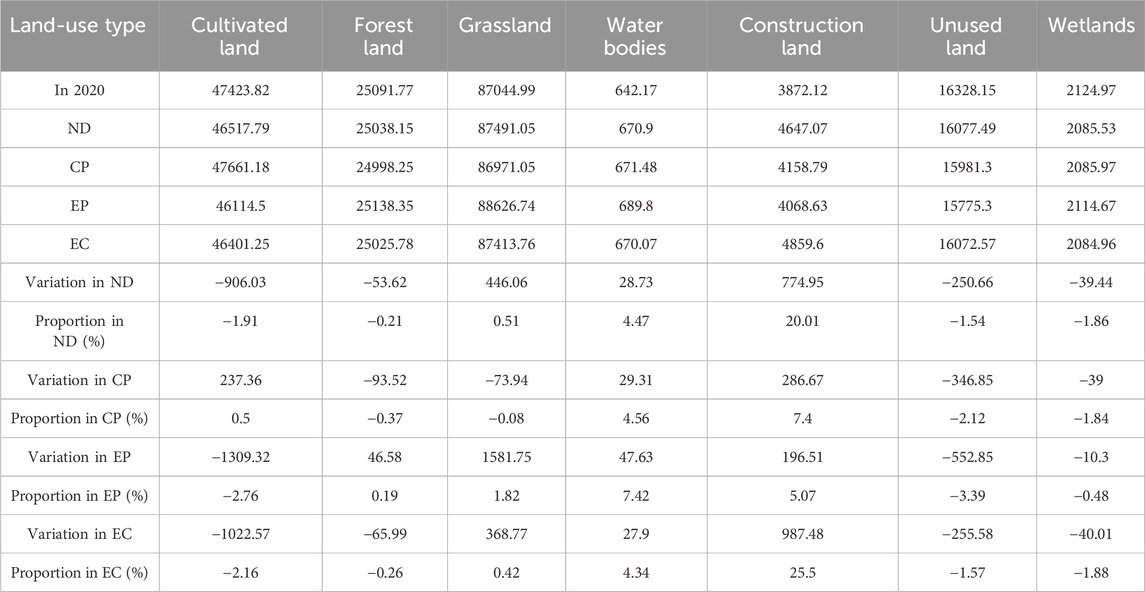
Table 7. Land-use change in 2030 under multiple scenarios.
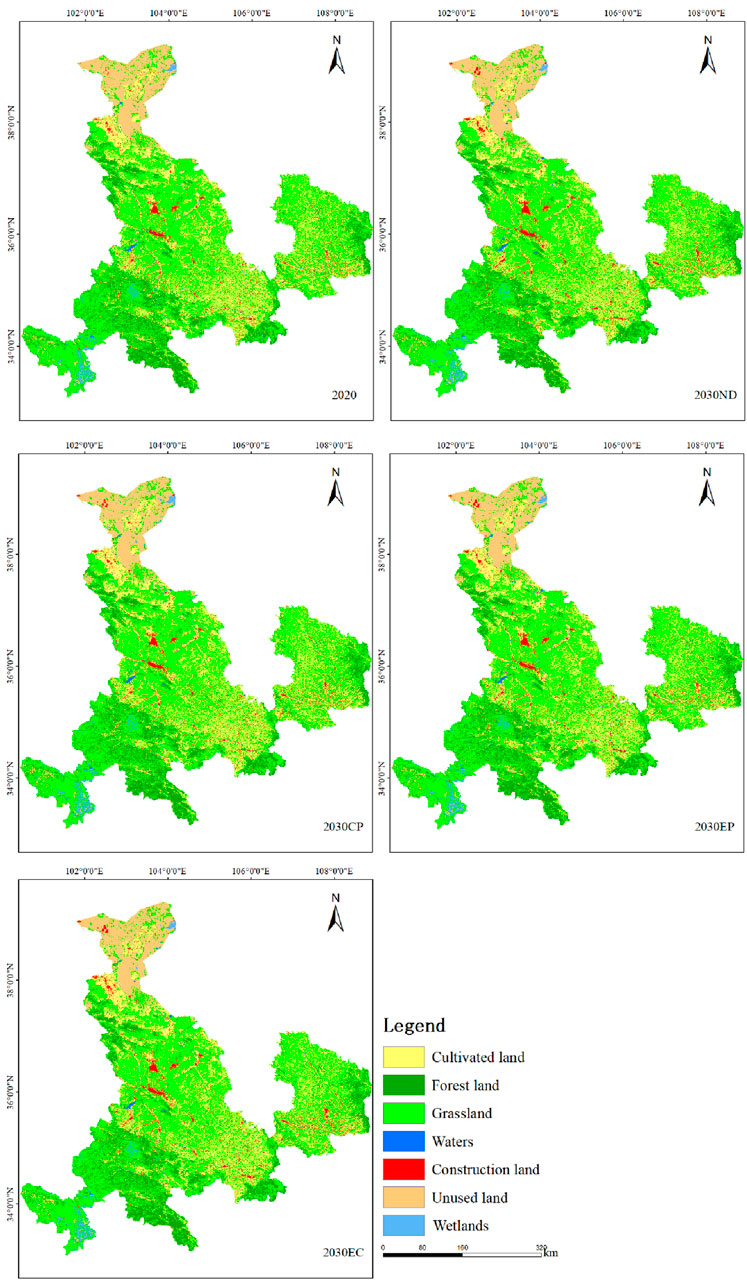
Figure 5. Spatial distribution map of land-use types in 2030.
Under the natural development scenario, the area of cultivated land and unused land reduced by 906.03 and 250.66 km2, respectively, in 2030, and the area of grassland and construction land increased by 446.06 km2 and 774.95 km2, respectively, in 2030. Construction land expansion was obvious, accounting for 20.01%. From the point of view of spatial structure and transition matrix from 2020 to 2030, the expansion of grassland, which was converted from cultivated land, was mainly distributed in Huan county in Qingyang and Kongtong districts in Pingliang. Construction land expansion, which was also mainly from cultivated land, was distributed in the Liangzhou district in Wuwei; Lanzhou except for Qilihe and Honggu districts; Baiyin district, Pingchuang district, and Jingyuan county in Baiyin; Linxia city, Linxia county, Guanghe county, and Kangle county in Linxia; Anding district, Lintao county, and Longxi county in Dingxi; Gangu county, Wushan county, Qinan county, and Qinzhou district in Tianshui; Kongtong district, Huating city, Jingchuan county, Jingning county, and Zhuanglang county in Pingliang; and Xifeng district, Ning county, Zhengning county, and Zhenyuan county in Qingyang. There was also part of construction land converted from unused land located in the Liangzhou district and northwest of Minqin county in Wuwei. We found that construction land expansion mainly occurred in cities, prefectures, and nearby counties and districts.
Under the cultivated land protection scenario, forest land, grassland, and unused land reduced, while the cultivated land and construction land increased to 237.36 km2 and 286.67 km2, respectively, and water bodies also increased a little. According to the transition matrix from 2020 to 2030, some unused land had been converted into construction land, which appeared in the Liangzhou district and northwest of Minqin county in Wuwei. Parts of unused land had been converted into wetlands, which appeared in Minqin county in Wuwei and Maqu county in Gannan.
Under the ecological priority scenario, the area of cultivated land and unused land decreased significantly, of which unused land decreased the largest in the four scenarios, reaching 552.85 km2. Forest land, grassland, and water bodies increased, achieving the purpose of protecting forest land, grassland, and water bodies. Construction land still increased. From the transition matrix of 2020–2030, the area of grassland converted from cultivated land had reached 1,228.97 km2, which was obvious in Qingyang, Pingliang, Tianshui, Dingxi, Baiyin, and Lanzhou. A small amount of unused land was converted to construction land, which was distributed in the northwest of Minqin county and Liangzhou district in Wuwei. A small amount of unused land converted to grassland, which was distributed in Minqin and Gulang counties in Wuwei and Maqu county in Gannan.
Under the economic construction scenario, we still had the same restricted areas, as in the ecological priority scenario in order to not destroy the ecological protection area in the economic construction scenario. In this scenario, construction land expanded the most drastically, reaching at 25.5%, mainly encroaching on cultivated land and small amounts of unused land. Therefore, cultivated land decreased the most. Moreover, forest land played a certain role in construction land expansion. The distribution of construction land expansion was consistent with the natural development scenario.
4 Discussion
4.1 Driving factors and recommendations for land-use change
In the past four decades in the Gansu section of the Yellow River Basin, the change of cultivated land, grassland, and construction land was relatively obvious. The area of construction land transferred from cultivated land accounted for 69.90% of the total increasing amount of the construction land area, while the area of grassland transferred from cultivated land represented 72.39% of the overall increasing amount of the grassland area. This indicated that the injection of the cultivated land area was a major factor contributing to the expansion of construction land and grassland. Therefore, the driving factors of the expansion of construction land and grassland can approximately reflect the reasons for cultivated land area decrease. On the other hand, the area of cultivated land converted from grassland accounted for 70.94% of the increase in the cultivated land area. Therefore, the driving forces of cultivated land expansion can, to a large extent, reflect the reasons for the decrease in the grassland area. Decision-makers should fully consider the conflict among cultivated land protection, ecological priority, and economic construction through analyzing the main driving factors of land-use expansion. In the future processes of land-use development and protection, we can learn from the main drivers of land-use change in this study and make the drivers play a greater role in land-use planning, project construction site selection, and enhancement of ecological services.
4.2 Trends and benefits for land-use change in different scenarios
Significant differences were observed in land-use changes under the four scenarios. Under the natural development scenario, construction land, mainly converted from cultivated land according to the transition matrix, grew rapidly with the intensification of human activities without policy restriction, reaching as high as 20.01%, and this is contrary to strengthening the construction of agricultural infrastructure and resolutely holding the red line of cultivated land protection (Gansu Provincial government, 2021). We must limit some conditions. In the cultivated land protection scenario, more emphasis was placed on restricting the conversion of cultivated land to construction land and other land types. It is recommended that decision-makers plan and control urban growth boundaries rationally, strictly control the construction land encroachment on cultivated land, and adhere rigorously to the red line for cultivated land protection (Gansu Provincial government, 2021). In the ecological priority scenario, noticeable growth was observed in grassland and water areas with a little increase in forest land. The degradation problem of the wetlands of the first meander of Yellow River National Nature Reserve in Maqu county had been weakened to a certain degree until 2030 (Chen, 2017; Wang M. M., 2023). This scenario mainly indicated that oasis desertion would be greatly slowed down in Minqin, Gulang, and Maqu in 2030, but it showed a better effect in Minqin (Li J. H. et al., 2021). This is probably because Minqin County successively carried out key ecological construction projects, such as sand control and ecological restoration, at the beginning of the 21st century (Xie and Chen, 2008). Although this scenario played an important role in ecosystem restoration, the cultivated land was not effectively protected. Under the economic construction scenario with same restricted areas as in ecological priority, construction land expanded the most drastically, which was mainly distributed in these places that are mentioned in the natural development scenario. These expansions were just close to the primary road, which was consistent with the main driving factors of construction land expansion. The reason of the dramatic expansion was probably the development of Lanzhou–Xining city clusters and the promotion of Tianshui, Pingliang, and Qingyang actively participating in the construction of city clusters on the Guanzhong plain (Gansu Provincial government, 2021). However, cultivated land, forest land, grassland, water bodies, and wetlands decreased faster than in the ecological priority scenario. Therefore, we should control the expansion rate of construction land to protect ecological land from encroachment under the policy guarantee of the “Ecological protection and high-quality development plan for the Yellow River Basin in Gansu Province” (Gansu Provincial government, 2021). On one hand, multi-scenario simulation can compare the spatial pattern difference between different scenarios, and on the other hand, it can realize the tradeoff development between multiple scenarios. According to this, we should advise decision-makers to consider selecting appropriate development scenarios for different regions.
4.3 Suggestions for land-use change
In past four decades, the area of grassland transferred from cultivated land represented 72.39% of the overall increasing amount of the grassland area. The reason was likely to be returning of cultivated land to forest and grassland under the background of a series of ecological protection and restoration projects after 2000 (Lv, 2003). The total area of cultivated land was still decreasing, which indicates that although the land consolidation campaign aimed at realizing the dynamic balance of cultivated land occupation and compensation was constantly promoted (Gansu Provincial government, 2019), it was still difficult to make up for the decrease in the total amount. Because the reduction of cultivated land has an impact on food security, we should strictly observe the red line of cultivated land protection, improve the production efficiency of cultivated land, and make intensive use of the existing cultivated land. We will also suggest decision-makers to lay emphasis on the cultivated land protection scenario in the areas where cultivated land is concentrated. On the other hand, it is necessary to control the transfer of grassland to cultivated land to ensure that the ecosystem does not undergo drastic changes. We hope that the ecological priority scenario is considered in the areas where grassland, forest land, or wetlands are concentrated.
4.4 Suggestions for future research
Through practice and thinking, there are still the following problems in this paper that need further research and discussion:
1. Due to the complex and diverse factors affecting various types of land change, the selection of driving factors is not comprehensive enough, which will lead to deviation of prediction. Further research for selecting and analyzing of the driving factors will improve the prediction accuracy of PLUS. At the same time, the relationship between the driving factors (e.g., distance from roads and population density) and land-use change will be further elucidated by the logistic regression model.
2. Land-use transfer probability matrix from 2020 to 2030 was revised according to previous studies and combined with the historical land-use change characteristics and future land-use planning in the study area. It is inevitably subjective. We plan to use the MOP model, which is multi-objective programming, to calculate the area of various land-use types of the study area in 2030 and then simulate land-use changes with the PLUS model to enhance the accuracy and robustness of land-use change predictions.
5 Conclusion
This paper analyzed the spatiotemporal changes in land use; explored the driving factors behind land-use expansion; and predicted the quantity, spatial distribution characteristics, and trends in land use for the year 2030 under four different scenarios based on the PLUS model. The following conclusions are drawn:
1. The prediction of land-use types continues the historical evolution since 1980. Grassland, cultivated land, and forest land remain the primary land types, accounting for more than 87% of the basin’s total area. Water bodies and wetlands have remained relatively stable. The primary trend in land-use change involved the exchange between cultivated land and grassland, along with the continuous expansion of construction land.
2. The driving factors of the expansion of construction land and grassland can approximately reflect the reasons for the decrease in the cultivated land area. The driving forces of cultivated land expansion can, to a large extent, reflect the reasons for the decrease in the grassland area.
3. Multi-scenario simulation results showed that under the natural development scenario, cultivated land was occupied by part of grassland. Under the cultivated land protection scenario, this restrained the conversion of cultivated land into construction land and other land types. Cultivated land showed positive growth. Under the ecological priority scenario, part of cultivated land was also transferred to grassland. Grassland and forest land showed positive growth. Under the economic construction scenario, construction land expanded the most drastically, mainly encroaching on cultivated land, small areas of unused land, and forest land. Our simulations and predictions are also consistent with the current regional development pattern. This study suggested valuable insights for future land-use prediction in the area.
Data availability statement
The original contributions presented in the study are included in the article/Supplementary material; further inquiries can be directed to the corresponding authors.
Author contributions
XM: writing–original draft. JL: writing–review and editing. GL: supervision and writing–review and editing.
Funding
The author(s) declare that financial support was received for the research, authorship, and/or publication of this article. The study was funded by the Special Fund for Soft Science of Gansu (23JRZA449); The National Natural Science Foundation of China (Grant No. 32360438); The Key Research and Development Program of Gansu Province (22YF7FA116); Key Research and Development Program of Gansu Province (20YF8NA135); Higher Education Industry Support Project of Gansu Province (2021CYZC-15).
Conflict of interest
The authors declare that the research was conducted in the absence of any commercial or financial relationships that could be construed as a potential conflict of interest.
Publisher’s note
All claims expressed in this article are solely those of the authors and do not necessarily represent those of their affiliated organizations, or those of the publisher, the editors, and the reviewers. Any product that may be evaluated in this article, or claim that may be made by its manufacturer, is not guaranteed or endorsed by the publisher.
References
Chebeane, H., and Echalier, F. (1999). Towards the use of a multi-agents event based design to improve reactivity of production systems. Comput. Ind. Eng. 37, 9–13. doi:10.1016/s0360-8352(99)00013-3
Chen, L. Z. (2017) A comparison study on pastoral desertification and oasis desertification-taking Maqu county and Minqin county as an example 2017. Lanzhou: Lanzhou university.
Clarke, K. C., Hoppen, S., and Gaydos, L. (1997). A self-modifying cellular automaton model of historical urbanization in the San Francisco Bay area. Environ. Plan. B Plan. Des. 24, 247–261. doi:10.1068/b240247
Feng, Y. J., and Tong, X. (2018). Dynamic land use change simulation using cellular automata with spatially nonstationary transition rules. Sensing 55 (5), 678–698. doi:10.1080/15481603.2018.1426262
Fu, J. X., Cao, G. C., and Guo, W. J. (2020). Land use change and its driving force on the southern slope of Qilian Mountains from 1980 to 2018. Chin. J. Appl. Ecol. 31 (8), 2699–2709. doi:10.13287/j.1001-9332.202008.017
Gansu Provincial government (2019) Gansu province cultivated land occupation compensation balance management measures, 1.24. Document 11.
Gansu Provincial government (2021) Ecological protection and high-quality development plan for the Yellow River Basin in Gansu province.
Guo, L. Y., Wang, D. L., Qiu, J. J., Wang, L., and Liu, Y. (2009). Spatio-temporal patterns of land use change along the Bohai Rim in China during1985-2005. J. Geogr. Sci. 19 (5), 568–576. doi:10.1007/s11442-009-0568-0
Han, C. L., Shen, Y. J., Wu, L. Z., Guo, Y., and Chen, X. L. (2021a). Spatial and temporal variation characteristics of cultivated land in the upper Yellow River from 2002 to 2018 based on time series MODIS. Chin. J. Eco-Agriculture 29(11): 1940–1951. doi:10.13930/j.cnki.cjea.210113
Han, H. Q., Wang, X. H., Niu, L. Z., Liang, X. J., Jiang, X. H., and Tan, Z. T. (2021b). The land-use and land-cover change characteristics and driving forces of cultivated land in Central Asian countries from 1992 to 2015. Chin. J. Eco-Agric. 29 (2), 325–339. doi:10.13930/j.cnki.cjea.200406
Huang, D., Huang, J., and Liu, T. (2019). Delimiting urban growth boundaries using the CLUES model with village administrative boundaries. Land Use Policy 82, 422–435. doi:10.1016/j.landusepol.2018.12.028
Huang, Q., and Song, W. A. (2019). A land-use spatial optimum allocation model coupling a multi-agent system with the shuffled frog leaping algorithm. Comput. Environ. Urban Syst. 77, 101360. doi:10.1016/j.compenvurbsys.2019.101360
Huang, Y. Q., Li, X. Y., Yu, Q., and Huang, H. G. (2022). An analysis of land use change and driving forces in the Yellow River Basin from 1995 to 2018. J. Northwest For. Univ. 37 (6), 113–121. doi:10.3969/j.issn.1001-7461.2022.06.16
Islam, K., Rahman, M. F., and Jashimuddin, M. (2018). Modeling land use change using cellular automata and artificial neural network: the case of chunati wildlife sanctuary, Bangladesh and artificial neural network: the case of chunati wildlife sanctuary. Bangladesh. Ecol. Indic., 88, 439–453. doi:10.1016/j.ecolind.2018.01.047
Jing, Q. Q., He, J. J., Li, Y. R., Yang, X. Y., Peng, Y., Wang, H., et al. (2023). Analysis of the spatiotemporal changes in global land cover from 2001 to 2020. Sci. TOTAL Environ. 908, 168354. doi:10.1016/j.scitotenv.2023.168354
Li, C., Wu, Y., Gao, B., Zheng, K., Wu, Y., and Li, C. Multi-scenario simulation of ecosystem service value for optimization of land use in the Sichuan-Yunnan ecological barrier, China[J]. Ecol. Indic. 2021a, 132, 108328, doi:10.1016/j.ecolind.2021.108328
Li, J. H., Chen, Y., Yang, G. J., and Zhou, L. H. (2021b). The aeolian desertification process and driving mechanism of Minqin Oasis from 1975 to 2018 41(3), 44–55. doi:10.7522/j.issn.1000-694X.2021.00014
Li, S. H., Jin, B. X., Zhou, J. S., Wang, J. L., and Peng, S. Y. (2017). Analysis of the SpatiotemporalLand-use/land-cover changeand its driving forces in fuxian LakeWatershed, 1974 to 2014 use/land-cover change and its driving forces in fuxian LakeWatershed, 1974 to 2014. Pol. J. Environ. Stud. 26(2), 671–681. doi:10.15244/pjoes/65737
Li, X., and Yeh, A. G. (2000). Modelling sustainable urban development by the integration of constrained cellular automata and GIS. Int. J.Geogr. Inf. Syst. 14, 131–152. doi:10.1080/136588100240886
Li, Y. H., Zhang, L., Duan, L. J., and Hu, X. J. (2005). Influence of highway construction on grassland eco-environment in gannan plateau. Arid. Meteorol. 23 (04), 61–65.
Liang, X., Guan, Q. F., Clarke Keith, C., Liu, S., Wang, B., and Yao, Y. (2021). Understanding the drivers of sustainable land expansion using a patch-generating land use simulation (PLUS) model: a case study in Wuhan, China. Comput. Environ. Urban Syst. 85, 101569. doi:10.1016/j.compenvurbsys.2020.101569
Liu, G., Jin, Q., Li, J., Li, L., He, C., Huang, Y., et al. (2017a). Policy factors impact analysis based on remote sensing data and the CLUE-Smodel in the Lijiang River Basin, China. Catena 158, 286–297. doi:10.1016/j.catena.2017.07.003
Liu, J. Y., Ning, J., Kuang, W. H., Xu, X. L., Zhang, S. W., Yan, C. Z., et al. (2018a). Spatiotemporal patterns and characteristics of land-use change in China during 2010–2015 and characteristics of land-use change in China during 2010-2015. Acta Geogr. Sin. 28(5), 547–562. doi:10.1007/s11442-018-1490-0
Liu, J. Y., Ning, J., Kuang, W. H., Xu, X. L., Zhang, S. W., Yan, C. Z., et al. (2018b). Spatio-temporal patterns and characteristics of land-use change in China during 2010-2015. Acta Geogr. Sin. 28 (5), 547–562. doi:10.1007/s11442-018-1490-0
Liu, J. Y., Zhang, Z. X., Zhang, S. W., Yan, C. Z., Wu, S. X., and Li, R. D. (2020). Innovation and development of remote sensing-based land use change studies based on Shupeng Chen's academic thoughts. J. Geo-information Sci. 22 (4), 680–687.doi:10.12082/dqxxkx.2020.200052
Liu, X. P., Liang, X., Li, X., Xu, X., Ou, J. P., Chen, Y. M., et al. (2017b). A future land use simulation model (FLUS) for simulating multiple land use scenarios by coupling human and natural effects. Landsc. Urban Plan. 168, 94–116. doi:10.1016/j.landurbplan.2017.09.019
Lv, Y. Q. (2003). Discussing on return back cropland to forest and grass-land project and eco-environmental construction. J. Gansu For. Sci. Technol. 28 (1), 41–43.
Perring, M. P., De Frenne, P., Baeten, L., Maes, S., Depauw, L., Blondeel, H., et al. (2016). Global environmental change effects on ecosystems: the importance of land-use legacies. Glob. change Biol. 22 (4), 1361–1371. doi:10.1111/gcb.13146
Shah, F., Li, W., Lashari, A. H., Islam, A., Hashim Khattak, L., and Rasool, U. (2022). Evaluation of land use and land cover Spatio-temporal change during rapid Urban sprawl from Lahore, Pakistan. Urban Clim. 39, 1–17. doi:10.1016/J.UCLIM.2021.100931
Sun, J. X., He, J., Yu, G. L., and Han, J. (2018). Spatial and temporal change of land use in Chang qing District of Jinan City based on RS and GIS. J. Agric. Sci. 39 (3), 44–50. doi:10.13907/j.cnki.nykxyj.20181010.001
Verburg, P. H., Schot, P. P., Dijst, M. J., and Veldkamp, A. (2004). Land use change modelling: current practice and research priorities. GeoJournal 61, 309–324. doi:10.1007/s10708-004-4946-y
Verburg, P. H., Soepboer, W., Veldkamp, A., Limpiada, R., Espaldon, V., and Mastura, S. S. (2002). Modeling the spatial dynamics of regional land use: the CLUE-S model. Environ. Manag. 30, 391–405. doi:10.1007/s00267-002-2630-x
Wan, W., Wei, W., Qian, D. W., Wei, X. X., and Feng, K. (2017). Research progress on environmental effects of land use/cover change. J. Fujian Agric. For. Univ. 46, 361–372. doi:10.13323/j.cnki.j.fafu(nat.sci.).2017.04.001
Wang, B. S., Liao, J. F., Zhu, W., Qiu, Q. Y., Wang, L., and Tang, L. N. (2019). The weight of neighborhood setting of the FLUS model based on a historical scenario: a case study of land use simulation of urban agglomeration of the Golden Triangle of Southern Fujian in 2030. Acta Ecol. Sin. 39 (12), 4284–4298. doi:10.5846/stxb201808021649
Wang, M. M. (2023a) Ecological degradation of alpine wetland in the first meander of Yellow River and its restoration countermeasures. Lanzhou: Northwest Normal University.
Wang, R. (2023b) Analysis on land use change and landscape ecological risk in Gansu section of the mainstream of the Yellow River. (Lanzhou, China: Lanzhou University).
Wang, X. L., and Bao, Y. H. (1999). Study on the methods of land use dynamic change research. Prog. Geogr. (01), 83–89.
Wu, C. X., Feng, Y. Z., Zhao, H., Bao, Q., Lei, Y. Q., and Feng, J. (2022). Study on ecosystem service value of the Yellow River Basin in Gansu Province based on land use change. J. DESERT Res. 42 (6), 304–316. doi:10.7522/j.issn.1000-694X.2022.00130
Wu, F. (2002). Calibration of stochastic cellular automata: the application to rural-urban land conversions. Int. J. Geogr. Inf. Sci. 16, 795–818. doi:10.1080/13658810210157769
Xiao, Y. F., Chen, W. Y., Wang, B. J., Tan, Y. R., Bing, D. H., Zhu, L., et al. (2021). Study on temporal and spatial change of land use and its relationship with climate factors in Qilian Mountain National Nature Reserve. Acta Agrestia Sin. 29 (09), 2049–2057. doi:10.11733/j.issn.1007-0435.2021.09.023
Xie, Y. W., and Chen, F. H. (2008) Development and evolution of Minqin Oasis: a study of land use/land cover change in recent 2000 years 2008. Beijing: science press.
Yang, X., Wei, Z. J., and Yun, X. J. (2015). The changes of land use and vegetation during recent 30 years in steppe grassland of Xilinhot, Inner Mogolia. J. China Agric. Univ. 20 (4), 196–204. doi:10.11841/j.issn.1007-4333.2015.04.27
Yu, P., Zhang, S. N., Wang, P., Li, Y. N., and Huang, L. (2023). Evaluation and prediction of land use change impacts on ecosystem service values in Nanjing City from 1995 to 2030. Environ. Sci. Pollut. Res. Int. 30 (7), 18040–18063. doi:10.1007/s11356-022-23346-5
Zhang, B. F., and Miao, C. H. (2020). Spatiotemporal changes and driving forces of land use in the Yellow River Basin. Resour. Sci., 42(3), 460–473. doi:10.18402/resci.2020.03.05
Zhang, J., Zhu, W. B., and Wu, S. Y. (2018). Simulation of temporal and special land use changes in Jing-Jin-Ji urban agglomeration using CLUE-S Model. Acta Sci. Nat. Univ. Pekin. 54 (1), 115–124. doi:10.13209/j.0479-8023.2017.137
Zhang, L. Y. (2017) Study on the change of cultivated land use under the background of climate change in Sanjiang Plain[D]. Harbin: Northeast Agricultural University.
Keywords: land use/cover change, driving factors, PLUS model, prediction, multi-scenario simulation
Citation: Ma X, Li J and Li G (2024) Simulation and multi-scenario prediction of land-use change in the Gansu section of the Yellow River Basin, China. Front. Environ. Sci. 12:1403248. doi: 10.3389/fenvs.2024.1403248
Received: 19 March 2024; Accepted: 23 April 2024;
Published: 15 May 2024.
Edited by:
Sérgio António Neves Lousada, University of Madeira, PortugalReviewed by:
Svitlana Delehan, Uzhhorod National University, UkraineLibang Ma, Northwest Normal University, China
Raul Manuel Costa Alves, Camra Municipal de Machico, Portugal
Copyright © 2024 Ma, Li and Li. This is an open-access article distributed under the terms of the Creative Commons Attribution License (CC BY). The use, distribution or reproduction in other forums is permitted, provided the original author(s) and the copyright owner(s) are credited and that the original publication in this journal is cited, in accordance with accepted academic practice. No use, distribution or reproduction is permitted which does not comply with these terms.
*Correspondence: Guang Li, lig@gsau.edu.cn