 Min He
 Yibo Zhang
94% of researchers rate our articles as excellent or good
Learn more about the work of our research integrity team to safeguard the quality of each article we publish.
Find out more
ORIGINAL RESEARCH article
Front. Environ. Sci. , 15 May 2024
Sec. Water and Wastewater Management
Volume 12 - 2024 | https://doi.org/10.3389/fenvs.2024.1401942
This article is part of the Research Topic Methods and Applications of Smart Water Management View all 4 articles
The rapid expansion of urban drainage pipe networks, driven by economic development, poses significant challenges for efficient monitoring and management. The complexity and scale of these networks make it difficult to effectively monitor and manage the discharge of urban domestic sewage, rainwater, and industrial effluents, leading to illegal discharges, leakage, environmental pollution, and economic losses. Efficient management relies on a rational layout of drainage pipe network monitoring points. However, existing research on optimal monitoring point layout is limited, primarily relying on manual analysis and fuzzy clustering methods, which are prone to human bias and ineffective monitoring data. To address these limitations, this study proposes a coupled model approach for the automatic optimization of monitoring point placement in drainage pipe networks. The proposed model integrates the information entropy index, Bayesian reasoning, the Monte Carlo method, and the stormwater management model (SWMM) to optimize monitoring point placement objectively and measurably. The information entropy algorithm is utilized to quantify the uncertainty and complexity of the drainage pipe network, facilitating the identification of optimal monitoring point locations. Bayesian reasoning is employed to update probabilities based on observed data, while the Monte Carlo method generates probabilistic distributions for uncertain parameters. The SWMM is utilized to simulate stormwater runoff and pollutant transport within the drainage pipe network. Results indicate that (1) the relative mean error of the parameter inversion simulation results of the pollution source tracking model is linearly fitted with the information entropy. The calculation shows that there is a good positive linear correlation between them, which verifies the feasibility of the information entropy algorithm in the field of monitoring node optimization; (2) the information entropy algorithm can be well applied to the optimal layout of a single monitoring node and multiple monitoring nodes, and it can correspond well to the inversion results of the tracking model parameters; (3) the constructed monitoring point optimization model can well realize the optimal layout of monitoring points of a drainage pipe network. Finally, the pollution source tracking model is used to verify the effectiveness of the optimal layout of monitoring points, and the whole process has less human participation and a high degree of automation. The automated monitoring point optimization layout model proposed in this study has been successfully applied in practical cases, significantly improving the efficiency of urban drainage network monitoring and reducing the degree of manual participation, which has important practical significance for improving the level of urban water environment management.
With the continuous expansion of the urban scale, the complexity of urban drainage pipe networks is also increasing. Enhancing the monitoring of these networks is crucial for protecting drainage facilities and enhancing urban information management (Shi et al., 2021). The drainage pipe network plays a vital role in urban stormwater management by ensuring water safety, reducing flood control pressure, alleviating water scarcity, and enhancing water quality (Mirauda and Ostoich, 2020; Groothuis et al., 2021). However, with rapid industrialization, environmental pollution issues have become more pronounced, posing new challenges to urban drainage systems. Among them, due to the high cost of wastewater treatment, the phenomenon of illegal discharge or leakage of sewage from the pipeline network occurs from time to time, resulting in a serious threat to the active sludge of the wastewater treatment plant and resulting in a variety of problems, such as the treatment of water quality not being up to the standard and the deterioration of the quality of the discharged water body. Strengthening drainage network monitoring is one of the most effective measures to solve the urban underground drainage problem (Guo et al., 2018; Meyer et al., 2018).
At present, there are many research studies on drainage network monitoring, which mainly focus on drainage network information management and system design (Tang et al., 2018). Wei et al. (2020) studied the establishment of an urban waterlogging pre-warning system; using the terminal monitor placed in the inspection well to obtain the actual water depth of each monitoring point when the rainstorm occurs, the inundation situation of each point can be dynamically displayed on the computer. Omamageswari et al. (2021) developed a real-time monitoring system of drainage pipe networks based on the Internet of Things technology.
In addition to the establishment of online monitoring systems to solve the problem of realizing drainage network information technology, another key point lies in the optimization and layout of the monitoring points. Due to limitations in human, material, and financial resources, the layout goal of monitoring points is to use as few monitoring points as possible to obtain comprehensive, efficient, and accurate information related to the monitoring targets (Liu et al., 2018). At present, there are relatively limited studies on the optimal layout of drainage pipe network monitoring points. Most of the existing optimization methods use the empirical formula approach, which is solved by statistical cluster-based analysis or by constructing a multi-objective planning model. Guo et al. (2022) proposed an automatic machine learning (AutoML) technique based on the genetic algorithm to construct a rapid early warning and comprehensive analysis model for urban flooding. For that, the local topography and waterlogging risk are considered, and the AutoML models can be used in the area without monitoring the water level, quickly predict waterlogging depths, and provide spatial grid results for rapid early warning. Banik et al. (2015) studied the optimization of water quality monitoring points in the drainage pipe network. Under the multi-objective programming model, the genetic algorithm was used, and the optimal water quality monitoring points were determined. Based on entropy theory, combined with multi-objective optimization tools and the numerical model, Yazdi (2017) proposed a location method for new sewage stations of urban drainage networks. The modeling framework provides the best compromise between the maximum possible information and the minimum common information between stations, which is applied to the main surface-water collection system in Tehran to determine the new best monitoring point considering the cost. It should be noted that although machine learning algorithms such as genetic algorithms can quickly complete the processing of pipe network data, the objectives in multi-objective optimization are constrained by each other, and it is easy to produce a locally optimal arrangement scheme.
In summary, the current research on the optimization of monitoring points usually considers the water quality monitoring of the water supply network as the optimization goal. The only research on the optimization arrangement of drainage network monitoring points is mostly concentrated on the development of urban waterlogging monitoring systems, and the research on the optimization of urban drainage pipe network monitoring points aiming at the identification of pollution sources is rarely carried out. In addition, the previous optimization method of drainage pipe network monitoring is mainly for the fuzzy clustering method and the dynamic progress method; although set up on the principle of clustering, but still largely dependent on human judgment, correlation recognition is only an auxiliary function, and more dependent on artificial analysis and understanding of the network topology, the final layout results are heavily influenced by artificial factors. A large number of monitoring data may be invalid (Zhao et al., 2018). In addition, most of the current studies optimize the layout of the monitoring points by calculating only a set of monitoring schemes. Few studies have been carried out on how to quantitatively evaluate the obtained monitoring programs, so it is impossible to quantitatively assess the merits and disadvantages of the obtained monitoring programs (Retzer et al., 2009; Keum et al., 2019). Therefore, making full use of the model to strengthen the simulation of drainage network operation under multiple scenarios can reduce the influence of subjective location uncertainty and realize automatic identification of the monitoring points and quantitative and objective evaluation of the monitoring scheme (Blasone et al., 2007; Wu et al., 2021).
In this study, aiming at the optimization of monitoring points with pollution source identification as the goal, the SWMM pipe network model was established. Under the condition of determining the initial monitoring time, monitoring interval time, and monitoring times, the SWMM model was used for simulation, and the posterior probability density under different monitoring conditions was calculated, and the results were put into the information entropy calculation. Information entropy is used to quantify the information of each node in the drainage network, and the location of the monitoring points is gradually selected. Finally, the monitoring cost and monitoring accuracy are comprehensively considered to complete the selection of the number of monitoring points, and the optimization design process of the monitoring scheme is finally completed. Combining the information entropy theory and the SWMM model, the uncertainty of pollution source identification is quantified, and the problem of excessive reliance on human judgment inherent in the existing methodologies is overcome to realize the optimization of drainage pipe network monitoring points. The results are expected to provide accurate information and data for the related departments to manage drainage pipe networks, improve our understanding of complex pipe network systems, and provide theoretical support for scientific and effective prevention and control of water pollution events.
In the case of Bayesian statistics, all unknown parameters are regarded as random variables, and their distributions are obtained from the known information (Vrugt, 2016). Therefore, Bayesian statistics provides a rigorous method for uncertainty analysis and can provide key information for management decision-making. Bayesian reasoning is based on the following formula (Martino and Elvira, 2018):
where
The optimal design of the drainage network monitoring scheme mainly includes the optimization of the number and location of the monitoring well points (Jiang et al., 2021; Sambito and Freni, 2021). Assuming that the initial monitoring time is t and the monitoring value obtained from the monitoring scheme s is still recorded as y, then the Bayesian formula can be rewritten as the following:
Since the prior distribution
The normalization constant
In the information theory, information entropy is defined as the measure of uncertainty, which has been widely used to estimate the uncertainty of variables (Li et al., 2012). It can be regarded as the negative expected value of the logarithm of the probability density function of a variable (Parvan, 2010). Among them, the uncertainty definition of a random variable is used to describe the amount of information of the variable. The more information required to describe the variable, the greater the uncertainty of the variable and the greater the information entropy (Monache et al., 2008; Retzer et al., 2009; Mooselu et al., 2020). Based on the above research progress, this paper establishes the SWMM pipe network model; uses the SWMM model to simulate the result under the condition of determining the initial monitoring time, monitoring interval, and monitoring times; takes the information entropy as the evaluation index to calculate the optimal monitoring schemes under different monitoring types; screens and selects the monitoring scheme that takes into account the monitoring cost and monitoring accuracy; and finally, operates with the selected monitoring scheme To summarize, the optimal design of a drainage pipe network monitoring network that can provide accurate information is very important to improve our understanding of complex pipe network systems and reduce heavy and unnecessary capital expenditure (Zhang et al., 2015; Yang et al., 2020). The mathematical expression of information entropy is as follows:
where
The specific coupling calculation process of Python programming of a monitoring point optimization model based on information entropy includes the following five steps: generation of unknown parameters,* inp file modification, extraction and storage of the time series, calculation of the conditional probability function, and calculation of information entropy. The automatic modification of the SWMM model and the extraction of the time series are directly realized in Python program without opening SWMM software. The optimization model is also the coupling calculation of the information entropy algorithm and the SWMM model. The time series extracted by the SWMM model is directly used for the calculation diagram of the likelihood functions
Based on the above coupling principle, Python language programming is used to directly calculate the SWMM model to extract the pollutant concentration monitoring value y, and the inversion model is used to invert the unknown parameter x, where the posterior probability density function of x is
The left end of Equation 6 contains the monitoring value y, but due to the influence of the actual conditions, the actual monitoring value y cannot be obtained in the optimization node stage of the monitoring points. Therefore, it is assumed that the monitoring value y is a random variable, and the corresponding probability density function is
According to Equation 7,
The prediction uncertainty of the expected value of information entropy can be divided into two parts as follows:
where
In Equation 9, the prior distribution information entropy of the inversion parameter x is as follows:
According to Equation 10, the larger the prior range of inversion parameter x, the larger the calculated value of information entropy of parameter x, and the greater the uncertainty of the inversion result of parameter X. When the prior probability distribution
According to Keum et al. (2018), the value of U(S) is less than 0 in equation 11. Therefore, according to the concept of information entropy and formula 8, the use of monitoring points in the Bayesian formula reduces the uncertainty of the inversion parameter X.
Equation 12 is solved by the Monte Carlo method as follows:
First, n samples are randomly selected from the unknown parameter x a priori distribution
Therefore, as long as the monitoring design scheme s is fixed, the approximate information entropy of this monitoring scheme can be obtained through equations 8–11.
The Metropolis–Hastings (MH) algorithm is a typical Markov chain Monte Carlo (MCMC) sampling method. In this study, the Metropolis–Hastings algorithm will be used. Its essence is to construct an appropriate Markov chain and generate the next state under a given state (Abellán et al., 2011; Wang and Chen, 2013). Assuming that the target distribution is
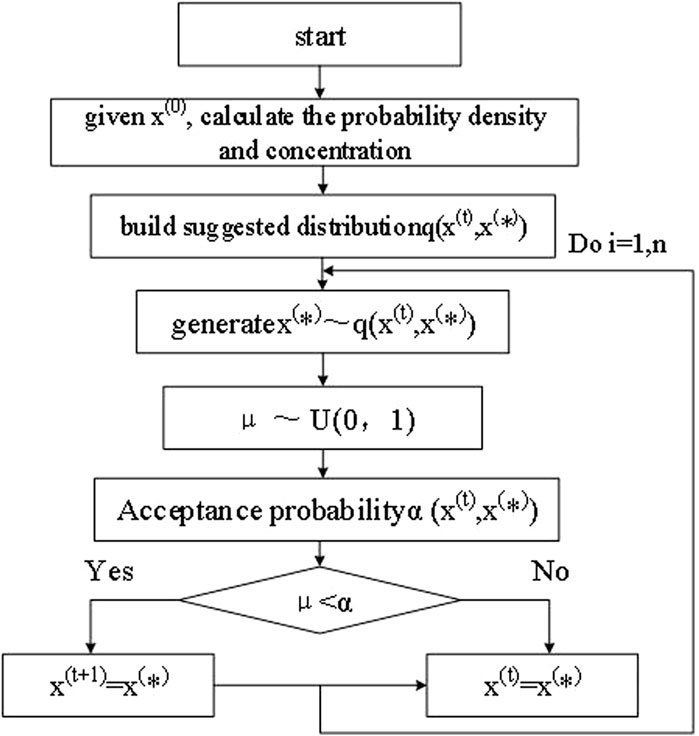
Figure 1. Flowchart of the Metropolis-Hastings sampling algorithm.
It is assumed that the unknown parameters of the model are days, where
According to the Bayesian theorem, the posterior probability density function of the model parameters is as follows:
There are 32 nodes in the pipe network in the study area. If the optimal combination of different numbers of monitoring points is carried out, there will be
In order to reduce the workload and consider the monitoring cost and coverage, on the basis of limiting the five monitoring nodes, this paper optimizes the number and layout of the monitoring nodes in this area and formulates the monitoring scheme by means of progressive addition of nodes based on the minimum information entropy. First, the single node monitoring scheme is optimized, the corresponding monitoring scheme is specified, the single monitoring node with the lowest information entropy from the 32 alternative monitoring nodes is selected, and then the combined monitoring scheme of the two monitoring nodes of the pipe network with the lowest information entropy based on the single monitoring node with the lowest information entropy is screened, and so on. Finally, combined with the monitoring cost, the optimal combined monitoring scheme of multiple monitoring points is determined to ensure that the monitoring nodes accurately cover the whole research area. The information entropy calculation is generalized as follows:
where s represents the monitoring node scheme.
The information entropy
where MRE is the posterior mean error between the posterior mean estimation M and the real parameters α, m is the number of assumed pollution parameter groups, n is the number of parameters, j is the real pollution parameter of group J α, and K represents the kth type of parameter α.
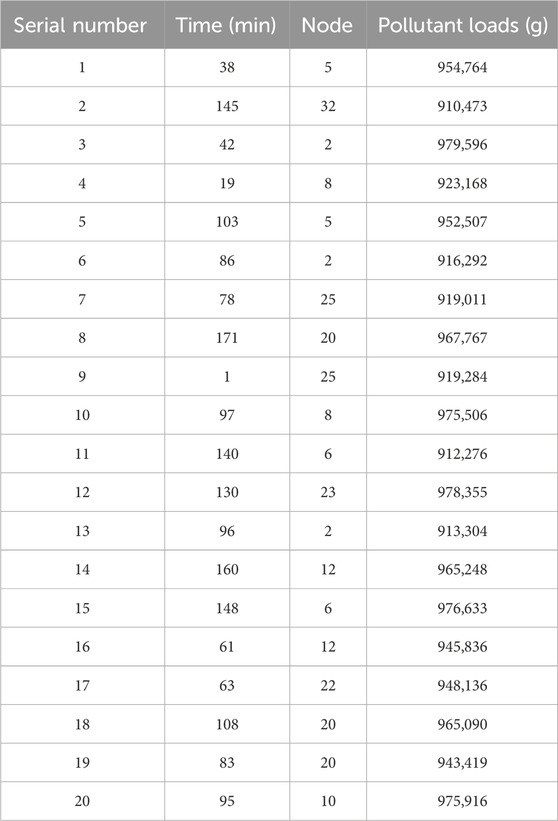
Table 1. Simulation parameter values of prior distribution.
First, the first monitoring point is calculated. According to formula 13, the information entropy and a posteriori mean error of 32 monitoring schemes under S1 are obtained. The calculation results are shown in Table 2. The linear fitting between
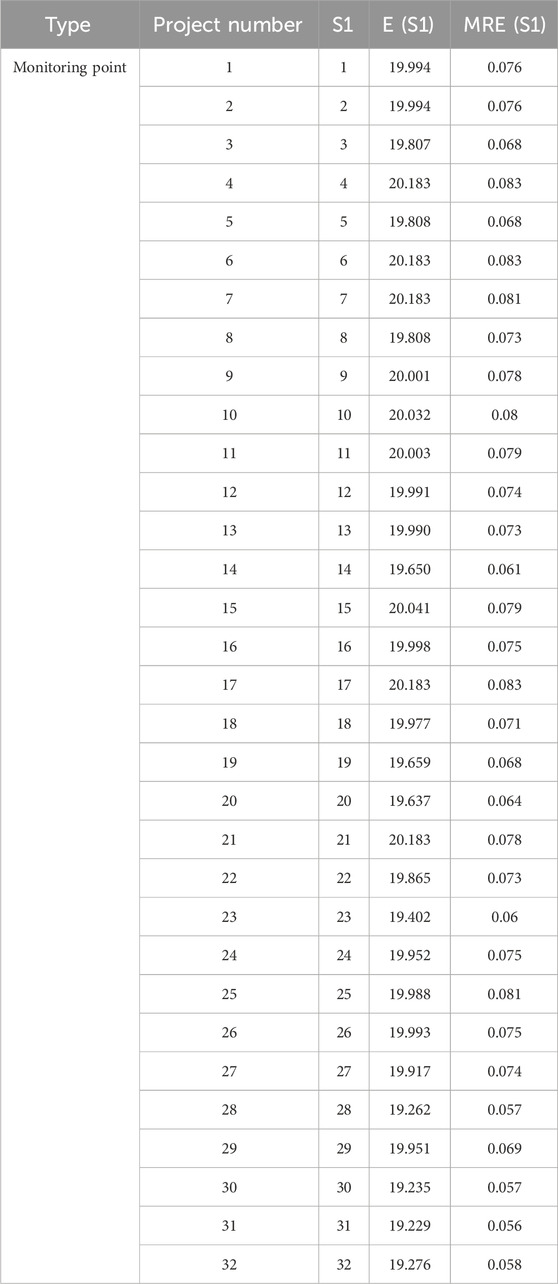
Table 2. Information entropy and posterior mean of the monitoring points.
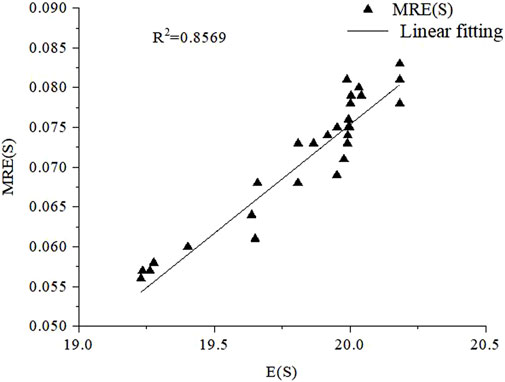
Figure 2. Linear fitting diagram of E (S) and MRE (S) (monitoring point = 1).
It can be seen from Table 2 that the J31 node has the smallest information entropy, so it is regarded as the first monitoring node selected in the multi-monitoring scheme. Subsequently, the second monitoring node in the multi-monitoring scheme is selected, the selected monitoring node J32 and the other 31 alternative monitoring nodes are combined, respectively, to obtain 31 combination forms, and the information entropy of these 31 combined monitoring schemes is calculated. The monitoring scheme of the multi-monitoring combination is shown in Table 3.

Table 3. Optimal design scheme for multiple monitoring points.
It can be seen from Table 3 that there are monitoring schemes with the minimum information entropy under different numbers of monitoring points. Through the monitoring optimization verification of the information entropy algorithm in Section 2.1, it can be seen that information entropy has a positive linear correlation with the posterior mean estimation. Therefore, only the monitoring scheme with the minimum information entropy needs to be selected as the final optimal monitoring layout scheme of the drainage pipe network. Combined with Table 3, the variation curve of information entropy
1. When the selection of monitoring nodes is greater than 1, the monitoring point scheme will take into account the inversion accuracy, monitoring point coverage, and monitoring cost. With the increase in the number of monitoring wells, the coverage of the monitoring points is wider and the monitoring is more accurate, but the monitoring cost increases significantly. It can be seen from the figure that the information entropy of the combination of two monitoring points is not different from that of 3–5 groups of monitoring points. Therefore, considering the detection cost, the J31 and J14 combination monitoring methods are selected as the monitoring scheme.
2. Based on the monitoring well scheme with high inversion accuracy, since the information entropy of 3–5 groups of monitoring wells is not different, it is considered that the inversion accuracy is similar, so the J31, J14, and j27 monitoring combination is selected for this scheme.
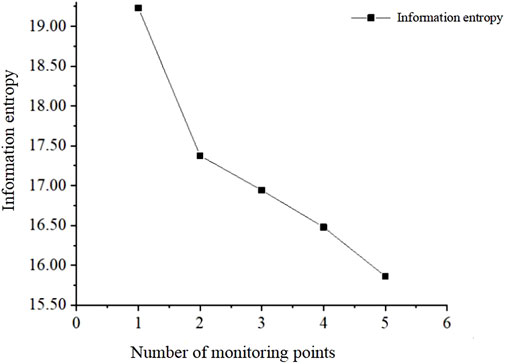
Figure 3. Minimum information entropy changing curve of different monitoring numbers.
It is assumed that the value of model parameters α=(Jx, M, T)=(15, 950000, 60) is true, where Jx is the node number, M denotes pollutant loads, and T denotes time. We use the three monitoring schemes selected in the previous section and the MH algorithm to realize the inversion of pollution source parameters, in which the length of each Markov chain is 10,000. According to the calculation, the posterior distribution range of each monitoring scheme is shown in Table 4. The distribution histogram is shown in Figures 4–6.

Table 4. Posterior statistical results of inversion.
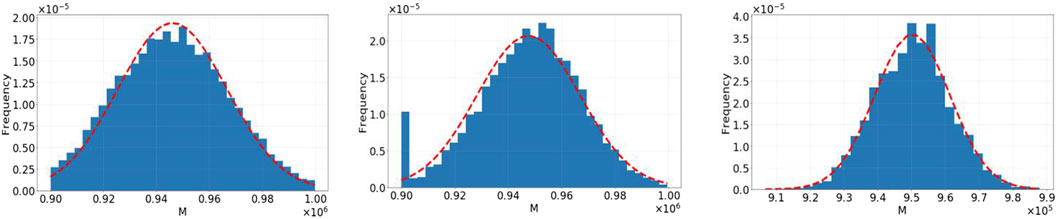
Figure 4. Histogram of parameter M in scheme 1.
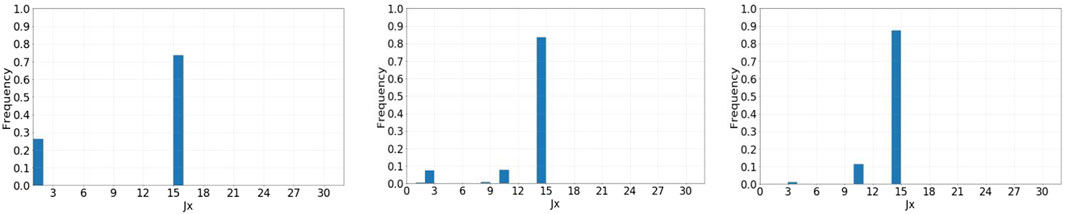
Figure 5. Histogram of parameter Jx in scheme 1.
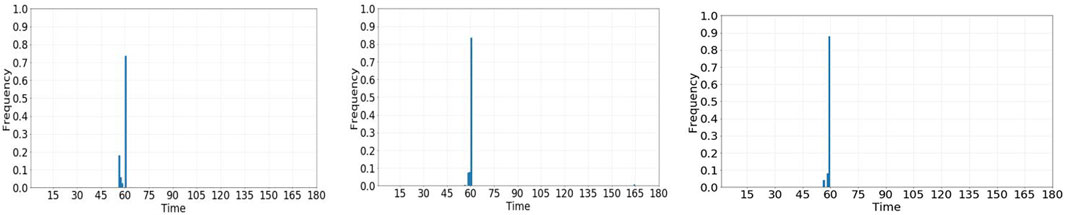
Figure 6. Histogram of parameter T in scheme 1.
It can be seen from Tables 4 and 5 and Figures 3 and 5 that the relative error decreases with the increase in the number of monitoring points, and the mean error of the parameters Jx, M, and T at the two monitoring points decreases by 6.774%, 0.177%, and 0.441%, respectively, compared with that of one monitoring point. The mean value errors of parameters JX, m, and t at the three monitoring points are reduced by 0.993%, 0.012%, and 0.224%, respectively, compared with that of the two monitoring points. The median error of the parameter m at two monitoring points is 0.265% lower than that at one monitoring point. The median error of the parameter m at the three monitoring points is 0.056% lower than that at the two monitoring points. It can be seen that the error of the two monitoring points decreases more than that of one monitoring point, and the error of three monitoring points decreases more slowly than that of two monitoring points, which is consistent with the trend of information entropy, indicating that information entropy can accurately describe the uncertainty of the model.

Table 5. Error statistics of the monitoring schemes.
Among them, the prior range of inversion nodes and inversion time from scheme 1 to scheme 3 is also gradually reduced. Due to the high pollution value, the posterior distribution range is not significantly reduced. However, the mean value error is reduced to a certain extent, which is consistent with the change trend of monitoring scheme information. It can be seen from Table 5 that the real value probabilities of the parameters Jx and T in scheme 2 are increased by 7.78% and 10.03%, respectively, compared with the two parameter probabilities in scheme 1, and the real value probabilities of the parameters Jx and T in scheme 3 are increased by 3.79% and 4.24%, respectively, compared with the two parameter probabilities in scheme 2. It is further determined that the smaller the information entropy of the monitoring scheme, the higher the inversion accuracy and the smaller the uncertainty of the posterior distribution. However, the more the number of monitoring nodes, the more the cost and the less the cost of single-well monitoring. The information entropy difference between scheme 2 and scheme 3 is very small, and the average value of the relative error of the posterior sample mean of the three parameters is also approximately equal. Adding a monitoring point for monitoring will significantly increase the cost. For this case, if it is necessary to comprehensively consider the monitoring cost and the posterior distribution range of the parameters, scheme 2 is considered to be the best monitoring scheme.
Aiming at a series of problems, such as the chaos of the urban drainage supervision system, the frequent occurrence of illegal discharge and leakage of industrial enterprises, the serious pollution impact on the sewage treatment plant, and the destruction of the surrounding environment in the discharge area, this paper puts forward the monitoring point optimization model based on information entropy. This model combines Bayesian reasoning, the Monte Carlo method, the SWMM model, and information entropy to realize the automatic layout of drainage network nodes. Finally, the pollution source tracking model is used to verify the effectiveness of the optimal layout of the monitoring points.
In this paper, information entropy is used as the optimization index for the optimal design of the monitoring well scheme. First, the Bayesian formula is combined with information entropy as the optimization index of the monitoring scheme, and the average value of relative error between information entropy and inversion results is used as the index to evaluate the monitoring scheme; that is, the relative mean error of the parameter inversion simulation results of the pollution source tracking model is linearly fitted with information entropy. Through calculation, it is known that there is a good positive linear correlation between them, which verifies the feasibility of the information entropy algorithm in the field of monitoring node optimization. The optimization results based on the information entropy algorithm under different monitoring schemes are further studied. The smaller the uncertainty of pollution source identification, the smaller the information entropy calculation result. By calculating the information entropy of multiple monitoring points, the optimization of monitoring points of drainage pipe networks is finally realized. The results show that the information entropy algorithm can be well-applied to the optimal layout of a single monitoring node and multiple monitoring nodes and can correspond well to the inversion results of the tracking model parameters. According to the above research, the constructed monitoring point optimization model can well realize the optimal layout of the monitoring points of drainage pipe networks.
Therefore, this paper proposes the optimal design of monitoring points based on the Bayesian information entropy theory, which is helpful in realizing the optimization of monitoring points aiming at pollution source identification and increasing the accuracy of pollution source identification. The research results are helpful for the efficient layout of the monitoring points of urban drainage networks. As an important part of urban ecological environment, urban water environment has an important impact on the governance and improvement of the ecological environment. This study specifically addresses the phenomenon of pollutant smuggling and leakage; however, various water pollution events in real life are intricate and complex. In both domestic and foreign research, quickly tracking water intrusion outside the drainage network poses a significant challenge. Many issues in this area stem from manual search methods and the lack of a well-structured monitoring point arrangement. For such events, further in-depth studies and research are needed in the future.
The raw data supporting the conclusion of this article will be made available by the authors, without undue reservation.
MH: conceptualization and writing–original draft. YZ: data curation and writing–review and editing. ZM: formal analysis and writing–original draft. QZ: funding acquisition and writing–review and editing.
The author(s) declare that financial support was received for the research, authorship, and/or publication of this article. This research was funded by the National Natural Science Foundation of China (grant numbers 51878556, 52009102). The Natural Science Basic Research Program of Shaanxi (Program No. 2023-JC-YB-219).
The authors declare that the research was conducted in the absence of any commercial or financial relationships that could be construed as a potential conflict of interest.
All claims expressed in this article are solely those of the authors and do not necessarily represent those of their affiliated organizations, or those of the publisher, the editors, and the reviewers. Any product that may be evaluated in this article, or claim that may be made by its manufacturer, is not guaranteed or endorsed by the publisher.
Abellán, J., Baker, R. M., and Coolen, P. A. F. (2011). Maximising entropy on the nonparametric predictive inference model for multinomial data. Eur. J. Operational Res. 212, 112–122. doi:10.1016/j.ejor.2011.01.020
Ainslie, B., Reuten, C., Steyn, D. G., and Zidek, J. V. (2009). Application of an entropy-based Bayesian optimization technique to the redesign of an existing monitoring network for single air pollutants. J. Environ. Manag. 90, 2715–2729. doi:10.1016/j.jenvman.2009.02.016
Banik, B. K., Alfonso, L., Torres, A. S., Mynett, A., Di Cristo, C., and Leopardi, A. (2015). Optimal placement of water quality monitoring stations in sewer systems: an information theory approach. Procedia Eng. 119, 1308–1317. doi:10.1016/j.proeng.2015.08.956
Blasone, R. S., Vrugt, J. A., Madsen, H., Rosbjerg, D., Robinson, B. A., and Zyvoloski, G. A. (2007). Generalized likelihood uncertainty estimation (GLUE) using adaptive Markov chain Monte Carlo sampling. Adv. Water Resour. 31, 630–648. doi:10.1016/j.advwatres.2007.12.003
Groothuis, P. A., Mohr, T. M., Whitehead, J. C., Cockerill, K., and Gu, C. (2021). Measuring the direct and indirect effect of scientific information on valuing storm water management programs with a hybrid choice model. Water Resour. Res. 57 (5). doi:10.1029/2020WR027552
Guo, X. C., Li, M., Zhao, D. Q., et al. (2018). Research and progress on optimal layout of monitoring points in urban drainage network. Water supply drainage China 34, 26–31. doi:10.19853/j.zgjsps.1000-4602.2018.04.006
Guo, Y., Quan, L., Song, L., and Liang, H. (2022). Construction of rapid early warning and comprehensive analysis models for urban waterlogging based on AutoML and comparison of the other three machine learning algorithms. J. Hydrology 605, 127367. doi:10.1016/j.jhydrol.2021.127367
Jiang, X., Ma, R., Wang, Y. X., Gu, W., Lu, W., and Na, J. (2021). Two-stage surrogate model-assisted Bayesian framework for groundwater contaminant source identification. J. Hydrology 594, 125955. doi:10.1016/j.jhydrol.2021.125955
Kaynar, B., and Ridder, A. (2010). The cross-entropy method with patching for rare-event simulation of large Markov chains. Eur. J. Operational Res. 207, 1380–1397. doi:10.1016/j.ejor.2010.07.002
Keum, J., Awol, F. S., Ursulak, J., and Coulibaly, P. (2019). Introducing the ensemble-based dual entropy and multiobjective optimization for hydrometric network design problems: EnDEMO. Entropy 21, 947. doi:10.3390/e21100947
Keum, J., Coulibaly, P., Razavi, T., Tapsoba, D., Gobena, A., Weber, F., et al. (2018). Application of SNODAS and hydrologic models to enhance entropy-based snow monitoring network design. J. Hydrology 561, 688–701. doi:10.1016/j.jhydrol.2018.04.037
Li, C., Singh, V. P., and Mishra, A. K. (2012). Entropy theory-based criterion for hydrometric network evaluation and design: maximum information minimum redundancy. Water Resour. Res. 48, W05521. doi:10.1029/2011WR011251
Liu, B. J., Chen, X. H., Lian, Y. Q., and Wu, L. (2013). Entropy-based assessment and zoning of rainfall distribution. J. Hydrology 490, 32–40. doi:10.1016/j.jhydrol.2013.03.020
Liu, X. C., Zhang, H. F., Song, X. M., Gao, Y., Yang, Y. S., Wang, C. Y., et al. (2018). Monitoring and analysis of the current situation of the drainage network in a city of northern China. IOP Conf. Ser. Earth Environ. Sci. 186, 012033. doi:10.1088/1755-1315/186/6/012033
Martino, L., and Elvira, V. (2018). Group importance sampling for particle filtering and MCMC. Digit. Signal Process. 82, 133–151. doi:10.1016/j.dsp.2018.07.007
Meyer, A. M., Klein, C., Fünfrocken, E., Kautenburger, R., and Beck, H. P. (2018). Real-time monitoring of water quality to identify pollution pathways in small and middle scale rivers. Sci. Total Environ. 651, 2323–2333. doi:10.1016/j.scitotenv.2018.10.069
Mirauda, D., and Ostoich, M. (2020). MIMR criterion application: entropy approach to select the optimal quality parameter set responsible for river pollution. Sustainability 12 (5), 2078. doi:10.3390/su12052078
Monache, L. D., Lundquist, J. K., Kosovic, B., Johannesson, G., Dyer, K. M., Aines, R. D., et al. (2008). Bayesian inference and Markov chain Monte Carlo sampling to reconstruct a contaminant source on a continental scale. J. Appl. Meteorology Climatol. 47, 2600–2613. doi:10.1175/2008JAMC1766.1
Mooselu, M. G., Liltved, H., Nikoo, M. R., Hindar, A., and Meland, S. (2020). Assessing optimal water quality monitoring network in road construction using integrated information-theoretic techniques. J. Hydrology 589, 125366. doi:10.1016/j.jhydrol.2020.125366
Omamageswari, M., Mohanraj, A., Jeeva, S. C., Reddy, A. K., and Penchalaiah, U. (2021). Iot based smart drainage monitoring and cleaning system for solid waste materials. Mater. Today Proc. 3. doi:10.1016/j.matpr.2020.11.940
Parvan, A. S. (2010). Critique of multinomial coefficients method for evaluating Tsallis and Rényi entropies. Phys. A Stat. Mech. its Appl. 389, 5645–5649. doi:10.1016/j.physa.2010.08.040
Retzer, J. J., Soofi, E. S., and Soyer, R. (2009). Information importance of predictors: concept, measures, Bayesian inference, and applications. Comput. Statistics Data Analysis 53, 2363–2377. doi:10.1016/j.csda.2008.03.010
Sambito, M., and Freni, G. (2021). Strategies for improving optimal positioning of quality sensors in urban drainage systems for non-conservative contaminants. WATER 13, 934. doi:10.3390/w13070934
Shi, Z. B., Shen, Q. R., Tan, Q., and Li, T. (2021). Development of integrated flooding early warning and rainfall runoff management platform for downtown area of shanghai. Sustainability 13 (20), 11250. doi:10.3390/su132011250
Tang, X. Z., Shu, Y. Q., lian, Y. Q., Zhao, Y., and Fu, Y. (2018). A spatial assessment of urban waterlogging risk based on a Weighted Naive Bayes classifier. Sci. Total Environ. 630, 264–274. doi:10.1016/j.scitotenv.2018.02.172
Vrugt, A. J. (2016). Markov chain Monte Carlo simulation using the DREAM software package: theory, concepts, and MATLAB implementation. Environ. Model. Softw. 75, 273–316. doi:10.1016/j.envsoft.2015.08.013
Wang, G. S., and Chen, S. L. (2013). Evaluation of a soil greenhouse gas emission model based on Bayesian inference and MCMC: model uncertainty. Ecol. Model. 253, 97–106. doi:10.1016/j.ecolmodel.2012.09.010
Wang, H., and Jin, X. (2013). Characterization of groundwater contaminant source using Bayesian method. Stoch. Environ. Res. Risk Assess. 27, 867–876. doi:10.1007/s00477-012-0622-9
Wang, H. Q., Lin, G., and li, G. L. (2016). Gaussian process surrogates for failure detection: a Bayesian experimental design approach. J. Comput. Phys. 313, 247–259. doi:10.1016/j.jcp.2016.02.053
Wei, M., She, L., and You, X. Y. (2020). Establishment of urban waterlogging pre-warning system based on coupling RBF-NARX neural networks. Water Sci. Technol. 82 (9), 1921–1931. doi:10.2166/wst.2020.477
Wu, H. J., Chen, B., Ye, X. D., Guo, H., Meng, X., and Zhang, B. (2021). An improved calibration and uncertainty analysis approach using a multicriteria sequential algorithm for hydrological modeling. Sci. Rep. 11, 16954. doi:10.1038/s41598-021-96250-6
Yan, L., and Zhou, T. (2019). Adaptive multi-fidelity polynomial chaos approach to Bayesian inference in inverse problems. J. Comput. Phys. 381, 110–128. doi:10.1016/j.jcp.2018.12.025
Yang, Y. H., Sun, L. F., Li, R. N., Yin, J., and Yu, D. (2020). Linking a storm water management model to a novel two dimensional model for urban pluvial flood modeling. Int. J. Disaster Risk Sci. 11, 508–518. doi:10.1007/s13753-020-00278-7
Yazdi, J. (2017). Optimization of hydrometric monitoring network in urban drainage systems using information theory. Water Sci. Technol. 76, 1603–1613. doi:10.2166/wst.2017.226
Zeng, X. K., Wu, J. C., Wang, D., Zhu, X., and Long, Y. (2016). Assessing Bayesian model averaging uncertainty of groundwater modeling based on information entropy method. J. Hydrology 538, 689–704. doi:10.1016/j.jhydrol.2016.04.038
Zhang, J. J., Li, W. X., Zeng, L. Z., and Wu, L. (2016). An adaptive Gaussian process-based method for efficient Bayesian experimental design in groundwater contaminant source identification problems. Water Resour. Res. 52, 5971–5984. doi:10.1002/2016WR018598
Zhang, J. J., Zeng, L. Z., Chen, C., Chen, D., and Wu, L. (2015). Efficient Bayesian experimental design for contaminant source identification. Water Resour. Res. 51, 576–598. doi:10.1002/2014WR015740
Keywords: pipe network, optimization of monitoring points, information entropy, Bayesian reasoning, pollution source tracking
Citation: He M, Zhang Y, Ma Z and Zhao Q (2024) Intelligent optimal layout of drainage pipe network monitoring points based on information entropy theory. Front. Environ. Sci. 12:1401942. doi: 10.3389/fenvs.2024.1401942
Received: 18 March 2024; Accepted: 26 April 2024;
Published: 15 May 2024.
Edited by:
Ming Zhong, Sun Yat-sen University, ChinaReviewed by:
Ying Zhu, Xi’an University of Architecture and Technology, ChinaCopyright © 2024 He, Zhang, Ma and Zhao. This is an open-access article distributed under the terms of the Creative Commons Attribution License (CC BY). The use, distribution or reproduction in other forums is permitted, provided the original author(s) and the copyright owner(s) are credited and that the original publication in this journal is cited, in accordance with accepted academic practice. No use, distribution or reproduction is permitted which does not comply with these terms.
*Correspondence: Zhaoxi Ma, MTIwMDcxMDAwNEBzdHUueGF1dC5lZHUuY24=
Disclaimer: All claims expressed in this article are solely those of the authors and do not necessarily represent those of their affiliated organizations, or those of the publisher, the editors and the reviewers. Any product that may be evaluated in this article or claim that may be made by its manufacturer is not guaranteed or endorsed by the publisher.
Research integrity at Frontiers
Learn more about the work of our research integrity team to safeguard the quality of each article we publish.