- 1Faculty of Civil Engineering and Geosciences, Delft University of Technology, Delft, Netherlands
- 2Department of Coastal and Urban Risk and Resilience, IHE Delft, Institute for Water Education, Delft, Netherlands
- 3Department of Civil Engineering, Universitas Muhammadiyah Kendari, Kendari, Indonesia
- 4Department of Hydro Informatics and Socio-Technical Innovation, IHE Delft, Institute for Water Education, Delft, Netherlands
- 5Department of Urbanism, Faculty of Architecture and the Built Environment, Delft University of Technology, Delft, Netherlands
- 6Urban Climate Modelling, VITO–Flemish Institute for Technological Research, Mol, Belgium
- 7Center for Applied Climate Services, Agency for Meteorology, Climatology and Geophysics of Republic of Indonesia (BMKG), Jakarta, Indonesia
Urbanization is one of the important drivers of increasing local temperatures. As cities and urban areas evolve, extensive land use and land cover (LULC) changes alter the physical characteristics of surface materials. This modification results in reduced evapotranspiration rates, ultimately contributing to higher surface and air temperatures. This study investigated the impact of urbanization on urban temperature in Jakarta. Urban temperature was simulated for a 20-year time period (1995–2014) by the urban boundary layer climate model UrbClim, using LULC data for both 1995 and 2014. Temperature changes were analysed by assessing the temperature anomaly across different LULC change classes divided into four main classes namely no built-up changes (BB), no green spaces changes (GG), built-up to green spaces (BG), and green spaces to built-up (GB). The study revealed that the conversion of green spaces to built-up areas (GB) had the most significant impact on the increase in air temperature. This was indicated by the mean values of the temperature anomaly of GB of about 0.24°C followed by GG, BB, and BG with the mean values of the temperature anomaly of about 0.20°C, 0.19°C, 0.17°C, respectively. The different temperature anomalies of the LULC change classes indicate that green spaces have an important role in maintaining local climate. Hence, it is important for local government to effectively manage the composition, the quantity, as well as the distribution of green spaces within a city. By looking at temperature anomalies of LULC change classes, the present study provides an alternative approach to many existing methods that provide general information about temperature changes, without specifically analyzing the effects of LULC transformations.
1 Introduction
Urbanization is one of the key factors driving urban temperatures to increase. As cities and urban areas expand and regenerate over time, they experience significant land-use land cover (LULC) change due to urban development and densification. Urbanization and LULC changes influence the landscape pattern of urban areas often resulting in a decrease in aggregation and connectivity of green spaces, along with an increase in built-up areas and their aggregation (Haas et al., 2015; Maheng et al., 2021). As a result, green spaces are becoming more fragmented and clustered into smaller areas. In contrast, built-up areas become more connected and lumped into larger continua such as commercial business districts, industrial areas, and dense residential areas, impacting urban ecosystem services (Depietri et al., 2012; Zhang et al., 2018). The spatial extent and pattern of clustered built-up areas and green spaces in urban areas influence the surface energy balance, which in turn affects urban temperature (Majumdar and Biswas, 2016; Guo et al., 2020; Kumari et al., 2019; Song et al., 2014; Wang et al., 2019). Nowadays, many cities are experiencing periods of elevated temperatures which become more intensive during the summertime leading to public health-related problems (Troeyer et al., 2020; Kasai et al., 2017; Sharma et al., 2019; Steul et al., 2018), and increasing energy usage for cooling buildings (Kolokotroni et al., 2012). The increased urban temperature can also trigges the generation of extreme rainfall events (Pathirana et al., 2014; Tsiringakis et al., 2017).
Numerous observational and modelling studies have been recently conducted to investigate the relationship between LULC change and urban temperature (Maheng et al., 2019; Rizvi et al., 2020; Sharma et al., 2019; Srikanth and Swain, 2022). Most of the studies suggest that the removal of vegetation which reduces transpiration rates of urban surface resulting in a decrease of latent heat leads to an increase of the urban temperature. Other factors associated with increasing urban temperature are the widespread use of high thermal admittance materials, such as concrete and asphalt in urban constructions, changes in urban morphology, and an increase in anthropogenic heat. An increase in the built-up and impervious surface has increased sensible heat (Ridder et al., 2015; Derkzen et al., 2015; Doan and Kusaka, 2016), particularly in areas where the vegetation cover is replaced by intensive use of grey materials, impervious surface, and high thermal admittance materials (Maheng et al., 2019; Ranagalage et al., 2017). Urban morphology can also contribute to an increase in the urban temperature, particularly where the configuration of high-rise buildings hampers wind movement (Kleerekoper et al., 2012; Rajagopalan et al., 2014). Furthermore, the increasing urban population puts physical stress on the urban environment, by increasing anthropogenic heat (AH) fluxes from fossil fuel vehicles, buildings, and human metabolism (Lazarova and Kusaka, 2018).
Many recent studies have investigated the impact of LULC change within a certain time period on the air temperature of an urban area based on mean temperature changes (Darmanto et al., 2019; Kubota et al., 2017; Sharma et al., 2019). These studies, however, do not provide insight into the extent the changes in land-use influence the urban temperature and temperature variations associated with different LULC change classes. For instance, temperature changes in green spaces within urban areas that undergo transformation into built-up areas may be higher compared to those urban areas that experience no land-use transformation, as seen in studies where trees are replaced by grassland or suburban areas transition into urban settings (Maheng et al., 2019). A temperature increase is expected in areas that were previously green spaces, primarily due to a reduction in latent heat and evapotranspiration, as well as alterations in radiative responses stemming from changes in the thermophysical properties of surface materials (Forman, 2013; Hamilton et al., 2014; Oke et al., 2017). This urban climate information is essential for urban planners, designers and local governments to foster sustainable urban development in cities without adversely affecting the comfort and well-being of the inhabitants.
In recent years, urban air temperature studies have been supported by a number of different numerical climate models (Darmanto et al., 2019; Ridder et al., 2015; Hürzeler et al., 2022; Michau et al., 2023; Zhang et al., 2017). Climate models offer several advantages for urban climate studies as they provide projections of future urban climate conditions (Oke et al., 2017). UrbClim is one of the climate models suitable for urban temperature studies (García-Díez et al., 2016; Sharma et al., 2019). This model is a boundary climate model designed for urban temperature simulation in the spatial resolution range of hundred meters. It has been developed by using a land surface scheme that is based upon a simplification of urban physics coupled with a 3-D atmospheric boundary layer module (Ridder et al., 2015). The land surface scheme of UrbClim follows energy exchange between soil-vegetation-atmosphere which takes into account urban surface physics. The urban surface in UrbClim is represented as a rough impermeable slab that has values for the albedo, emissivity, thermal conductivity, and volumetric capacity. UrbClim has a finer spatial resolution compared to that of the WRF model, which is the current state-of-the-art Mesoscale model. This model can simulate local climate conditions at a spatial resolution of 1 km. WRF can simulate both urban temperature and urban rainfall (Pathirana et al., 2014), while UrbClim is limited to urban temperature. The ability of UrbClim to simulate urban temperature has been demonstrated in some previous UHI studies, for example, in the studies comprising the four European cities Toulouse, Ghent, Antwerp, and Bilbao (Ridder et al., 2015), Athens (Kourtidis et al., 2015), and Barcelona (García-Díez et al., 2016), as well as Asian cities such as Colombo (Maheng et al., 2019) and New Delhi (Sharma et al., 2019).
An increase in urban temperature due to LULC change is mainly influenced by a decrease in the green spaces and an increase of the built-up areas. The land-use transformation from natural green spaces to built-up areas can change the surface energy balance in an urban area, which decreases latent heat and increases sensible heat (Rios and Ramamurthy, 2022; Wiegels et al., 2021). Important mechanisms of green spaces to control urban temperature are evapotranspiration, and tree shading (Oke et al., 2017). In the evapotranspiration process, green spaces absorb solar radiation which is converted into latent heat which in turn converts water from liquid to water vapor. Latent heat ends up in water vapor, which does not raise the air temperature (Forman, 2013). On the other hand, built-up areas are likely to increase the air temperature. Built-up areas are generally dominated by man-made impervious materials which increase solar radiation absorption. The absorbed energy from solar radiation is converted into sensible heat that is slowly released into the atmosphere causing an increase in air temperature (Oke, 1987). This is the reason why an area becomes warmer after being transformed from a green into a built-up area. The aggregated effect of a gradual and dispersed transformation of green spaces into built-up areas across a city may cause an increase in UHI intensities. Conversely, the LULC change from built-up areas to green spaces can reduce the upward flux of sensible heat and increase latent heat (Roth et al., 2017). Green city policies aiming to increase green and water surface areas in a particular area of a city can influence the air temperature not only at a local scale but also in a larger area (Wiegels et al., 2021).
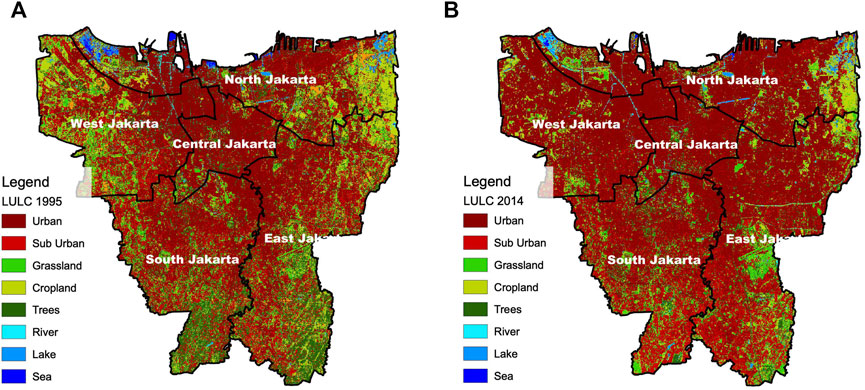
The present study investigates the impact of urbanization on the spatiotemporal changes of urban air temperature by looking at the temperature anomaly across LULC change classes. LULC change is categorized into four main classes: no built-up changes (BB), no green space changes (GG), built-up to green space (BG), and green space to built-up (GB). The impact of LULC changes on urban temperature is analyzed using land-use data from 1995 to 2014, sourced from the study conducted by Maheng et al. (2021) (Figure 2). Maheng et al. (2021) used the Landsat 5 TM L1TP from 24 August 1995, with a spatial resolution of 30 m for the year 1995, and Landsat 8 OLI TIRS L1TP with a spatial resolution of 30 m from 13 September 2014, for the year 2014. The data shows that there is a significant LULC change in Jakarta between 1995 and 2014 in particular with respect to the natural green spaces which have been converted into impervious built-up areas. The surface area of the urban areas increased by 44% whilst the surface area of the green spaces showed a significant decrease in particularly with respect to the tree-covered areas which showed the highest decrease of 58%. Furthermore, the urban air temperature is simulated by using the boundary climate model UrbClim. Two input data are used comprising LULC data of 1995 and 2014 with the boundary climate data from the European Centre for Medium-Range Weather Forecasting (ECMWF) (ECMWF, 2017). Finally, temperature anomalies were analysed by extracting the temperature difference at each LULC change class.
2 Methodology
This study is divided into two parts. The first part focuses on atmospheric modeling activities, involving the simulation of urban air temperatures for the years 1995 and 2014. This time period was chosen due to the availability of Landsat data with cloud cover of less than 15%. The second part concerns the temperature anomaly analysis which aims to investigate the temperature changes across different LULC change classes.
2.1 Study area
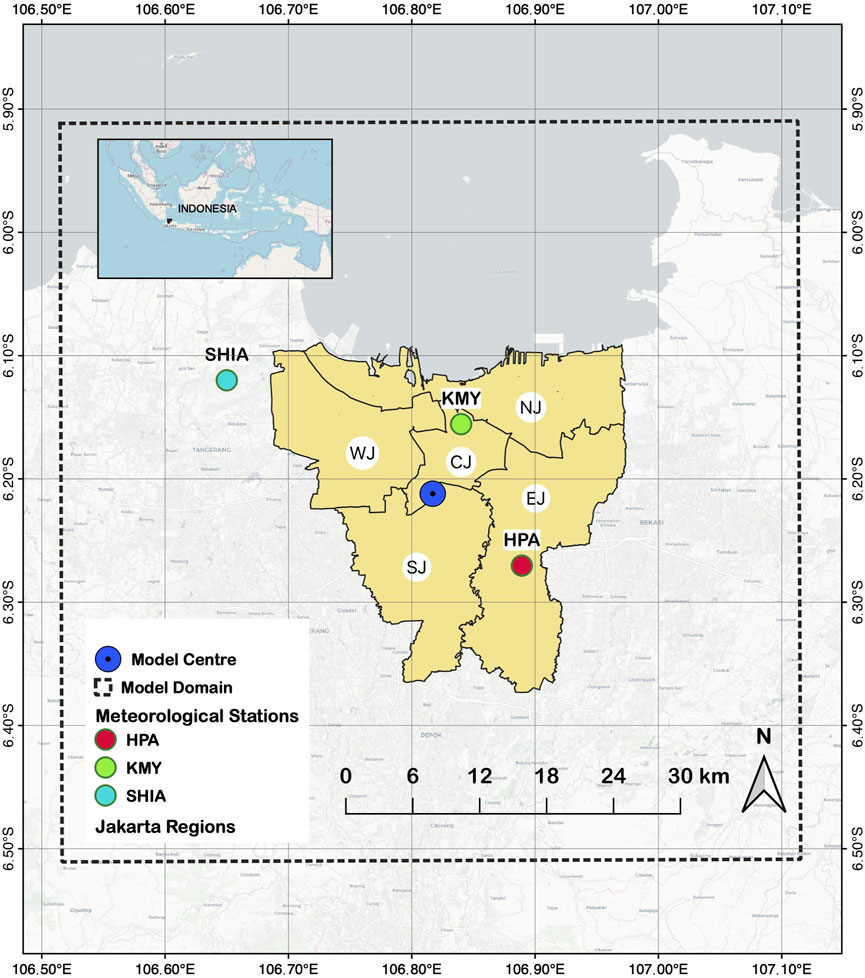
The study is conducted in Jakarta, the capital of Indonesia as depicted in Figure 1. Jakarta has a current population of 10 million, which is expected to become a megacity with more than 13 million inhabitants in 2030 (Nations, 2016). Jakarta consists of five municipalities, which are Central Jakarta (CJ), West Jakarta (WJ), North Jakarta (NJ), South Jakarta (SJ), and East Jakarta (EJ), as depicted in Figure 1. As the capital city of Indonesia, Jakarta serves as the primary political and economic hub of the country. This role is widely regarded as the primary catalyst for urbanization in Jakarta. Based on a census conducted in 2015, the population of Jakarta was estimated at 10 million with a population growth rate of 1.02% per year (Jakarta, 2016). In 2016, East Jakarta had the highest population, while West Jakarta was the most densely populated area, with a population density of 19,000 inhabitants per
Urbanization in Jakarta resulted in rapid expansion in the last decades which transformed natural vegetation land into impervious urban land (Carolita et al., 2002; Maheng et al., 2021; Nagasawa et al., 2015; Pravitasari, 2015; Rustiadi et al., 2002). The effects of urban development in Indonesia, particularly on the local climate, are found to be closely linked to urban temperature (Darmanto et al., 2019; Ramdhoni et al., 2016; Siswanto et al., 2016) and extreme rainfall leading to urban flooding (Siswanto et al., 2015; Siswanto et al., 2022; Supari et al., 2017).
The climate characteristics of Jakarta are influenced by its geographical location on the northwest coast of Java. With a tropical monsoon climate, Jakarta has the rainy season from October through May and the dry season from June to September.
2.2 Atmospheric modelling
2.2.1 An urban boundary layer climate model (UrbClim)
Urban air temperature in Jakarta was simulated with the UrbClim model, using a model domain of 265 × 265 grid cells with a spatial resolution of 250 m Figure 1. The number of vertical layers is 17 of which the first layer is 10 m above the displacement height which decreases upward to 250 m at the model top at a height of 3 km (Ridder et al., 2015). The vertical model domain is customized to match the boundary climate input data from ECMWF. The centre of the model domain was at 106.817°E and −6.212°S, which is located in Jakarta’s downtown, as depicted in Figure 1. Two LULC input data for 1995 and 2014 were simulated with the boundary climate input data from ECMWF for the years 1995–2014. The boundary climate input data is downloaded from ERA-Interim using a temporal resolution of 3 h and a spatial resolution of
The model outputs have been validated with the recorded air temperature at three meteorological stations, which are Soekarno Hatta International Airport (SHIA), Halim Perdanakusumah Airport (HPA), and BMKG office (KMY), as depicted in Figure 1. The model performance has been statistically tested using root mean square error (RMSE) and mean absolute error (MAE), similar to previous UrbClim studies (Ridder et al., 2015; García-Díez et al., 2016; Maheng et al., 2019).
2.2.2 Land use land cover
Landsat-based LULC data were obtained from Maheng et al. (2021), as depicted in Figures 2A, B. Satellite images were utilized to classify the land cover into eight categories: urban, suburban, barren land, grassland, cropland, shrubs, trees, and water. These classes conform to the standard input for surface data in UrbClim (Ridder et al., 2015).
2.2.3 Air temperature simulations
Air temperature of 1995 and 2014 were simulated using two land-use maps in UrbClim simulations in which only the land-use input data was changed. UrbClim’s outputs were validated using data from the BMKG stations and the GHCN database, which included three meteorological stations: Soekarno-Hatta International Airport (SHIA), Halim Perdanakusumah Airport (HPA), and the BMKG office (KMY). The BMKG data was used to validate the outputs from UrbClim’s simulations using the land-use map of 2014, while the GHCN data was used for the UrbClim’s simulations using the land-use map of 1995. The validation test was conducted by comparing the mean air temperature of a corresponding cell located nearby the three corresponding stations. The mean air temperature of 1995 was the ouput of the UrbClim simulation using the land-use map of 1995. Furthermore, the same setup was applied for the mean air temperature of 2014.
2.2.4 Meteorological data
This study uses two meteorological products as an input for the initial and lateral boundary conditions of UrbClim (forcing data). The first is the ERA-Interim from ECMWF (ECMWF, 2017), which was used in the previous UrbClim studies (Ridder et al., 2015; Maheng et al., 2019; Sharma et al., 2019). The ECMWF data has a spatial resolution of
2.2.5 Temperature anomaly analyses
The analysis of the impact of urbanization on urban air temperature were carried out in two steps. First, the urban air temperature change was analysed by calculating the mean air temperature of LULC map of 1995 and 2014. Second, the temperature anomaly was calculated for each LULC change classes, for instance built-up class in 2014 that used to be green spaces in 1995.
The impact of urbanization and LULC change on the urban air temperature change was analysed by calculating the temperature anomaly. The temperature anomaly was the difference between the temperature of a certain year, and a reference value which was in the present study the average temperature over the period of observation (1995–2014) (Li et al., 2019). The temperature anomaly is chosen because it results in a normalization of the data in order to derive at a more accurate temperature pattern, and temperature evolution characteristics (Chelani and Rao, 2013; Pyrgou et al., 2019). In this study, the temperature anomaly was calculated based on the mean air temperature of 1995 and 2014. The temperature anomaly was calculated following Equation 1.
where
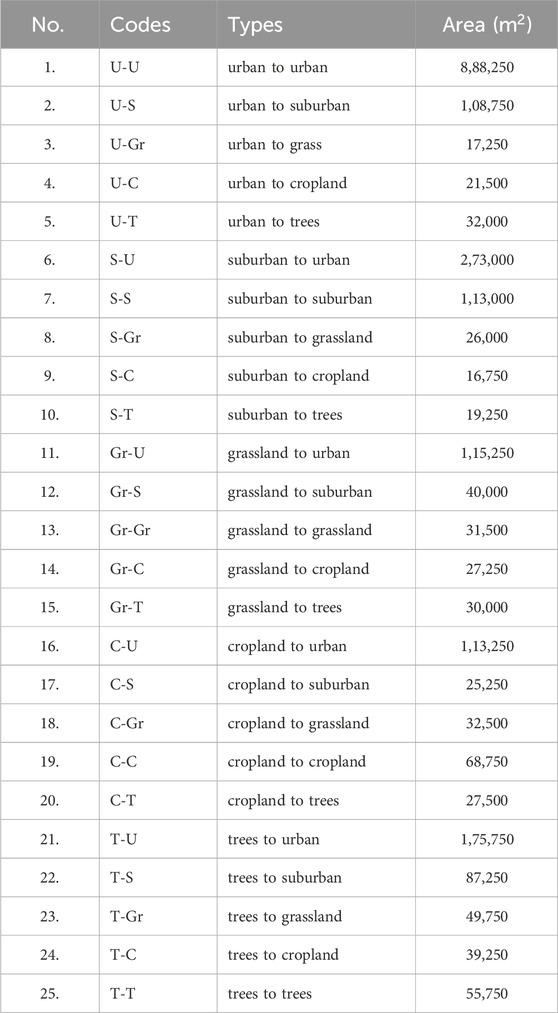
The impact of urbanization and LULC change on the urban temperature was analysed by calculating the temperature anomaly of each LULC change class, for instance, the temperature anomaly in green spaces to built-up areas. The LULC change analysis was done by comparing the LULC map of 1995 and 2014 using the land-use change analysis in QGIS (Congedo, 2021). QGIS is an Open-Source Geographic Information System (GIS) that supports vector, raster, a number of database formats, and spatial analysis functions. QGIS can be used across several operating systems including Linux, Windows, and Mac OSX (QGIS, 2021). This comparison provides detailed information of the spatial changes associated with the transformation of one class to another, for instance, where cropland areas are transformed into urban areas and vice versa. The main classes have been divided into 25 sub-class, as given in Table 1. The temperature anomaly is extracted for each LULC change sub-class in order to assess the temperature changes of the different LULC change sub-classes.
3 Results
3.1 Model validation
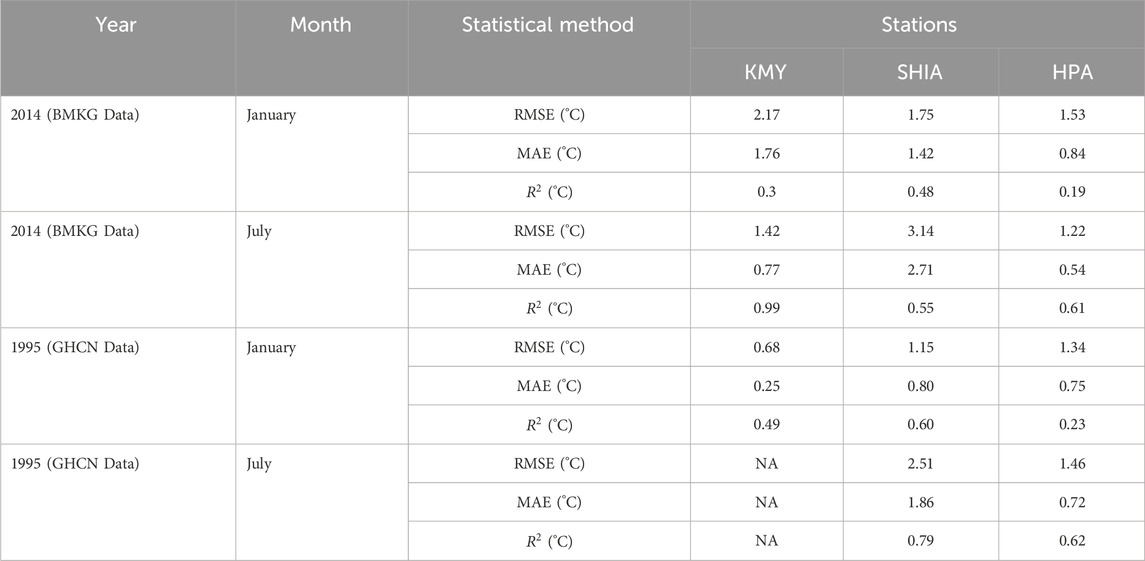
UrbClim was able to simulate air temperature in 1995 and 2014, as shown from the statistical test outputs (see Table 2).
The validation test indicated that the mean air temperatures for land use in 1995 and 2014 had small errors, which are deemed acceptable for 2-m air temperature simulations (Emery et al., 2001). This indicated that UrbClim was able to reproduce the urban air temperature of Jakarta in 1995 and 2014 using land-use map 1995 and 2014, respectively. Moreover, the statistical results showed that the mean air temperature simulation of land-use 1995 had smaller errors compared to that of 2014. The MAE test gave better results compared to that of the RMSE. The validation results are provided in Table 2.
3.2 Spatiotemporal changes of air temperature
The LULC change between 1995 and 2014 was marked by an increase in built-up areas and a decrease in green spaces, as given in Figures 3A, B. An increase in built-up areas was observed in all municipalities where the highest increase rate was observed in West Jakarta (39%), followed by East Jakarta (30%), North Jakarta (28%), and South Jakarta (20%). A small increase rate of 5% was identified in Central Jakarta where the built-up areas was already exist in 1995 as the downtown of Jakarta. The expansion of built-up areas had a notable impact on the availability of green spaces in Jakarta. It is evident that green spaces experienced a decline across all municipalities, correlating with an increase in air temperature, as illustrated in Figures 3C–E.
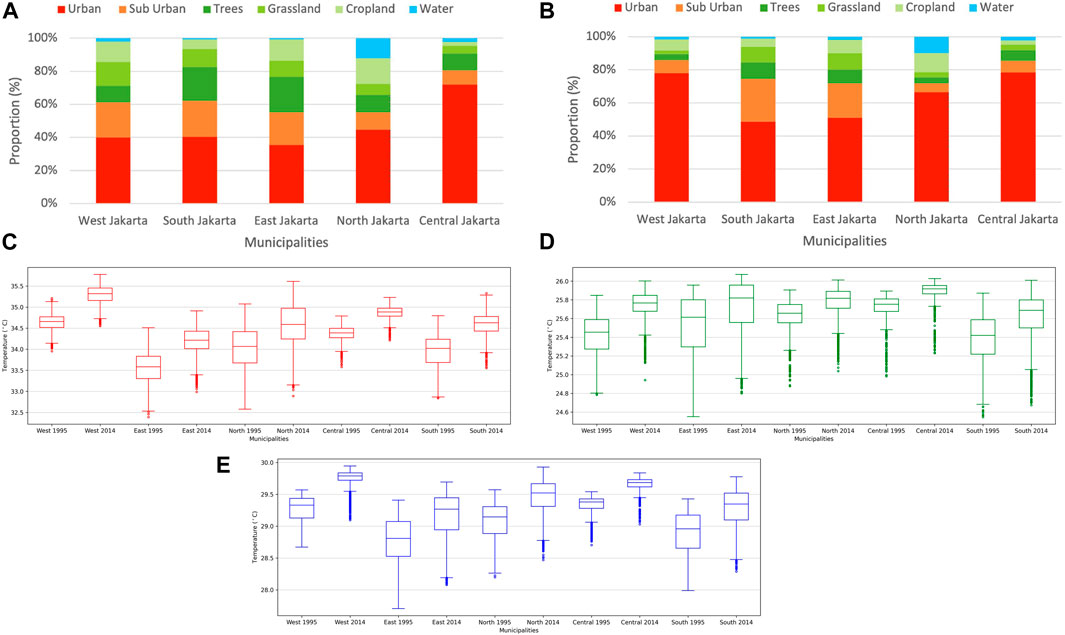
Figure 3. The proportion of built-up and green spaces, and variations of air temperature of 1995 LULC and 2014 LULC. (A, B) show an increase in the proportion of built-up areas compared to green space. (C–E) show increasing maximum, minimum, and mean temperature, respectively.
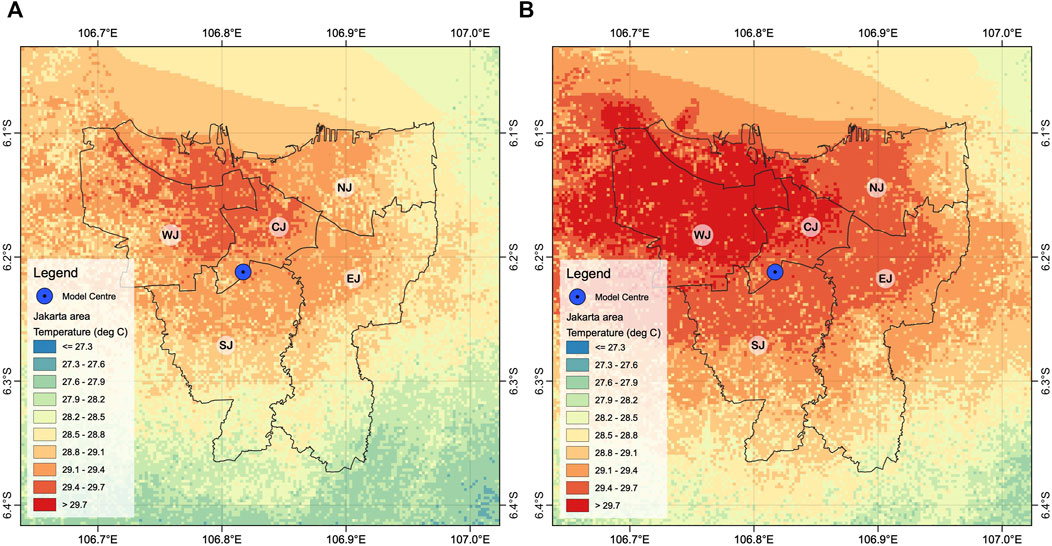
The expansion of built-up areas and reduction in green spaces have impacted the air temperature, changing its spatial distribution between 1995 and 2014, as illustrated in Figures 4A, B. Those figures demonstrate an increase in mean air temperature during the same period, with the spatial distribution predominantly extending towards West Jakarta. In 1995, the mean air temperature was higher than 28°C in West Jakarta (with mean value of 28.4°C), Central Jakarta (with mean value of 29.3°C), and South Jakarta (with mean value of 28.0°C), while East Jakarta and North Jakarta showed a mean air temperature of 27.7°C and 27.2°C, respectively. Compared to 1995, the mean air temperature in 2014 showed an increase in all municipalities; the increase was mostly observed in West Jakarta and Central Jakarta that had mean air temperature 28.8°C (an increase of 0.4°C compared to 1995) and 29.7°C (an increase of 0.4°C compared to 1995), respectively. Other municipalities also experienced an increase in mean air temperature; however, their spatial extension was not as significant as observed in West Jakarta, Central Jakarta, and North Jakarta. In addition, the significant test of the mean air temperature of LULC 1995 and LULC 2014 showed p-value
3.3 Temperature changes in different LULC change classes
LULC change classes have an important role in the air temperature variations. The temperature anomaly in areas where green spaces transformed into built-up areas (GB) was higher than that in the other LULC change classes, as shown in Figures 5A, B. The maximum temperature anomaly ranging from about 0.35°C to about 0.5°C was mainly detected in the new built-up areas of Jakarta where the LULC change was dominated by the GB class, as depicted in Figure 5A. Moreover, no changes in LULC classes, such as built-up to built-up (BB), were observed mainly in Jakarta’s downtown and scattered in other municipalities, which had the temperature anomaly up to about 0.2°C, as depicted in Figure 5B.
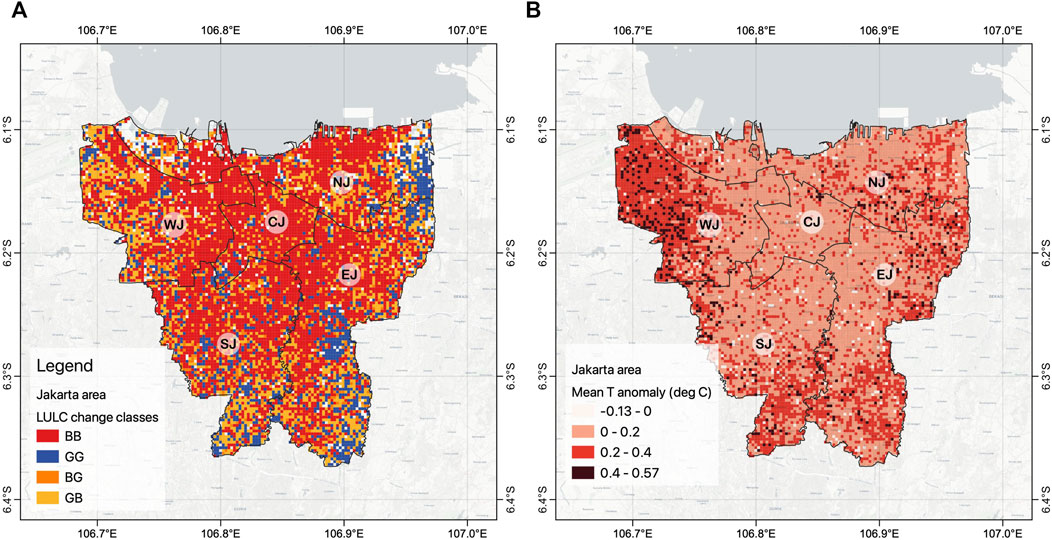
Figure 5. LULC change classes and the average mean air temperature anomaly. (A) LULC change classes. (B) Mean T anomaly.
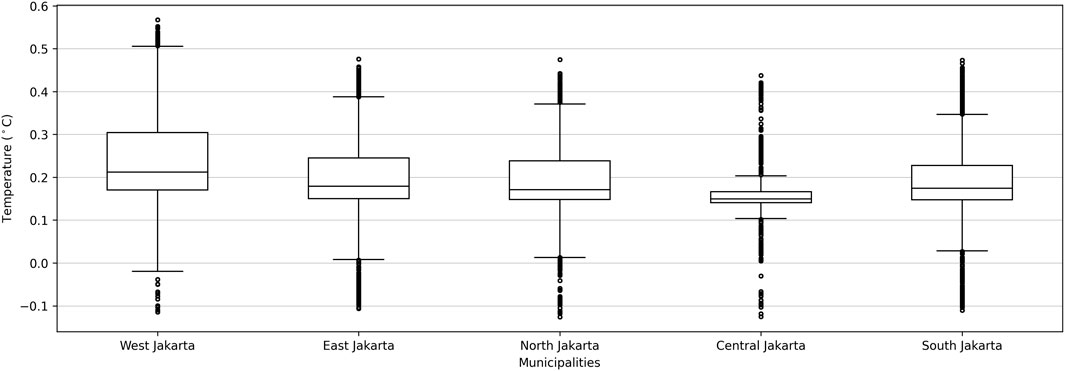
Moreover, the mean temperature anomaly showed the highest distribution in West Jakarta, while the lowest distribution observed in Central Jakarta, as depicted in Figure 6. From Figure 6, the temperature anomaly distribution in West Jakarta is ranging from about 0°C to about 0.5°C which could be associated with high LULC change processes transforming green spaces into built-up areas. On the other hand, in the downtown Jakarta where the built-up areas already existed since 1995, Central Jakarta had a small temperature anomaly distribution ranging from about 0.1°C to about 0.2°C. In other municipalities, the temperature anomaly distribution ranging from about 0°C to about 0.4°C. In addition, the significant tests show that the mean temperature from LULC 1995 and LULC 2014 as well as the mean temperature anomaly at all municipality are statistically significant with p-value
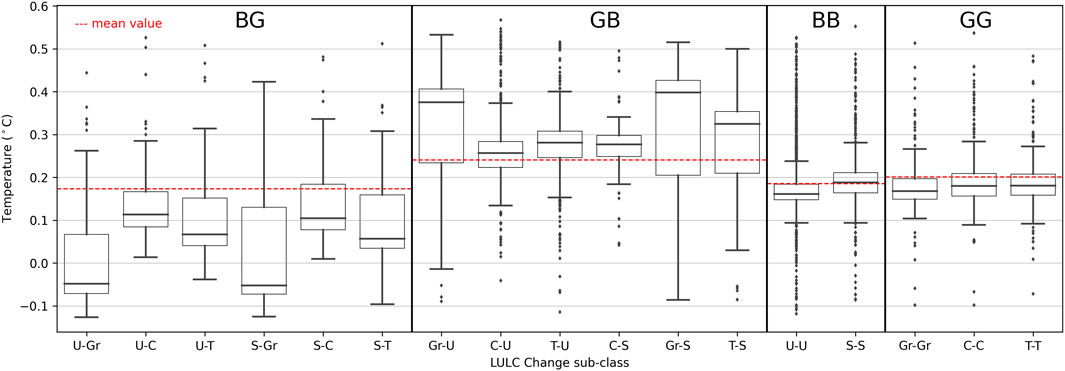
From the temperature anomaly distribution in LULC change sub-class depicted in Figure 7, it can be seen that the LULC change from green spaces to built-up areas will increase urban temperature significantly while the LULC change from built-up areas to green spaces can minimize an increase in air temperature. For example, the LULC change from grassland to urban areas (Gr-U) increased air temperature ranging from about 0°C to about 0.5°C. Furthermore, an increase in air temperature was also observed in areas dominated by trees transformed into urban areas where the temperature anomalies ranged from about 0.15°C to about 0.3°C. In contrast, the lower temperature anomaly distribution was observed in the LULC change from built-up areas to green spaces. For example, the LULC change from urban areas to grassland (U-Gr) had the temperature anomaly distribution from about −0.1°C to about 0.28°C lower than that of Gr-U. Moreover, the LULC change from built-up areas to green spaces may result in cooler temperature, such as in some areas of U-Gr and S-Gr where the temperature anomaly was lower than −0.1°C. Furthermore, the temperature anomaly in areas where there was no changes in LULC had a small distribution ranging from about 0.1°C to about 0.29°C. For instance, the temperature anomaly distribution in LULC change class such as from urban to urban (U-U) was ranging from about −0.1°C to about 0.25°C.
3.4 Limitations of this study and future perspectives
In this study, the increase in urban air temperature was simulated using UrbClim, and the results were validated using data from meteorological stations and the GHCN dataset. Utilizing two different datasets helped overcome the challenge of missing data, particularly the absence of hourly temperature data from the meteorological station in Jakarta for 1995, which was essential for model validation. While hourly temperature data was available for 2014, it was not accessible for 1995 during the study period. The temperature variations at each LULC change sub-class from the model outputs were validated using a point measurement located at the meteorological stations. This may created bias results since the model outputs are the gridded data representing a temperature condition over an area of 250 m in this study. For further research, it is recommended to provide similar data generated from consistent raw data acquisition and pre-processing.
Moreover, the LULC products may have some errors that generates a low level accuracy that can influence the observed temperature. The errors in LULC products were generated during the LULC classification process, and the resamping process from 30 to 250 m. The LULC was based on the Landsat products with the spatial resolution of 30 m, while the UrbClim simulation used the spatial resolution of 250 m. The low accuracy level might create the bias results in the observed anomalies. The bias results can be produced in the UrbClim model since the LULC type at 250 m in the model is the grid-average value of about 64 cells of 30 m spatial resolution. Hence the observed anomalies at the 250 m can only be used as an indication of sub-grid-scale temperature variations. Actual temperature may demonstrate temperature increases which can be much larger than the grid-average value.
The present study could be further improved by considering the temperature change based on the change of leaf area index (LAI), or the change of albedo values (Forman, 2013). Furthermore, in situ temperature monitoring over a certain period of time at a particular LULC change class can provide more accurate temperature information, which is important in model validation. The use of landsat products to estimate the land surface temperature (LST) could be an alternative which may help the results validation (Ermida et al., 2020).
4 Discussion
The LULC changes in Jakarta significantly influenced the spatiotemporal distribution and changes in urban air temperature between 1995 and 2014. This study links temperature changes to LULC change classes, categorized into four main classes: no built-up changes (BB), no green space changes (GG), built-up to green spaces (BG), and green spaces to built-up (GB), each with 25 sub-classes, as listed in Table 1. A notable rise in air temperature was predominantly observed in areas where green spaces were converted into built-up areas, where the temperature anomaly distribution ranged from 0°C to about 0.5°C.
In this study, it was observed that the LULC transition from green spaces to built-up areas has a significant impact on an increase in air temperature. In areas where green spaces transformed into built-up areas such as trees to urban/sub-urban, cropland to urban/sub-urban, and grassland to urban/sub-urban, it was found that the temperature anomaly was higher than that of other classes. Moreover, a slight increase in air temperature was observed in areas where there were not LULC changes. For instance, the temperature anomaly distribution in no built-up changes (BB) class ranged from about 0.1°C to about 0.29°C. The increased temperature in the BB class indicated there was no stationarity in the air temperature in the particular class which could affect an increase in air temperature in its surrounding areas. An increase of air temperature in those LULC transformation classes could be associated with a decrease in latent heat and an increase in sensible heat due to a decrease in green spaces. Decreasing green spaces makes urban areas absorb more solar energy that results in higher temperature compared to that in non-urban areas. The increasing air temperature in the LULC transformed from green spaces to built-up in this study was also observed in other Asian cities, such as in Dhaka city of Bangladesh (Imran et al., 2021) and in Lahore in Pakistan (Arshad et al., 2022).
The spatial distribution of an increased temperature was noted in areas dominated by built-up infrastructure. Notably, in West Jakarta, significant urbanization impacts were observed between 1995 and 2014, with this urban area experiencing a 39% increase in built-up areas and a corresponding rise in mean air temperature of about 0.4°C. This observed temperature increase aligns with findings from previous studies on air temperature in Jakarta. Ramdhoni et al. (2016) discovered that the reduction in green spaces in Jakarta led to an increase in mean air temperatures, rising from 24°C and 30°C in 2001 to 27°C and 30°C in 2014. Moreover, Siswanto et al. (2016) observed an increase in the annual mean air temperature of about 1.6°C per century in the observed period from 1866 to 2012 in Jakarta, which was associated with urbanization. The increasing temperature was higher than the observed global mean temperature rise of 0.85°C in the period from 1880 to 2012 IPCC (2013). The phenomenon of increasing air temperature due to urbanization was also observed in other cities, such as Beijing (Wang et al., 2016), Berlin (Li et al., 2019), Delhi (Sharma et al., 2019), Ho Chi Minh (Doan and Kusaka, 2016), Tokyo (Matsumoto et al., 2017), and American cities of different climate zones (Wang et al., 2019). The observed trend of an increasing temperature is predicted to persist n the future in Jakarta (Darmanto et al., 2019).
Increased urban temperature in Jakarta can also be associated with increased concentrations of pollutants and greenhouse gases, which are not investigated in this study. The high rate of urbanization and LULC change in Jakarta trigger anthropogenic activities that may increase air pollutants and greenhouse gas concentrations in the urban atmosphere. This increase will contribute to an increase in the urban temperature. The relation between LULC change and air pollution have been discussed in some previous studies. For example, increased urban temperature in the city of Bengaluru in India was associated with an increase in the concentration of
The observed air temperature anomaly between 1995 and 2014 stresses the essential role of green spaces in reducing high air temperature in Jakarta and hence the impact of urbanization on the urban temperature characteristics. The important role of green spaces is generally associated with their ecosystem functions such as evapotranspiration, tree shading, and air movement modification (Oke et al., 2017). The influence on the composition and configuration of green spaces is acknowledged but less understood (Bao et al., 2016). In this study it is demonstrated that green spaces have the ability to reduce high temperatures based on a comparison of the mean temperature anomaly in the BG class with that of other classes. The observed lower values indicate that an increase of the temperature is mitigated by the presence of green spaces.
5 Conclusion
The present study investigates the impact of urbanization on the spatiotemporal distribution and the air temperature change in Jakarta between 1995 and 2014. It is found that the LULC change has altered the spatial distribution and increased, the air temperature. Moreover, the mean temperature anomaly in areas transformed from green spaces to built-up areas, GB, is higher than in other LULC change transformations. In the GB class, the mean values of the temperature anomaly was about 0.24°C that was the highest mean values compared to that of GG (0.20°C), BB (0.19°C), and BG (0.17°C).
The LULC change resulted in a significant impact on the variations and spatial distribution of mean air temperature in Jakarta between 1995 and 2014. The expansion of built-up areas contributed to the rise of 0.5°C in air temperature, attributed to a reduction in evapotranspiration resulting from decreased green spaces. Significant increases in air temperature were observed in areas that are transformed from green spaces into built-up areas. These transformations were mainly observed in newly built-up areas of Jakarta where the highest temperature anomaly was about 0.5°C. However, a decreased temperature was observed in areas which were transformed from built-up areas into green spaces where the temperature anomaly could lower than −0.1°C. This indicates that an increasing air temperature can be mitigated by greening solutions in which built-up areas are transformed into green spaces. The ability of green spaces to provide such a climate regulation is influenced by several factors, including the proportion and the distribution of green spaces, as shown in this study. Hence, urban planning and urban land-use management have to play an important role to safeguard that there is an appropriate quantity, composition, and distribution of green spaces in urban (re)development programs to prevent a further increase of the urban air temperature.
The method proposed in this study enables to analyse the detailed impact of urbanization on urban temperature. It offers comprehensive information on land use and land cover (LULC) changes and their implications for temperature variations, a crucial aspect in urban climate studies. The method also highlights that internal factors within the urban environment, such as LULC change, can play a significant role in urban climates alongside the impact of global climate change. Furthermore, the method can serve as an alternative to many existing approaches that offer general information about temperature changes within a specific timeframe, but do not provide detailed insights into temperature changes resulting from LULC transformation. Hence, this study has a novelty that explicitly assess the contribution of different LULC change classes on urban temperature changes which is remain under examined. At the same time, the proposed method also can be used to identify the potential main contributor of the increasing urban temperature, that is important for urban community and related stakeholders in preparing the mitigation and adaptation planning for the climate change in urban areas. Moreover, this research contributes to the existing body of knowledge on the impact of LULC change on increased urban temperature and suggest that the impact of LULC change on urban temperature should consider temperature changes at different LULC change classes.
Data availability statement
The original contributions presented in the study are included in the article/supplementary material, further inquiries can be directed to the corresponding author.
Author contributions
DM: Conceptualization, Formal Analysis, Investigation, Methodology, Validation, Visualization, Writing–original draft, Writing–review and editing. AP: Conceptualization, Methodology, Writing–original draft. BB: Writing–original draft. CZ: Writing–original draft. DL: Software, Writing–original draft. SS: Data curation, Writing–original draft. AS: Data curation, Writing–original draft.
Funding
The author(s) declare that financial support was received for the research, authorship, and/or publication of this article. DM was supported by LPDP Indonesia and Universitas Muhammadiyah Kendari, Indonesia. TU Delft provides the financial support for the open-access publication.
Acknowledgments
The authors acknowledge the use of data from ECMWF, NCDC and NASA. UrbClim was provided by VITO. All UrbClim simulations were done using Netherlands supercomputer infrastructure, SurfSARA.
Conflict of interest
The authors declare that the research was conducted in the absence of any commercial or financial relationships that could be construed as a potential conflict of interest.
Publisher’s note
All claims expressed in this article are solely those of the authors and do not necessarily represent those of their affiliated organizations, or those of the publisher, the editors and the reviewers. Any product that may be evaluated in this article, or claim that may be made by its manufacturer, is not guaranteed or endorsed by the publisher.
References
Arshad, S., Ahmad, S. R., Abbas, S., Asharf, A., Siddiqui, N. A., and Islam, Z. u. (2022). Quantifying the contribution of diminishing green spaces and urban sprawl to urban heat island effect in a rapidly urbanizing metropolitan city of Pakistan. Land Use Policy 113, 105874. doi:10.1016/j.landusepol.2021.105874
Bao, T., Li, X., Zhang, J., Zhang, Y., and Tian, S. (2016). Assessing the distribution of urban green spaces and its anisotropic cooling distance on urban heat island pattern in baotou, China. ISPRS Int. J. Geo-Information 5, 12. doi:10.3390/ijgi5020012
Carolita, I., Zain, A. M., and Trisasongko, B. H. (2002). The land use pattern changes of jabotabek region and tts major causes. Scientific repository
Chelani, A. B., and Rao, P. S. (2013). Temporal variations in surface air temperature anomaly in urban cities of India. Meteorology Atmos. Phys. 121, 215–221. doi:10.1007/s00703-013-0262-8
Congedo, L. (2021). Semi-automatic classification plugin: a python tool for the download and processing of remote sensing images in qgis. J. Open Source Softw. 6, 3172. doi:10.21105/joss.03172
Darmanto, N. S., Varquez, A. C. G., Kawano, N., and Kanda, M. (2019). Future urban climate projection in a tropical megacity based on global climate change and local urbanization scenarios. Urban Clim. 29, 100482. doi:10.1016/j.uclim.2019.100482
Dee, D. P., Uppala, S. M., Simmons, A. J., Berrisford, P., Poli, P., Kobayashi, S., et al. (2011). The era-interim reanalysis: configuration and performance of the data assimilation system. Q. J. R. Meteorological Soc. 137, 553–597. doi:10.1002/qj.828
Depietri, Y., Renaud, F. G., and Kallis, G. (2012). Heat waves and floods in urban areas: a policy-oriented review of ecosystem services. Sustain. Sci. 7, 95–107. doi:10.1007/s11625-011-0142-4
Derkzen, M. L., van Teeffelen, A. J., and Verburg, P. H. (2015). REVIEW: quantifying urban ecosystem services based on high-resolution data of urban green space: an assessment for Rotterdam, The Netherlands. J. Appl. Ecol. 52, 1020–1032. doi:10.1111/1365-2664.12469
Doan, Q.-V., and Kusaka, H. (2016). Numerical study on regional climate change due to the rapid urbanization of greater ho chi minh city’s metropolitan area over the past 20 years. Int. J. Climatol. 36, 3633–3650. doi:10.1002/joc.4582
Emery, C., Tai, E., and Yarwood, G. (2001). Enhanced meteorological modeling and performance evaluation for two Texas ozone episodes. Environ. Int. Corp., 235.
Ermida, S. L., Soares, P., Mantas, V., Göttsche, F.-M., and Trigo, I. F. (2020). Google earth engine open-source code for land surface temperature estimation from the landsat series. Remote Sens. 12, 1471. doi:10.3390/rs12091471
García-Díez, M., Lauwaet, D., Hooyberghs, H., Ballester, J., Ridder, K. D., and Rodó, X. (2016). Advantages of using a fast urban canopy model as compared to a full mesoscale model to simulate the urban heat island of barcelona. Geosci. Model Dev. Discuss., 1–17. doi:10.5194/gmd-2016-10
Guo, A., Yang, J., Xiao, X., Xiao, J., Jin, C., and Li, X. (2020). Influences of urban spatial form on urban heat island effects at the community level in China. Sustain. Cities Soc. 53, 101972. doi:10.1016/j.scs.2019.101972
Haas, J., Furberg, D., and Ban, Y. (2015). Satellite monitoring of urbanization and environmental impacts—a comparison of stockholm and shanghai. Int. J. Appl. Earth Observation Geoinformation 38, 138–149. doi:10.1016/j.jag.2014.12.008
Hamilton, I., Stocker, J., Evans, S., Davies, M., and Carruthers, D. (2014). The impact of the london olympic parkland on the urban heat island. J. Build. Perform. Simul. 7, 119–132. doi:10.1080/19401493.2013.791343
Hürzeler, A., Hollósi, B., Burger, M., Gubler, M., and Brönnimann, S. (2022). Performance analysis of the urban climate model MUKLIMO_3 for three extreme heatwave events in bern. City Environ. Interact. 16, 100090. doi:10.1016/j.cacint.2022.100090
Imran, H. M., Hossain, A., Islam, A. K., Rahman, A., Bhuiyan, M. A. E., Paul, S., et al. (2021). Impact of land cover changes on land surface temperature and human thermal comfort in dhaka city of Bangladesh. Earth Syst. Environ. 5, 667–693. doi:10.1007/s41748-021-00243-4
IPCC (2013). Climate change 2013: the physical science basis. Contribution of working group I to the fifth assessment report of the intergovernmental panel on climate change. Cambridge, England: Cambridge University Press.
Jakarta, B. D. (2016). Jakarta dalam angka (jakarta in figures) 2015 (badan pusat statistik jakarta). Badan Pus. Stat. Provinsi Dki Jkt.
Kasai, M., Okaze, T., Mochida, A., and Hanaoka, K. (2017). Heatstroke risk predictions for current and near-future summers in sendai, Japan, based on mesoscale wrf simulations. Sustain. Switz. 9, 1467. doi:10.3390/su9081467
Kleerekoper, L., Esch, M. V., and Salcedo, T. B. (2012). How to make a city climate-proof, addressing the urban heat island effect. Resour. Conservation Recycl. 64, 30–38. doi:10.1016/j.resconrec.2011.06.004
Kolokotroni, M., Ren, X., Davies, M., and Mavrogianni, A. (2012). London’s urban heat island: impact on current and future energy consumption in office buildings. Energy Build. 47, 302–311. doi:10.1016/j.enbuild.2011.12.019
Kourtidis, K., Georgoulias, A. K., Rapsomanikis, S., Amiridis, V., Keramitsoglou, I., Hooyberghs, H., et al. (2015). A study of the hourly variability of the urban heat island effect in the greater athens area during summer. Sci. Total Environ. 517, 162–177. doi:10.1016/j.scitotenv.2015.02.062
Kubota, T., Lee, H. S., Trihamdani, A. R., Phuong, T. T. T., Tanaka, T., and Matsuo, K. (2017). Impacts of land use changes from the hanoi master plan 2030 on urban heat islands: Part 1. cooling effects of proposed green strategies. Sustain. Cities Soc. 32, 295–317. doi:10.1016/j.scs.2017.04.001
Kumari, M., Sarma, K., and Sharma, R. (2019). Using moran’s i and gis to study the spatial pattern of land surface temperature in relation to land use/cover around a thermal power plant in singrauli district, madhya pradesh, India. Remote Sens. Appl. Soc. Environ. 15, 100239. doi:10.1016/j.rsase.2019.100239
Lazarova, L., and Kusaka, H. (2018). Study on the urban heat island in sofia city: numerical simulations with potential natural vegetation and present land use data. Sustain. Cities Soc. 40, 110–125. doi:10.1016/j.scs.2018.03.012
Li, H., Zhou, Y., Wang, X., Zhou, X., Zhang, H., and Sodoudi, S. (2019). Quantifying urban heat island intensity and its physical mechanism using wrf/ucm. Sci. Total Environ. 650, 3110–3119. doi:10.1016/j.scitotenv.2018.10.025
Maheng, D., Ducton, I., Lauwaet, D., Zevenbergen, C., and Pathirana, A. (2019). The sensitivity of urban heat island to urban green space-a model-based study of city of colombo, Sri Lanka. Atmosphere 10, 151. doi:10.3390/atmos10030151
Maheng, D., Pathirana, A., and Zevenbergen, C. (2021). A preliminary study on the impact of landscape pattern changes due to urbanization: case study of jakarta, Indonesia. Land 10, 218–227. doi:10.3390/land10020218
Majumdar, D. D., and Biswas, A. (2016). Quantifying land surface temperature change from lisa clusters: an alternative approach to identifying urban land use transformation. Landsc. Urban Plan. 153, 51–65. doi:10.1016/j.landurbplan.2016.05.001
Matsumoto, J., Fujibe, F., and Takahashi, H. (2017). Urban climate in the tokyo metropolitan area in Japan. J. Environ. Sci. 59, 54–62. doi:10.1016/j.jes.2017.04.012
Michau, Y., Lemonsu, A., Lucas-Picher, P., and Caillaud, C. (2023). Evaluation of the urban heat island of 12 cities of France in a high-resolution regional climate model simulation. Urban Clim. 47, 101386. doi:10.1016/j.uclim.2022.101386
Nagasawa, R., Fukushima, A., Yayusman, L. F., and Novresiandi, D. A. (2015). Urban expansion and its influences on the suburban land use change in jakarta metropolitan region (jabodetabek). Urban Plan. Des. Res. 3, 7–16. doi:10.14355/updr.2015.03.002
Nations, U. (2016). The world’s cities in 2016: data booklet. New York, NY, United States: Population Division, United Nations.
Ngarambe, J., Joen, S. J., Han, C.-H., and Yun, G. Y. (2021). Exploring the relationship between particulate matter, co, so2, no2, o3 and urban heat island in seoul, korea. J. Hazard. Mater. 403, 123615. doi:10.1016/j.jhazmat.2020.123615
Oke, T. R., Mills, G., Christen, A., and Voogt, J. A. (2017). Urban climates. Cambridge, England: Cambridge University Press. doi:10.1017/9781139016476
Pathirana, A., Denekew, H. B., Veerbeek, W., Zevenbergen, C., and Banda, A. T. (2014). Impact of urban growth-driven landuse change on microclimate and extreme precipitation - a sensitivity study. Atmos. Res. 138, 59–72. doi:10.1016/j.atmosres.2013.10.005
Pravitasari, A. E. (2015). Study on impact of urbanization and rapid urban expansion in java and jabodetabek, megacity in Indonesia Thesis, Bogor, Indonesia, Bogor Agricultural University.
Pyrgou, A., Santamouris, M., Livada, I., and Cartalis, C. (2019). Retrospective analysis of summer temperature anomalies with the use of precipitation and evapotranspiration rates. Climate 7, 104. doi:10.3390/cli7090104
Rajagopalan, P., Lim, K. C., and Jamei, E. (2014). Urban heat island and wind flow characteristics of a tropical city. Sol. Energy 107, 159–170. doi:10.1016/j.solener.2014.05.042
Ramdhoni, S., Rushayati, S. B., and Prasetyo, L. B. (2016). Open green space development priority based on distribution of air temperature change in capital city of Indonesia, jakarta. Procedia Environ. Sci. 33, 204–213. doi:10.1016/j.proenv.2016.03.071
Ranagalage, M., Estoque, R. C., and Murayama, Y. (2017). An urban heat island study of the colombo metropolitan area, Sri Lanka, based on landsat data (1997–2017). ISPRS Int. J. Geo-Information 6, 189. doi:10.3390/ijgi6070189
Ridder, K. D., Lauwaet, D., and Maiheu, B. (2015). Urbclim - a fast urban boundary layer climate model. Urban Clim. 12, 21–48. doi:10.1016/j.uclim.2015.01.001
Rios, G., and Ramamurthy, P. (2022). A novel model to estimate sensible heat fluxes in urban areas using satellite-derived data. Remote Sens. Environ. 270, 112880. doi:10.1016/j.rse.2021.112880
Rizvi, S. H., Fatima, H., Iqbal, M. J., and Alam, K. (2020). The effect of urbanization on the intensification of suhis: analysis by lulc on karachi. J. Atmos. Solar-Terrestrial Phys. 207, 105374. doi:10.1016/j.jastp.2020.105374
Roth, M., Jansson, C., and Velasco, E. (2017). Multi-year energy balance and carbon dioxide fluxes over a residential neighbourhood in a tropical city. Int. J. Climatol. 37, 2679–2698. doi:10.1002/joc.4873
Rustiadi, E., Zain, A. M., Trisasongko, B. H., and Carolita, I. (2002). Land cover change in jabotabek region. Res. Gate.
Sharma, R., Hooyberghs, H., Lauwaet, D., and Ridder, K. D. (2019). Urban heat island and future climate change—implications for Delhi’s heat. J. Urban Health 96, 235–251. doi:10.1007/s11524-018-0322-y
Shi, H., Song, X., and Zeng, S. (2023). Impact of the urban heat island effect on ozone pollution in chengdu city, China. Chin. Geogr. Sci. 33, 1017–1032. doi:10.1007/s11769-023-1391-8
Siswanto, S., van der Schrier, G., and van den Hurk, B. (2022). Observed increase of urban extreme rainfall as surface temperature rise: the jakarta case. J. Meteorological Soc. Jpn. Ser. II, 475–492. doi:10.2151/jmsj.2022-023
Siswanto, S., van Oldenborgh, G. J., van der Schrier, G., Jilderda, R., and van den Hurk, B. (2016). Temperature, extreme precipitation, and diurnal rainfall changes in the urbanized jakarta city during the past 130 years. Int. J. Climatol. 36, 3207–3225. doi:10.1002/joc.4548
Siswanto, S., Oldenborgh, G. J. V., Schrier, G. V. D., Lenderink, G., and Hurk, B. V. D. (2015). Trends in high-daily precipitation events in jakarta and the flooding of january 2014. Bull. Am. Meteorological Soc. 96, S131–S135. doi:10.1175/BAMS-D-15-00128.1
Song, J., Du, S., Feng, X., and Guo, L. (2014). The relationships between landscape compositions and land surface temperature: quantifying their resolution sensitivity with spatial regression models. Landsc. Urban Plan. 123, 145–157. doi:10.1016/j.landurbplan.2013.11.014
Srikanth, K., and Swain, D. (2022). Urbanization and land surface temperature changes over hyderabad, a semi-arid mega city in India. Remote Sens. Appl. Soc. Environ. 28, 100858. doi:10.1016/j.rsase.2022.100858
Steul, K., Schade, M., and Heudorf, U. (2018). Mortality during heatwaves 2003–2015 in frankfurt-main – the 2003 heatwave and its implications. Int. J. Hyg. Environ. Health 221, 81–86. doi:10.1016/j.ijheh.2017.10.005
Supari, S., Tangang, F., Juneng, L., and Aldrian, E. (2017). Observed changes in extreme temperature and precipitation over Indonesia. Int. J. Climatol. 37, 1979–1997. doi:10.1002/joc.4829
Suthar, G., Singhal, R. P., Khandelwal, S., Kaul, N., Parmar, V., and Singh, A. P. (2022). Four-year spatiotemporal distribution and analysis of PM2.5 and its precursor air pollutant SO2, NO2 and NH3 and their impact on LST in Bengaluru city, India. IOP Conf. Ser. Earth Environ. Sci. 1084, 012036. doi:10.1088/1755-1315/1084/1/012036
Troeyer, K. D., Bauwelinck, M., Aerts, R., Profer, D., Berckmans, J., Delcloo, A., et al. (2020). Heat related mortality in the two largest belgian urban areas: a time series analysis. Environ. Res. 188, 109848. doi:10.1016/j.envres.2020.109848
Tsiringakis, A., Schreus, B. W., Steeneveld, G. J., and Siswanto, S. (2017). “The impact of urbanization on an extreme precipitation event over jakarta,” in EMS Annual Meeting: European Conference for Applied Meteorology and Climatology, Dublin, Ireland, January 2017.
Wang, C., Li, Y., Myint, S. W., Zhao, Q., and Wentz, E. A. (2019). Impacts of spatial clustering of urban land cover on land surface temperature across köppen climate zones in the contiguous United States. Landsc. Urban Plan. 192, 103668. doi:10.1016/j.landurbplan.2019.103668
Wang, J., Huang, B., Fu, D., Atkinson, P. M., and Zhang, X. (2016). Response of urban heat island to future urban expansion over the beijing-tianjin-hebei metropolitan area. Appl. Geogr. 70, 26–36. doi:10.1016/j.apgeog.2016.02.010
Wiegels, R., Chapa, F., and Hack, J. (2021). High resolution modeling of the impact of urbanization and green infrastructure on the water and energy balance. Urban Clim. 39, 100961. doi:10.1016/j.uclim.2021.100961
Yu, L., and Leng, G. (2022). Global effects of different types of land use and land cover changes on near-surface air temperature. Agric. For. Meteorology 327, 109232. doi:10.1016/j.agrformet.2022.109232
Zhang, X., Xiong, Z., Zhang, X., Shi, Y., Liu, J., Shao, Q., et al. (2017). Simulation of the climatic effects of land use/land cover changes in eastern China using multi-model ensembles. Glob. Planet. Change 154, 1–9. doi:10.1016/j.gloplacha.2017.05.003
Keywords: urbanization, land use land cover changes, urban temperature changes, Jakarta, UrbClim
Citation: Maheng D, Pathirana A, Bhattacharya B, Zevenbergen C, Lauwaet D, Siswanto S and Suwondo A (2024) Impact of land use land cover changes on urban temperature in Jakarta: insights from an urban boundary layer climate model. Front. Environ. Sci. 12:1399041. doi: 10.3389/fenvs.2024.1399041
Received: 12 March 2024; Accepted: 11 October 2024;
Published: 22 October 2024.
Edited by:
Bushra Khalid, Chinese Academy of Sciences (CAS), ChinaReviewed by:
Nathan Moore, Michigan State University, United StatesBrad Peter, University of Arkansas, United States
Copyright © 2024 Maheng, Pathirana, Bhattacharya, Zevenbergen, Lauwaet, Siswanto and Suwondo. This is an open-access article distributed under the terms of the Creative Commons Attribution License (CC BY). The use, distribution or reproduction in other forums is permitted, provided the original author(s) and the copyright owner(s) are credited and that the original publication in this journal is cited, in accordance with accepted academic practice. No use, distribution or reproduction is permitted which does not comply with these terms.
*Correspondence: Dikman Maheng, bS5kLm1haGVuZ0B0dWRlbGZ0Lm5s
 Dikman Maheng
 Assela Pathirana
 Biswa Bhattacharya
 Chris Zevenbergen
 Dirk Lauwaet6