- 1College of Geomatic Engineering and Geoinformatics, Guilin University of Technology, Guilin, China
- 2Heilongjiang Agricultural Reclamation Academy of Sciences, Harbin, China
The level of detail (LOD) modelling of vector and terrain data is individual, resulting in geometric and topological inconsistencies in simplification processes. The three dimension Douglas Peucker (3D_DP)algorithm can realize gradual discrete point selection through threshold, which is mainly used in DEM synthesis, and its simplified process is very suitable for the dynamic establishment of massive data sets. A new LOD modeling method based on 3D_DP algorithm is proposed to simplify the consistency of river network vector elements and DEM in this paper. The specific steps are as follows: Firstly, the “Bending Adjustment Index (BAI)” is introduced to improve the 3D_DP algorithm, called the improved 3D_DP algorithm; Secondly, the DEM data is extracted into a 3D discrete point dataset, and the river line vector data is also converted into a discrete point dataset, assigned with elevation attributes, and merges with the DEM’s 3D discrete points. The merged point datasets are equenced based on the importance of each point, which are computed by the improved 3D_DP algorithm. The order of deleting points is determined by the sequence and the corresponding model spatial errors are calculated with the deletion of points. Then, the DEM’s 3D discrete points are constructed a Delaunay network with the river line as a mandatory constraint condition. The required triangulation is called in real time with the change of sight distance depending on the simple correspondence between screen projection error and model space error, and the unified LOD model for river line vector and DEM is established. The results show that the river’s overall shape and the terrain’s main features can be reserved under the same simplified factor based on the improved 3D_DP algorithm. The unified LOD model for the river network and DEM is feasible under the importance sequence of merged point datasets by the improved 3D_DP algorithm. Under the proper operation of data blocking, the rendering frame rate can meet practical application requirements.
1 Introduction
LOD model is the foundation of multi-scale representation and operation for massive spatial data (Li et al., 2018; Hu, 2018; Tang et al., 2019; Lv et al., 2020). There are three categories in the study of LOD modelling:
• Texture-based method is to render the vector features into textures and then mapped on terrain. Texture-based techniques have drawbacks related to fixed spatial resolution when retendering and time-consuming in the stage of pre-processing (He et al., 2024; Gao et al., 2020; Koca and Güdükbay, 2014; Chen et al., 2010; Brůha and Kolář, 2018; Zhang et al., 2019);
• Overlay-geometry based method is to overlay and render geometry on the top of terrain. The overlay of geometry and terrain is significantly influenced by the change of the detailed level. (Wang and Chen, 2022; Mai et al., 2020; Yang et al., 2010; Zhou et al., 2016; Zhou et al., 2015);
• Embedded-geometry based method is to embed the vector data into terrain. This approach requires massive intersection operation, leading to a slow speed in calculation (Buyukdemircioglu and Kocaman, 2020; Tang et al., 2020; Wang, 2013).
The above studies indicates that LOD models for vector and DEM have different simplification factors (Yang et al., 2010; Dou et al., 2016). For example, vector and DEM datasets are simplified based on the terrain’s spatial geometry features and roughness, respectively. This difference leads to geometric or topological contradictions in scale-change operations and visual analysis such as “crossing” and “overhanging” of vector lines (Yang et al., 2010). Consequently, it affects the accuracy of data analysis expressions of national mega engineering and emergency decision-making and the temporal accuracy of public geographic information services.
The Douglas-Peucker (DP) algorithm is a classical simplified algorithm for simplifying two-dimensional (2D) vector line data (Douglas and Peucker, 1973; Higham and Mary, 2022; Zhou et al., 2023). This algorithm has been extended from 2D to 3D, and the 3D_DP algorithm has been studied extensively (Fei et al., 2006; Cheng et al., 2022). The 3D_DP algorithm had been widely used in many fields such as synthesis of DEM (He and Fei, 2008), synthesis of geomorphology (Wang and Dou, 2021; Liu, 2007), indirect synthesis of contours (Huang and Fei, 2010; He et al., 2013), extraction of topographic feature (Zhu et al., 2014), Level of detail (LOD) modelling of regular grid topography (Zhang et al., 2011), thinning of seabed multibeam sounding data (Dou et al., 2014), and the synchronous synthesis of the river network and DEM (Dou et al., 2016). The above studies shows that the main geomorphologic features of the mapping areas can be maintained on the basis of the 3D_DP algorithm, and the speed of data synthesis is relatively fast. This algorithm is characterized as a progressive selection of a discrete point in data synthesis, which is beneficial to establish the LOD model (Dou et al., 2016).
LOD modelling is a process of simplification and synthesis. The process of simplification retains the most important visual features. The core of the LOD modelling based on TIN is to create a sequence of sampling points when taking the importance of the discrete points into consideration. The judgment methods for importance determination of sampling points in three-dimensional space mainly include the information judging method (He et al., 2022), space plane angle method (Zhang et al., 2022), point-plane distance method (Fei et al., 2006; Fei and He, 2009), and elevation difference method (Zhang et al., 2022). The above methods are used to determine the importance of the sampling points via regional scope. In contrast, the 3D_DP algorithm is used to judge the importance of the sampling points with global scope.
This paper proposes a new LOD modeling method based on 3D_DP algorithm is proposed to simplify the consistency of river network vector elements and DEM. Firstly, A “Bending Adjustment Index (BAI)” is introduced to improve the 3D_DP algorithm. Secondly, the DEM data is extracted into a 3D discrete point dataset, the river line vector data is also converted into a discrete point dataset, assigned with elevation attributes, and merges with the DEM’s 3D discrete points. And then the merged point datasets are sequenced based on the importance of each point, which are computed by the improved 3D_DP algorithm. The DEM’s 3D discrete points are constructed a Delaunay network with the river line as a mandatory constraint condition. The required triangulation is called in real time with the change of sight distance depending on the simple correspondence between screen projection error and model space error, and the unified LOD model for river line vector and DEM is established. This study intends to verify the correctness and validity of the proposed algorithm via implementing corresponding experiments with river network and DEM data of Baoding and its surrounding areas in Hebei province, China.
2 The improved 3D_DP algorithm
2.1 The principle of the 3D_DP algorithm
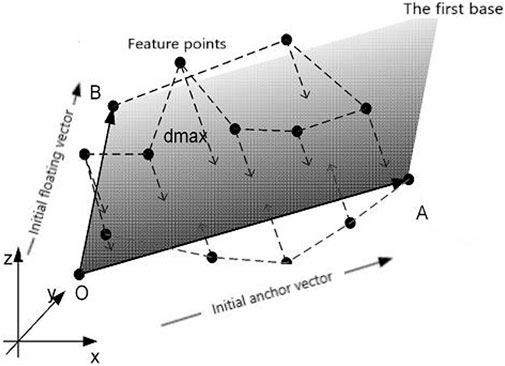
First of all, the origin and first base plane should be determined. Assuming a set of discrete points n and a vector set, Vi is composed of vector lines that connect all the discrete points to the origin (refer to Figure 1). P(i) (
The point dataset should be sequenced next. The random 3D discrete points are sequenced according to the spatial proximity principle. The initial anchor point A is the first point in the point column, and the following new point nearest to the current point must be searched. The initial floating-point B is taken as the final point of the point column, and O is not included in the point column.
Finally, the feature points should be selected. The distance between points and the first base plane is calculated. When the maximum distance is less than the specified threshold, all points must be deleted. When the maximum distance exceeds the specified threshold, the sequenced point dataset can be divided into two-point datasets for the threshold, and then the above processes are repeated for each data set. (Fei et al., 2006).
2.2 The 3D_DP algorithm based on BAI
There is a natural coupling relationship between rivers and landforms (Shu, 2012). In simplifying river vector data and DEM based on the 3D_DP algorithm, the curved shape of the rivers in the horizontal direction cannot be retained. Particularly, the points of the river with different bending sizes are eliminated under the control of a certain threshold in the local scale with flat areas.
The BAI is proposed to improve the 3D_DP algorithm; it can identify the bending size of the river shape. BAI is used to adjust the distance between point and plane in the 3D_DP algorithm, and the pseudo distance between point and plane is obtained. The pseudo distance between point and plane is compared with the preset threshold value to determine the selection of river points afterward. Finally, the river and DEM’s overall shape and main features are preserved.
2.2.1 Determination and comparison of river bending size
A river consists of numinous bends of different sizes, and the bends are regarded as the basic units of river line synthesis. Based on this conception, Shu (2012) proposed a mathematical definition of bend to recognize and divide the size of the bend. Numerous methods for determining a bend are available. This study adopts a definition of bend on the basis of turning point (Shen, 2009). A curve consists of some line segments, and each two adjacent line segment has a turning angle. When the turning angle is rotated counterclockwise, the angle is defined as positive (+); otherwise, the angle is defined as negative (−). Moreover, the direction of the turning angle changes when the direction of the line segment changes. The point where the turning angle changes is called the turning point of the curve.
As shown in Figure 2, P2 and P3 are turning points of a curve, and P1P2 is a positive bend, and P2P3 is a negative bend. A bend has two characteristics according to its definition: (1) positive angle and negative angle present alternately; (2) Bends are connected, and all of the curve points are included in bends.
In this study, a bend is characterized as bending width W, bending length L, bending area S, bending area coefficient E, and bending degree F.
① Bending width W is bending diameter. For instance, the straight distance of P2P3 is a bending width.
② Bending length L is the length of the arc of P2P3.
③ Bending area S is the area enclosed by P2P3 (L) and the straight distance of P2P3 (W).
④
⑤
2.2.2 The bending adjustment index
BAI is proposed to present the size of each bend and to illustrate the influence of bending length and bending area on bending degree. To calculate BAI (See Equation 1), the area coefficient (e), bending degree (f), bending length ratio, and bending area ratio are utilized:
Where
The pseudo distance between point and plane can be calculated by Equation 2
where dk indicates the distance between point Pk and the base plane in 3D_DP algorithm, and C is the bending adjustment constant, which can be determined by experiments with regard to regional geomorphology.
2.2.3 The division of geomorphology
BAI is adopted to regulate the distance between point and plane to avoid the excessive synthesis of rivers and DEM in flat areas. The regulation degree of BAI is closely related to the type of geomorphology. Generally, flat areas are higher regulated, while steep slope areas show opponent phenomenon. Therefore, it is essential to distinguish the regulation effects of BAI on river segments with respect to different geomorphology types.
The geomorphology of China is categorized as different types based on regional geomorphological characteristics. Combining with the national standard of the classification of plains and mountains (Wang et al., 2020), the classification standard of geomorphology types was referenced for this study, and the bending adjustment constant C is determined by experiments, as shown in Table 1.
3 The unified LOD modelling algorithm for river network line vector and DEM
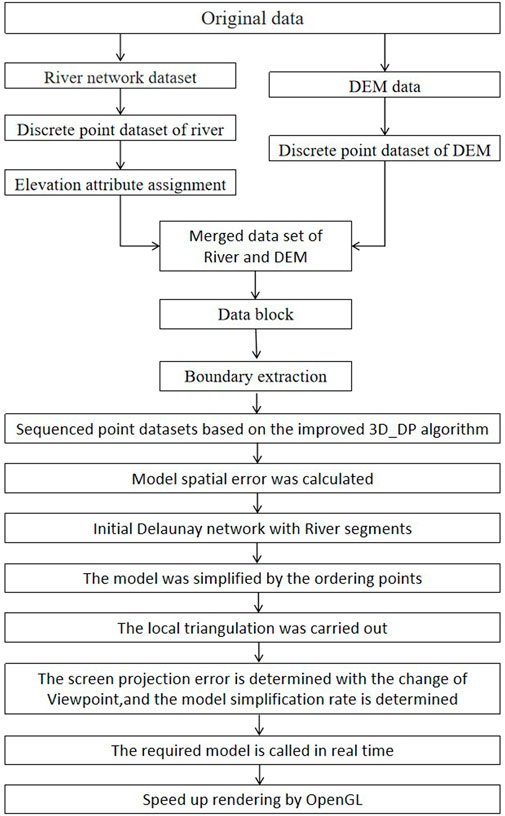
Firstly, we selected the river network line vector according to the principle of map synthesis. Secondly, we extracted the river network line vector into the 3D discrete point dataset, assigned with the elevation attribute. We then merged the above 3D discrete point dataset with the 3D discrete point dataset derived from DEM. The points of the merged dataset were sequenced based on the importance of each point to the topography and river curvature against the background of the improved 3D_DP algorithm. The sequence determines the order of deleting points, and the spatial error of the corresponding model can be calculated. The DEM dataset is used to construct a Delaunay network when considering the river line segment as a mandatory constraint condition. The simplified cavity needs to be triangulated. Auxiliary operations such as data block, boundary extraction, rendering, and displaying ensure the efficiency of implementation and operation of the algorithm. The workflow of the improved 3D_DP algorithm is shown in Figure 3. The main steps of the algorithm are described as follows.
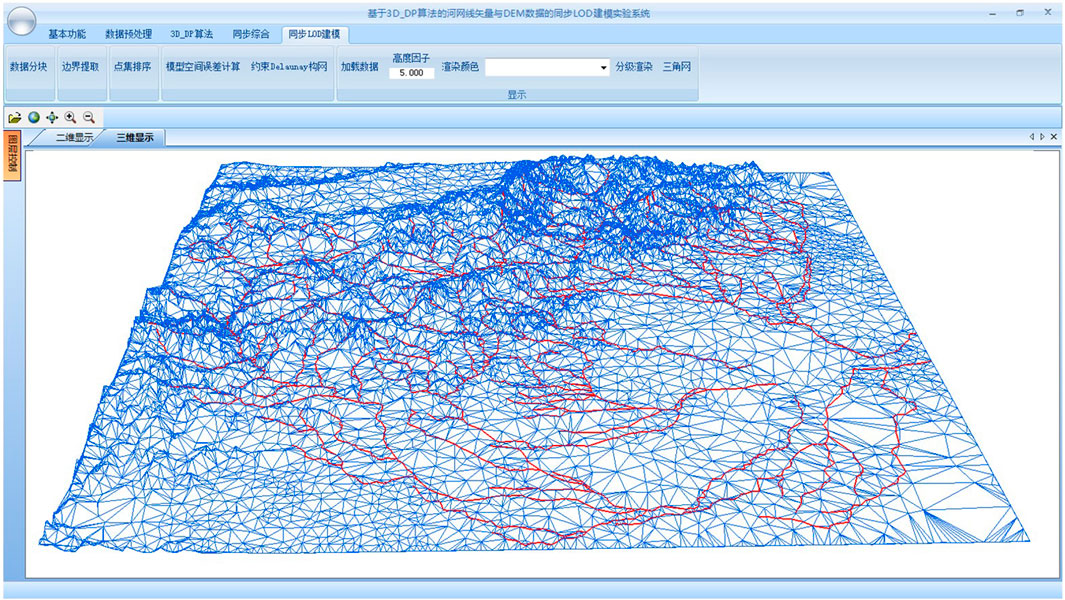
Figure 3. Flowchart of the unified LOD modelling algorithm for the river network’s line vector data and DEM.
3.1 Sequencing importance of point dataset based on the improved 3D_DP algorithm
The merged point dataset was sequenced based on the improved 3D_DP algorithm according to the importance of each point. The aim of sequencing is to obtain a point dataset to support the pre-processing of LOD modelling. In the improved 3D_DP algorithm, the threshold value and the BAI determine the selected point’s importance level. When the threshold value in the 3D_DP algorithm is set to zero, we regard all the points as a cut-off point involving simplification. The reorganization of the dataset can be accomplished based on the sequencing order of the point. The importance of the point was then assigned to its attribute.
Furthermore, the river points are sequenced according to the pseudo distance between the point-and plane with the bending adjustment index. Some specific points have to be retained, such as the points derived from boundary extraction. Since these points do not participate in the subsequent simplification process, they are not required to undergo the sequencing process. The attribute (importance) of the points is defined as the most critical points. The intersections of river endpoints and tributaries are retained, but they can be deleted at a selected level if necessary.
3.2 Calculation of model spatial error
The simplification of the LOD model is to obtain a simplified model with minimal deviations. In this algorithm, the point was deleted on the basis of the descending order of the importance. An error evaluation method is then employed to quantitatively assess the error arising from the simplified model (Li et al., 2007).
Hausdorff distance is widely applied to measure the degree of similarity between two datasets. It can be used to represent and evaluate the magnitude of the simplification error of the LOD model (Cao, 2013). Here and in what follows, we describe the process of error evaluation.
Given two point datasets:
The Hausdorff distance dE represents the distance between m, an element of M, to N, given by Equation 3:
where,
The absolute value of the height difference between point m and point n can be calculated as Equation 5
The vertical spatial error hs based on the one-way Hausdorff distance is defined as Equation 6:
where hs is the vertical spatial error of the model derived from the simplification process. When hs is less than the threshold value derived from the screen projection error, the new dataset (N) can replace the original dataset (M) to conclude the simplification process.
The vertical spatial error is computed during the data preprocessing stage to reduce the computational load in the real-time display stage.
3.3 River-constrained delaunay network and local triangulation
To avoid the occurrence of spatial conflicts such as “river climbing” (Shu, 2012), we treat the river line segment as a mandatory constraint to generate a Delaunay network, which is constructed to achieve unified LOD modelling of the river elements and DEM. The points are deleted from the original river-constrained Delaunay triangulation network based on the order of importance. Therefore, the relevant triangles and the river line segments as constraint edges are deleted for each deleted vertex. Geometric gaps derived from point deletion have to be triangulated locally. Based on the ear-cutting algorithm proposed by Kong, the algorithm adds the judgment of constrained edges to complete the local triangulation operation of polygons (Wibowo et al., 2019; Zhai et al., 2010).
The polygon holes that need to be triangulated are convex polygons or concave polygons. Convex polygons are more accessible to implement than concave polygons. Taking the concave polygon as an example, we present the polygon triangulation algorithm designed and used in this algorithm. As shown in Figure 4, a concave heptagon (seven-sided polygon) consists of vertices A, B, C, D, E, F, and G, and CX and XA are river line segments with constraint edges, then the point X has to be deleted.
In this algorithm, the diagonal of the concave polygon refers to the line of any two non-adjacent vertices, which does not intersect with polygon’s edges and is located within the polygon. For example, AF is not considered as a diagonal because it is not located within the polygon. The workflow of the algorithm is as follows:
(1) To begin with, we determine whether constraint edges for river segments exist. When a constrained river line segment exists, the line segment AC has to be connected after deleting the point X. The line AC acts as a constrained edge, dividing the polygon into two polygons, ABC and CDEFGA. When there is no river segment in the polygon, the procedure of the algorithm is executed directly.
(2) We determine the order of the vertexes of the polygon. The left polygon is regarded as the interior of the polygon, and the vertexes’ order is A-B-C-D-E-F-G.
(3) We calculate the convexity of vertices. As shown in Figure 3, the adjacent vertices of point A are detected, and G-A-B is generated in counterclockwise order. AB and AG are two vectors related to vertex A; the dot product of AB and AG is then calculated. A is determined to be convex when the interior angle ranges from 0 to 180, otherwise, A is determined to be concave. For instance, A, B, D, E, and F are convex, and C and G are concave (Figure 4).
(4) We select the maximum feature angle, and carry out the operation of “ear-cutting”. For example, A, B, and C are in sequence. When B is convex and
(5) We repeat step 4 until every three vertexes are constructed to a triangulation.
3.4 Calculation of screen projection error and real-time display
The vertical spatial error from the simplification can be displayed on the two-dimensional screen. And the error derived from projecting the image into a 2D perspective is called screen projection error. The calculation of the screen projection error is directly related to the line of sight direction, the distance of view, and the angle of intersection. The accurate estimate demands enormous computational resources and remarkably reduces the algorithm’s efficiency. Therefore, the algorithm proposed and adopted a simplified approach (Tang and Dou, 2023).
As shown in Figure 5, taking the vertical axis projected onto the screen (elevation direction) as an example, the model spatial error of the model simplified by the calculated in the elevation direction can be directly used as the vertical axis direction error (OE in Figure 5) to participate in the subsequent calculation. When the distance between the view plane is certain and the center line of sight is horizontal, the size of the model space error OE (corresponding to 3.2 model space error
This maximum projection error can be used as the judgment condition, the model space error
The screen projection error BC is equal to
where
From Equation 8, the three parameters related to screening projection error are the focal length f, the model spatial error
Assume that the number of pixels is taken as the threshold value of screen projection error,but the
From Equations 8, 9, the following relationship can be inferred in Equation 10:
The model space error
where S is the line-of-sight,
In the real-time dynamic display stage of the model, the visual distance between the viewpoint and the center of each block can be obtained in real time, and the hlim can be deduced in real time according to a specified value of the screen projection error (namely,the number of pixel P). Then, according to the deletion sequence of the arranged points of each block, the model spatial error
The displayed number of points, river segments, and triangles can be determined based on the above point dataset which is generated on the basis of
4 Experiment and analysis
4.1 Data preparation and preprocessing
The algorithm is realized in C# programming and OpenGL rendering (Zeng and Chen, 2018; Richard and Nicholas, 2010). The computer hardware used in the experiment is configured with Intel Core i5 CPU, 2.5 GHz frequency, 8G memory, and 2G graphics card, and the software environment was Win7 operating system. In this experiment, we used a display device with a screen resolution of 1920*1,080 for rendering.
The original DEM is derived from ASTER GDEM with a 1-arc second spatial resolution, WGS84 geographic coordinate, and GeoTIFF format. Vector dataset are selected from the vector dataset of river network (GADM V1, http://www.gadm.org/) of Baoding and its surrounding areas, a region which is located in Hebei Province, China, with about 220 × 220 km2. The topography of the study site extends from northwest to southeast with various landforms including flat, rugged, and hilly terrains. The northwest part is dominated by mountains, and the southeast region is mainly composed of plains. The elevation ranges from 8 to 2,893 m. In this study, we eliminated scattered and tiny rivers while retaining five complete tree-like river systems, consisting of 131 river segments. A total of 13,997 DEM points and 3,911 river points are extracted from the original DEM and river network dataset, respectively. Figure 6 is the interface of the experimental prototype system written by the authors.
4.2 Experiment and analysis
During the real-time rendering of the data, we set a limitation value (The number of pixel) for the screen projection error to meet visual requirements. That is to say, when deleting a specified set of points under a certain sight distance, the screen projection error of model must be less than or equal to the specified number of pixel, then the simplified model can be used to replace the original model.
4.2.1 The comparison and analysis of the results of the simplified model under the same screen projection error
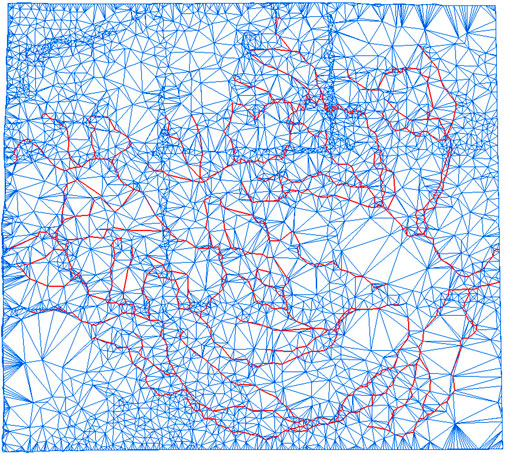
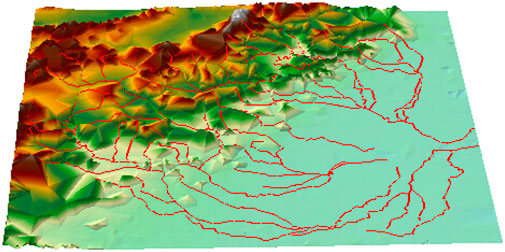
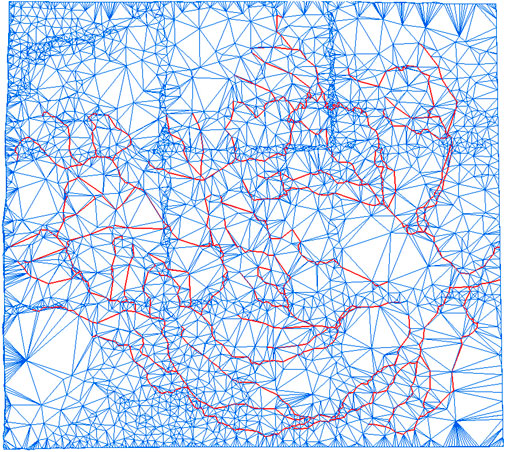
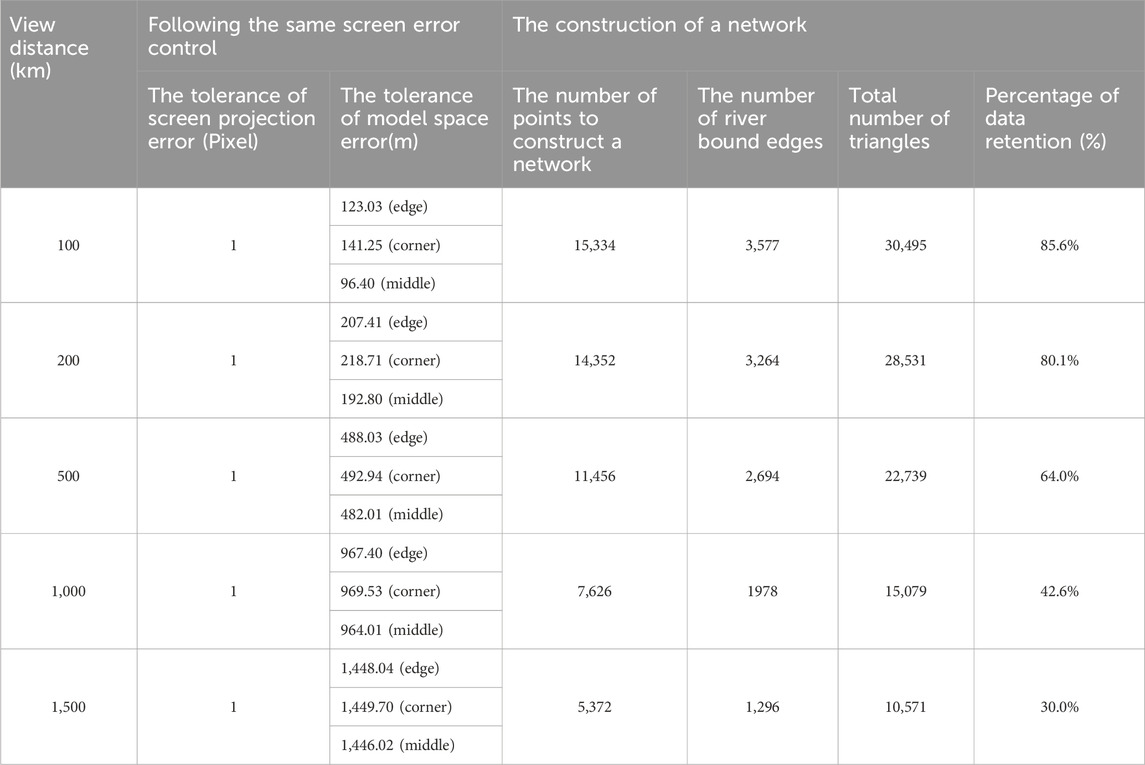
The limitation value of screen projection error (The number of pixel) was set as one pixel. The LOD model’s 2D grids and 3D rendering diagrams are displayed and compared at different viewpoint distances: 100 km, 200 km, 500 km, 1,000 km, and 1,500 km (Figures 7–9). Table 2 lists some important information regarding the network construction, including the model spatial error tolerance, the number of points involved in the network formation, the total number of river line segments and triangles, and the data retention percentages.
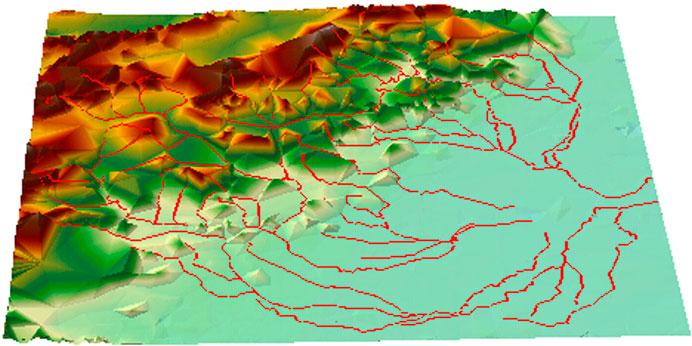
Figure 7. Maps of the unified LOD model using the 100-km sight distance. (A) 2D grid diagram (B) 3D rendering diagram.
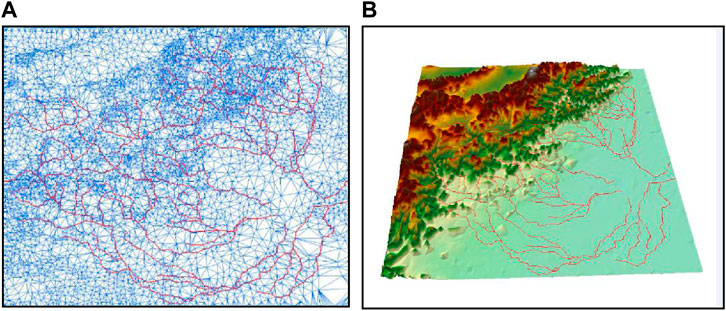
Figure 8. Maps of the unified LOD model using the 500-km sight distance. (A) 2D grid diagram (B) 3D rendering diagram.
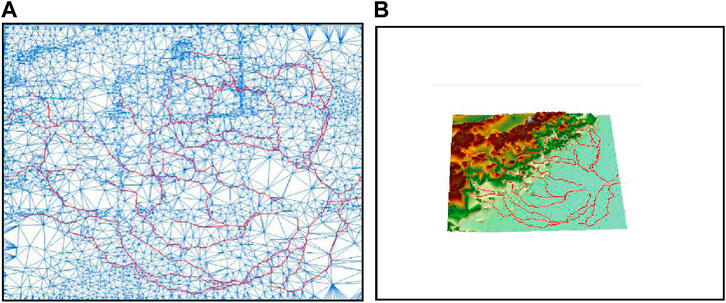
Figure 9. Maps of the unified LOD model using the 1,500-km sight distance. (A) 2D grid diagram (B) 3D rendering diagram.
Through the simplification of the above model, the display effect and data statistics of the network, the following conclusions can be drawn.
The unified LOD modelling algorithm for river network line vector and DEM based on the improved 3D_DP algorithm is verified to be feasible. Under the fixed limitation of screen projection error, with the increase of visual distance from 100 km to 1,500 km, the unified simplification of the river constrained edges, DEM points, and the number of triangles in LOD model construction are realized.
Based on the partitioning operation of the experimental area to improve the efficiency of the algorithm, the points in the block area are divided into three categories: edge, Angle and middle. The limits value of model spatial error under different visual distances can be derived from the given limits value of screen projection error and then the number of points in the network of the simplified model can be derived (such as the data blocks corresponding to the corresponding positions of edge, Angle and middle in Table 1).
LOD modelling with different resolutions of each data block is realized by simplifying the relationship between screen projection error and model spatial error. However, the gap between the model spatial errors with different data blocks decreased gradually with an increase in viewpoint distance.
4.2.2 The comparison and analysis of the results of the simplified model under different screen projection error
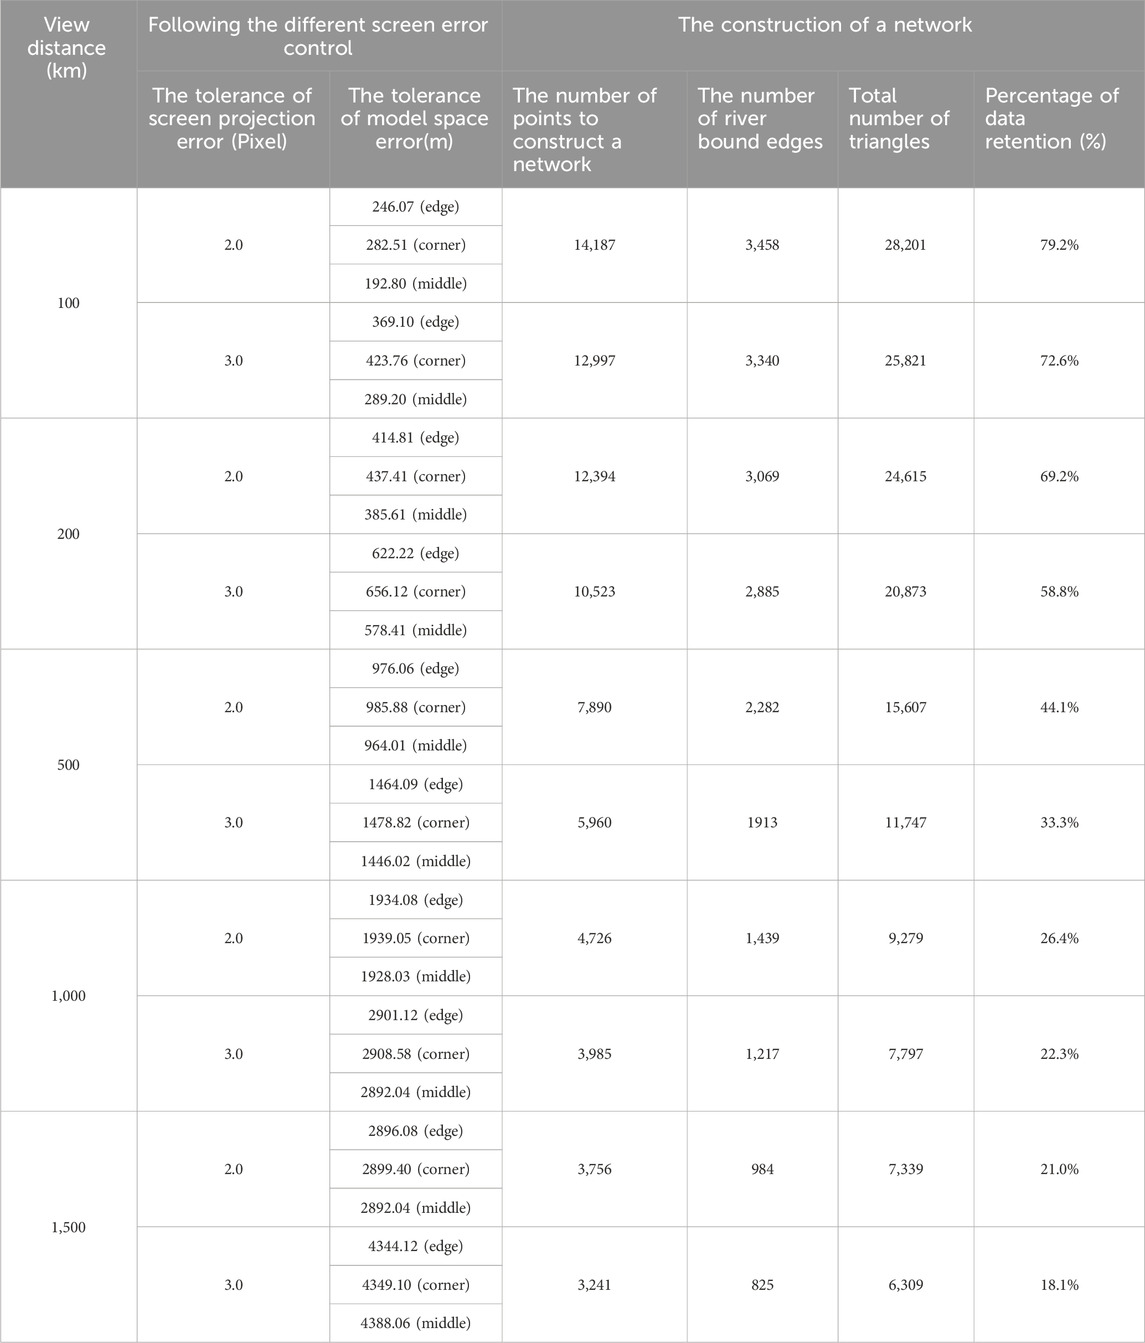
In this experiment, the limit value of screen projection error (pixel) is set as two pixels and three pixels, respectively. The LOD model’s 2D grids and 3D rendering diagrams are displayed and compared at different viewpoint distances: 100 km, 500 km and 1,000 km (Figures 10–12). Table 3 lists some important information regarding the network construction, including the limit value of model spatial error, the number of points involved in the network formation, the total number of river line segments and triangles, and the data retention percentages.
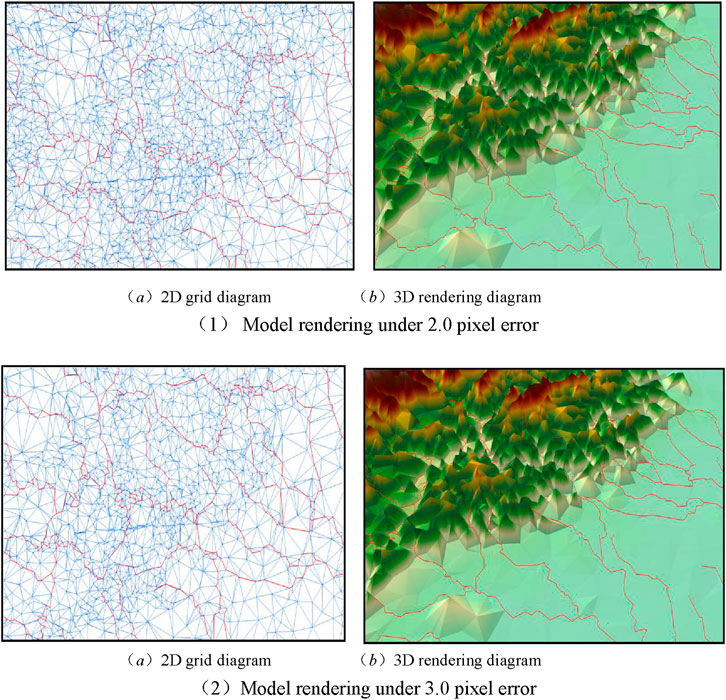
Figure 10. Maps of the unified LOD model using the 100-km sight distance under the control of different screen projection errors. (A) 2D grid model under 2.0 pixel error. (B) 3D rendering model under 2.0 pixel error. (C) 2D grid model under 3.0 pixel error. (D) 3D rendering model under 3.0 pixel error.
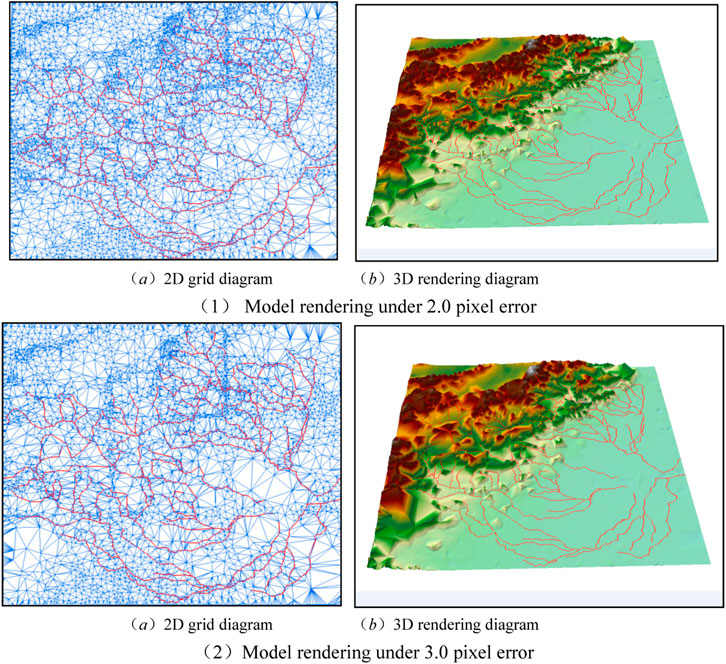
Figure 11. Maps of the unified LOD model using the 500-km sight distance under the control of different screen projection errors. (A) 2D grid model under 2.0 pixel error. (B) 3D rendering model under 2.0 pixel error. (C) 2D grid model under 3.0 pixel error. (D) 3D rendering model under 3.0 pixel error.
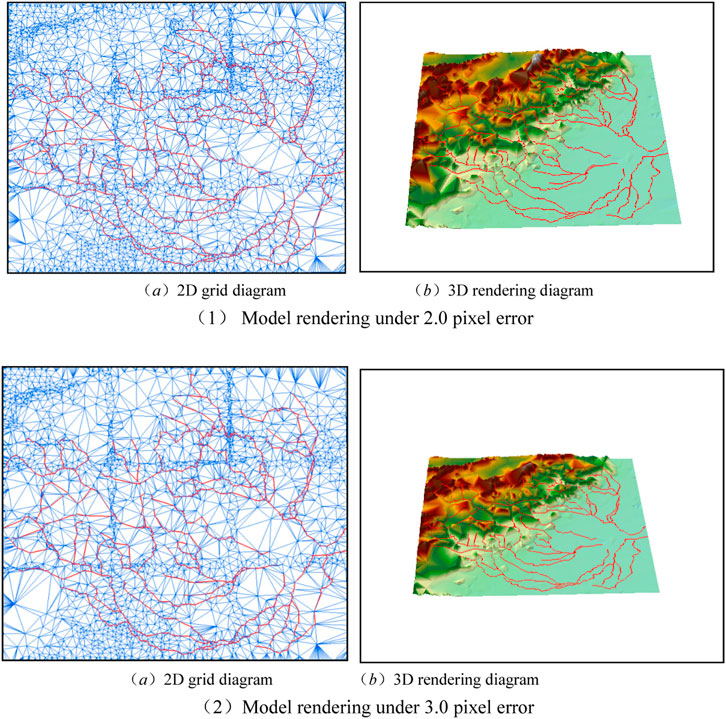
Figure 12. Maps of the unified LOD model using the 1000-km sight distance under the control of different screen errors. (A) 2D grid model under 2.0 pixel error. (B) 3D rendering model under 2.0 pixel error. (C) 2D grid model under 3.0 pixel error. (D) 3D rendering model under 3.0 pixel error.
The experimental results showed that the limit value of screen projection error affects the model spatial simplification. Along with the increase of viewpoint distance, the limit value model spatial error increases gradually with the limit value of screen projection error (pixel number). But, the effects of model simplification show a decreasing trend. The above results show that the impacts on model simplification is more remarkable when the viewpoint distance decreased.
4.2.3 The real-time rendering experimental results and analysis
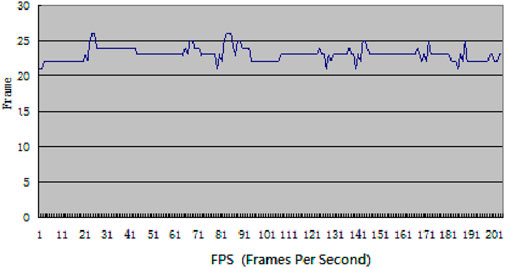
In the real-time rendering stage of the unified LOD model, this study conducted experiments on fixed-path roaming with 200 frames and adopted a geometric model for drawing. Figure 13 shows the frame rate for the model test (FPS, Frames Per Second).
5 Discussion
For LOD modeling of multi-source data, such as remote sensing image data, their synchronous LOD modeling is easier to implement because of its similar format to DEM. However, for example, the data of river network is stored in the computer by the vector data structure of point coordinates, and the DEM is stored by the raster data structure. Their simplification method is implemented according to completely different algorithms and methods. The new method proposed in this paper is to realize synchronous LOD modeling of two different data structures through one algorithm, which is a very bold and innovative idea different from the existing traditional algorithm principle. Of course, this bold idea is also based on the performance of 3D_DP algorithm in the automatic synthesis of DEM in 3D discrete point data format, which can maintain the main geomorphic features of DEM well, automatically delete small geomorphic features, and realize geomorphic synthesis conveniently and quickly (He and Fei, 2008; Dou et al., 2016). It follows the comprehensive principle of “taking main instead of secondary” in geomorphic synthesis theory, and naturally conforms to the principle of geomorphic automatic synthesis theoretically (Valjarević et al., 2021; Valjarević, 2024).
Another basis for this bold idea is that rivers and landforms have a natural coupling relationship in geographical origin, that is, surface rivers are largely constrained by the ups and downs of the terrain. Due to the action of gravity, surface rivers always flow in the direction with the greatest gradient and converge in the gullies to form rivers (Yang, 2005; Shu, 2012). In view of the highly dependent degree of river to geomorphology, 3D_DP algorithm can be applied to the synchronous simplification of river network and DEM data.
In fact, considering the distribution characteristics of the surface point set, generally the horizontal direction is very broad, while the vertical direction is relatively small, so the simplification of the 3D_DP algorithm for the discrete point set is mainly reflected in the elevation direction, which is also the reason why the algorithm has achieved good results in the simplification of DEM and contour lines. Therefore, in the simplification process of synchronous LOD modeling, this paper introduced “bending adjustment index” to further enhance the bending shape of the river itself in the horizontal direction, so as to make up for the problems caused by the malleability of 3D_DP algorithm at the surface level.
The algorithm in this paper needs to pre-process both river network and DEM into 3D discrete point data format, which greatly reduces the efficiency of the algorithm itself, which will limit the further application of the algorithm.
6 Conclusion
When the multi-type (source) data are used for scale change operation and visual analysis in geographic information services, the geometric or topological contradictions are often caused by the inconsistency of the simplification factors of vector and grid data to construct LOD models. This paper proposed an improved 3D DP algorithm for consistency LOD modeling of river network elements and DEM data, and relevant experiments were carried out to verify and analyze the feasibility of the proposed algorithm and the results are good. “Bending Adjustment Index” was introduced to improve the 3D_DP algorithm so as to strengthen the importance of geometric features of the river network itself. Under the same simplification standard, the importance of river point set and DEM point set were sorted by using the improved 3D DP algorithm, and the river network segment was taken as the constraint condition of Delaunay network construction, the consistency of the river network and DEM was simplified, and the geometry of river displayed better in the LOD model.
The basic idea of the LOD is that the farther away from the point of view, the higher simplification of the model, with the visual law of the human eye “the near is very clear, the far is relatively fuzzy”. The importance ranking of point sets to geomorphic and river geometry based on improved 3D DP algorithm was the basis of this algorithm, which determined the simplification rules in the LOD modeling process. By simplifying the relationship between the screen projection error and the model space error, the real-time, continuous and consistent LOD modeling of river network vector and DEM elements under the control of screen projection limit difference was realized. The speed of the real-time dynamic display of the LOD model was closely related to the size of the original data and the degree of simplification. The limit value of screen projection error significantly impacts on the model spatial simplification. The real-time rendering frame rate of the unified LOD algorithm was about 21∼26 FPS. The rendering frame rate can meet the demand of real-time application and demonstrated that this method is feasible and effective. It offers a solution for the real-time drawing of the large river network line vector and DEM datasets.
Before closing, it should be noted that the relationship of viewpoint distance in the unified LOD modelling is only realized based on the distance between the center of each data block and the viewpoint. In addition, the unified LOD algorithm between spatial multiple geographical elements and DEM remains to be refined. The structure design, management, organization, and rendering display of massive vector and raster data and the operation efficiency of the system have yet to be further studied.
Data availability statement
The original contributions presented in the study are included in the article/supplementary material, further inquiries can be directed to the corresponding author.
Author contributions
SD: Writing–original draft, Writing–review and editing. HW: Writing–original draft, Writing–review and editing. YX: Writing–review and editing. YD: Writing–review and editing. WjZ: Writing–review and editing. WdZ: Writing–review and editing.
Funding
The author(s) declare that financial support was received for the research, authorship, and/or publication of this article. This work was supported by the National Natural Science Foundation of China [42061059] and the ‘Guangxi BaGui Scholars’ Special Fund.
Acknowledgments
Shiqing Dou is grateful to XueSheng Zhao for the endless and fruitful discussions. The authors also appreciate the detailed suggestions and comments from the editor and the reviewers.
Conflict of interest
The authors declare that the research was conducted in the absence of any commercial or financial relationships that could be construed as a potential conflict of interest.
Publisher’s note
All claims expressed in this article are solely those of the authors and do not necessarily represent those of their affiliated organizations, or those of the publisher, the editors and the reviewers. Any product that may be evaluated in this article, or claim that may be made by its manufacturer, is not guaranteed or endorsed by the publisher.
References
Brůha, L., and Kolář, J. (2018). A procedural footprint enhancement of global topographic surface with multiple levels of detail. Int. J. Digital Earth (11), 1753–8955. doi:10.1080/17538947.2018.1543362
Buyukdemircioglu, M., and Kocaman, S. (2020). Reconstruction and efficient visualization of heterogeneous 3D city models. Remote Sens. 12 (13), 2128. doi:10.3390/rs12132128
Cao, J. (2013). The calculation theory of Hausdorff distance and its application to the matching of 2D geometrical ObjectsD. Liaoning: Dalian University of Technology.
Chen, H., Tang, X., Xie, Y., and Sun, M. (2010). Rendering vector data over 3D terrain with view-dependent perspective texture mapping. J. Computer-Aided Des. &Computer Graph. 22 (05), 753–761. doi:10.3724/sp.j.1089.2010.10768
Cheng, L., Guo, Q., Fei, L., Wei, Z., He, G., and Liu, Y. (2022). Multi-criterion methods to extract topographic feature lines from contours on different topographic gradients. Int. J. Geogr. Inf. Sci. 36 (8), 1629–1651. doi:10.1080/13658816.2021.2024194
Dou, S., Liu, C., Lin, Y., and Ding, W. (2014). A method of multi-beam echo sounding system data thinning based on improved 3D douglas-peucker algorithm. Science&Technology Rev. 32 (19), 21–25. doi:10.3981/j.issn.1000-7857.2014.19.002
Dou, S., Zhao, X., Liu, C., Lin, Y., and Zhao, Y. (2016). The three dimensional douglas-peucker algorithm for generalization between river network line elements and DEM. ACTA Geod. Cartogr. SINICA 45 (4), 450–457. doi:10.11947/j.AGCS.2016.20140584
Douglas, D. H., and Peucker, T. K. (1973). Algorithms for the reduction of the number of points required to represent a digitized line or its caricature. Can. Cartogr. 10 (2), 112–122. doi:10.3138/fm57-6770-u75u-7727
Fei, L., He, J., and Ma, C. (2009). A three-dimensional douglas-peucker algorithm and its application to automated generalization of DEMs. Int. J. Geogr. Inf. Sci. 23 (6), 703–718. doi:10.1080/13658810701703001
Fei, L., He, J., Ma, C., et al. (2006). Three dimensional douglas-peucker algorithm and the study of its application to automated generalization of DEM. Acta Geod. Cartogr. Sinica 35 (8), 278–284. doi:10.1117/12.712713
Gao, Z., Nocera, L., Wang, M., and Neumann, U. (2020). Visualizing aerial LiDAR cities with hierarchical hybrid point-polygon structuresM//Graphics Interface 2014. AK Peters/CRC Press, 137–144.
He, J., and Fei, L. (2008). Further study on three dimensional douglas-peucker algorithm and its application to generalization of DEM. Geomatics Inf. Sci. Wuhan Univ. 33 (2), 160–163.
He, J., Fei, L., and Huang, L. (2013). Study on the method of indirect generalization for contour lines based on the 3D douglas-peucker algorithm. Acta Geod. Cartogr. Sinica 42 (3), 467–473.
He, L., Han, B., Ji, H., Mao, G., and Chen, J. (2024). A method to integrate hydraulic structure models into 3D terrain models for irrigation infrastructure visualization. Sci. Rep. 14 (1), 21255. doi:10.1038/s41598-024-72446-4
He, L., Zhang, J., Chen, S., and Hou, M. (2022). Three-dimensional hydrogeological modeling method and application based on TIN-GTP-TEN. Earth Sci. Inf. 15, 337–350. doi:10.1007/s12145-021-00727-x
Higham, N. J., and Mary, T. (2022). Mixed precision algorithms in numerical linear algebra. Acta Numer. 31, 347–414. doi:10.1017/s0962492922000022
Hu, H. (2018). Research on mass city models scheduling and viewpoint motion prediction algorithm based on LODD. Shanxi province: XI’AN University of Science and Technology.
Huang, L., and Fei, L. (2010). Experimental investigation on the three dimension generalization of contour lines using 3D D-P algorithm. Geomatics Inf. Sci. Wuhan Univ. 35 (1), 55–58.
Koca, Ç., and Güdükbay, U. (2014). A hybrid representation for modeling, interactive editing, and real-time visualization of terrains with volumetric features. Int. J. Geogr. Inf. Sci. 28 (9), 1821–1847. doi:10.1080/13658816.2014.900560
Li, S., Chen, B., and Zhao, L. (2007). A fast mesh generation algorithm with point-by-point Delaunay insertion. Acta Sci. Nat. Univ. Pekin. 43 (3), 1–5.
Li, S., Shi, R., and Zhu, M. (2018). Simplification approach for 3D terrain with multi-constraints consideration. Geomatics Inf. Sci. Wuhan Univ. 43 (2), 241–247. doi:10.13203/j.whugis20160431
Liu, M. (2007). Relief automated generalization based on the improved three dimensional douglas-peucker algorithm: a case study in the loess plateau D. Xi’an: Northwest University.
Lv, Y., Ye, J., Xu, Q., Xu, Z., Sun, Q., Cheng, Y., et al. (2020). A large-scale landslide hazard simulation-oriented 3D terrain modeling and rendering approach. Geomatics Inf. Sci. Wuhan Univ. 45 (3), 467–474. doi:10.13203/j.whugis20180486
Mai, G., Janowicz, K., Yan, B., Zhu, R., Cai, L., and Lao, N. (2020). Multi-scale representation learning for spatial feature distributions using grid cells. arXiv Prepr. arXiv:2003.00824. doi:10.48550/arXiv.2003.00824
Shen, Z. (2009). Research on simplification and aggregation algorithm of island polygon in electronic chart. D. Harbin: Harbin Engineering University.
Shu, F. (2012). Collaborative map generalization method of contours and rivers based on multi-AgentD. Nanjing: Nanjing Normal University.
Tang, L., Ying, S., Li, L., Biljecki, F., Zhu, H., Zhu, Y., et al. (2020). An application-driven LOD modeling paradigm for 3D building models. ISPRS J. Photogrammetry Remote Sens. 161, 194–207. doi:10.1016/j.isprsjprs.2020.01.019
Tang, Q., and Dou, W. (2023). An effective method for computing the least-cost path using a multi-resolution raster cost surface model. ISPRS Int. J. Geo-Information 12 (7), 287. doi:10.3390/ijgi12070287
Tang, Y. C., Guo, X., Zhang, G. Y., Ding, Q., and Yao, Z. (2019). A LOD large-scale terrain tendering algorithm with multiple control factors. Microelectron. and Comput. 36 (4), 99–104.
Valjarević, A. (2024). GIS-based methods for identifying river networks types and changing river basins. Water Resour. Manag. 38, 5323–5341. doi:10.1007/s11269-024-03916-7
Valjarević, A., Filipović, D., Živković, D., Ristić, N., Božović, J., and Božović, R. (2021). Spatial analysis of the possible first Serbian Conurbation. Appl. Spatial Analysis Policy 14, 113–134. doi:10.1007/s12061-020-09348-1
Wang, A., and Dou, S. (2021). 3D DP improved algorithm based on bending hierarchy structure identification. J. Phys. Conf. Ser. 1769 (1), 012063. doi:10.1088/1742-6596/1769/1/012063
Wang, G., and Chen, J. (2022). A vector data model for efficiently rendering large vector maps on global 3D terrain surfaces. ISPRS Int. J. Geo-Information 11 (4), 234. doi:10.3390/ijgi11040234
Wang, J. (2013). Adaptive integration modeling of DEM and vector data based on spherical DQG FrameworkD.Beijing. Beijing: China University of Mining &Technology.
Wang, N., Cheng, W., Wang, B., Liu, Q., and Zhou, C. (2020). Geomorphological regionalization theory system and division methodology of China. J. Geogr. Sci. 30, 212–232. doi:10.1007/s11442-020-1724-9
Wibowo, A., Santoso, H. B., Rachmat, C. A., and Delima, R. (2019). Mapping and grouping of farm land with Graham scan algorithm on convex hull methodC//2019 International Conference on Sustainable Engineering and Creative Computing (ICSECC). IEEE, 121–126.
Yang, L., Zhang, L. Q., Kang, Z. Z., Xiao, Z., Peng, J., Zhang, X., et al. (2010). An efficient rendering method for large vector data on large terrain models. Sci. China Inf. Sci. 53, 1122–1129. doi:10.1007/s11432-010-0091-z
Yang, Q. (2005). Limited Delaunay triangulation mesh subdivision techniqueM. Beijing: Electronic industry press, 15–16.
Zeng, W., and Chen, J. (2018). “Study on 3D terrain section based on OpenGLC,” in 2018 13th IEEE conference on industrial electronics and applications (ICIEA), Wuhan, China, 31 May 2018 - 02 June 2018 (IEEE), 780–783.
Zhai, R., Wu, F., and Wang, Z. (2010). An optimal triangulation algorithm for general polygon based on adaptive partitioning. J. Geomatics Sci. Technol. 27 (1), 70–74.
Zhang, J., Fei, L., Huang, L., Liu, Y., et al. (2011). Real-time dynamic rendering algorithm of terrain using 3D_DP method and quad_TIN model. Geomatics Inf. Sci. Wuhan Univ. 36 (3), 346–350.
Zhang, X., Zhang, X., and Zhang, H. (2019). Application research of LOD Technology and the shortest path algorithm in trafic geographic information system. Int. Archives Photogrammetry, Remote Sens. Spatial Inf. Sci. XLII-2/W13, 1369–1374. doi:10.5194/isprs-archives-xlii-2-w13-1369-2019
Zhang, Z., Wang, C., Song, J., and Xu, Y. (2022). Object tracking based on satellite videos: a literature review. Remote Sens. 14 (15), 3674. doi:10.3390/rs14153674
Zhou, M., Chen, J., and Gong, J. (2015). A virtual globe-based vector data model: quaternary quadrangle vector tile model. Int. J. Digital Earth 9 (3), 230–251. doi:10.1080/17538947.2015.1016558
Zhou, M., Chen, J., and Gong, J. (2016). A virtual globe-based vector data model: quaternary quadrangle vector tile model. Int. J. Digital Earth 9 (3), 230–251. doi:10.1080/17538947.2015.1016558
Zhou, Z., Zhang, Y., Yuan, X., and Wang, H. (2023). Compressing AIS trajectory data based on the multi-objective peak Douglas–Peucker algorithm. IEEE Access 11, 6802–6821. doi:10.1109/access.2023.3234121
Keywords: 3D_DP algorithm, river bend size, bending adjustment index, level of detail model, constraint Delaunay triangulation, river line vector, DEM
Citation: Dou S, Wang H, Xu Y, Deng Y, Zhang W and Zhang W (2024) A unified LOD model for river network and DEM based on an improved 3D_DP algorithm. Front. Environ. Sci. 12:1397798. doi: 10.3389/fenvs.2024.1397798
Received: 08 March 2024; Accepted: 23 October 2024;
Published: 06 November 2024.
Edited by:
Shuisen Chen, Guangzhou Institute of Geography, ChinaReviewed by:
Aleksandar Valjarević, University of Belgrade, SerbiaYajing Liu, North China University of Science and Technology, China
Copyright © 2024 Dou, Wang, Xu, Deng, Zhang and Zhang. This is an open-access article distributed under the terms of the Creative Commons Attribution License (CC BY). The use, distribution or reproduction in other forums is permitted, provided the original author(s) and the copyright owner(s) are credited and that the original publication in this journal is cited, in accordance with accepted academic practice. No use, distribution or reproduction is permitted which does not comply with these terms.
*Correspondence: Shiqing Dou, ZG91c2hpcWluZ0BnbHV0LmVkdS5jbg==
 Shiqing Dou
 Han Wang1
 Yong Xu