 Yong Huang
 Di You2
95% of researchers rate our articles as excellent or good
Learn more about the work of our research integrity team to safeguard the quality of each article we publish.
Find out more
ORIGINAL RESEARCH article
Front. Environ. Sci. , 02 September 2024
Sec. Environmental Economics and Management
Volume 12 - 2024 | https://doi.org/10.3389/fenvs.2024.1393011
This article is part of the Research Topic Greenhouse Gas Emission (GHG) Reduction and Economic Structural Transformation View all 18 articles
Clarifying the spatial correlation characteristics and influencing factors of coupling coordination between Foreign Direct Investment (FDI) flow networks and carbon transfer networks in countries along the Belt and Road Initiative is of utmost importance for the formulation of regional carbon governance strategies and the establishment of a high-quality Green Silk Road. This study used a comprehensive approach combining social network analysis and coupling coordination model to measure the coupling coordination degree of FDI flow networks and carbon transfer networks of 67 Belt and Road countries from 2010 to 2016. In addition, a modified gravity model is used to characterize the spatial correlation network structure of coupling coordination between the two networks, and the QAP regression analysis method is applied to investigate the factors influencing the spatial association network. The results are as follows: 1) The spatial correlation network of coupling coordination between the two networks has good accessibility and relatively high overall network stability. 2) Countries such as Qatar and the United Arab Emirates occupy central positions in the network, while Bahrain and Jordan are positioned on the periphery of the network. 3) The spatial correlation network can be divided into three sectors: net outflow, net inflow, and bidirectional overflow sectors. 4) Spatial adjacency, bilateral investment treaties, economic development, and institutional quality have significant positive effects on the spatial association network, while the industrial structure and the level of infrastructure development have a significant negative impact. This study proposes an indicator system for the coupling coordination between FDI flow networks and carbon transfer networks. The aim is to investigate the coupling coordination relationship between FDI flow networks and carbon emission transfer networks in countries along the Belt and Road Initiative, providing important guidance for the formulation of regional cooperative carbon emission reduction strategies in other regions.
Global warming poses a significant threat to human habitats, and carbon transfer in international trade has emerged as a key (Ning et al., 2019). In the past 10 years since the “Belt and Road” initiative transformed from a proposal into action, the development of trade has further strengthened intra-regional economic ties while accelerating carbon transfer between countries along the route (Zhang and Chen, 2022). Although most Belt and Road countries have established explicit goals for self-sufficient carbon reduction (Fan et al., 2019), their carbon dioxide emissions still make up more than half of the world’s emissions (Figure 1). Promoting the construction of a green Belt and Road is an inevitable choice in line with the global trend of green development. The Belt and Road countries account for 54% of the world’s primary energy supply (Xie et al., 2023), which has a decisive impact on global efforts to reduce carbon emissions. However, the joint construction of a green Silk Road still faces major challenges in the face of stricter climate change regulations and carbon inequality between nations (Lin et al., 2023).
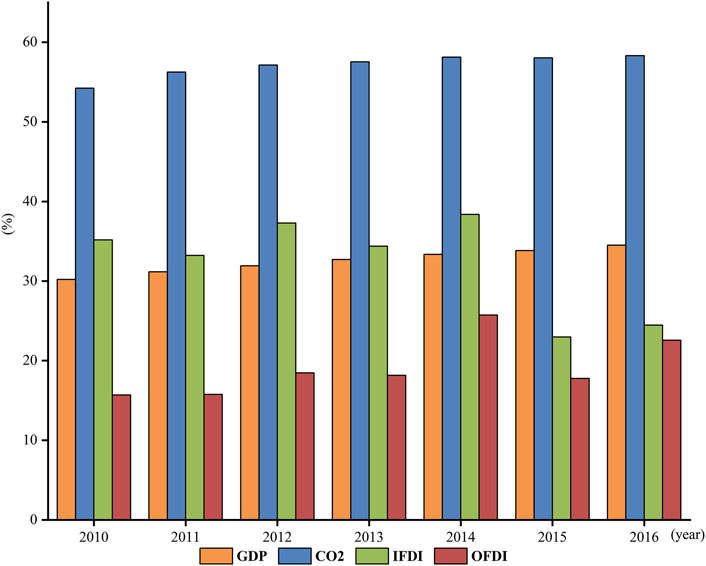
Figure 1. The CO2 emissions, GDP, foreign direct investment (FDI) inflow, and outward foreign direct investment (OFDI) as a percentage of the global total in countries along the Belt and Road Initiative.
Carbon transfer is the result of the flow of goods and services between the supply and demand sides involved in economic activities and reflects the close interaction between countries’ different industries (Chen et al., 2022; Zhu et al., 2022; Lin et al., 2023). The transfer flows of carbon emissions are more dynamic and complex than direct physical transfers of carbon emissions, making carbon emissions more difficult to manage (Hertwich, 2021; Song et al., 2023). Against this background, scientists have suggested that understanding the coupling relationship between economic activities and carbon transfer is a necessary prerequisite for promoting regional collaborative carbon governance and a key aspect of formulating carbon management policies (Ji et al., 2023). Failure to consider the connection between economic activities and carbon transfer might cause policymakers to have a biased assessment of the socio-economic costs of carbon governance, This, in turn, can increase economic risks and vulnerabilities (Yan and Li, 2023). In line with the principle of “common but differentiated responsibilities"," promoting coordinated carbon emission reduction therefore requires not only a fair delineation of carbon emission reduction responsibilities and emission quotas between countries, but also the uncovering of the coupling relationship and evolving trends between economic activities and carbon transfer. Such insights can provide policymakers with a holistic framework for designing effective governance measures that balance economic development and environmental sustainability (Chen et al., 2018; Chen et al., 2022).
Foreign Direct Investment (FDI), as one of the most significant forms of cross-border capital influencing a country’s economic activities (Lu et al., 2024), has a profound impact on industrial and trade linkages between nations through regional production networks and is seen as a conduit for “pollution industry transfer” (Ma et al., 2023). Relevant studies indicate that foreign direct investment forms a network of capital flows through economic linkages dominated by multinational enterprises (MNEs) (Ballor and Yildirim, 2020; Li and Du, 2023). At this point, developed countries use their core positions in investment networks to relocate their environmentally intensive industries, which are restricted by environmental regulations, to other countries through direct or indirect channels (Lu et al., 2020). Conversely, developing countries with a high dependence on international capital may engage in a “race to the bottom” to attract environmentally intensive industries, leading to interregional carbon transfers (Li et al., 2020; Zhang and Chen, 2022). The countries along the Belt and Road Initiative are important hubs in the global investment network. However, as countries along the Belt and Road Initiative become increasingly active in the global investment network, some of them may suffer economic losses due to an unequal sharing of responsibility for carbon emissions when they undertake carbon transfers from other countries (Meng et al., 2019; Lu et al., 2020; Lin et al., 2023).
The relationship between Foreign Direct Investment (FDI) and carbon emissions has significant implications for regional economic development and environmental governance. Understanding the link between investment and carbon transfer and promoting coordination between carbon reduction and economic flows are critical issues for policymakers. While earlier research has examined the relationship between foreign direct investment (FDI) and carbon transfer, the majority of these studies have not developed a complete model to statistically quantify the specific characteristics of their interaction (Jorgenson et al., 2022; Ma et al., 2023). In addition, many studies have focused on “attribute data”, neglecting the characteristics of the “relationship system” that has emerged between FDI and carbon transfer (Xu and Cheng, 2016), so that the multi-level coupling relationships and evolutionary processes between the network of FDI flows and the network of carbon transfer have not been fully elucidated. This limitation hinders the development of transnational carbon governance strategies to address carbon inequality between countries under stricter climate change mitigation requirements (Lin et al., 2023). Therefore, this study is based on the core concept of sustainable development, which is characterized by a continuous, coordinated development of economy, society and ecological environment (Huang et al., 2021). By introducing a complex network model, the study combines multi-regional input-output analysis, complex network methods and linkage coordination models to quantitatively analyze the relationship between foreign direct investment and carbon transfer. These models are used to empirically analyze the characteristics of the spatial correlation network structure and the factors influencing the coupling coordination between FDI flow networks and carbon transfer networks in 67 countries along the Belt and Road Initiative.
Different from the previous literature, this paper has the following innovations and contributions: 1) conducting a comprehensive quantitative analysis of the coupling relationship between FDI flow networks and carbon transfer networks by integrating social network analysis, multi-regional input-output methods, and coupling coordination models. It explores the interaction mechanisms between them from a coupling perspective, providing scientific evidence for the coordinated development of carbon reduction and investment; 2) constructing a spatial correlation network for the coupling coordination of FDI flow networks and carbon transfer networks based on a modified gravity model. Utilizing social network analysis methods, it evaluates the structural characteristics of the coupling coordination and spatial correlation networks of the two systems, identifying the positions and roles of countries in the network of coordinated development between economic flow and carbon emissions. This offers new insights and quantitative tools for policymakers to clarify central regions that may play a key role in future cross-regional coordinated carbon governance; 3) identifying the influencing factors of the coupling coordination between the two networks through QAP network regression analysis, enriching the research content on coupling coordination between FDI flow networks and carbon transfer networks. QAP regression analysis, based on relational data and matrix permutation, effectively avoids common multicollinearity among independent variables, making the research conclusions more scientifically sound.
The rest of this paper is organized as follows. The literature review is provided in section 2. The methods and data are described in section 3. Section 4 presents our results. Section 5 concludes the study and discusses the policy implications of our results.
In recent years, as the process of economic globalization has accelerated and international trade has grown rapidly, the issue of carbon transfer associated with trade has raised new challenges for the environmental sustainability of countries along the Belt and Road Initiative (Arif et al., 2021). More and more scientists have begun to investigate the relationship between foreign direct investment and carbon emissions, as well as the factors influencing them.
Current research on the relationship between foreign direct investment and carbon emissions can be broadly divided into two perspectives: attributive and relational. From an attribute perspective, these studies focus on green infrastructure investment (Zhao et al., 2022), renewable energy investment (Gu and Zhou, 2020), and China’s foreign direct investment in the energy sector (Liu H. et al., 2020), leading to the conclusion that investment under the Belt and Road Initiative either increases or decreases host countries’ carbon emissions (Liu C. et al., 2020). However, due to the diversity of investment types, there is still no definitive statement on the impact of these investment changes on the environment. This situation is partly due to the fact that scholars look at the relationship between foreign direct investment and carbon emissions from angles, such as scale effects (Quaye et al., 2023), structural effects (Wei et al., 2023), technological effects (Zhang et al., 2023), and regulatory effects (Marques and Caetano, 2020), and using methods such as the IPAT model (population, affluence, and technology) and its extensions models (Miao et al., 2019), the factor decomposition model (Wang and Feng, 2021), the Environmental Kuznets Curve (EKC) (Xu et al., 2018), and spatial econometric models (Li et al., 2021), leading to the formation of two opposing viewpoints: the “pollution haven hypothesis” and the “pollution halo hypothesis."
From the perspective of network relations, some scholars have extended the analysis from the local to the global level and expanded the study of bilateral trade-induced carbon transfers to the realm of spatial correlation analysis. They use the methods of social network analysis to explore the relationships between network flows, changes in network size and network structure issues related to trade-induced carbon transfers, offering new insights into carbon transfer research (Duan and Jiang, 2018; Lv et al., 2019). Social networks represent stable social relationship systems that arise through interactions between individuals. The actors within a social network can use their position within the network to gain access to social resources, as mutual cooperation and collaboration within the network becomes social capital for the actors (Wellman et al., 1996). Arthur (1999) notes that in the real economy there are complex relationships such as division of labor, cooperation and transactions between numerous dispersed heterogeneous units, which lead to global phenomena through interactions between heterogeneous units. Economic systems in the real world thus inherently exhibit characteristics of social networks, with the entire economic system achieving continuous adaptation through information exchange and coordination (Arthur, 1999). Since social network analysis enables the quantitative study of relationships between individuals in networks from a global and multilateral perspective (He et al., 2020), some scholars argue that the relationship between FDI and carbon emissions involves multiple relationship characteristics. Traditional econometric methods focus primarily on “attributive” characteristics and overlook the “relational” characteristics between systems (Arif et al., 2021). In fact, the relationship between foreign direct investment and carbon emissions is not unidirectional, but can be seen as a relationship between carbon emissions and foreign direct investment. Therefore, it should be examined from the perspective of complex network theory. Unlike traditional econometric methods, which do not reflect the interaction between subjects and its impact on FDI inflows (carbon emissions of multinational enterprises), network analysis can identify the centrality of networks to carbon emissions and other resource flows and thus determine regional differences in the role of FDI. For example, studies by Jorgenson et al. (2022) indicate that countries that occupy a central position in the global network of foreign direct investment and those with large inflows of foreign direct investment, regardless of their actual nature, tend to have negative environmental impacts (Jorgenson et al., 2022); Ma et al. (2023), using QAP network analysis, found a strong correlation between FDI networks and the carbon emissions networks of multinational companies, with investment patterns from high-income areas more likely to lead to significant carbon emissions in low-income areas (Ma et al., 2023).
The relationship between economic activities and carbon transfer forms a complex system of relationships that requires the use of coupling coordination mechanisms to uncover their internal connections. As a result, many scientists have gradually moved from individual network to studies of the coupling and coordinated evolution of different networks (Xu et al., 2021; Liu et al., 2023). The coupling coordination theory is one of the most important theories of sustainable development. It emphasizes the continuous coordinated development of the economy, society and the ecological environment (Huang et al., 2021). The term “coupling” originates from physics and primarily refers to dynamic correlations between different systems that can interact with and influence each other. “System coupling” refers to the process in which two or more closely linked subsystems ultimately form a tightly structured functional unit through the circulation and complex changes of various elements such as energy, matter and information (Luo et al., 2022). Throughout the process of system coupling, the properties of the various systems change, the elements evolve from disorder to order and from a lower to a higher level of development, deficiencies are corrected, contradictions are reconciled and joint efforts are made to achieve a “coordinated” state (Wang et al., 2020; Shun, 2022). However, solely assessing the strength of coupling relationships using indicators such as carbon emission intensity and carbon efficiency, as well as tracking the direction of carbon transfer from a carbon footprint perspective does not adequately reflect the extent of economic activity and carbon transfer between different sectors or regions (Lin and Teng, 2022; Liu et al., 2022). Furthermore, it also fails to comprehensively demonstrate the intrinsic links between carbon transfer and potential economic value streams (Mi et al., 2020; Hertwich, 2021). Consequently, researchers have also turned their attention to studying the coupling of economic networks and carbon transfer networks, as network structures can deconstruct global carbon transfer relationships and their network status from a multidimensional perspective, supporting the progress of global carbon reduction efforts from a “relationship” standpoint (Ji et al., 2023).
While previous research has laid the foundation for understanding the coupling relationship between foreign direct investment networks and carbon transfer networks, there are still shortcomings. Firstly, current studies focus primarily on isolated network analyzes, lacking a quantitative description of the relationships between the two networks. Secondly, existing research focuses mainly on the global level or on specific countries. There are few studies on the synergistic effects of FDI flow networks and carbon transfer networks in countries along the Belt and Road Initiative. Finally, current research examines the relationship between FDI and carbon emissions predominantly from the perspective of attribute data, while the coupling relationship between the two networks is insufficiently quantitatively examined from the perspective of relational data. Therefore, this study comprehensively applied social network analysis, multi-regional input-output analysis, coupling coordination model, and modified gravity model to analyze the coupling coordination spatial correlation networks of FDI flow network and carbon transfer network in countries along the Belt and Road Initiative. It aims to reveal the coupling characteristics, spatial structural evolution trends, and influencing factors between the two networks, thus theoretically supporting the formulation of comprehensive and effective regional carbon governance strategies and the construction of a high-quality green Silk Road.
The logic of this research is shown in Figure 2. The specifics of the method for each step are listed below. 1) Initially, this study employed the SNA method to construct the FDI flow networks and carbon transfer networks of 67 countries along the Belt and Road Initiative from 2010 to 2016, and individual network characteristic indicators for both networks were computed. 2) The individual network characteristic indicators were then dimensionlessized using a standardization method, and the entropy weight method was applied to determine the comprehensive weights of each indicator in the index system, measuring their respective development levels. Additionally, the coupling coordination degree model was utilized to measure the coupling coordination levels of the two networks. 3) Subsequently, a spatial correlation network of coupling coordination was constructed using a modified gravity model, followed by social network analysis to analyze the structural features of the spatial correlation network. Finally, the QAP method was employed to analyze the influencing factors.
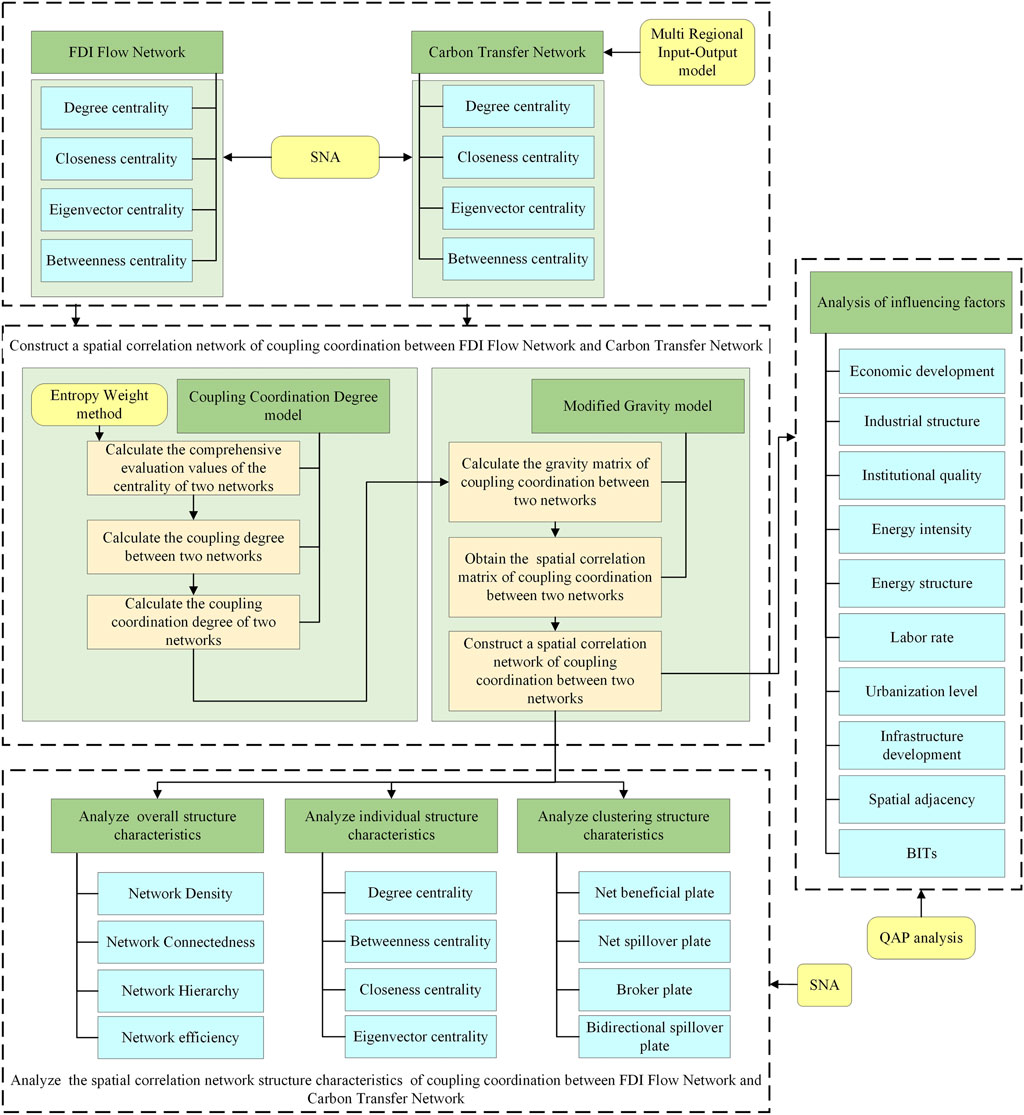
Figure 2. Research logic diagram.
According to the four mechanisms proposed by Grossman and Krueger (1995) in relation to the environmental effects of trade, namely, scale effects, structural effects, technological effects and regulatory effects (Grossman and Krueger, 1995), this paper integrates the topological characteristics of FDI networks and the status of network nodes to systematically elucidate the specific impact mechanisms of international investment networks on carbon transfer networks. The mechanism of coupling and coordination between FDI flow networks and carbon transfer networks is illustrated in Figure 3. Here is the specific analysis:
(1) The establishment and formation of the international investment network is the result of various mechanisms that multinational corporations use to spread their organizational capabilities to other economies, thus promoting network connectivity (Ernst and Kim, 2002). Multinationals not only link existing local clusters together through the international investment network, but also strategically form new local industrial agglomerations and linkages, further enhancing their network dominance. However, excessive clustering inevitably increases the economic dimension of the host countries, as the considerable resource and energy requirements of corporate production lead to a sharp increase in energy consumption and a worsening of environmental pollution. Nevertheless, industrial agglomeration within the international investment network can also generate positive externalities through economies of scale or scope and highly specialized division of labor, thus mitigating pollution (Zeng and Zhao, 2009).
(2) Industries with comparative advantage in developed countries are mainly concentrated in capital-intensive sectors, and their use of national investment networks for foreign investment can steer their industrial structure toward light industry and labor-intensive sectors, minimizing the cost of environmental protection (Cole and Elliott, 2005). In this process, multinational companies from developed countries can use their high dependence on network nodes to strengthen their investment relationships with other countries, so that segments of the value chain that consume a lot of energy and pollute heavily can be transferred to developing countries through investment networks. As the comparative advantage of polluting industries in host countries gradually weakens, foreign-funded enterprises will relocate some or all polluting industries to other underdeveloped regions, resulting in a shift of pollution from one region to another. The relocation of industries by multinational companies will therefore lead to an interregional spread of pollution externalities (Ma et al., 2023).
(3) The technology transfer and technological spillover effects under the international investment network significantly reduce pollution in host countries, and the spillover effects of technology can overcome geographical limitations and achieve cross-regional diffusion (Deng, 2016). Görg and Greenaway (2004) and Girma et al. (2008) argue that the technology transfer and spillover effects of foreign direct investment not only promote the technological upgrading of firms in host countries, but can also transfer outdated but relatively advanced technologies from home to host countries. This helps companies in the host countries to improve their technological efficiency and produce more value with less resource consumption and pollution (Görg and Greenaway, 2004; Girma et al., 2008).
(4) The main bodies of FDI flow networks can also influence the direction and intensity of the interregional transfer of pollution industries by influencing the environmental regulatory efforts of investment partner countries. Developed countries with a higher nodal position can effectively utilize extensive investment links in the network to actively seek low-cost resource elements around the world and transfer domestically high-polluting industries affected by strict environmental regulations to developing countries with relatively lax environmental regulations (Shahbaz et al., 2018). Meanwhile, developing countries on the periphery of the network, driven by economic growth or employment pressures, proactively lower environmental standards or relax environmental regulations to attract foreign investment, becoming “pollution havens” for industrialized countries (Nejati and Taleghani, 2022).
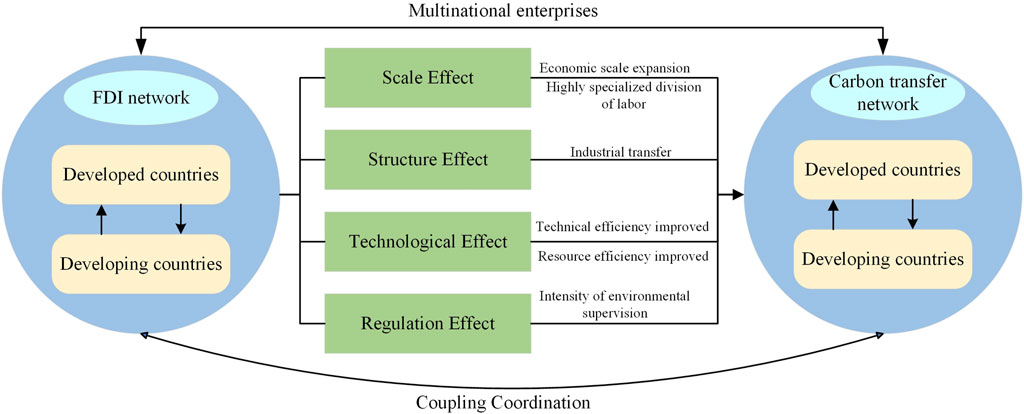
Figure 3. Coupling coordination mechanism of FDI network and Carbon transfer network.
The FDI data for this study is sourced from the International Monetary Fund’s Coordinated Portfolio Investment Survey database (http://data.imf.org), which provides more comprehensive bilateral investment data for countries along the Belt and Road Initiative compared to other databases (Table 1), such as FDI Markets, the bilateral direct investment database of the United Nations Conference on Trade and Development (UNCTAD) and the Investment Map database of the International Trade Center (ITC). The carbon transfer data is obtained from the Eora database (http://www.worldmrio.com/countrywise/), which collects input-output data for 189 countries, including 26 sectors and six final demand categories for each country (Zhang and Chen, 2022). Further data comes from the World Bank’s development indicators (https://databank.worldbank.org/source/world-development-indicators) and the CEPII database (http://www.cepii.fr/cepii/en/bdd_modele/bdd_modele.asp).

Table 1. FDI data sources.
Since the research focus of this paper is on China and the countries along the Belt and Road Initiative, the Eora database is the only one that covers 67 countries along the Belt and Road Initiative with continuous input-output tables. In addition, the data in the Eora database is the most up-to-date among the five global databases mentioned (Table 2). As the IMF’s Coordinated Direct Investment Survey (CDIS) database lacks comprehensive data on bilateral investments for 2009, only data from 2010 to 2016 is used for the analysis in this study. After ensuring the integrity of the data matching, the final research sample for this study consists of 67 countries along the Belt and Road Initiative, covering the period from 2010 to 2016. Their approximate geographical location is shown in Figure 4. Detailed regional and sectoral information can be found in the Supplementary Appendix.
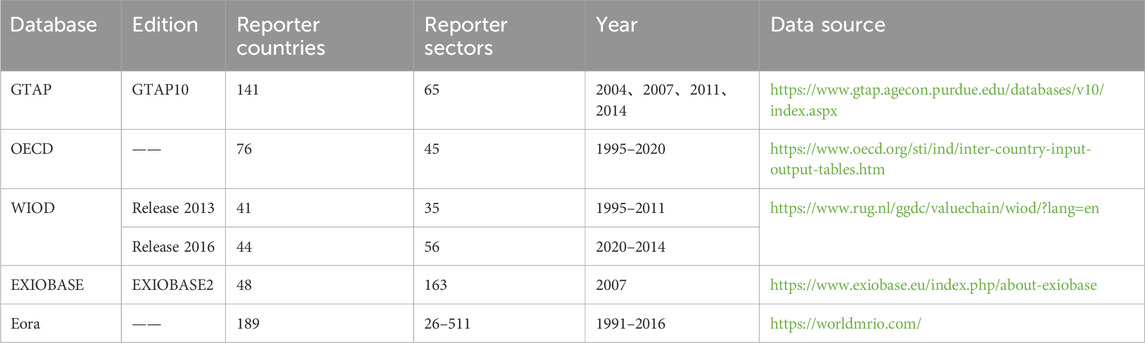
Table 2. MRIO databases.
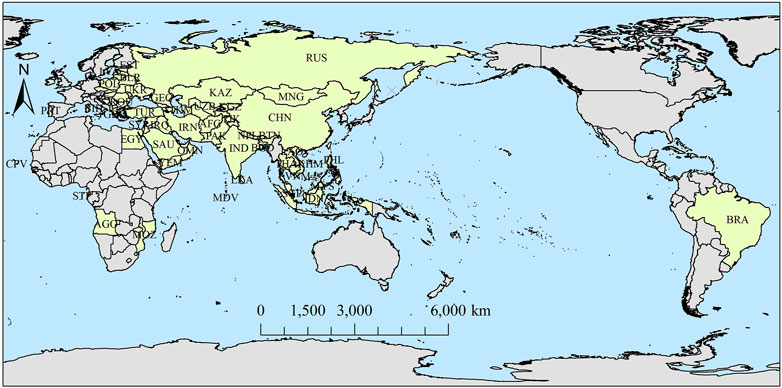
Figure 4. Study area.
This paper selects the OFDI (Outward Foreign Direct Investment) and IFDI (Inward Foreign Direct Investment) data of 67 countries along the “Belt and Road” to construct the FDI flow network. It used mirror data to fill the gaps in unilateral investment, that is, using the outward direct investment data of country i to country j as the inward foreign direct investment data of country j from country i. For example, if the investment amount Wij from country i to country j exists in the Outward Foreign Direct Investment database (OFDI), Wij is used. If Wij does not exist, but the amount of investment Wji from country j to country i exists in the inward foreign direct investment database (IFDI), Wij = Wji is used. Negative data is processed as zero to ensure sufficient sample size (Aller et al., 2015; Cheng and Shun, 2022). After processing, a weighted undirected FDI flow network matrix Wfdi (67X67) is obtained, where the element wij represents the FDI flow between country i and country j. The specific approach is as follows:
if bilateral investment data exists and values are different, their average is used. If only one side has investment data in the bilateral investment, the investment data of that side is used; if both sides have no investment data, the investment amount is zero (Wei et al., 2018; Liu et al., 2019). Taking into account the differences in statistical calibers, all values in each weighted matrix are divided by the maximum value in the matrix Wfdi to obtain a normalized weighted undirected FDI flow matrix W*fdi in which all elements w*ij∈ [0,1]. Since the FDI flow matrix of this work is symmetric, the maximum value method of Ucinet software is used to correct the weighted undirected matrix Wfdi symmetrically, that is, for all elements of the weighted undirected matrix W*fdi, w*fdi (i,j) = w*fdi (j,i). Finally, in this paper, network density (ND) is used as a threshold to construct a relational network W**fdi (Duan and Jiang, 2018), where the threshold is set as follows:
In Eq. 1, Dfdi is the ND of the weighted undirected FDI flow matrix W∗fdi.
Multi-regional input-output models are widely used to reflect the cross-trade relationship between input and output of different sectors in different regions (Zhang and Chen, 2022). In this paper, we construct a global multi-regional input-output model to calculate carbon transfer in countries along the “Belt and Road”. The structure of the multi-regional input-output table is shown in Table 3.
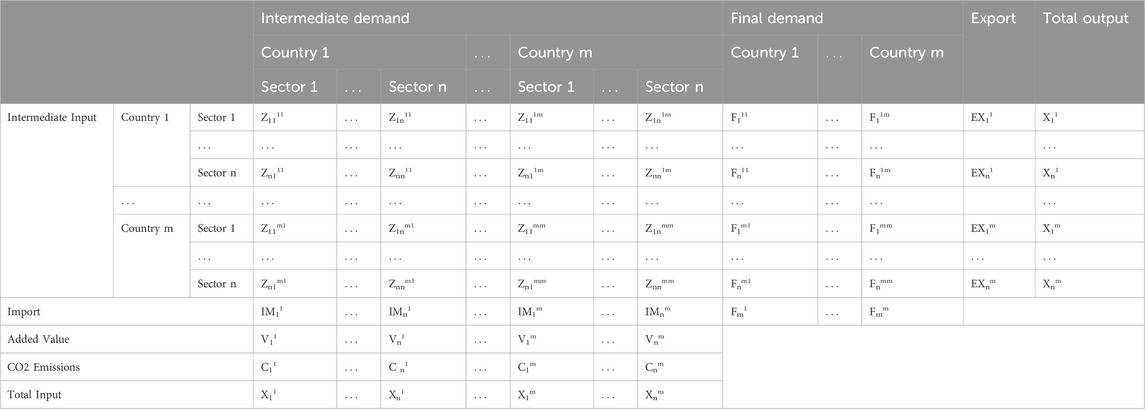
Table 3. Multi regional input-output table.
In the table, Zijrs (r, s = 1, …, m; i, j = 1, 2, …, n) represents the production and demand countries, with the first subscript denoting the producing country r, and the second subscript the demanding country s. This means that the products of sector i in country r are used as intermediate input for sector j in country s. The sub-matrices of the matrix Z on the diagonal, Zijrs (r = 1, …, m; s = 1, …, m; r = s), describe the input and use of products from different sectors within the same economy. The sub-matrices off the diagonal, Zijrs (r = 1, …, m; s = 1, …, m; r ≠ s), illustrate the intermediate input (use) of products from different sectors from different economies in the industries of other economies. The final demand matrix F captures the use of the products of different sectors in the final demand of different economies, where Firs represents the products or services of sector i in country r that are supplied to the final demand in country s, and Xir is the total output of sector i in country r.
Assuming that there are m countries and n sectors, F is the final demand matrix for all countries, A is the direct consumption coefficient matrix, (I-A)−1 is the total demand matrix, and E is the matrix of direct carbon emission coefficients for sector i in country r. The matrix of carbon emission transfer network between regional industries is then shown as in Eq. 2:
The elements of the carbon emission transfer matrix between regional industries, cijrs (r, s = 1, …, m; i, j = 1, 2, …, n), describe the amount of carbon that is transferred from the products of sector i in country r to sector j in country s.
The data on carbon emission transfer between different industries of the countries are aggregated by ‘country-industry’ to obtain the carbon transfer matrix C between the countries. In this matrix C, the diagonal elements Crs (r = s) represent the implied carbon of each country for the consumption of the products it produces. The off-diagonal elements Crs (r ≠ s) represent the carbon transfer quantity between the producing country r and the demanding country s. Following the approach of Yu Juanjuan (Yu and Gong, 2020), the diagonal elements are set to 0, resulting in the final carbon transfer matrix Wemiss (67X67) for this work, as shown in Eq. 3:
The matrix of the carbon transfer network is directional. Therefore, the only operation performed without symmetric correction is standardization. To create the standardized weighted directed carbon transfer matrix W*emiss in this work, all values in the Wemiss (67X67) matrix are divided by the maximum value in the matrix Wemiss. This ensures that all the elements in the matrix wemiss∈[0, 1]. ND is used as the threshold value when building a carbon transfer relationship network W**emiss. The threshold is set as follows:
In Eq. 4, Demiss is the ND of the carbon transfer matrix W∗emiss.
This study measures the network density values of the FDI flow networks and the carbon transfer networks using UCINET software and sets the network density as the threshold. Furthermore, the matrices W∗fdi and W∗emiss are converted into binary matrices W∗∗fdi and W∗∗emiss, respectively. Subsequently, the individual network centrality characteristics of W∗∗fdi and W∗∗emiss are analyzed using social network analysis methods. The network densities of the FDI flow networks and the carbon transfer networks are shown in Table 4. The FDI flow networks and carbon transfer networks along the Belt and Road Initiative (BRI) countries in 2010 and 2016 are shown in Figure 5.
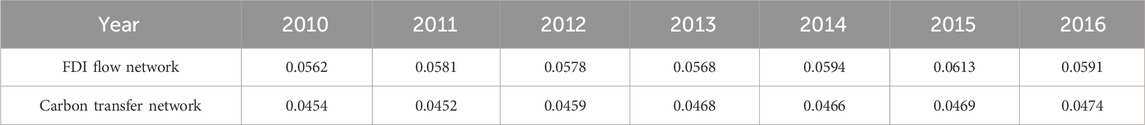
Table 4. The network density value of FDI flow networks and carbon transfer networks.
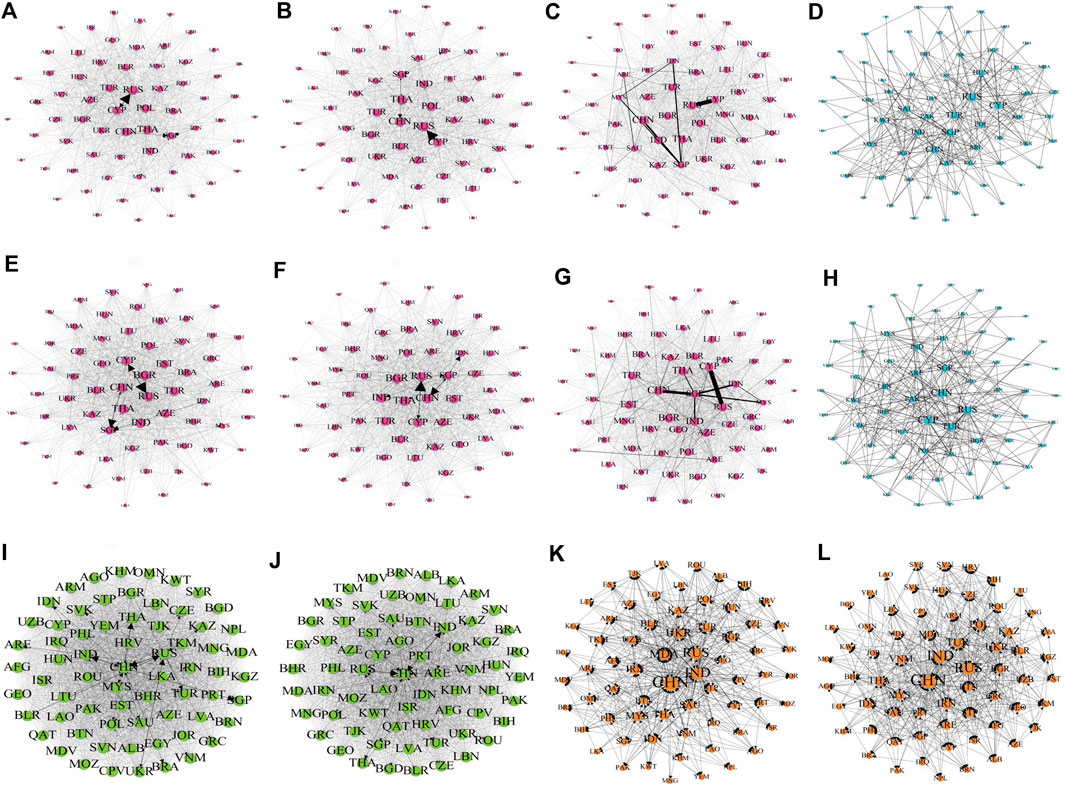
Figure 5. The evolution of outward foreign direct investment (OFDI), inward foreign direct investment (IFDI), total FDI flow networks and carbon transfer networks along the Belt and Road Initiative (BRI) countries in 2010 and 2016. The directed weighted network of outward foreign direct investment (OFDI) in 2010 (A). The directed weighted network of inward foreign direct investment (IFDI) in 2010 (B). The undirected weighted network of the sum of outward foreign direct investment (OFDI) and inward foreign direct investment (IFDI) in 2010 (C). The Binary undirected network of the sum of outward foreign direct investment (OFDI) and inward foreign direct investment (IFDI) in 2010 (D). The directed weighted network of outward foreign direct investment (OFDI) in 2016 (E). The directed weighted network of inward foreign direct investment (IFDI) in 2016 (F). The undirected weighted network of the sum of outward foreign direct investment (OFDI) and inward foreign direct investment (IFDI) in 2016 (G). The Binary undirected network of the sum of outward foreign direct investment (OFDI) and inward foreign direct investment (IFDI) in 2016 (H). The directed weighted network of carbon transfer in 2010 (I). The directed weighted network of carbon transfer in 2016 (J). The Binary directed network of carbon transfer in 2010 (K). The Binary directed network of carbon transfer in 2016 (L).
Social Network Analysis (SNA) is a systematic method for evaluating the structural characteristics of complex associative networks based on relational data. Compared to traditional spatial econometric models, SNA uniquely examines both “quantitative” and “relational” effects, allowing analysis of the spatial association characteristics and the interplay between FDI flow networks and carbon transfer networks (Jorgenson et al., 2022; Ma et al., 2023). A important aspect of SNA is the identification of the most influential nodes within a network and the measurement of their centrality (He et al., 2020). Following the approach of Bai et al. (Bai et al., 2020), in this study, Ucinet software is used to analyze the spatial association network structure of the coupling coordination between the FDI flow networks and carbon transfer networks of 67 countries along the “Belt and Road.” The analysis focuses on the overall network structure, individual network characteristics, and clustering characteristics.
(1) Overall network characteristics
The overall network structural characteristics primarily include four indicators: network density (ND), network correlation (NC), network hierarchy (NH), and network efficiency (NE). These indicators respectively describe the closeness, the vulnerability and robustness, the asymmetric accessibility and the correlation efficiency in the network (Dong and Li, 2022; Huo et al., 2022). The formulas for calculation are as shown in Eq. 5, (6), (7), and (8).
where rij is the number of effective connections between node i and node j; N denotes the number of nodes in the network; V represents the number of mutually inaccessible point pairs in the network; S denotes the number of symmetrically reachable point pairs in the network; MAX (S) denotes the maximum number of symmetrically reachable point pairs in the network; R is the number of redundant lines; and MAX (R) is the largest number of redundant lines.
(2) Centrality
The individual network structure characteristics mainly include four dimensions, degree centrality (DC), betweenness centrality (BC), closeness centrality (CC), and eigenvector centrality (EC), which respectively describe the centrality of each node, the degree of control over the correlation between other nodes, the direct correlation with other nodes, and the centrality with the neighboring nodes of a node (Bali Swain and Ranganathan, 2021; Vanli and Akan, 2023). The calculation formulas are shown as follows in Eqs 9, 10, 11, and 12:
where n is the number of other nodes that are connected to node i; Rij denotes the effective number of connections between node i and other nodes; σ (j, k) represents the number of shortest paths from node j to node k; σ (j, k |i) represents the minimum number of paths connecting node j to node k that traverse node i; dij denotes the length of the shortcut from node i to node j; and λ represents the maximum eigenvalue of the adjacency matrix, where ej is the eigenvector of the adjacency matrix.
(3) Spatial clustering analysis
Block modeling is the main method of spatial clustering in the SNA and was used here to better analyze the role and status of each country in the spatial association network (Wasserman and Faust, 1994). The spatial network was divided into four attribute categories: “main inflow”, “main outflow”, “bidirectional spillover” and “agent”. The “main inflow” plate receives more contacts from outside the plate, and its proportion of actual internal relationships is greater than that of expected internal relationships. The “main outflow” plate sends more contacts to outside plates than it receives. “Bidirectional spillover” receives fewer contacts but sends more contacts to plates both internally and externally, and the proportion of its actual internal relationships is greater than that of its expected internal relationships. The “agent” plate receives fewer contacts but sends more contacts to plates both internally and externally, and its proportion of actual internal relationships is less than that of its expected internal relationships. It plays an intermediary role, sending relationships to other plates and receiving contacts from outside members. Relying on the method of Liu et al. (2015) (Liu et al., 2015), This study conducts spatial cluster analysis on the spatial correlation network of coupling coordination between FDI flow networks and carbon transfer networks using a convergent correlations (CONCOR) method.
By using the principle of information entropy to determine the weights of indicators, the entropy weight method provides an objective way of weighting indicators that reflects the relative value of each indicator (Chen et al., 2023b). Using SNA, this study creates an evaluation index for the CCDM between the FDI flow network and the carbon transfer network. The weights of each index are subsequently determined via the entropy weight method. The steps are as follows in Eqs 13–18.
Step 1. Data standardization
• The normalization formula for positive indicators is as follows:
• The normalization formula for negative indicators is as follows:
Since the meaning of the indicators in this article is the importance of nodes (countries) in the network, the indicators are all positive, and the standardized range of Xij values is [0,1]. Due to the occurrence of a 0 value after standardization, the standardized data are shifted, resulting in a = 0.00001.
Step 2. Calculate the weight pij of the jth indicator in the ith evaluation object for each year during the sample period:
Step 3. Calculate the information entropy value ek of the indicator:
Step 4. Calculate the coefficient of variation dk for information entropy:
Step 5. Calculate the weight of indicators λij.
Step 6. Calculate the comprehensive evaluation value.
The comprehensive evaluation values of the FDI flow network and the carbon transfer network are calculated based on the steps above, and the comprehensive evaluation function is shown in Eq. 19:
where Xij is the standardized value of two individual feature indicators in the network in the range of [0,1]. λij is the individual feature indicator weight of the two networks calculated using the entropy weight method; the specific weights are listed in Table 5. The entropy weight method is used to determine the full evaluation values U1 and U2, which indicate the relative relevance of the carbon transfer network nodes and the FDI flow network nodes in the network, respectively.
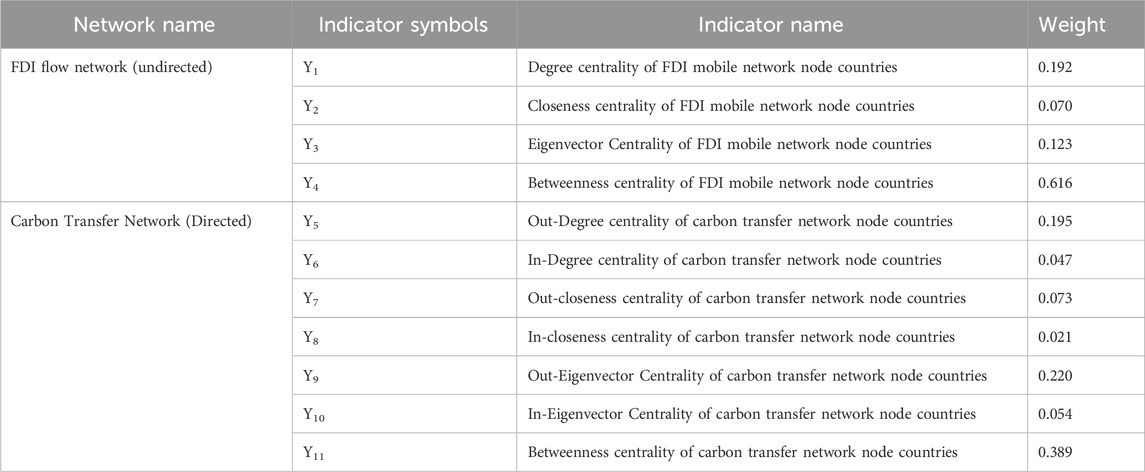
Table 5. Coupling coordination model evaluation index.
In this article, the degree of coupling and the degree of coordination of the carbon transfer network and the FDI flow network are calculated using the degree of coupling model and the degree of coordination model, respectively (Luo et al., 2022; Shun and Huang, 2022; An et al., 2023). The formulas are shown as follows in Eqs. 20, 21, and 22:
where D is the coupling coordination degree and C is the coupling index, both of which have values between 0 and 1. T is the comprehensive evaluation index of the FDI flow network and carbon transfer network, and the values of α and b are set to be equal, i.e., 0.5. To illustrate the difference in the CCD of the FDI flow network and carbon transfer network, the CCD is divided into six grades using the equal interval division method in this article (Table 6).
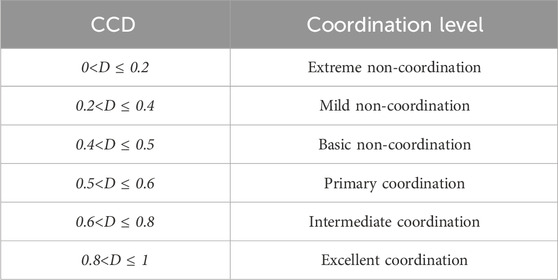
Table 6. Classification of the coupling coordination degree.
In the field of research into complex spatial network research, the Moran’s Index (Zheng et al., 2022), Granger causality (Wang, 2022) and the gravity model (Huo et al., 2022) are primary used to measure spatial correlation. However, these methods have their limitations. For example, the Moran’s Index can measure the overall correlation within a region, but cannot describe the spatial correlation between individuals within that region (Li and Li, 2022). The Granger causality test can determine correlations between individuals, but it relies primarily on time-series data of the sample and assumes that the correlation remains constant over the study period. This overlooks external factors that could influence changes in the relationship, potentially leading to biased results (Jiang et al., 2022). In contrast, the gravity model can measure the spatial correlation of an entire region and also show the spatial propagation paths between individuals within a region (He et al., 2020). However, with the increasing economic interdependence of regions, the spatial connections between them become complex network structures (Chen et al., 2023a), The traditional gravity model needs to consider the bidirectionality and asymmetry of the correlation between carbon emissions and economic factors to adapt to the research needs of carbon emission spatial correlation networks (Dong and Li, 2022). For example, Chen et al. (2023) analyzed the mechanism of coupling coordination between pollution, carbon reduction, and high-quality economic development and constructed gravity matrices and spatial association networks for the two systems based on an improved gravity model. They then evaluated the structural characteristics and centrality of the coupling coordination and spatial association networks (Chen et al., 2023a). Therefore, a modified gravity model is use in this study to construct the spatial association network for coupling coordination between countries (He et al., 2020; Chen et al., 2023a). The model is as follows:
In Eq. 23, Zij represents the association strength between region i and region j, where D, pop, and GDP represent the coupling coordination degree of the networks, total population of the region, and Gross Domestic Product of the region, respectively. Distanceij is the distance between the capitals of each country, and pGDP is the per capita GDP,
The Quadratic Assignment Procedure (QAP) is an analytical method that focuses on relational data. It is based on the permutation of matrix, the calculation of correlation coefficients by repeated sampling and the performance of non-parametric tests to compare the numerical values of two relational matrices. This method is not affected by multicollinearity between independent variables, so the estimated results are more reliable than those obtained by parametric methods (Bai et al., 2020). Therefore, the QAP method is used in this study to investigate the influencing factors of the spatial correlation network of coupling coordination. The QAP model is as follows:
In Eq. 24, Y represents the spatial correlation network matrix of the coupling coordination between the FDI flow network and the carbon transfer network. Xi denotes the difference matrices of the respective independent variables. The dependent variable Y is defined as a relational matrix by taking the average values of the gravity scores for each year and using the method described in section 3.4.4. The independent variables Xi are derived from existing literature, with specific definitions, reference sources, and data origins detailed in Table 7. Among the independent variables, except for geographical adjacency and bilateral investment treaties that do not require normalization, other independent variables are based on the average values for the sample period. The difference matrices are then established through the absolute differences between countries. The Z-score method is used to normalize these relational matrices, ensuring that their averages and standard deviations are 0 and 1, respectively.
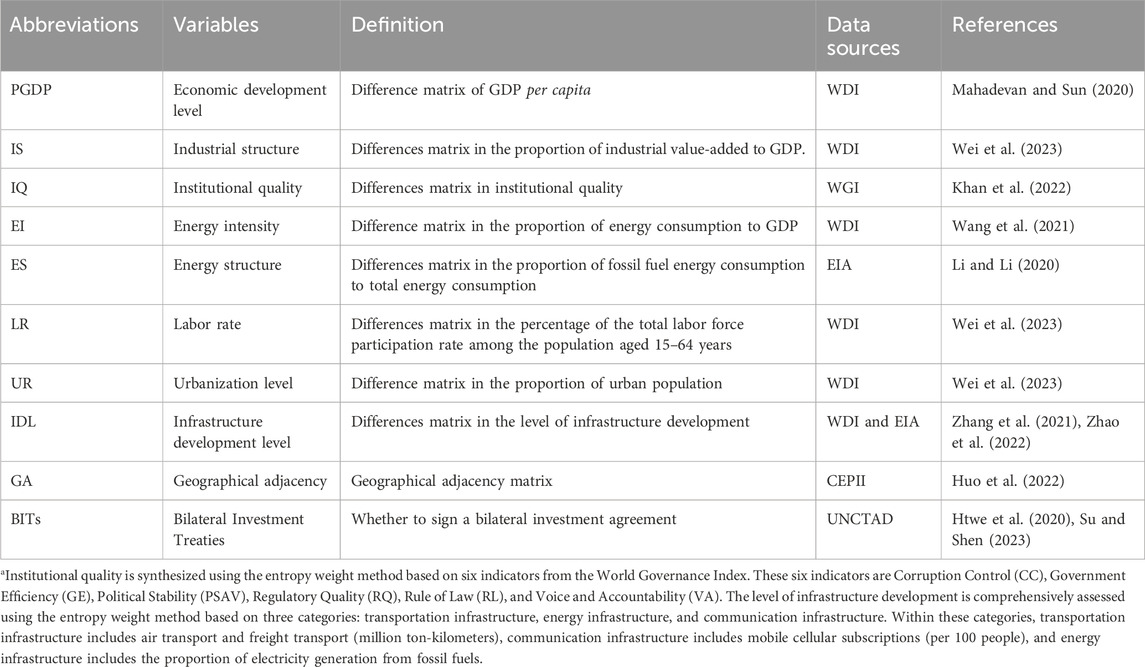
Table 7. The indicators of influencing factors and their sources.
The evolution trend of the average annual CCD of countries along the “Belt and Road” countries from 2010 to 2016 is shown in Figure 6. Overall, the coupling degree of the FDI flow network and carbon transfer network in the “Belt and Road” countries ranged between 0.9387 and 0.95, indicating a relatively high level of coupling, suggesting a strong association between FDI flows and the excessive consumption of material resources or negative environmental impacts. However, the overall level of coupling coordination between the Belt and Road countries is relatively low, with a coupling coordination of 0.3699 in 2010 and 0.3830 in 2016, indicating that the Belt and Road countries were generally in a state of disequilibrium from 2010 to 2016, suggesting that the FDI flows and carbon transfer systems of most Belt and Road countries have not yet reached a benign interactive mechanism. The reasons for this lie in the different advantages of the countries along the “Belt and Road” in attracting foreign direct investment and the associated opportunities for investment by multinational companies. However, the different levels of environmental regulation in these countries have led to late and lenient carbon emission regulations, making them havens for polluting companies. According to the report “Business Pathways to Carbon Neutrality - Implementing the Paris Agreement and UN Sustainable Development Goals” issued by the United Nations Global Compact, by 2021, less than half of the 33 countries along the “Belt and Road” have addressed climate change through legislation or administrative measures (CHANG et al., 2022).
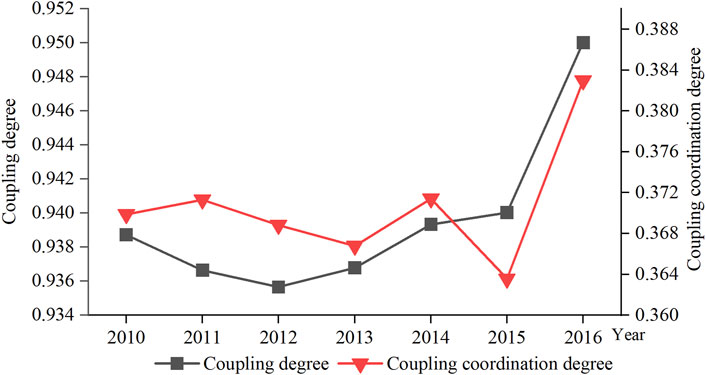
Figure 6. The trend of coupling degree and coordination degree.
The coupling coordination of Foreign Direct Investment (FDI) flow networks and carbon transfer networks among countries along the Belt and Road Initiative (BRI) exhibits a fluctuating upward trend towards favorable coordination, as illustrated in Table 8. From 2010 to 2016, China, Singapore and the United Arab Emirates were at the forefront of tying coordination. Due to their unique geographical location, these countries are often considered as bridges and important hubs connecting other countries along the “Belt and Road” They have attracted a large number of green infrastructure projects and renewable energy technologies. In addition, the “Belt and Road” Initiative has facilitated investment and promoted deep economic integration between these countries and their neighbors. This has created a new environment and perspective for Outward Foreign Direct Investment (OFDI) and Inward Overseas Direct Investment (IFDI).
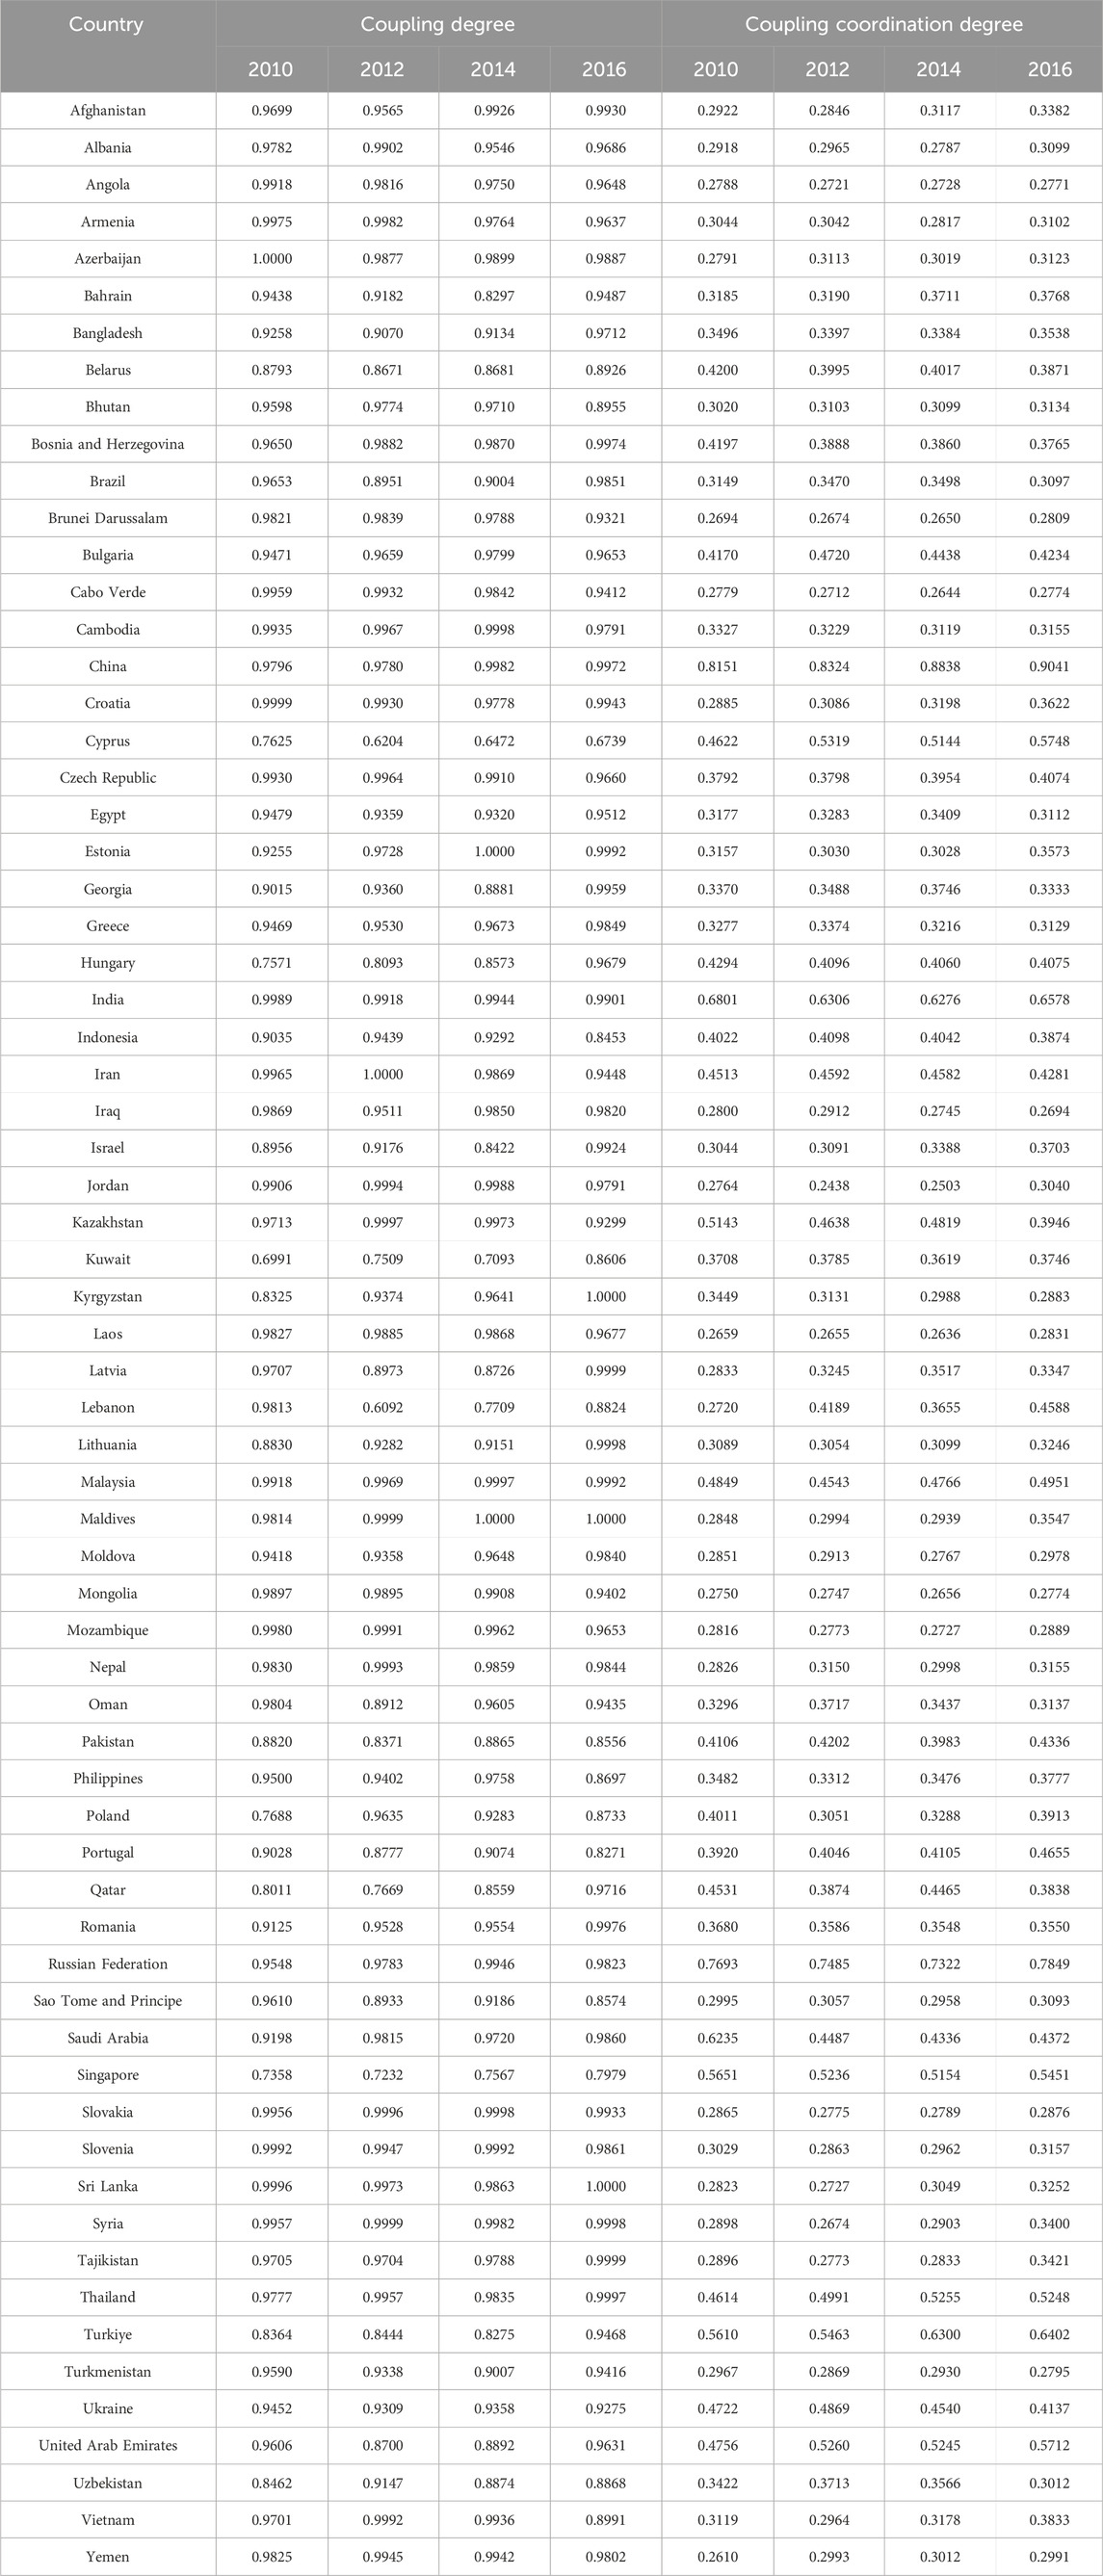
Table 8. CCD changes of FDI flow network and carbon transfer network.
Based on the calculations of Eq. 23, the spatial association network of coupling coordination was visualized in this paper using UCINET software, as shown in Figure 7. These network diagrams show the connections between countries and their variations. For reasons of space, the results of the study are presented at 2-year intervals. Red squares indicate countries that both send to and receive connections from other countries, while blue squares represent countries that only send connections to other countries without receiving any in return. The size of the squares denotes the centrality of the countries in the network and reflects the strength of its connections with other countries. Larger squares indicate a higher degree of association with other countries. For example, Qatar and the United Arab Emirates occupy central positions in the network, which indicates indicating their close relations with other countries. In terms of the network connectivity, i only ten countries sent connections to other countries between 2010 and 2016 without receiving anything in return. In 2012 and 2014, this number rose to eleven countries. Overall, there was a good level of spatial association between the Belt and Road countries from 2010 to 2016. On the one hand, the Belt and Road Initiative has promoted cooperation between countries on investment flows and the reduction of carbon emissions. On the other hand, the countries along the “Belt and Road” are areas where production and consumption of energy resources are concentrated, as well as areas with high carbon emissions. In the face of the increasingly evident problem of climate change, effective measures to change the comprehensive economic development model and promote low-carbon development have become imperative for the countries along the “Belt and Road” to achieve sustainable development.
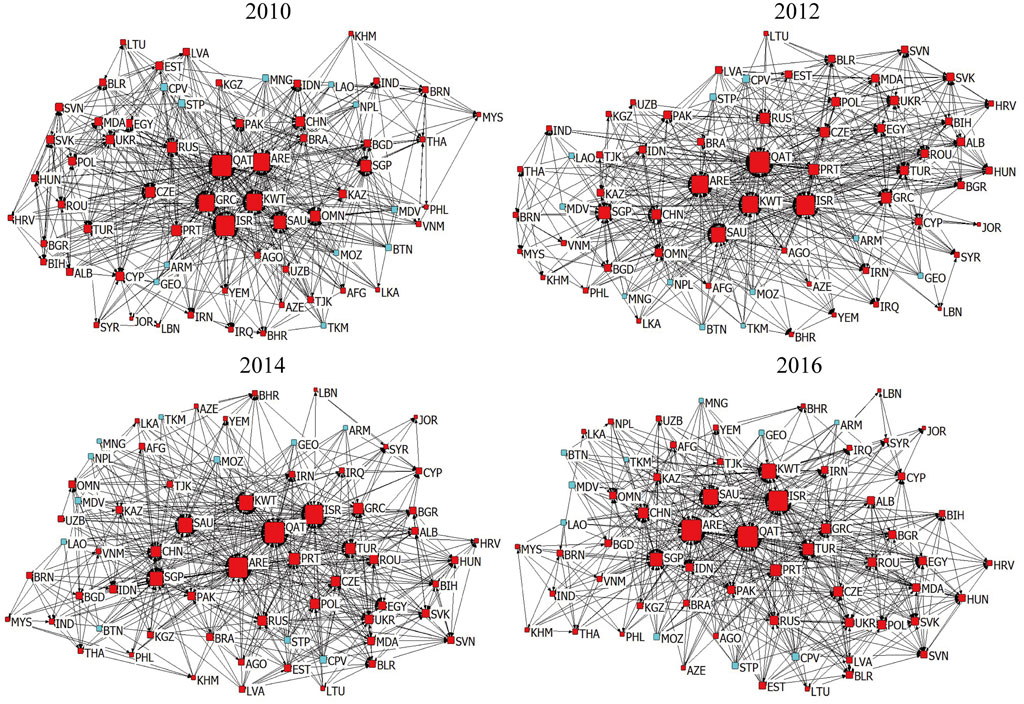
Figure 7. The evolution of the spatial association network structure.
Based on Eqs. 5–8, this paper has calculated the overall network indicators of the spatial association network of coupling coordination from 2010 to 2016, as shown in Figure 8. The number of network associations decreased from 710 to 688, with network density fluctuating slightly, decreasing from 0.161 in 2010 to 0.154 in 2011. Since 2013, there has been little change in the number of network associations and network density, indicating a stable trend in the spatial correlation.
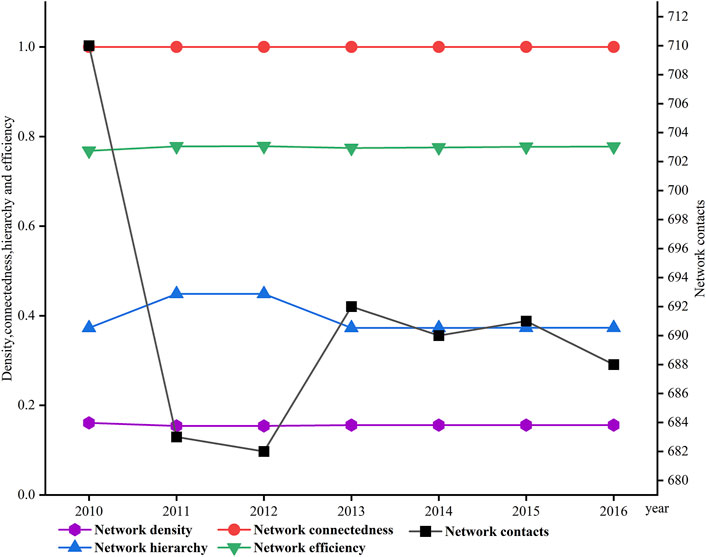
Figure 8. Spatial association network structural indices (2010–2016).
Between 2010 and 2016, the connectivity of the network remained at 1, indicating that the spatial association network of coupling coordination between the countries along the Belt and Road Initiative maintained good accessibility. There were relatively few redundant links between the node associations, allowing any two nodes to reach each other, ensuring high network flow efficiency. This also suggests the presence of spatial spillover effects in the coordination of FDI flows and carbon emission transfers between the Belt and Road countries that extend beyond neighboring countries. And it also indirectly shows that countries along the “Belt and Road” should consider the spatial correlation effect of FDI flows and carbon transfer and implement cross-regional coordinated strategies to reduce carbon emissions.
After 2012, there was a significant decrease in network degree centrality, indicating a gradual strengthening of spatial links between countries. The gradient transmission of the FDI flows and carbon transfer between countries has broken the previous rigid hierarchical pattern. From 2013 onwards, the network structure became more stable. Although the efficiency of the network increased only slightly during this period (from 0.7683 in 2010 to 0.7776 in 2016), the overall stability of the network remained high. This indicates that with the implementation of the Belt and Road Initiative, cooperation between China and countries in Asia, Africa and Europe has intensified, resulting in an increased frequency and intensity of investment activity and carbon emission transfers between Belt and Road countries.
Based on Eqs 9–12, this paper has calculated the centrality indicator characteristics of the nodes in the spatial association network of coupling coordination between FDI flows and carbon emission transfers among the “Belt and Road” countries from 2010 to 2016. For space reasons, only the top 10 rankings for 2010 and 2016 are shown in Table 9 and Table 10.
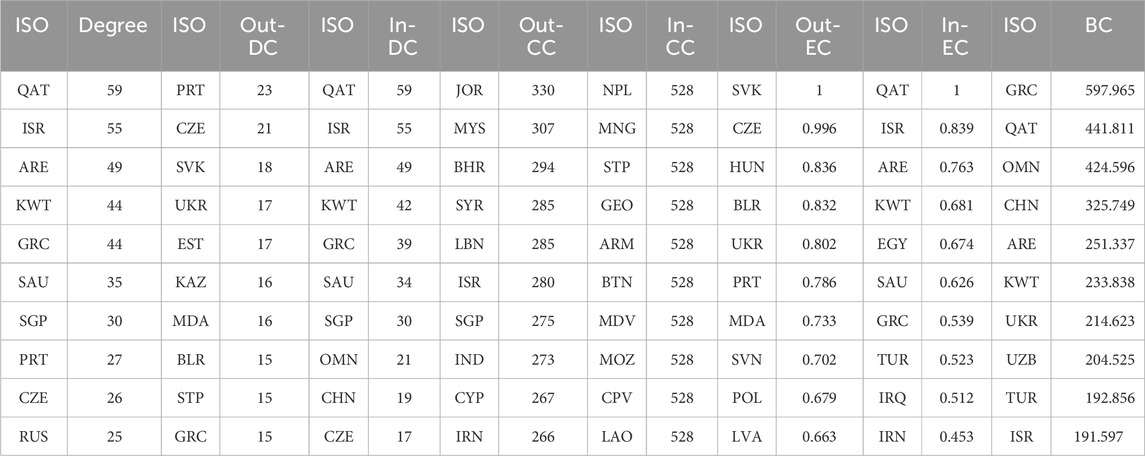
Table 9. Ranking of individual centrality within the spatial association network in 2010 (top ten).
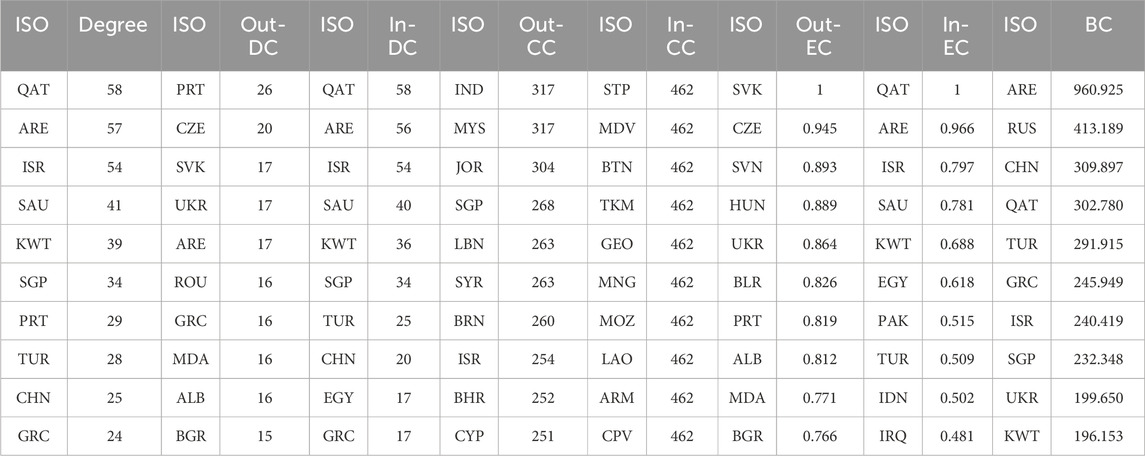
Table 10. Ranking of individual centrality within the spatial association network in 2016 (top ten).
From a degree centrality perspective, countries such as Portugal, the Czech Republic, Slovakia, and Ukraine consistently ranked at the top of out-degree centrality between 2000 and 2016, as shown in Figure 9A. During this period, the scores for Portugal and Greece increased from 23 to 15 to 26 and 16 respectively, indicating stronger spatial correlation and spillover effects in the coordination of FDI flows and carbon transfer. Greece saw a slight drop in its ranking in 2016, possibly due to adjustments in its diplomatic strategy following the economic crisis. The centrality of the United Arab Emirates increased significantly in 2016, likely due to country’s economic growth and increased international investment activities. Countries such as Qatar, the United Arab Emirates, and Israel ranked high in terms of in-degree centrality, as can be seen in Figure 9B. Although Qatar’s in-degree centrality slightly decreased from 59 in 2010 to 58 in 2016, the country maintained a relatively high position. The high in-degree centrality of Qatar and the United Arab Emirates could be related their economic strength and energy exports, which strategically position these countries in the global energy market. Conversely, countries such as Lebanon, Jordan, and Brunei had lower centrality, possibly due to their smaller economic scale and geographical location, which limits their ability to cooperate on FDI flows and carbon reduction.
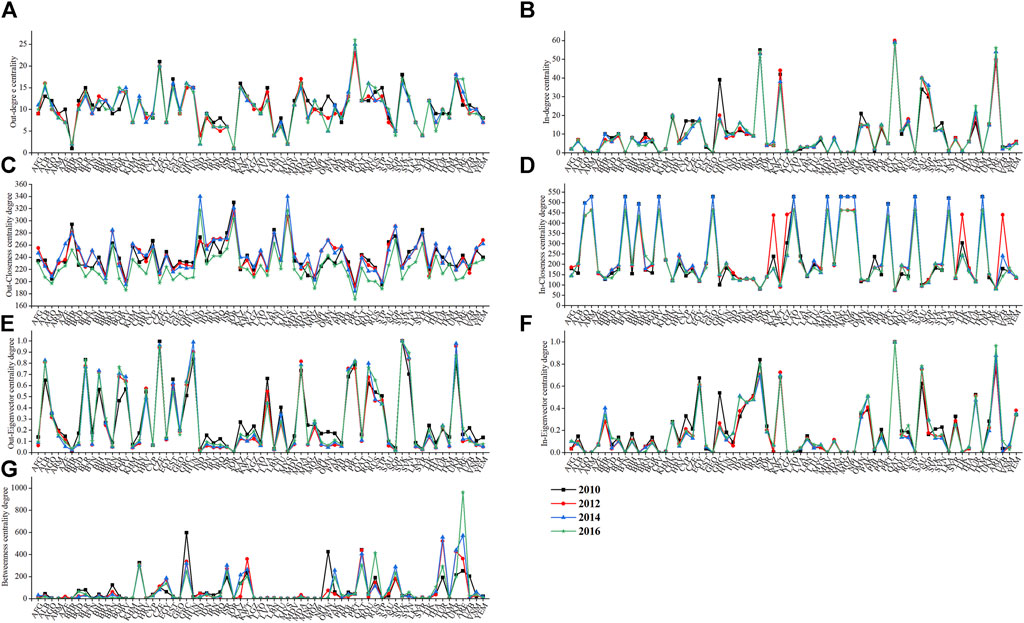
Figure 9. The individual network structural characteristics of spatially correlated networks. Out-degree centrality (A), In-degree centrality (B), Out-Closeness centrality degree (C), In-Closeness centrality degree (D), Out-Eigenvector centrality degree (E), In-Eigenvector centrality degree (F), Betweenness centrality degree (G).
In terms of closeness centrality, countries such as Jordan, Malaysia, Bahrain and Syria showed remarkable performance in out-closeness centrality in 2010, as shown in Figure 9C. In 2016, the ranking of out-closeness centrality changed, with India, Malaysia, Jordan, and Singapore coming out on top. Notably, Singapore’s out-closeness centrality has risen from seventh place in 2010 to fourth place in 2016. This shift is due to its status as a major maritime hub and the location of Middle Eastern countries such as Jordan, Bahrain, and Syria at key transit points that intersect multiple routes, improving their accessibility in the global transportation network. In addition, the open economic policies of these countries, such as the Regional Comprehensive Economic Partnership Agreement, have encouraged international economic activities and strengthened their economic ties with other nations. Thus, Regional cooperation has promoted the flow of foreign direct investment and the reduction of carbon emissions, which has improved their outbound Closeness centrality. In terms of in-closeness centrality, countries like São Tomé and Príncipe, the Maldives, and Bhutan were well-positioned in 2016, as shown in Figure 9D. However, by 2016, these countries experienced a decline in in-closeness centrality, indicating a decline in their influence within the global network. This situation is usually related to factors such as national foreign policies, the amount of international aid, geographical location, cultural and historical factors, as well as economic and trade relations.
In terms of eigenvector centrality, Slovakia, the Czech Republic, Hungary, and Slovenia stand out in terms of out-eigenvector centrality, as shown in Figure 9E. Notably, Slovenia in particular saw an increase in its out-eigenvector centrality from 0.702 in 2010 to 0.893 in 2016. These countries have competitive advantages in sectors in manufacturing, services and other sectors and have taken proactive measures in environmental policies, such as participation in carbon emission trading systems like the European Union Emissions Trading System (EU ETS). In addition, Central and Eastern European countries often play an important role in trade and political relations within the European Union and other regions, which contributes to their high ranking in the Out-Eigenvector Centrality. Furthermore, countries such as Qatar, the United Arab Emirates, Israel, Saudi Arabia, and Kuwait also rank high in in-eigenvector centrality, as shown in Figure 9F. These countries have abundant resources, a strategic position in global energy markets, are located on major transportation routes and are leaders in high-tech and innovation. As a result, they attract substantial high-value foreign direct investment.
In terms of betweenness centrality, there were significant changes in the ranking within the spatial association network from 2010 to 2016, with the nodal countries changing continuously, as shown in Figure 9G. In 2010, the leading countries in terms of betweenness centrality were primarily Greece, Qatar, Oman, China and the UAE with intermediate centrality scores of 597.965, 441.811, 424.596, 325.749, and 251.337. In 2016, the top spots shifted to the UAE, Russia, China, Qatar and Turkey with betweenness centralities of 960.925, 413.189, 309.897, 302.780, and 291.915 respectively. These countries exert significant influence and act as bridges within geographically connected networks. Particularly, noteworthy are the UAE, Russia and China, whose betweenness centrality far exceeds that of other countries or regions. China and Russia, for example, exert a major influence on global trade, politics and security and often serve as intermediaries in multilateral relations. Resource-rich countries such as Qatar and Kuwait, which are heavily dependent on oil and gas, occupy central positions in the global energy network. In contrast, countries with less intermediary centrality, such as Laos, Armenia and Turkmenistan, are often on the periphery of the networks due to their remote geographical location, weak economic foundations and technological backwardness and are therefore influenced by dominant countries.
The CONCOR method was used in this study to further investigate the clustering characteristics of the spatial association network. Using the 2016 clustering results as an example, a maximum split depth set at two and a convergence criterion of 0.2 were selected, resulting in the division of the 67 countries along the “Belt and Road” initiative were divided into four blocks (Table 11).
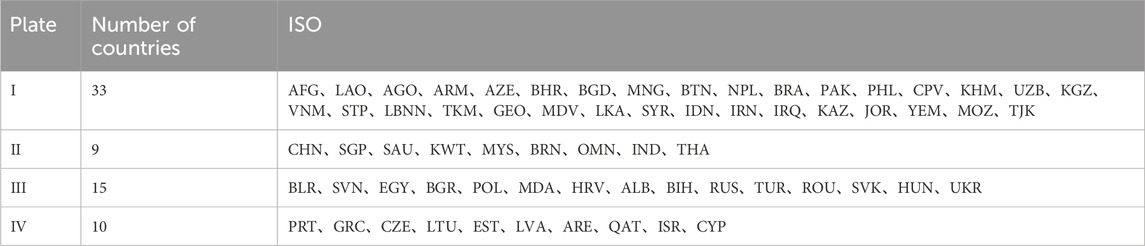
Table 11. The spatial clustering results.
The calculation results are presented in Table 12. In the spatial association network, there are a total of 688 associative relationships, of which 182 are internal relations within the blocks and 506 are external relations between the blocks, indicating a significant spatial correlation and overflow of linkage coordination between the blocks. Block I includes developing countries in Asia and Africa such as Afghanistan, Angola, and Armenia, where the share of internal relations is 11.62%, lower than the expected 48.49%, showing a net spillover effect. The industrial structure of these countries is relatively backward, relying on carbon-intensive industries mostly located at the periphery of the network, and they tend to attract investment in the energy industry, resulting in an overabundance of carbon emissions.
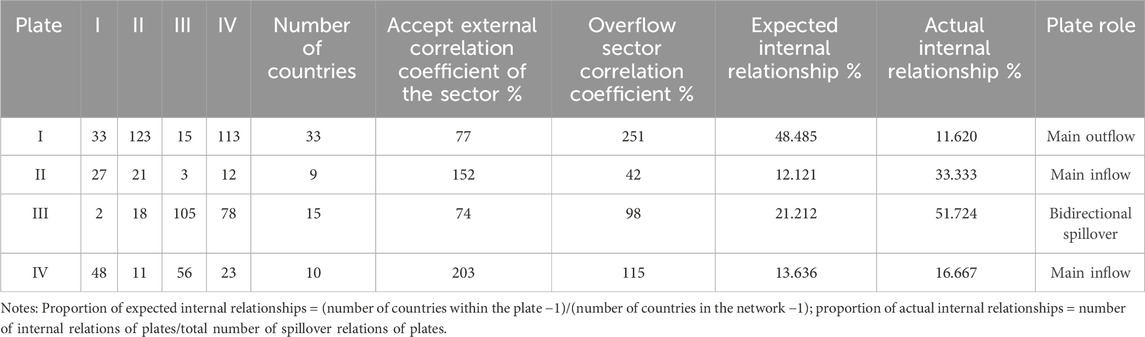
Table 12. Spillover effect of spatial correlation plate.
The proportion of internal relations within Block II is 33.33%, compared to the expected proportion of 12.121%, and the proportion of internal relations within Block IV is 16.67%, compared to the expected proportion of 13.64%. The actual internal share of both blocks is significantly different from the expected internal share, and the share of accepted relationships is higher than the share of spillover relationships between the blocks, so both belong to the net beneficiary blocks. Block II includes nine countries such as China and Singapore, while Block IV includes 10 countries such as Qatar and the United Arab Emirates, which have abundant energy resources, making them very attractive for investment in the international economy. To improve energy efficiency and reduce carbon dioxide emissions, these countries could cooperate more internationally with other countries to reduce carbon dioxide emissions across countries, so that they have net benefits in the network.
Block III, which includes countries such as Albania and Russia, has an actual share of relations of 51.72%, which is higher than the expected share of 21.21%, making it as a bidirectional spillover block. These countries have a diversified industrial structure that benefit from both carbon-intensive industries and emission reduction from low-carbon industries, making them important suppliers of labor and energy in the global production network.
In this study, taking 2016 as an example, the density matrices and image matrices of each block were calculated to reflect the spillover relationships and the direction of coupling coordination between the blocks (He et al., 2020; Dong and Li, 2022). The overall network density in 2016 was 0.156. If a block’s density exceeded this value, indicating a significant clustering trend, it was assigned a value of 1, otherwise 0. Based on this criterion, the image matrix was created (Table 13). Regarding the extent of the spillover effect within blocks, Block I showed a significant net spillover effect towards Blocks II and IV, but showed no internal association, indicating untapped regional potential. Blocks II, III, and IV had diagonal values of 1, indicating high reflexivity and distinct clustering characteristics. It is noteworthy that block III, as a bidirectional spillover block, exhibited mutual spillover effects with block IV.
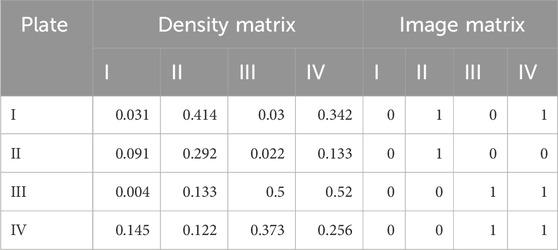
Table 13. The density matrix and image matrices.
Table 14 depicts the QAP correlation analysis between the spatial correlation matrix and the driving factors. The differences in the energy structure, labor rate and urbanization rate do not pass the significance test, indicating no significant correlation between these three variables and the spatial association., all other factors were significant at least at the 5% level.
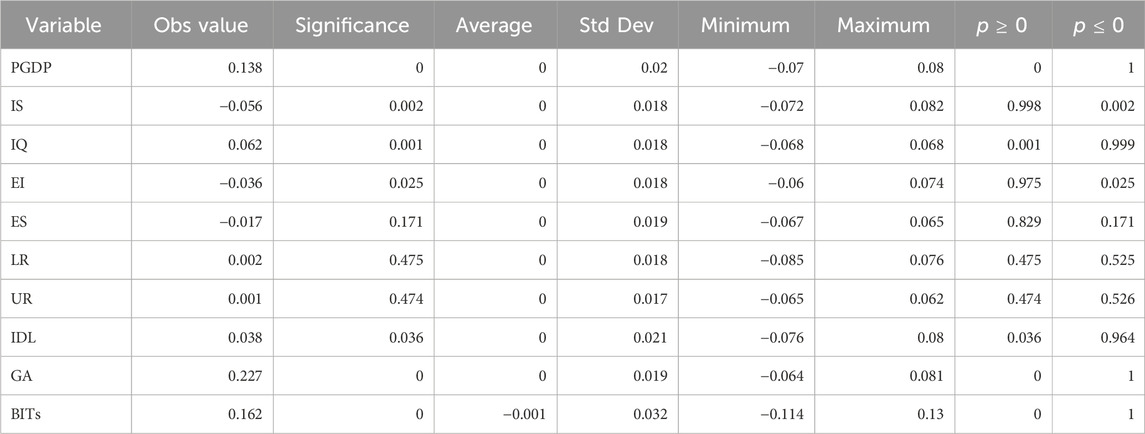
Table 14. QAP correlation analysis results of spatial correlation matrix T and influencing factors.
Table 15 presents the correlations between different variables. As can be seen from the table, there is a significant correlation between the influencing factors at the 1% level, which indicates the presence of multicollinearity between the variables. To address this issue, the QAP regression method is used for analysis in this study.
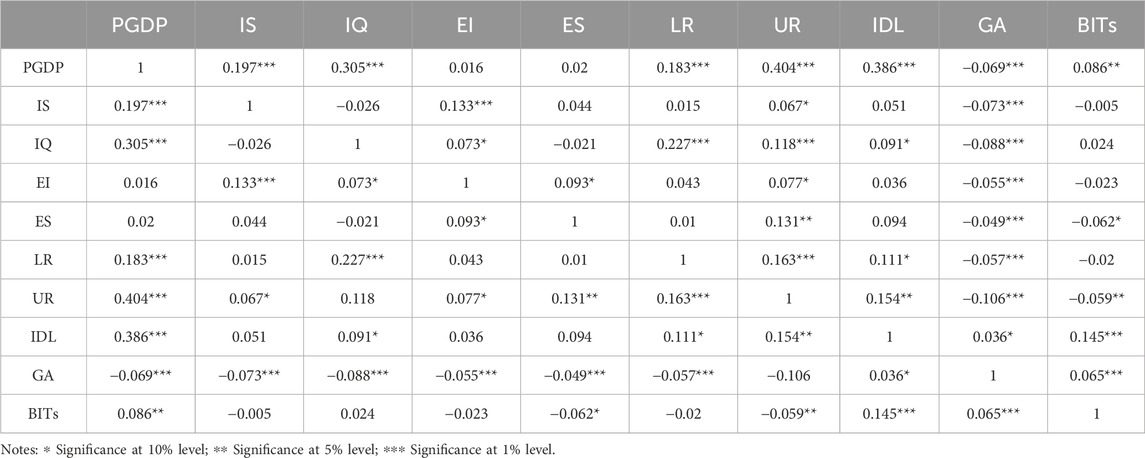
Table 15. QAP correlation analysis results of each influencing factor.
Based on the results of the QAP correlation analysis (Table 16), three variables that were not significant in the correlation test were eliminated in this study (Bai et al., 2020), and factors with significant correlation coefficients were selected as independent variables for the QAP regression analysis. The analysis was based on a selection of 5,000 random permutations, with a total of 10,000 random swaps. The results, presented in, show an adjusted R2 value of 0.102. This means that the explanatory variables account for 10.2% of the variance in the spatial association relationship of coupling coordination between the two networks, and the model passed the test at the 1% significance level.
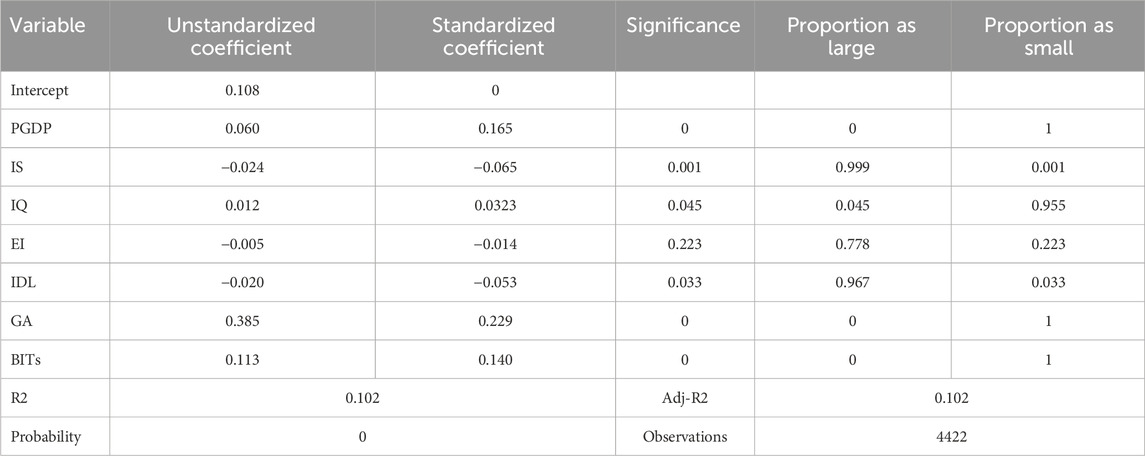
Table 16. QAP regression analysis results.
Per capita GDP has a positive effect on spatial correlation matrices at the 1% significance level, suggesting that regions with higher levels of economic development can attract talent from other regions, leading to population migration from economically underdeveloped areas to economically advanced areas, thus reducing energy consumption and carbon emissions (Mahadevan and Sun, 2020). In addition, higher incomes often attract capital inflows from other regions, countries with a higher per capita GDP can afford better energy-saving technologies. Conversely, economically weak but resource-rich countries can export their resources to technologically advanced countries for further processing, leading to closer spatial linkages between FDI flows and carbon transfers between economies (Liu Q. et al., 2020). The standardized coefficient of the geographical adjacency matrix is positive, indicating that the closer the geographical location of the countries, the stronger the correlation in the spatial network. This can be attributed to the shorter distances between neighboring countries, which allow for an easier flow of resources and thus increase the spatial correlation of FDI flows and carbon emissions. Bilateral investment agreements are significantly positively correlated at the 1% level, suggesting that these agreements improve the convenience of FDI flows (Kox and Rojas-Romagosa, 2020) and thereby promote a closer spatial correlation in the coupling of FDI flows and carbon transfers between countries. At the 1% significance level, industrial structure is significantly negative, suggesting that countries with similar industrial structure are more likely to strengthen their associative relationships. Regions with similar industrial structure tend to increase the inflow of products from other areas, thereby intensifying economic ties (Huo et al., 2022). At the 5% significance level, institutional quality shows a significant positive correlation, indicating that countries with greater differences in the institutional environment tend to strengthen associative relationships. Countries with poorer institutional environments tend to have relatively lower barriers to entry for foreign firms, which facilitates the exchange of resources and capital (Wang et al., 2022). The level of infrastructure development shows a significant negative correlation at the 5% level, indicating that the similarity of infrastructure development level positively influences the spatial correlation of FDI and carbon transfer. The improvement of infrastructure development level leads to more frequent resource transportation, funds, and population mobility, which strengthens the spatial correlations. For example, as transportation infrastructure gradually improves, the temporal distance between two countries decreases, transportation costs gradually decrease, and convenient transportation networks and freight transportation lead to an increase in carbon emissions (Wang et al., 2023). Energy intensity has no significant effect on spatial correlation, which is mainly due to the impact of the Belt and Road Initiative on energy efficiency convergence through trade integration and regional cooperation, reducing its effect on the spatial correlation of coupling coordination between FDI and carbon transfer (Han et al., 2018).
This study used social network analysis and a coupling coordination model to analyze the coupling coordination of FDI flow networks and carbon transfer networks between 67 countries along the “Belt and Road” initiative. A modified gravity model and the QAP method are used to empirically investigate the spatial correlation characteristics and influencing factors of coupling coordination between the two networks. The following conclusions are drawn:
(1) From the perspective of the general characteristics of the network structure, the network density and the number of network connections show an “M" trend, which means that the coupling coordination between the two networks has hardly changed. A network connectivity of one indicates good accessibility within the network. However, the network degree centrality has decreased significantly since 2012, indicating a dispersed flow of FDI and carbon transfer between countries. Despite the limited and declining trend in network efficiency growth, the network remains relatively stable overall. This result suggests that although many countries along the Belt and Road Initiative have implemented a series of measures to reduce carbon emissions, some local governments may lack strong motivation to enforce environmental regulations as economic and trade activities in the region develop (Cao et al., 2019), leading to a certain strengthening of the spatial correlation effects of FDI flows and carbon transfers, while the synergistic governance effects of regional investment and carbon emissions show a decreasing trend.
(2) Looking at the individual structural characteristics of the network, countries such as Qatar and the United Arab Emirates occupy a central position within the network, while Bahrain, Jordan and Lebanon are located on the periphery. The countries at the center of the network not only have closer ties, but also serve as a bridge between the two networks, while the countries on the periphery of the network have weaker ties. This result suggests that effective coordination of investment and carbon transfer development requires the implementation of regional cooperative governance mechanisms. Individual governance approaches that ignore spatial correlation effects cannot effectively reduce carbon emissions from economic activities. This result is also consistent with the concept of regional integration and coordinated development advocated by neorealism (Su and Yu, 2019). Therefore, in the cross-regional coordinated governance of investment and carbon emissions between countries along the Belt and Road Initiative, countries such as Qatar and the United Arab Emirates should be at the center of regionally coordinated carbon governance.
(3) In terms of spatial clustering, Block I has a “net outflow” and includes developing countries in Asia and Africa such as Afghanistan, Angola and Armenia. Blocks II and IV are “net recipients"," with Block II comprising nine countries, including China and Singapore, and Block IV ten countries, including Qatar and the United Arab Emirates. Block III represents a “two-way outflow"," which includes countries such as Albania and Russia. Looking at the individual linkage coordination of FDI and carbon transfer, the inflow block consists mainly of countries with high linkage coordination between the two networks, which are at the center of the network. Conversely, the outflow block consists mainly of countries at the periphery of the network with lower linkage coordination. More specifically, the main inflow block consists mainly of economically developed countries, while the main outflow block consists mainly of countries that are rich in resources and geographically remote (Huo et al., 2022).
(4) From the perspective of QAP regression analysis, factors such as economic development level, geographical proximity, bilateral investment agreements and institutional quality have a positive impact on the spatial correlation of FDI and carbon transfer coordination. Conversely, the industrial structure and the level of infrastructure development have a negative influence on the spatial correlation. Differences in energy intensity, differences in energy structure, urbanization rate and employment rate have no significant impact on spatial correlation. Factors such as geographical proximity, the signing of bilateral investment agreements, significant differences in economic development, significant differences in the institutional environment, similar industrial structures and a similar level of infrastructure development significantly promote the emergence of a spatial correlation. The research results provide a theoretical basis for “Belt and Road” countries to formulate reasonable policies for cross-regional investment and coordination of CO2 emission reduction. Governments should focus on promoting cross-regional coordinated carbon policies, especially in areas with short geographical distances, large differences in economic development and signed bilateral investment agreements.
This study introduces the coupling coordination model and social network analysis to the relationship between investment activities and carbon emissions in countries along the Belt and Road Initiative (BRI). It provides a new perspective for studying the relationship between investment and carbon emissions, addressing the current lack of integrated research on investment and carbon transfer. By using the modified gravity model to construct a spatial correlation network of the two networks, it also assesses the structural characteristics of the spatial correlation network and identifies the positions and roles of different countries in the network of coordinated economic flows and carbon emissions. This provides a basis and reference for formulating comprehensive and effective regional carbon emission management strategies and promoting rational use of investment and optimization of allocation. In the future, the combination of multi-regional input-output tables and complex network models to construct multi-regional associated networks can analyze the flow characteristics of resources between different economies or industries. In addition, by using coupling coordination model, the characteristics of coupling multi-system networks can be further explored (Liu et al., 2023).
Based on our research findings, several important policy implications can be proposed:
(1) Differentiated, cross-regional mechanisms for cooperation on carbon management should be created, promoting tailored approaches according to local conditions. Countries with strong producer-oriented linkages should emphasize supply-side instruments such as resource taxes, while countries with weak consumer-oriented linkages should consider introducing demand-side measures such as carbon pricing, trading and taxation to encourage companies to reduce their carbon emissions and engage in domestic carbon trading, thus reducing the dispersion of carbon transfer flows. In addition, it is recommended that countries along the Belt and Road Initiative (BRI) promote investment facilitation through measures such as simplifying investment procedures, tax incentives, signing bilateral investment treaties and reducing trade barriers to increase investment efficiency and enhance efforts to promote the development of low-carbon technologies, innovative green technologies and more efficient use of resources to reduce pollutant emissions. At the same time, it is important to establish a sound evaluation and accountability mechanism for coordinated carbon policies to regularly assess the effectiveness of regional coordinated carbon policies.
(2) Given the obvious spatial network correlations between FDI flows and carbon transfers, a trans-regionally coordinated carbon policy can capitalize on the leading role of economies in spatially connected networks. Based on the comprehensive platform of the Belt and Road Initiative (BRI), international cooperation can be fostered by designing mechanisms with countries that are in core positions with high linkage characteristics (such as Qatar and the United Arab Emirates). By fully utilizing the facilitation and bridging role of these core countries in the spatially coupled coordination network, joint efforts can be made to regulate carbon emissions in other regions and encourage countries in the periphery to improve carbon use efficiency and avoid excessive emissions.
(3) Countries that play a similar role in spatial clustering can implement cross-regional coordinated strategies to manage carbon emissions. Due to their analogous characteristics, emission reduction strategies are highly applicable. As “net beneficiaries"," they should make joint efforts to develop the new energy industry, raise entry barriers for high-polluting industries, and provide technical and financial support to other countries to ensure successful transformation of “net emitters.” China, as the initiator of the Belt and Road Initiative, should continue to play a leading role in the two sectors of “spillover in both directions” and “net beneficiaries” by establishing regional carbon reduction cooperation mechanisms and integrating them with international carbon reduction mechanisms. The Belt and Road countries can work with the European and American countries in market cooperation to transfer low-carbon technologies to the relatively lagging “net beneficiary” countries and train experts in carbon reduction technologies. In addition, support can be provided to facilitate low-carbon policy formulation and infrastructure construction.
Despite the contribution of this work, it has inevitably some limitations. First, the input-output data used in this study comes from the Eora database. However, due to the time lag, the data results of this study cannot reflect the latest developments in China and the Belt and Road region. In addition, due to data availability, not all Belt and Road countries were included in this study, leading to possible omissions in the research scope. As input-output databases continue to evolve and improve globally, the data lag issue encountered in this study will no longer be a challenge. Future research should promptly utilize newly released input-output data to capture recent changes in FDI flows and carbon emission transfers. Second, as a complex network system, the spatial correlation network of coupling coordination between FDI flow networks and carbon transfer networks is also influenced by various factors. Due to space limitations, only selected key factors are examined in this paper, so that their mechanisms of action cannot be comprehensively explored. Future research should investigate the network characteristics such as node degree centrality (DC), betweenness centrality (BC), closeness centrality (CC), and eigenvector centrality (EC) to understand their mechanisms. Third, future research can build a multi-layered coupling network from the industry level of different countries to further study the FDI flow and carbon transfer to provide better theoretical support and forward-looking suggestions for the coupling coordination study of FDI flow and carbon transfer in countries along the “Belt and Road".
The original contributions presented in the study are included in the article/Supplementary Material, further inquiries can be directed to the corresponding authors.
YH: Conceptualization, Formal Analysis, Methodology, Software, Writing–original draft, Writing–review and editing. DY: Conceptualization, Formal Analysis, Funding acquisition, Project administration, Supervision, Validation, Writing–review and editing. HY: Conceptualization, Data curation, Writing–review and editing. CY: Supervision, Validation, Writing–review and editing. JM: Conceptualization, Data curation, Writing–review and editing.
The author(s) declare that financial support was received for the research, authorship, and/or publication of this article. This work was supported by the National Fund of Philosophy and Social Science of China (23XGL033), Yunnan University Campus Humanities and Social Sciences Research Project (2022YNUGSP04), The Second Professional Graduate Practice Innovation Project of Yunnan University (ZC-22222993) and The 15th Graduate Research Innovation Project of Yunnan University (KC-23235545).
The authors declare that the research was conducted in the absence of any commercial or financial relationships that could be construed as a potential conflict of interest.
All claims expressed in this article are solely those of the authors and do not necessarily represent those of their affiliated organizations, or those of the publisher, the editors and the reviewers. Any product that may be evaluated in this article, or claim that may be made by its manufacturer, is not guaranteed or endorsed by the publisher.
The Supplementary Material for this article can be found online at: https://www.frontiersin.org/articles/10.3389/fenvs.2024.1393011/full#supplementary-material
Aller, C., Ductor, L., and Herrerias, M. J. (2015). The world trade network and the environment. Energy Econ. 52, 55–68. doi:10.1016/j.eneco.2015.09.008
An, M., Xie, P., He, W., Wang, B., Huang, J., and Khanal, R. (2023). Local and tele-coupling development between carbon emission and ecologic environment quality. J. Clean. Prod. 394, 136409. doi:10.1016/j.jclepro.2023.136409
Arif, A., An, P., Qi, Y., Li, H., An, H., Hussain, M., et al. (2021). The influence factors of the national roles in the FDI network: a combined methods of complex networks and Panel Data Analysis. Phys. A Stat. Mech. its Appl. 563, 125311. doi:10.1016/j.physa.2020.125311
Arthur, W. B. (1999). Complexity and the economy. Science 284, 107–109. doi:10.1126/science.284.5411.107
Bai, C., Zhou, L., Xia, M., and Feng, C. (2020). Analysis of the spatial association network structure of China’s transportation carbon emissions and its driving factors. J. Environ. Manag. 253, 109765. doi:10.1016/j.jenvman.2019.109765
Bali Swain, R., and Ranganathan, S. (2021). Modeling interlinkages between sustainable development goals using network analysis. World Dev. 138, 105136. doi:10.1016/j.worlddev.2020.105136
Ballor, G. A., and Yildirim, A. B. (2020). Multinational corporations and the politics of international trade in multidisciplinary perspective. Bus. Polit. 22, 573–586. doi:10.1017/bap.2020.14
Cao, X., Kostka, G., and Xu, X. (2019). Environmental political business cycles: the case of PM2.5 air pollution in Chinese prefectures. Environ. Sci. Policy 93, 92–100. doi:10.1016/j.envsci.2018.12.006
Chang, D., Miao, Q., Yuan, J., Tao, Z., Dong, Z., and Bai, Y. (2022). Carbon emissions by ‘the belt and road’ countries: impacts of foreign direct investment and development factors. Res. Environ. Sci. 35, 1556–1563. doi:10.13198/j.issn.1001-6929.2022.04.08
Chen, B., Li, J. S., Wu, X. F., Han, M. Y., Zeng, L., Li, Z., et al. (2018). Global energy flows embodied in international trade: a combination of environmentally extended input–output analysis and complex network analysis. Appl. Energy 210, 98–107. doi:10.1016/j.apenergy.2017.10.113
Chen, J., Shi, Q., and Zhang, W. (2022). Structural path and sensitivity analysis of the CO2 emissions in the construction industry. Environ. Impact Assess. Rev. 92, 106679. doi:10.1016/j.eiar.2021.106679
Chen, X., Di, Q., Jia, W., and Hou, Z. (2023a). Spatial correlation network of pollution and carbon emission reductions coupled with high-quality economic development in three Chinese urban agglomerations. Sustain. Cities Soc. 94, 104552. doi:10.1016/j.scs.2023.104552
Chen, X., Meng, Q., Wang, K., Liu, Y., and Shen, W. (2023b). Spatial patterns and evolution trend of coupling coordination of pollution reduction and carbon reduction along the Yellow River Basin, China. Ecol. Indic. 154, 110797. doi:10.1016/j.ecolind.2023.110797
Cheng, C., and Shun, W. (2022). Spatial linkages and dynamic factors of China-asean two-way direct investment. Asia-pacific Econ. Rev., 80–90. doi:10.16407/j.cnki.1000-6052.2022.03.009
Cole, M. A., and Elliott, R. J. R. (2005). FDI and the capital intensity of “dirty” sectors: a missing piece of the pollution haven puzzle. Rev. Dev. Econ. 9, 530–548. doi:10.1111/j.1467-9361.2005.00292.x
Deng, Y. (2016). “Foreign direct investment,” in Environmental pollution and strategic emission reductions (China: Hunan University).
Dong, J., and Li, C. (2022). Structure characteristics and influencing factors of China’s carbon emission spatial correlation network: a study based on the dimension of urban agglomerations. Sci. Total Environ. 853, 158613. doi:10.1016/j.scitotenv.2022.158613
Duan, Y., and Jiang, X. (2018). Visualizing the change of embodied CO2 emissions along global production chains. J. Clean. Prod. 194, 499–514. doi:10.1016/j.jclepro.2018.05.133
Ernst, D., and Kim, L. (2002). Global production networks, knowledge diffusion, and local capability formation. Res. Policy 31, 1417–1429. doi:10.1016/S0048-7333(02)00072-0
Fan, J.-L., Da, Y.-B., Wan, S.-L., Zhang, M., Cao, Z., Wang, Y., et al. (2019). Determinants of carbon emissions in ‘Belt and Road initiative’ countries: a production technology perspective. Appl. Energy 239, 268–279. doi:10.1016/j.apenergy.2019.01.201
Girma, S., Gong, Y., and Görg, H. (2008). Foreign direct investment, access to finance, and innovation activity in Chinese enterprises. World Bank. Econ. Rev. 22, 367–382. doi:10.1093/wber/lhn009
Görg, H., and Greenaway, D. (2004). Much ado about nothing? Do domestic firms really benefit from foreign direct investment? World Bank Res. Observer 19, 171–197. doi:10.1093/wbro/lkh019
Grossman, G. M., and Krueger, A. B. (1995). Economic growth and the environment. Q. J. Econ. 110, 353–377. doi:10.2307/2118443
Gu, A., and Zhou, X. (2020). Emission reduction effects of the green energy investment projects of China in belt and road initiative countries. Ecosyst. Health Sustain. 6, 1747947. doi:10.1080/20964129.2020.1747947
Han, L., Han, B., Shi, X., Su, B., Lv, X., and Lei, X. (2018). Energy efficiency convergence across countries in the context of China’s Belt and Road initiative. Appl. Energy 213, 112–122. doi:10.1016/j.apenergy.2018.01.030
He, Y.-Y., Wei, Z.-X., Liu, G.-Q., and Zhou, P. (2020). Spatial network analysis of carbon emissions from the electricity sector in China. J. Clean. Prod. 262, 121193. doi:10.1016/j.jclepro.2020.121193
Hertwich, E. G. (2021). Increased carbon footprint of materials production driven by rise in investments. Nat. Geosci. 14, 151–155. doi:10.1038/s41561-021-00690-8
Htwe, N. N., Lim, S., and Kakinaka, M. (2020). The coevolution of trade agreements and investment treaties: some evidence from network analysis. Soc. Netw. 61, 34–52. doi:10.1016/j.socnet.2019.08.005
Huang, J., Shen, J., and Miao, L. (2021). Carbon emissions trading and sustainable development in China: empirical analysis based on the coupling coordination degree model. Int. J. Environ. Res. Public Health 18, 89. doi:10.3390/ijerph18010089
Huo, T., Cao, R., Xia, N., Hu, X., Cai, W., and Liu, B. (2022). Spatial correlation network structure of China’s building carbon emissions and its driving factors: a social network analysis method. J. Environ. Manag. 320, 115808. doi:10.1016/j.jenvman.2022.115808
Ji, J., Zhou, L., and Wei, J. (2023). Decoupling evolution of economic activity and carbon transfer in China: a multi-level analysis from network perspective. J. Environ. Manag. 348, 119360. doi:10.1016/j.jenvman.2023.119360
Jiang, Y., Ren, Y.-S., Narayan, S., Ma, C.-Q., and Yang, X.-G. (2022). Heterogeneity dependence between oil prices and exchange rate: evidence from a parametric test of Granger causality in quantiles. North Am. J. Econ. Finance 62, 101711. doi:10.1016/j.najef.2022.101711
Jorgenson, A., Clark, R., Kentor, J., and Rieger, A. (2022). Networks, stocks, and climate change: a new approach to the study of foreign investment and the environment. Energy Res. Soc. Sci. 87, 102461. doi:10.1016/j.erss.2021.102461
Khan, H., Weili, L., and Khan, I. (2022). The role of institutional quality in FDI inflows and carbon emission reduction: evidence from the global developing and belt road initiative countries. Environ. Sci. Pollut. Res. 29, 30594–30621. doi:10.1007/s11356-021-17958-6
Kox, H. L. M., and Rojas-Romagosa, H. (2020). How trade and investment agreements affect bilateral foreign direct investment: results from a structural gravity model. World Econ. 43. doi:10.1111/twec.13002
Li, F., and Li, X. (2022). An empirical analysis on regional natural gas market of China from a spatial pattern and social network perspective. Energy 244, 122598. doi:10.1016/j.energy.2021.122598
Li, H., Qiu, P., and Wu, T. (2021). The regional disparity of per-capita CO2 emissions in China’s building sector: an analysis of macroeconomic drivers and policy implications. Energy Build. 244, 111011. doi:10.1016/j.enbuild.2021.111011
Li, J., and Li, S. (2020). Energy investment, economic growth and carbon emissions in China—empirical analysis based on spatial Durbin model. Energy Policy 140, 111425. doi:10.1016/j.enpol.2020.111425
Li, T., and Du, D. (2023). The evolution of global cross-border R&D investment: a network analysis integrating geographical thinking. Appl. Geogr. 158, 103027. doi:10.1016/j.apgeog.2023.103027
Li, Y. L., Chen, B., and Chen, G. Q. (2020). Carbon network embodied in international trade: global structural evolution and its policy implications. Energy Policy 139, 111316. doi:10.1016/j.enpol.2020.111316
Lin, B., and Teng, Y. (2022). Structural path and decomposition analysis of sectoral carbon emission changes in China. Energy 261, 125331. doi:10.1016/j.energy.2022.125331
Lin, Z., Meng, F., Wang, D., Liao, D., Sun, Y., Hou, J., et al. (2023). Unfolding carbon inequality across Belt and Road Initiative countries and regions under a global trade network. Ecol. Model. 482, 110411. doi:10.1016/j.ecolmodel.2023.110411
Liu, C., Wu, C., and Li, Z. (2020a). Effects on carbon emission of China’s direct investment in Belt and Road countries. China Popul. Resour. Environ. 32, 9–18. doi:10.12062/cpre.20211110
Liu, H., Liu, C., and Shun, Y. (2015). Spatial correlation network structure of energy consumption and its effect in China. China Ind. Econ., 83–95. doi:10.19581/j.cnki.ciejournal.2015.05.008
Liu, H., Wang, Y., Jiang, J., and Wu, P. (2020b). How green is the “Belt and Road Initiative”? – Evidence from Chinese OFDI in the energy sector. Energy Policy 145, 111709. doi:10.1016/j.enpol.2020.111709
Liu, J., Yu, J., and Che, W. (2019). FDI flow and the division of labor in GVC:an understanding from the perspective of social network analyses. J. Finance Econ. 45, 100–113. doi:10.16538/j.cnki.jfe.2019.03.008
Liu, Q., Wang, S., Li, B., and Zhang, W. (2020c). Dynamics, differences, influencing factors of eco-efficiency in China: a spatiotemporal perspective analysis. J. Environ. Manag. 264, 110442. doi:10.1016/j.jenvman.2020.110442
Liu, X., Vu, D., Perera, S. C., Wang, G., and Xiong, R. (2023). Nexus between water-energy-carbon footprint network: multiregional input-output and coupling coordination degree analysis. J. Clean. Prod. 139639, 139639. doi:10.1016/j.jclepro.2023.139639
Liu, X., Zhang, L., Hao, Y., Yin, X., and Shi, Z. (2022). Increasing disparities in the embedded carbon emissions of provincial urban households in China. J. Environ. Manag. 302, 113974. doi:10.1016/j.jenvman.2021.113974
Lu, Q., Fang, K., Heijungs, R., Feng, K., Li, J., Wen, Q., et al. (2020). Imbalance and drivers of carbon emissions embodied in trade along the Belt and Road Initiative. Appl. Energy 280, 115934. doi:10.1016/j.apenergy.2020.115934
Lu, S., Chen, N., Zhou, W., and Li, S. (2024). Impact of the belt and road initiative on trade status and FDI attraction: a local and global network perspective. Int. Rev. Econ. Finance 89, 1468–1495. doi:10.1016/j.iref.2023.09.003
Luo, L., Wang, Y., Liu, Y., Zhang, X., and Fang, X. (2022). Where is the pathway to sustainable urban development? Coupling coordination evaluation and configuration analysis between low-carbon development and eco-environment: a case study of the Yellow River Basin, China. Ecol. Indic. 144, 109473. doi:10.1016/j.ecolind.2022.109473
Lv, K., Feng, X., Kelly, S., Zhu, L., and Deng, M. (2019). A study on embodied carbon transfer at the provincial level of China from a social network perspective. J. Clean. Prod. 225, 1089–1104. doi:10.1016/j.jclepro.2019.03.233
Ma, N., Sun, W., Wang, Z., Li, H., Ma, X., and Sun, H. (2023). The effects of different forms of FDI on the carbon emissions of multinational enterprises: a complex network approach. Energy Policy 181, 113731. doi:10.1016/j.enpol.2023.113731
Mahadevan, R., and Sun, Y. (2020). Effects of foreign direct investment on carbon emissions: evidence from China and its Belt and Road countries. J. Environ. Manage 276, 111321. doi:10.1016/j.jenvman.2020.111321
Marques, A. C., and Caetano, R. (2020). The impact of foreign direct investment on emission reduction targets: evidence from high- and middle-income countries. Struct. Change Econ. Dyn. 55, 107–118. doi:10.1016/j.strueco.2020.08.005
Meng, F., Su, M., and Hu, Y. (2019). Embodied carbon in trade of China and typical countries along the ’Belt and Road. China Popul. Resour. Environ. 33, 18–26. doi:10.12062/cpre.20180919
Mi, Z., Zheng, J., Meng, J., Ou, J., Hubacek, K., Liu, Z., et al. (2020). Economic development and converging household carbon footprints in China. Nat. Sustain 3, 529–537. doi:10.1038/s41893-020-0504-y
Miao, L., Gu, H., Zhang, X., Zhen, W., and Wang, M. (2019). Factors causing regional differences in China’s residential CO2 emissions—evidence from provincial data. J. Clean. Prod. 224, 852–863. doi:10.1016/j.jclepro.2019.03.271
Nejati, M., and Taleghani, F. (2022). Pollution halo or pollution haven? A CGE appraisal for Iran. J. Clean. Prod. 344, 131092. doi:10.1016/j.jclepro.2022.131092
Ning, Y., Miao, L., Ding, T., and Zhang, B. (2019). Carbon emission spillover and feedback effects in China based on a multiregional input-output model. Resour. Conservation Recycl. 141, 211–218. doi:10.1016/j.resconrec.2018.10.022
Quaye, E., Acquaye, A., Yamoah, F., and Ndiaye, M. (2023). FDI interconnectedness and sustainable economic development: a linear and non-linear Granger causality assessment. J. Bus. Res. 164, 113981. doi:10.1016/j.jbusres.2023.113981
Shahbaz, M., Nasir, M. A., and Roubaud, D. (2018). Environmental degradation in France: the effects of FDI, financial development, and energy innovations. Energy Econ. 74, 843–857. doi:10.1016/j.eneco.2018.07.020
Shun, Q. (2022). Spatial-temporal coupling of venture capital and green technology innovation networks and its influencing factors: a case study of the yangtze river delta urban agglomeration. Trop. Geogr. 42, 716–726. doi:10.13284/j.cnki.rddl.003486
Shun, Q., and Huang, L. (2022). Spatial-temporal coupling of venture capital and green technology innovation networks and lts influencing factors: a case study of the yangtze river delta urban agglomeration. Trop. Geogr. 42, 716–726. doi:10.13284/j.cnki.rddl.003486
Song, C., Zhang, Z., Xu, W., and Elshkaki, A. (2023). The spatial effect of industrial transfer on carbon emissions under firm location decision:A carbon neutrality perspective. J. Environ. Manag. 330, 117139. doi:10.1016/j.jenvman.2022.117139
Su, K., and Shen, W. (2023). Environmental protection provisions in international investment agreements: global trends and Chinese practices. Sustainability 15, 8525. doi:10.3390/su15118525
Su, Y., and Yu, Y. (2019). Spatial association effect of regional pollution control. J. Clean. Prod. 213, 540–552. doi:10.1016/j.jclepro.2018.12.121
Vanli, T., and Akan, T. (2023). Mapping synergies and trade-offs between smart city dimensions: a network analysis. Cities 142, 104527. doi:10.1016/j.cities.2023.104527
Wang, L. (2022). Research on the dynamic relationship between China’s renewable energy consumption and carbon emissions based on ARDL model. Resour. Policy 77, 102764. doi:10.1016/j.resourpol.2022.102764
Wang, M., and Feng, C. (2021). The consequences of industrial restructuring, regional balanced development, and market-oriented reform for China’s carbon dioxide emissions: a multi-tier meta-frontier DEA-based decomposition analysis. Technol. Forecast. Soc. Change 164, 120507. doi:10.1016/j.techfore.2020.120507
Wang, M., Yang, M., and Wang, N. (2022). Study on countermeasures for high quality development of transportation infrastructure construction in the yellow river basin. Environ. Prot. 50, 51–53. doi:10.14026/j.cnki.0253-9705.2022.15.016
Wang, X., Wang, Y., and Wei, C. (2023). The impact of natural resource abundance on green economic growth in the belt and road countries: the role of institutional quality. Environ. Impact Assess. Rev. 98, 106977. doi:10.1016/j.eiar.2022.106977
Wang, Y., Liao, M., Wang, Y., Xu, L., and Malik, A. (2021). The impact of foreign direct investment on China’s carbon emissions through energy intensity and emissions trading system. Energy Econ. 97, 105212. doi:10.1016/j.eneco.2021.105212
Wang, Z., Zhao, S., and Yang, X. (2020). Study on the evolvement of coupling coordination between transportation network and tourism resort of urban agglomeration——a case study of Chang-Zhu-Tan urban agglomeration. World Reg. Stud. 29, 962–972. doi:10.3969/j.issn.1004-9479.2020.05.2019247
Wasserman, S., and Faust, K. (1994). Social network analysis: methods and applications. Cambridge: Cambridge University Press. doi:10.1017/CBO9780511815478
Wei, G., Bi, M., Liu, X., Zhang, Z., and He, B.-J. (2023). Investigating the impact of multi-dimensional urbanization and FDI on carbon emissions in the belt and road initiative region: direct and spillover effects. J. Clean. Prod. 384, 135608. doi:10.1016/j.jclepro.2022.135608
Wei, S., Wei, S., and Li, H. (2018). Taiwan foreign investment connections and lts influencing factors————based on social network analysis. Taiwan Res. J., 68–80. doi:10.14157/j.cnki.twrq.2018.06.007
Wellman, B., Salaff, J., Dimitrova, D., Garton, L., Gulia, M., and Haythornthwaite, C. (1996). Computer networks as social networks: collaborative work, telework, and virtual community. Annu. Rev. Sociol. 22, 213–238. doi:10.1146/annurev.soc.22.1.213
Xie, H., Yang, D., Zhang, K., and Yang, L. (2023). Structural evolutionary analysis of the embodied net carbon transfer network of Belt and Road trade: from the regional and sectoral perspectives. Environ. Sci. Pollut. Res. 30, 54205–54222. doi:10.1007/s11356-023-26151-w
Xu, H., and Cheng, L. (2016). The QAP weighted network analysis method and its application in international services trade. Phys. A Stat. Mech. its Appl. 448, 91–101. doi:10.1016/j.physa.2015.12.094
Xu, Q., Dong, Y., and Yang, R. (2018). Urbanization impact on carbon emissions in the Pearl River Delta region: Kuznets curve relationships. J. Clean. Prod. 180, 514–523. doi:10.1016/j.jclepro.2018.01.194
Xu, W., Xie, Y., Cai, Y., Ji, L., Wang, B., and Yang, Z. (2021). Environmentally-extended input-output and ecological network analysis for Energy-Water-CO2 metabolic system in China. Sci. Total Environ. 758, 143931. doi:10.1016/j.scitotenv.2020.143931
Yan, Y., and Li, X. (2023). The evolution and influencing factors of lnvestment carbon transfer of multinational enterprises: based on social network analysis method. Int. Econ. Trade Res. 39, 83–98. doi:10.13687/j.cnki.gjjmts.20231025.003
Yu, J., and Gong, T. (2020). Analyzing the deconstruction and influencing factors of the global carbon transfer network. China Popul. Resour. Environ. 30, 21–30. doi:10.12062/cpre.20191135
Zeng, D.-Z., and Zhao, L. (2009). Pollution havens and industrial agglomeration. J. Environ. Econ. Manag. 58, 141–153. doi:10.1016/j.jeem.2008.09.003
Zhang, M., Yang, Z., Liu, L., and Zhou, D. (2021). Impact of renewable energy investment on carbon emissions in China - an empirical study using a nonparametric additive regression model. Sci. Total Environ. 785, 147109. doi:10.1016/j.scitotenv.2021.147109
Zhang, Z., and Chen, W. (2022). Embodied carbon transfer between China and the belt and road initiative countries. J. Clean. Prod. 378, 134569. doi:10.1016/j.jclepro.2022.134569
Zhang, Z., Zhao, Y., Cai, H., and Ajaz, T. (2023). Influence of renewable energy infrastructure, Chinese outward FDI, and technical efficiency on ecological sustainability in belt and road node economies. Renew. Energy 205, 608–616. doi:10.1016/j.renene.2023.01.060
Zhao, L., Liu, J., Li, D., Yang, Y., Wang, C., and Xue, J. (2022). China’s green energy investment risks in countries along the Belt and Road. J. Clean. Prod. 380, 134938. doi:10.1016/j.jclepro.2022.134938
Zheng, Y., Du, S., Zhang, X., Bai, L., and Wang, H. (2022). Estimating carbon emissions in urban functional zones using multi-source data: a case study in Beijing. Build. Environ. 212, 108804. doi:10.1016/j.buildenv.2022.108804
Keywords: FDI flow network, carbon transfer network, social network analysis, coupling coordination model, modified gravity model, spatial correlation
Citation: Huang Y, You D, Yu H, Yang C and Mao J (2024) A study on the spatial correlation network structure and its influencing factors of coupling coordination between FDI flow network and carbon transfer network in the belt and road initiative countries. Front. Environ. Sci. 12:1393011. doi: 10.3389/fenvs.2024.1393011
Received: 28 February 2024; Accepted: 07 June 2024;
Published: 02 September 2024.
Edited by:
Martin Siegert, University of Exeter, United KingdomReviewed by:
Cheng Sun, Hubei University of Economics, ChinaCopyright © 2024 Huang, You, Yu, Yang and Mao. This is an open-access article distributed under the terms of the Creative Commons Attribution License (CC BY). The use, distribution or reproduction in other forums is permitted, provided the original author(s) and the copyright owner(s) are credited and that the original publication in this journal is cited, in accordance with accepted academic practice. No use, distribution or reproduction is permitted which does not comply with these terms.
*Correspondence: Yong Huang, aHlfaHVhbmd5b25nNjZAMTYzLmNvbQ==; Haozhen Yu, MTE5NDExMzc5NkBxcS5jb20=
Disclaimer: All claims expressed in this article are solely those of the authors and do not necessarily represent those of their affiliated organizations, or those of the publisher, the editors and the reviewers. Any product that may be evaluated in this article or claim that may be made by its manufacturer is not guaranteed or endorsed by the publisher.
Research integrity at Frontiers
Learn more about the work of our research integrity team to safeguard the quality of each article we publish.