 Shayan Kabiri
 Sharon M. O’Rourke
- School of Biosystems and Food Engineering, University College Dublin, Dublin, Ireland
Introduction: Modeling and mapping of soil organic carbon concentration and distribution at the pedon scale is a current knowledge gap that can be addressed by laboratory-based hyperspectral imaging and chemometric analysis of soil cores. Despite the advancements in soil organic carbon models based on hyperspectral images, it is not clear how these models will perform upon input with images at higher resolutions than those of their training sets. This study aims to measure the generalizability of a soil organic carbon model based on a test set with higher resolution hyperspectral images than that of its training set.
Methods: Organic carbon contents were measured at 10 cm intervals on eight soil cores for use as the training set and at 1 cm intervals on a single core for use as the test set. Three regression models, namely, multilayer perceptron, partial least-squares, and support vector regressions, were trained and tested with the median of each hyperspectral image for each of these intervals as the training and test predictors. Permutation importance analysis was performed to explain the models.
Results: The results show that although all three models had the same validation R2 of 0.92 for cross-validation on the 10 cm data, multilayer perceptron regression allowed the best generalization with a test R2 of 0.96 compared to the partial least-squares regression (0.81) and support vector regression (0.86). It was demonstrated that the multilayer perceptron model is more robust to soil surface anomalies and that it predicts soil organic carbon on the test set by learning the spectral features related to soil organic matter chromophore activity in the 950–1,150 nm region along with clay mineralogy derived from peaks at 1,400, 1,900, 2,200, 2,250, and 2,350 nm.
Conclusions: This study shows that while the regression models based on hyperspectral images perform well at the 10-cm-resolution cross validation, multilayer perceptron regression shows superior generalization and robustness for a higher 1-cm-resolution test set without much loss of prediction power.
1 Introduction
Understanding soil mechanisms and dynamics, especially those of soil organic carbon and its sequestration, at smaller than the pedon and subcentimeter scales is a major research subject in soil sciences (O’Rourke et al., 2015). In recent years, hyperspectral imaging has gained significant interest as one of the most popular methods of acquiring inputs for soil organic carbon models at the subcentimeter scale (O’Rourke et al., 2011; Steffens and Buddenbaum, 2013; Tahmasbian et al., 2018; Sorenson et al., 2020; Xu et al., 2020). However, in these studies, as is the case with many environmental modeling practices, due to lack of object-specific test sets, it is not clear how much of the predictive power demonstrated through leave-out or cross-validation is retained when the same model is used to predict soil organic carbon at a resolution higher than that of the training responses (Meyer et al., 2019).
Several linear and non-linear regression models, including partial least-squares regression (PLSR) (O’Rourke et al., 2011; Tahmasbian et al., 2018), neural network regression (Sorenson et al., 2020), and support vector regression (SVR) (Steffens and Buddenbaum, 2013), have been used to model soil organic carbon content from hyperspectral images. The models are often chosen on the basis of cross-validation performance metrics, with little to no attempts at interpreting the models produced, specifically in the case of the non-linear models.
One class of neural networks called multilayer perceptron (MLP) has been used for classification and regression tasks in datasets with complex non-linear relationships (Murtagh, 1991). These models are known for their generalization power as well as ability for feature extraction and response prediction across various scales (Yuan et al., 2020); however, they tend to not converge on small datasets. This can be overcome by introducing numerous hidden layers to increase the model complexity (Olson et al., 2018) and has been successfully deployed on small datasets for environmental modeling (Nawal et al., 2023). Compared to the linear models, MLP models are usually considered to be black boxes in terms of the model explanation (Benitez et al., 1997) as they are often used only as predictive models without interpretation of their inner logic. This difficulty is usually addressed by implementing model-agnostic predictor importance analysis methods (Molnar et al., 2022).
The main aim of this study was to investigate the generalizability of hyperspectral-image-based soil organic carbon models for test data at higher resolutions than those used for training. This is an important consideration in modeling soil organic carbon concentration and distribution at various depths and is a requirement prior to deployment of such methods for assessing soil management practices in field experiments.
Hyperspectral images of eight soil cores were acquired with soil organic carbon references at 10 cm intervals for use as the training set as well as from a single core at 1 cm intervals for use as the test set. Models based on MLP regression, PLSR, and SVR were trained, tuned, and cross-validated on the training set before being evaluated on the test set to demonstrate the predictive power for inputs of higher resolution. Permutation importance, which is a model-agnostic predictor importance analysis method, was used to explain the MLP model and its possible mechanism of soil organic carbon prediction.
2 Materials and methods
2.1 Data acquisition
Nine soil cores were collected from UCD Lyon Research Farm, Co., Kildare, Ireland (53°17’52” N 6° 32’08” W) (Figure 1). This site is under temperate maritime climate, with no dry season and an annual rainfall of 750–1000 mm (Lalor et al., 2004). Three soil types were sampled on the basis of previous soil maps: brown earth (BE), gray brown podzolic (P), and low-humic gley (G). The brown earth soil originates from Silurian rock mixed with limestone drift and old red sandstone, the podzolic soil originates from a fine covering of glacial limestone drift laying atop limestone rock, and the gley soil originates from unstratified calcareous drift parent material resting on decalcified and decalcifying calp limestone (Collins and Hames, 1970). All sampling sites were managed as perennial ryegrass (Lolium perenne) sward under rotational grazing with reseeding approximately once every 8 years. Soil cores of dimensions 50 mm × 1,000 mm were extracted using a percussion drill (Eijkelkamp, Giesbeek, Netherlands) with uPVC core liners. The cores were split lengthwise into halves using a mechanical saw to split the uPVC liners as well as a fine-toothed single-handed saw to split the soil within. One of these splits was cut at 20 cm intervals for imaging, and the other split was used for bulk sampling.
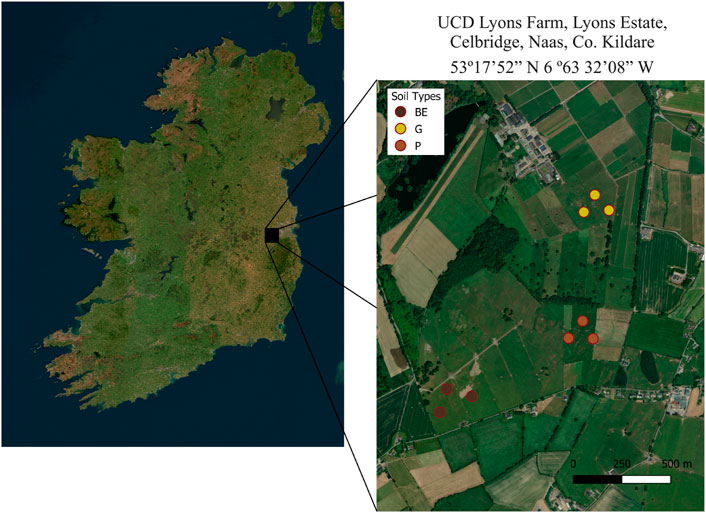
Figure 1. Sampling site location and approximate sampling points for the cores of three soil types: brown earth (BE), gleysol (G), and podzol (P).
The cores were cut into 20 cm subcores using a hacksaw. Then, hyperspectral images of these subcores were acquired using a Hypspex SWIR-384 device in the spectral range of 947–2,514 nm. The images were then calibrated using a 100% reflectance spectralon.
Soil organic carbon concentrations were acquired from the samples by the dry combustion method for 10-cm sections of eight of the core splits and for 1-cm sections of one brown earth soil core for use as training and test sets, respectively. This resulted in 78 and 89 data points for the training and test sets, respectively, reflecting acquired soil core depths between 90 and 100 cm.
2.2 Statistics and modeling
2.2.1 Pretreatment
All of the 20-cm hyperspectral images were cropped by visual inspection and stitched to obtain the whole core length. In cases where the widths of the 20-cm images did not match, the largest width was used as the core width while the other images were upscaled using spline interpolation. All core images were spectrally scaled to reduce the effects of uneven soil surfaces (Esquerre et al., 2012; Kubat, 2021) following Eq. (1), with ρijk being the reflectance at point (i, j) in the image for the spectral band k and ρij being the set of reflectances at point (i, j) in the images across all bands. To remove the background and shadows, k-means clustering (Hartigan and Wong, 1979) was performed with two clusters for each core image, and the pixels corresponding to the background cluster were replaced with NAN (not a number) values. The rows in the images that had more than 50% NANs were removed as these were most likely areas at the beginning or end of the 20-cm subcores, and their removal improved image stitching.
2.2.2 Regression models
The median spectra for the 10 cm and 1 cm sections from the training and test cores were calculated for use as predictors, and the 10 cm and 1 cm reference soil organic carbon concentrations were used as the training and test responses, respectively. The 10 cm and 1 cm intervals were determined on the basis of image length to account for the negative effects of core cutting and image stitching.
The three regression models, MLP regression (MLPR) (Murtagh, 1991), PLSR (Geladi and Kowalski, 1986), and SVR (Awad and Khanna, 2015), were tuned and cross-validated (three-fold) on the 10-cm samples and tested on the 1-cm samples.
In MLPR, an MLP neural network comprising an input, an output, and several hidden layers in between was trained. The input data were processed through the network by applying weights and biases to the connections and passing the results through activation functions in the hidden layers before producing the outputs at the output layer. These activation functions can potentially introduce non-linearities that capture complex patterns in the data. During training, the weights and biases of the hidden layers are optimized. The MLPR model was tuned for the activation function, number of hidden layers, solver, and initial learning rate. The number of hidden layers was tuned for up to 10, as prescribed by Olson et al. (2018) for creating MLPR models with small datasets.
PLSR combines the features of principal component analysis (PCA) and multiple regression by finding latent variables that explain the maximum covariance between the predictor and response variables. This is particularly useful in cases where the number of predictors exceeds the number of samples, as is often the case with hyperspectral images. The PLSR model was tuned for the number of components used.
SVR finds the relationship between the predictors and responses by fitting a hyperplane in a high-dimensional space. The SVR model was tuned for the kernel, kernel coefficient, and regularization parameters C and ϵ.
For MLPR and SVR, the features were merged into clusters (Xu and Lee, 2015) and tuned for the number of clusters to reduce the computational cost.
2.2.3 Predictor importance analysis
A model-agnostic predictor importance analysis called permutation importance (Altmann et al., 2010) was used on the test set to determine the spectral regions that are most important for predicting soil organic carbon. In each step of this method, a predictor from the training set is randomly shuffled and a new model is fitted to the training set to measure its performance on the test set. The worsening of the performance metric compared to that of the base model is deemed as the importance of that predictor. High correlations between predictors may cause the permutation importance to underestimate the predictor importance (Nicodemus et al., 2010; Molnar et al., 2022). To avoid this, cross-correlations were calculated between the spectra for various lag steps, and n clusters were randomly shuffled at each permutation, with n being the lag step with the least cross-correlated predictors. For the PLSR model, the coefficients of the linear model derived from PLSR were also used as a secondary measure of predictor importance, but these coefficients only apply to the training set.
All statistical analyses and modeling were conducted using Python 3.11.7 within the Scikit-learn library (Pedregosa et al., 2011).
3 Results
3.1 Data description
The soil organic carbon concentrations within each core in the training set had the same distribution and range (mean = 1.63, median = 0.83, max = 5.99, min = 0.16, std. dev. = 1.60), and the soil organic carbon values in the combined training and test set (mean = 1.62, median = 1.39, max = 7.66, min = 0.024, std. dev. = 1.70) were from a statistically similar distribution (Kolmogorov–Smirnov, p > 0.05); however, there were more extreme high values of the soil organic carbon concentrations in the test set (Figure 2).

Figure 2. Distribution of organic carbon (OC) in (A) 10-cm core sections of each of the eight training cores and (B) 10-cm core sections of all training cores vs 1-cm sections of the test core BE2.
A trend is also apparent between the reflectance and soil organic carbon concentration. The absolute correlation between the reflectance and soil organic carbon is highest in the spectral region of 2,000–2,200 nm, with average r values of 0.8 and 0.9 for the training and test sets, respectively (Figure 3).
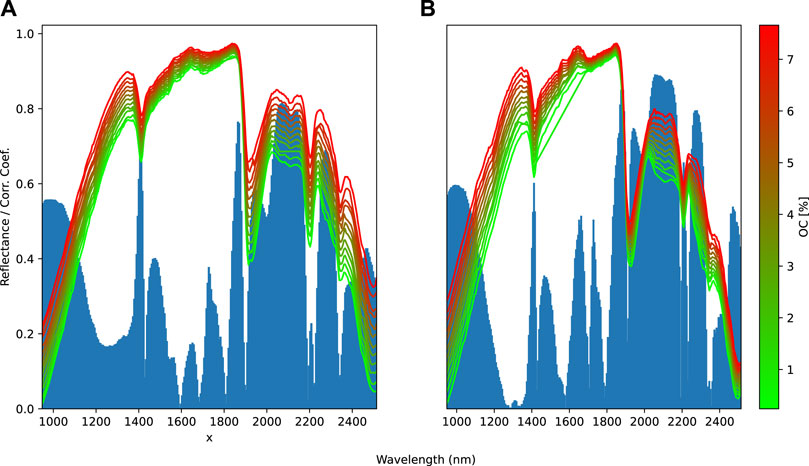
Figure 3. Reflectance, soil organic carbon content (green to red hue), and correlation coefficients (blue) of each spectral band with organic carbon (OC) concentrations averaged over 10 bins for the (A) training and (B) test sets.
The first four principal components (PCs) explain 95% of the variations in the spectral data. The data points tend to separate based on their soil types within the first three PCs, but these are not distinct enough to completely separate the soil types (Figure 4).
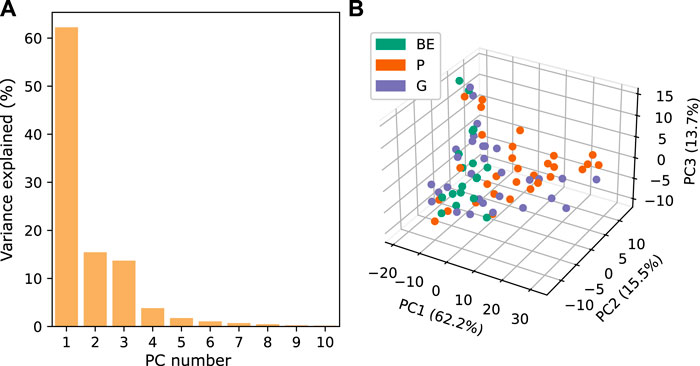
Figure 4. (A) Percentage of variance explained for each principal component (PC) and (B) 3D plot of the first three PCs for the median hyperspectral images obtained as 10-cm sections.
Each spectral band is highly correlated to its adjacent bands. This is highest for all adjacent bands with one step (r ∼ 1.0), but tends to decrease for correlations of four and sixteen steps between the bands, with average r values of 0.95 and 0.81, respectively (Figure 5). Thus, 16 was used as the batch size for the permutation importance.
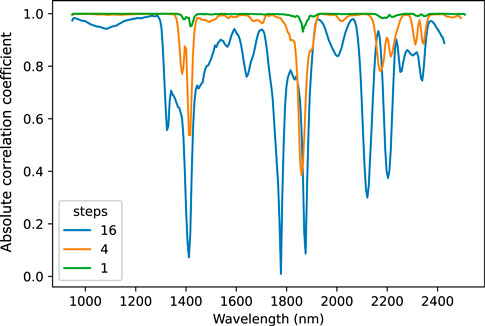
Figure 5. Correlation of each spectral band with its adjacent spectral band for 1, 4, or 16 steps.
3.2 Soil organic carbon model
The MLPR, PLSR, and SVR models performed almost similarly for cross-validation (R2 = 0.92, 0.92, and 0.91, respectively), but MLPR performed better than SVR that performed better than PLSR on the test set (R2 = 0.96, 0.86, and 0.81, in order), indicating that MLPR is a much stronger model for predicting upscaled responses (Table 1). PLSR and SVR specifically performed poorer in the lower and middle ranges of soil organic carbon concentrations compared to MLPR (Figure 6).
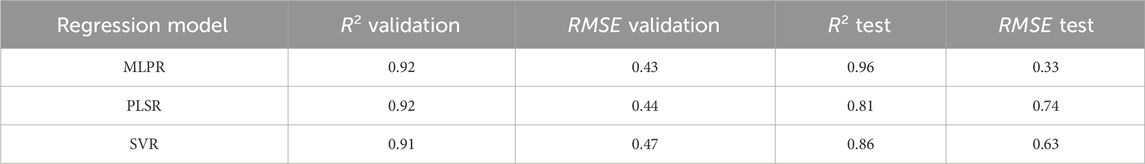
Table 1. Cross-validation and test performances of the multilayer perceptron regression (MLPR), partial least-squares regression (PLSR), and support vector regression (SVR) models. R2: coefficient of determination; RMSE: root mean-squared error.
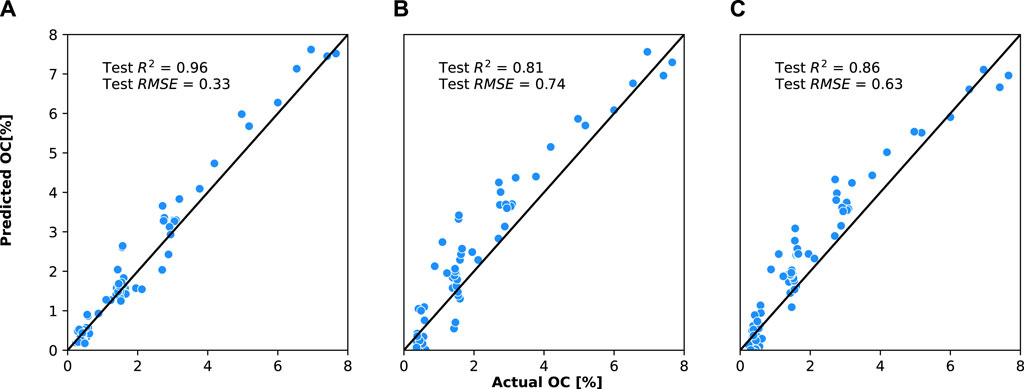
Figure 6. Actual vs predicted organic carbon values for the test set with the (A) multilayer perceptron regression (MLPR), (B) partial least-squares regression (PLSR), and (C) support vector regression (SVR) models.
The MLPR model showed the best cross-validation performance with 128 clusters of predictors, the rectified linear unit (ReLU) activation function, eight hidden layers, an initial learning rate of 0.1, and the limited-memory Broyden–Fletcher–Goldfarb–Shanno (LBFGS) solver. The PLSR model showed the best cross-validation performance with seven components. The SVR model showed the best cross-validation performance with 64 clusters of predictors, a linear kernel, a kernel coefficient of 0, and free parameters C and ϵ equal to 1 and 0.1, respectively.
The predicted soil organic carbon maps for the surface of the test core show that MLPR captures more details and that its median signal for each row follows that of the reference soil organic carbon more closely than PLSR and SVR; MLPR is also more robust to core-surface anomalies. Further, SVR is only slightly better than PLSR at handling core-surface anomalies (Figure 7).

Figure 7. (A) Test core-surface image with predicted 2D maps of organic carbon as well as median predictions (blue lines) and organic carbon references (red crosses) for each row for the (B,C) multilayer perceptron regression (MLPR), (D,E) partial least-squares regression (PLSR), and (F,G) support vector regression (SVR) models.
The permutation importance analysis shows that 950–1,150 nm was the most important region for MLPR even though no peaks were present here. The second, third, fourth, and fifth most important regions were around the peaks at ∼2,250, ∼2,200, ∼1,400, and ∼2,350 nm, respectively. For PLSR, the permutation importance region was around the peak at ∼2,350 nm, and the region around the peak at ∼1900 nm was the least important region. SVR showed almost the same pattern as PLSR, but with greater emphasis on the region around the peak at ∼2,350 nm. PLSR coefficients followed a similar pattern as MLPR permutation importances but did not correspond to the PLSR permutation importances. None of the four measures of predictor importance were correlated in the coefficients between the soil organic carbon and spectra, but the most important predictors for MLPR also had high correlations with the soil organic carbon, while some of the spectra having high correlations with the soil organic carbon were not as important for MLPR (Figure 8).
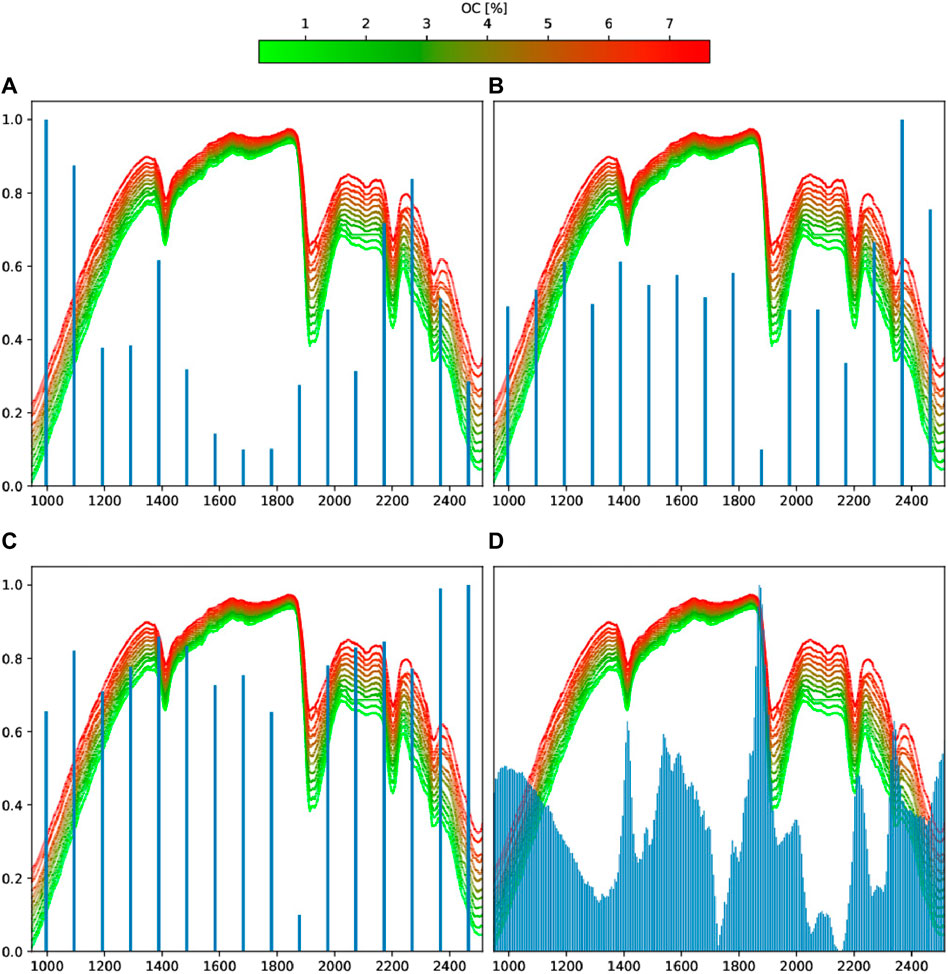
Figure 8. Permutation importance of each spectral cluster for the (A) multilayer perceptron regression (MLPR), (B) support vector regression (SVR), and (C) partial least-squares regression (PLSR) models as well as (D) PLSR coefficients against the average background reflectances (blue) over 10 bins for the training set.
4 Discussion
To the best of the authors’ knowledge, there are no studies on the predictive abilities of soil organic carbon models based on laboratory hyperspectral imaging with higher-resolution test sets; hence, the present study constitutes a pioneering effort to provide direct evidence that neural networks are effective at predicting higher-resolution soil organic carbon for soil core mapping. For the cross-validation performance, the ranges of soil organic carbon concentrations and sample sizes vary greatly between extant studies, but the validation R2 values range between 0.71 (Tahmasbian et al., 2018) (PLSR) to 0.94 (Sorenson et al., 2020) (neural network regression). In the present study, it is shown that predictions of higher ranges of soil organic carbon content are less accurate than those for lower ranges. This fact appears to be reflected in the differences between model performances in these studies. The median soil organic carbon contents for the six studies were approximately 7% (O’Rourke et al., 2011), 5% (Tahmasbian et al., 2018), 0.8% (current study), 0.5% (Sorenson et al., 2020), 0.4% (Xu et al., 2020), and 0.4% (Steffens and Buddenbaum, 2013), with validation R2 values of 0.75, 0.71, 0.92, 0.93, 0.98, and 0.97, respectively, clearly showing a pattern of worsening performance with increase in the median soil organic carbon content.
In terms of the cross-validation performances of different types of regression models, the current study could not establish any meaningful differences between PLSR and the other two non-linear models. However, Xu et al. (2020) noted a clear advantage with the non-linear methods (neural network, cubist, support vector, and Gaussian process regressions) over PLSR, with an average validation R2 of 0.90 for the non-linear methods vs R2 of 0.77 for PLSR; however, there were no meaningful differences between the performances of the non-linear methods themselves. Similarly, Steffens and Buddenbaum (2013) showed the advantage of SVR over PLSR, with R2 values of 0.97 and 0.81, respectively.
Upon visual inspection, the maps produced by Steffens and Buddenbaum (2013) show significant influences of surface anomalies like cracks and shadows on the predicted soil organic carbon. This is exacerbated in the SVR model compared to the PLSR model, even with a better validation R2 (0.97 vs 0.81), in contrast to the findings of the current study. However, this difference may only be attributable to the different soil morphologies and pretreatment regimes. Maps produced by the SVR model in Xu et al. (2020) were also influenced by geometric anomalies. On the other hand, maps reported by Sorenson et al. (2020) produced with a Bayesian regularized neural network suffered minimally from the major cracks on the surfaces of the cores. These findings, in addition to the results of the present study, show the superior abilities of neural networks in handling surface anomalies compared to PLSR and SVR.
The most important predictor region for the MLPR model was 950–1,150 nm. Although this region is usually associated with the chromophore activity of iron oxides (Hunt et al., 1971), it has been shown to be highly informative for soil organic matter chromophore activity (Beck, 1975). In fact, it was demonstrated that the increase in soil organic content decreases the overall reflectance signal from the 800–1,000 nm region to the extent of completely masking the signal of the iron oxides (Heller Pearlshtien and Ben-Dor, 2020). A similar pattern of decreased reflectance signal from this region through increased soil organic carbon content was observed in this work.
The adsorption peaks at 1,400, 1,900, and 2,200 nm that are important predictors of the MLPR model are often associated with soil moisture, but it has been shown that these peaks remain even for dried soil (Lesaignoux et al., 2013). In addition, the adsorption peak at 1,400 nm is known to be associated with metal-OH vibrations (Whiting et al., 2004) and soil clay content (Tümsavaş et al., 2019), while the adsorption peak at 2,200 nm is known to be associated with mineral hydroxyl (Moreira et al., 2014) and kalonite (Hunt and Salisbury, 1970). The adsorption peak at 1,900 nm is also known to be associated with montmorillonite, a 2:1 clay (Grove et al., 1992), but this peak did not hold the greatest importance for the MLPR model. In addition to these three peaks, the peak at 2,250 nm has high importance for the MLPR model and is associated not with the water content but the clay mineral kalonite (Clark et al., 1990). The peak at 2,350 nm that was important for MLPR and also the most important for SVR and PLSR has been known to be associated with clay minerals (Clark et al., 1990).
Based on the fact that soil clay mineralogy is highly correlated with soil organic carbon content (Torn et al., 1997), it appears that the MLPR model predicts soil organic carbon in accordance with the clay mineralogy learned from the peaks at 1,400, 1,900, 2,200, 2,250, and 2,350 nm, along with the soil organic matter chromophore activity in the 950–1,150 nm region. The PLSR coefficients followed a similar pattern, but the PLSR model itself is unable to generalize these importances to the test set, as demonstrated via the permutation importances. The advantage of the MLPR here is that it can retain these properties over a higher-resolution test set.
In conclusion, this study shows that MLPR is a more suitable regression model for estimating higher-resolution carbon content than PLSR or SVR and that it is more robust to anomalies on the soil surface. The MLPR model may possibly predict soil organic carbon content by learning the spectral features of the soil organic matter chromophore properties and clay mineralogy.
Data availability statement
The datasets presented in this study can be found in online repositories. The names of the repository/repositories and accession number(s) can be found below: 10.5281/zenodo.10708054.
Author contributions
SK: Writing–original draft, Visualization, Software, Methodology, Investigation, Formal analysis, Data curation, Conceptualization. SO: Writing–review and editing, Validation, Supervision, Resources, Project administration, Funding acquisition, Data curation, Conceptualization.
Funding
The author(s) declare that financial support was received for the research, authorship, and/or publication of this article. This work was supported by the Irish Research Council (grant number IRCLA/2017/137).
Conflict of interest
The authors declare that the research was conducted in the absence of any commercial or financial relationships that could be construed as a potential conflict of interest.
Publisher’s note
All claims expressed in this article are solely those of the authors and do not necessarily represent those of their affiliated organizations or those of the publisher, editors, and reviewers. Any product that may be evaluated in this article or claim that may be made by its manufacturer is not guaranteed or endorsed by the publisher.
References
Altmann, A., Toloşi, L., Sander, O., and Lengauer, T. (2010). Permutation importance: a corrected feature importance measure. Bioinformatics 26, 1340–1347. doi:10.1093/bioinformatics/btq134
Awad, M., and Khanna, R. (2015). Support vector regression. Berkeley, CA: Apress, 67–80. doi:10.1007/978-1-4302-5990-9/TNQDotTNQ/4
Beck, R. H. (1975). Spectral characteristics of soils related to the interaction of soil moisture, organic carbon, and clay content. LARS Tech. Rep., 100.
Benitez, J., Castro, J., and Requena, I. (1997). Are artificial neural networks black boxes? IEEE Trans. Neural Netw. 8, 1156–1164. doi:10.1109/72.623216
Clark, R. N., King, T. V. V., Klejwa, M., Swayze, G. A., and Vergo, N. (1990). High spectral resolution reflectance spectroscopy of minerals. J. Geophys. Res. Solid Earth 95, 12653–12680. doi:10.1029/JB095iB08p12653
Collins, W., and James Finbarr, B. (1970). Soils of lyons estate celbridge, Co. Kildare. Dublin: Soil Science Department, University College Dublin: University College Dublin, Farm.
Esquerre, C., Gowen, A., Burger, J., Downey, G., and O’Donnell, C. (2012). Suppressing sample morphology effects in near infrared spectral imaging using chemometric data pre-treatments. Chemom. Intelligent Laboratory Syst. 117, 129–137. doi:10.1016/j.chemolab.2012.02.006
Geladi, P., and Kowalski, B. R. (1986). Partial least-squares regression: a tutorial. Anal. Chim. Acta 185, 1–17. doi:10.1016/0003-2670(86)80028-9
Grove, C. I., Hook, S. J., and Paylor, E. D. I. (1992). Laboratory reflectance spectra of 160 minerals, 0.4 to 2.5 micrometers. 2014/40148.
Hartigan, J. A., and Wong, M. A. (1979). Algorithm as 136: a k-means clustering algorithm. J. R. Stat. Soc. Ser. C Appl. Statistics 28, 100–108. doi:10.2307/2346830
Heller Pearlshtien, D., and Ben-Dor, E. (2020). Effect of organic matter content on the spectral signature of iron oxides across the vis–nir spectral region in artificial mixtures: an example from a red soil from Israel. Remote Sens. 12, 1960. doi:10.3390/rs12121960
Hunt, G. R., Salisbury, J. W., and Lenhoff, C. J. (1971). Visible and near-infrared spectra of minerals and racks--III. Oxides and hydroxides. Mod. Geo. 2, 195–205.
Hunt, I., and Salisbury, J. W. (1970). Visible and near-infrared spectra of minerals and rocks--I. Silicate minerals. Mod. Geo. 2, 283–300.
Kubat, M. (2021). Similarities: nearest-neighbor classifiers. Cham: Springer International Publishing, 41–64. doi:10.1007/978-3-030-81935-4_3
Lalor, S., and University College, H.Dublin. Department of Crop Science, and Forestry (2004). Soils of UCD research Farm, lyons estate, celbridge, Co. Kildare. M. Agr. Sc. Thesis. Dublin, Ireland: University College Dublin.
Lesaignoux, A., Fabre, S., and Briottet, X. (2013). Influence of soil moisture content on spectral reflectance of bare soils in the 0.4-14 μm domain. Int. J. Remote Sens. 34, 2268–2285. doi:10.1080/01431161.2012.743693
Meyer, H., Reudenbach, C., Wöllauer, S., and Nauss, T. (2019). Importance of spatial predictor variable selection in machine learning applications – moving from data reproduction to spatial prediction. Ecol. Model. 411, 108815. doi:10.1016/j.ecolmodel.2019.108815
Molnar, C., König, G., Herbinger, J., Freiesleben, T., Dandl, S., Scholbeck, C. A., et al. (2022). General pitfalls of model-agnostic interpretation methods for machine learning models. Cham: Springer International Publishing, 39–68. doi:10.1007/978-3-031-04083-2_4
Moreira, L. C. J., Dos Santos Teixeira, A., and Galvão, L. S. (2014). Laboratory salinization of brazilian alluvial soils and the spectral effects of gypsum. Remote Sens. 6, 2647–2663. doi:10.3390/rs6042647
Murtagh, F. (1991). Multilayer perceptrons for classification and regression. Neurocomputing 2, 183–197. doi:10.1016/0925-2312(91)90023-5
Nawal, M., Shekar, B., and Jaiswal, P. (2023). Integration of sparse and continuous data sets using machine learning for core mineralogy interpretation. Lead. Edge 42, 421–432. doi:10.1190/tle42060421.1
Nicodemus, K. K., Malley, J. D., Strobl, C., and Ziegler, A. (2010). The behaviour of random forest permutation-based variable importance measures under predictor correlation. BMC Bioinforma. 11, 110. doi:10.1186/1471-2105-11-110
Olson, M., Wyner, A., and Berk, R. (2018). “Modern neural networks generalize on small data sets,”. Advances in neural information processing systems. Editors S. Bengio, H. Wallach, H. Larochelle, K. Grauman, N. Cesa-Bianchi, and R. Garnett (Red Hook, New York: Curran Associates, Inc.), 31.
O’Rourke, S. M., Angers, D. A., Holden, N. M., and McBratney, A. B. (2015). Soil organic carbon across scales. Glob. Change Biol. 21, 3561–3574. doi:10.1111/gcb.12959
O’Rourke, S. M., Argentati, I., and Holden, N. M. (2011). The effect of region of interest size on model calibration for soil organic carbon prediction from hyperspectral images of prepared soils. J. Near Infrared Spectrosc. 19, 161–170. doi:10.1255/jnirs.930
Pedregosa, F., Varoquaux, G., Gramfort, A., Michel, V., Thirion, B., Grisel, O., et al. (2011). Scikit-learn: machine learning in Python. J. Mach. Learn. Res. 12, 2825–2830.
Sorenson, P., Quideau, S., Rivard, B., and Dyck, M. (2020). Distribution mapping of soil profile carbon and nitrogen with laboratory imaging spectroscopy. Geoderma 359, 113982. doi:10.1016/j.geoderma.2019.113982
Steffens, M., and Buddenbaum, H. (2013). Laboratory imaging spectroscopy of a stagnic luvisol profile — high resolution soil characterisation, classification and mapping of elemental concentrations. Geoderma 195-196, 122–132. doi:10.1016/j.geoderma.2012.11.011
Tahmasbian, I., Xu, Z., Boyd, S., Zhou, J., Esmaeilani, R., Che, R., et al. (2018). Laboratory-based hyperspectral image analysis for predicting soil carbon, nitrogen and their isotopic compositions. Geoderma 330, 254–263. doi:10.1016/j.geoderma.2018.06.008
Torn, M. S., Trumbore, S. E., Chadwick, O. A., Vitousek, P. M., and Hendricks, D. M. (1997). Mineral control of soil organic carbon storage and turnover. Nature 389, 170–173. doi:10.1038/38260
Tümsavaş, Z., Tekin, Y., Ulusoy, Y., and Mouazen, A. M. (2019). Prediction and mapping of soil clay and sand contents using visible and near-infrared spectroscopy. Biosyst. Eng. 177, 90–100. doi:10.1016/j.biosystemseng.2018.06.008
Whiting, M. L., Li, L., and Ustin, S. L. (2004). Predicting water content using Gaussian model on soil spectra. Remote Sens. Environ. 89, 535–552. doi:10.1016/j.rse.2003.11.009
Xu, R.-F., and Lee, S.-J. (2015). Dimensionality reduction by feature clustering for regression problems. Inf. Sci. 299, 42–57. doi:10.1016/j.ins.2014.12.003
Xu, S., Wang, M., and Shi, X. (2020). Hyperspectral imaging for high-resolution mapping of soil carbon fractions in intact paddy soil profiles with multivariate techniques and variable selection. Geoderma 370, 114358. doi:10.1016/j.geoderma.2020.114358
Keywords: hyperspectral imaging, soil organic carbon modeling, soil core, grassland soil organic carbon, neural network modeling, pedometrics, high resolution
Citation: Kabiri S and O’Rourke SM (2024) Coarse to superfine: can hyperspectral soil organic carbon models predict higher-resolution information?. Front. Environ. Sci. 12:1392469. doi: 10.3389/fenvs.2024.1392469
Received: 27 February 2024; Accepted: 20 May 2024;
Published: 08 July 2024.
Edited by:
Chamindra L Vithana, Southern Cross University, AustraliaReviewed by:
Martha Negassa, Ethiopian Forestry Development Addis Ababa, EthiopiaJianping Qian, Chinese Academy of Agricultural Sciences (CAAS), China
Copyright © 2024 Kabiri and O’Rourke. This is an open-access article distributed under the terms of the Creative Commons Attribution License (CC BY). The use, distribution or reproduction in other forums is permitted, provided the original author(s) and the copyright owner(s) are credited and that the original publication in this journal is cited, in accordance with accepted academic practice. No use, distribution or reproduction is permitted which does not comply with these terms.
*Correspondence: Shayan Kabiri, c2hheWFuLmthYmlyaUB1Y2Rjb25uZWN0Lmll