 Lei Wang
 Na Wang1,2
 Dan Wei
 Yan Li
 Liang Jin
94% of researchers rate our articles as excellent or good
Learn more about the work of our research integrity team to safeguard the quality of each article we publish.
Find out more
ORIGINAL RESEARCH article
Front. Environ. Sci. , 06 June 2024
Sec. Environmental Informatics and Remote Sensing
Volume 12 - 2024 | https://doi.org/10.3389/fenvs.2024.1388058
This article is part of the Research Topic Remote Sensing in Ecological Environments: Innovations and Achievements View all 8 articles
Introduction: Land use land cover (LULC) change is an important factor driving global change, influenced by the interaction between human activities and natural ecosystems. The upper watershed of the Qingshui River is adversely affected due to anthropogenic activities. Therefore, analyzing the driving factors of land use changes in this area is crucial for ecological protection and sustainable development.
Methods: Based on the long-term Landsat image data from 1990–2020, the spatiotemporal change characteristics of the LULC rate and its driving factors in the upper watershed of the Qingshui River basin were analyzed using the land use transfer matrix and dynamic degree of land use processes. The redundancy analysis was performed to investigate the links between LULC changes, socio-economic and climatic variables.
Results: From 1990–2020, the area under waters and woodland decreased by −2.94 km2 and −451.44 km2, respectively. Meanwhile, grassland, arable land, construction land, and unused land area increased by 278.71 km2, 115.72 km2, 46.48 km2 and 13.49 km2. In terms of the proportion area to the total land (2334.10 km2), woodland accounted for 63.43–44.09% of the total land and was mainly distributed in the east; arable land was 17.00–21.96% and was largely distributed on both sides of the middle and lower parts of the basin; construction land comprised 1.03–3.02% and was generally found in flat areas near the downstream and water area was only 0.1–0.01% which primarily covered the Qingshui River and its tributaries from 1990–2020. Construction and unused lands showed the fastest rate of change, followed by water area and grasslands. Accelerated urbanization, rapid socio-economic development, and the farmland-to-forest policy were the main driving forces behind the change in LULC in the upper reaches of the Qingshui River.
Discussion: The findings of this study can assist in planning strong management strategies for ecological protection and socio-economic sustainable development in the study area.
The land use land cover (LULC) changes are driven by both local anthropogenic activities and natural factors. LULC changes are dynamic and non-linear human-nature interactions that cause major land surface transformations from one land use type to another (Fu and Zhang, 2020). During the past 300 years, the global LULC change trajectory has been characterized by advances in agriculture and losses in forests (Mmbaga et al., 2017). Mainly due to the conversion of forest areas into agricultural land and urbanization (Leta et al., 2021). Thus, it has been identified as a driver of global environmental change (Guder et al., 2022). In the 1990s, the International Geosphere and Biosphere Program (IGBP) and the Human Factors Program for Global Environmental Change (IHDP) were established. In 1995, they jointly put forward the growing concern of LULC (Moro et al., 2022). The study on LULC change and its drivers is gaining scope worldwide (Vu et al., 2022).
To understand the LULC dynamics, it is important to identify the LULC triggering factors with the location over time (Leta et al., 2021). Currently, there are two main categories used to analyze the factors that influence LULC change: qualitative and quantitative. The qualitative analysis method is limited to analyzing the effects of different influencing factors on LULC change. It cannot quantitatively express the degree to which different factors impact LULC change (Cui et al., 2022). Even if the quantitative method can clarify the degree to which different influencing factors drive land use change. Both approaches ignore the relationship between influencing variables and land use change in spatial location (Li et al., 2020). So, it is challenging to precisely examine their inherent mechanism of change potential. The geographic detector is a statistical technique that identifies driving factors and detects spatial distinction based on statistical principles (Fan et al., 2020). This approach can represent the interaction between two influencing elements and quantitively analyze the degree to which each driving factor influences the independent variable based on their spatial relationship (Han et al., 2021). Within the field of LULC, pertinent researchers have employed geographic detectors to carry out in-depth investigations and analyses about the variables that influence changes in a specific LULC type, such as changes in vegetation cover and urban growth (Cui et el., 2022).
Rapid economic development and urbanization largely changed China’s LULC pattern. Various anthropogenic land uses have changed the spatial patterns of natural ecosystems in most regions. In some regions, land use change patterns are disturbing the natural system, leading to serious ecological and environmental problems (Yang et al., 2020). China’s vast territory and large population indicate the importance of LULC research throughout the country. Previous research studies have shown that all land use types have undergone changes in the past 25 years in different regions in China. Liang (2017) investigated the biodiversity changes caused by LULC in Zhangye, China. Li and Wang (2021) studied the LULC change in the Yanhe River basin using the data from 1980 to 2005 and found that the number of forest and farmland areas changed greatly. Abbas et al. (2021) analyzed the relationship between LULC changes and their drivers in the Greater Bay Area of China and found that urbanization, transportation infrastructure, and agricultural practices were the primary drivers of LULC changes in the region. Kong and Tian (2020) studied the Beijing-Tianjin-Hebei region, and Shen et al. (2019) investigated the relationship between LULC changes and their driving forces in the Yangtze River Delta region.
The upper watershed area of the Qingshui River basin in the Chongli district, Zhangjiakou City of Hebei Province, China, is known for its scenic natural landscape and is characterized by mountainous terrain, forests, grasslands and agricultural land. As one of the host cities of the 2022 winter Olympics, the Chongli district has undergone rapid economic development. The large-scale development and utilization of water and land resources have changed the spatial and temporal distribution of the local land type and had undefined impacts on the ecological environment (He et al., 2022; Du, et al., 2024). Therefore, monitoring LULC change and its driving factor is important for future planning and sustainable development in the area (Duan et al., 2023). Analyzing the spatial and temporal land use change characteristics in the upper watershed area of the Qingshui River is an important and innovative topic. However, research work is still limited, particularly focusing on this study area. This study aims to quantitatively analyze the spatiotemporal change characteristics of land use types and their driving factors in the upper watershed area of the Qingshui River basin from 1990–2020 based on 10-year intervals. By examining changes in LULC over the last 30 years, we identified the driving factors of LULC, including population growth, economic development and policies. The information can support land use planning and management decisions that promote sustainable development and conservation of natural resources.
The upper watershed area of the Qingshui River basin is in the Chongli district, Zhangjiakou City of Hebei Province, China, within coordinates of 40°46–41°17′N and 114°27–115°30′E. The area covers about 2334.1 km2 (Figure 1). The river got its name from the southern foot of the Huapi Ridge Scenic Area, which is around 2157 m above sea level and also known as “Zitian Mountain.” The river begins at the foot of the mountain and flows down, joining the gurgling springs that run out from the ditches on both sides. It has traditionally been a source of water for residents of the Chongli district (Zhang et al., 2021). Because mountains surround the Chongli district and have a high altitude, the annual average temperature is very low (3.3°C). Rainfall mainly occurs in the rainy season from June to September, accounting for ∼70% of the whole year (He et al., 2022). The study area is known for its scenic natural landscape and is characterized by mountainous terrain, forests, grasslands, and agricultural land. The district has been developing rapidly recently, focusing on winter sports and tourism infrastructure. As of 2020, the population of the Chongli district was ∼85,000 people (Liu et al., 2017). In addition, the district has invested in its transportation infrastructure, including the high-speed railway line connecting Zhangjiakou and Beijing, which passes through the Chongli district. This has not only facilitated the district’s development and urbanization but also improved connectivity and accessibility for residents and visitors (Liu et al., 2015).
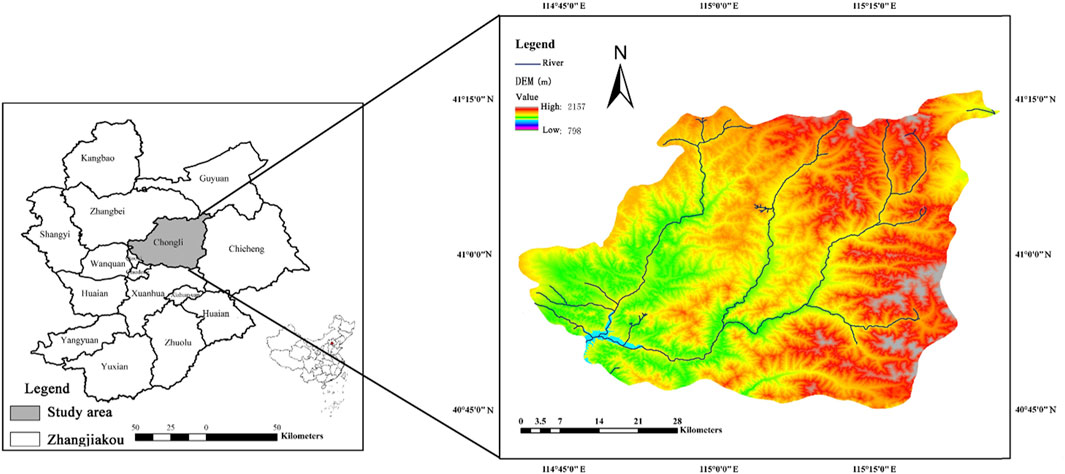
Figure 1. The geographical location with digital elevation model (DEM) of the study site upper watershed area of the Qingshui River basin in the Chongli district, Zhangjiakou City of Hebei province, China.
The research data mainly includes Landsat data downloaded from the geospatial data cloud (www.gscloud.cn) with 10-year intervals from 1990–2020 at a resolution of 30 m (Table 1). The data were retrieved from May to June 2022. The digital elevation model (DEM) was taken from the Data Center for Cold and Dry Regions of the Chinese Academy of Sciences. The meteorological data and socio-economic data were obtained from the statistical bulletin and yearbook of Zhangjiakou City, Hebei Province, China. To avoid cloud interferences, <10% of all images were captured using sensors onboard the Landsat 5, 7, and 8. The preferred images downloading times were the months of July and August because these images experienced minimal effects from vegetation cover or snowfall in the study region (Wang et al., 2021). Further, the changes seen by Landsat generally correlated with changes in land use patterns and realistic environmental conditions. To perform radiometric calibrations and atmospheric correction, which can improve data quality, the Fast Line-of-sight Atmospheric Analysis of Hypercubes (FLAASH) algorithm was adopted. This algorithm was created by Exelis Visual Information Solutions Inc., Boulder, CO, USA (Cooley, 2002).
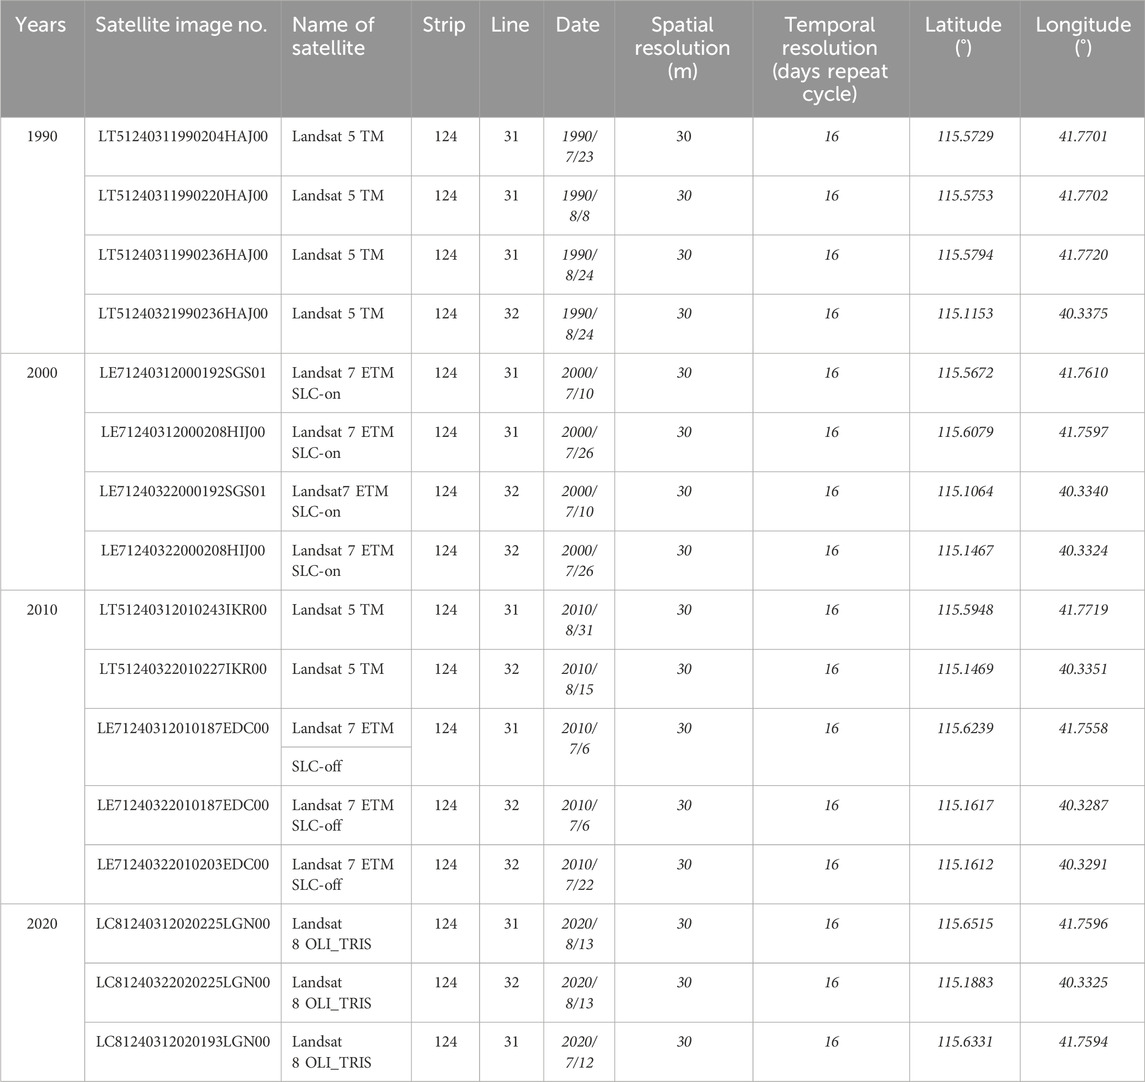
Table 1. Satellite images and their information.
The maximum likelihood classification algorithm is used to classify the different land use types through a supervised classification technique (Shahid et al., 2018). Maximum likelihood classification is a popular technique used in Geographic Information Systems (GIS) to classify remote sensing data. It is based on the assumption that the spectral signature of each class follows a normal distribution. Maximum likelihood classification aims to find the most likely class for each pixel based on the probability that the pixel belongs to each class (Lilles et al., 2015). Also, the chord diagram was used to visualize the land use change trajectory in the upper watershed of the Qingshui River from 1990–2020, using different types of connections and intensities indicated by color and line thickness.
Table 2 shows the number of Ground truth points (GTP) generated from each land use type in 1990, 2000, 2010, and 2020. To confirm the correctness of all these GTPs, Google Earth was used for ground verification in the study area (Laghari et al., 2023). The GTP was selected among image samples using a confusion matrix generated by analyzing the land cover transfer matrix of all classified images in ArcMap 10.2. Several measures, including Producer Accuracy (PA), User Accuracy (UA) and Overall Accuracy (OA), have been employed throughout this process to evaluate land use classification accuracy. In the fields of remote sensing (RS) and geographical information systems (GIS), accuracy assessment is an important component in assessing the performance of classification algorithms and image interpretation. Accuracy assessment includes comparing the results of a classification or interpretation process with reference data to determine the correctness of the generated output.
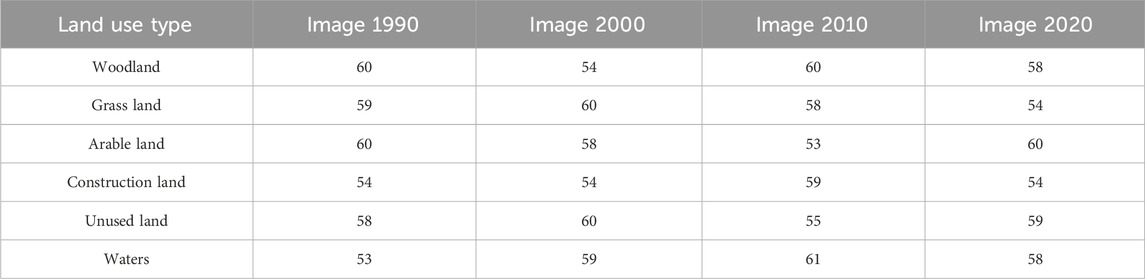
Table 2. Ground Truth Points (GTP) were taken from each Landsat image to represent each land use category. The number values inside the table indicate the year that the datasets were retrieved.
Overall Accuracy is a measure of the total correctness of the classification or interpretation results. It denotes the percentage of correctly classified or interpreted pixels or objects over the entire dataset (Qu et al., 2021). Producer Accuracy, also known as the commission or omission error, quantifies the probability that a reference class is correctly identified in the classification or interpretation. It measures the accuracy from the perspective of the algorithm or interpreter (Bouaziz et al., 2017). User Accuracy, also known as the User’s Error, denotes the probability that a pixel or object classified or interpreted as a specific class is indeed that reference class. It reflects the accuracy from the perspective of the user of the classification or interpretation results (Qu et al., 2021).
The accuracy of all metrics was more than 90%. The highest OA was 97.39% in 2000. These results illustrate the accuracy of land type classification and identification over time. They validate the reliable performance of the classification model or user in correctly allocating land types based on the specified metrics. Overall, the accuracy rates across the years were consistently high, showing an effective and reliable process of classifying and identifying different land types (Table 3).
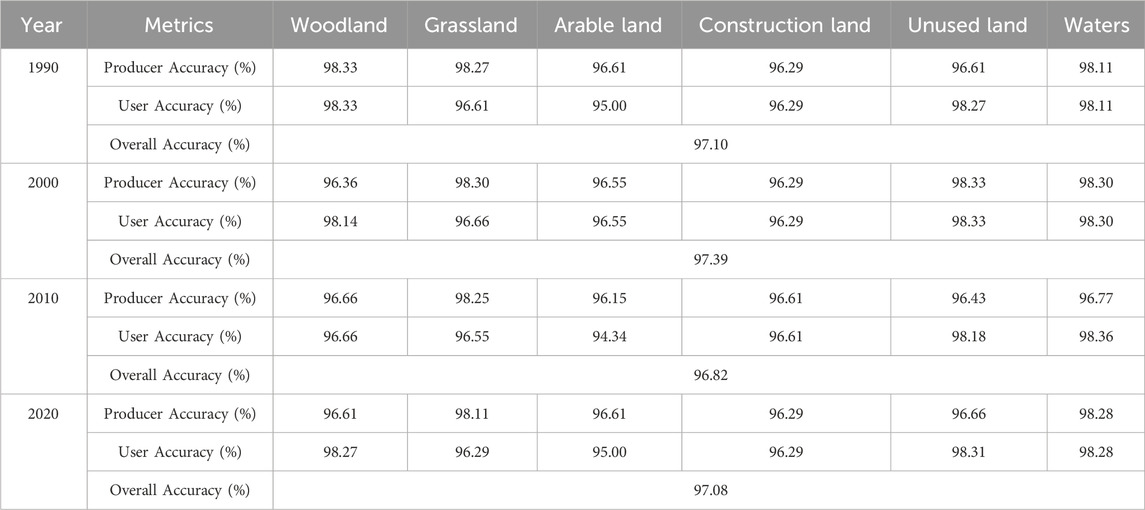
Table 3. Based on chosen Ground Truth Points (GTP) from Landsat images accuracy assessments of recovered LULC change maps for 1990, 2000, 2010 and 2020, respectively.
The land cover transfer matrix is frequently utilized to describe the structure and direction of the dynamic change in land cover. From the beginning to the end of a particular time, it describes the area-by-area transitions between the various land cover categories in a particular area (Zhao et al., 2020). It contains information not only on the static area of a land type at a specific time in the region but also on the types of land use changes to other LULC types or the transformation of original LULC types to new LULC types (Liping et al., 2018). GIS was used to determine the land use change, followed by analyzing the obtained data using MATLAB software for statistical and quantitative analysis of the change direction of each land use type (Zhao et al., 2020). The mathematical expression of the transfer matrix is expressed below:
Where S denotes the area, n denotes the number of transferred LULC types, and m and j denote the LULC types at the beginning and end of the study, respectively. The area of the first type that was transformed into all other types, including itself, is shown in the first row, with the other rows having the same meaning for their respective types. The area of all other types, including the first type transformed into the first type, is shown in the first column, while the same is shown in the other columns for their particular types. The matrix’s terms on the diagonal line point towards a fixed value.
The land uses dynamic degree is a popular framework for analyzing the temporal change among land categories. It averages the measurements from all categories and evaluates the annual net change for each category (Huang et al., 2018). It represents the annual variation rate of the land use type area, which is an important indicator of land use change. It is used to assess the change rates of land use types quantitatively and anticipate the future land use change trend. Therefore, it refers to the change rate of land use types in the study area during a time interval (Mohamed and Worku, 2019).) and is calculated according to the following formula:
Where S is the dynamic degree of a certain land use type in the 10-year time interval; Sa is the initial area of a land use type change; Sa is the end of the change of a certain land use type; t represents the study period; A positive S value indicates an increase, whereas a negative S value indicates a decrease.
Redundancy analysis (RDA) can investigate the link between two tables of variables, Y and X. It is a non-symmetric method, whereas canonical correlation analysis is symmetric. In RDA, the components retrieved from X were chosen to ensure that they are as closely connected to the variables of Y as possible. The components of Y were then extracted so that they were closely connected to the components of X as much as possible (Capblancq and Forester, 2021). RDA helps improve the authenticity of results through multiple analyses and is often used to study the response relationship between the microbial community and its living environment. In this paper, the land use type of the study area was regarded as the community, whereas the social, climatic, and other factors of the study area were viewed as the environmental factors, and the correlation between them was analyzed (Zhang et al., 2021). A three-order diagram represents the analyzed data.
Figure 2 shows the Chonglin forest, which was mainly distributed on the east bank of the upper reaches of the Qingshui River basin. However, the grasslands were mainly distributed on the west slopes. Furthermore, arable land was mainly distributed across both banks of the middle and lower reaches of the upper Qingshui River basin, and there was also a small area in the middle and upper reaches. Although there was a small area of constructed land in the flat areas of the upper and middle reaches, it was mainly found concentrated in the flat areas of the lower reaches and close to the water. The source of the water area was mainly the Qingshui River and its tributaries. The unused land (vacant area without any buildings and public utilities, etc.) was relatively small and distributed around the constructed land. Figure 3 shows that although woodland had the highest coverage (44.09%–63.43%), it showed a decreasing trend overall. The second position was taken by the grassland and arable lands, which accounted for 18.15%–30.09% and 17.00%–21.96%, respectively, with an overall increasing trend. Despite there being a relatively small proportion of construction land (1.03%–3.02%) and unused land (0.26%–0.83%), both showed an upward trend. Finally, the water area had the lowest proportion (0.01%–0.13%) and showed a decreasing trend from 1990–2020.
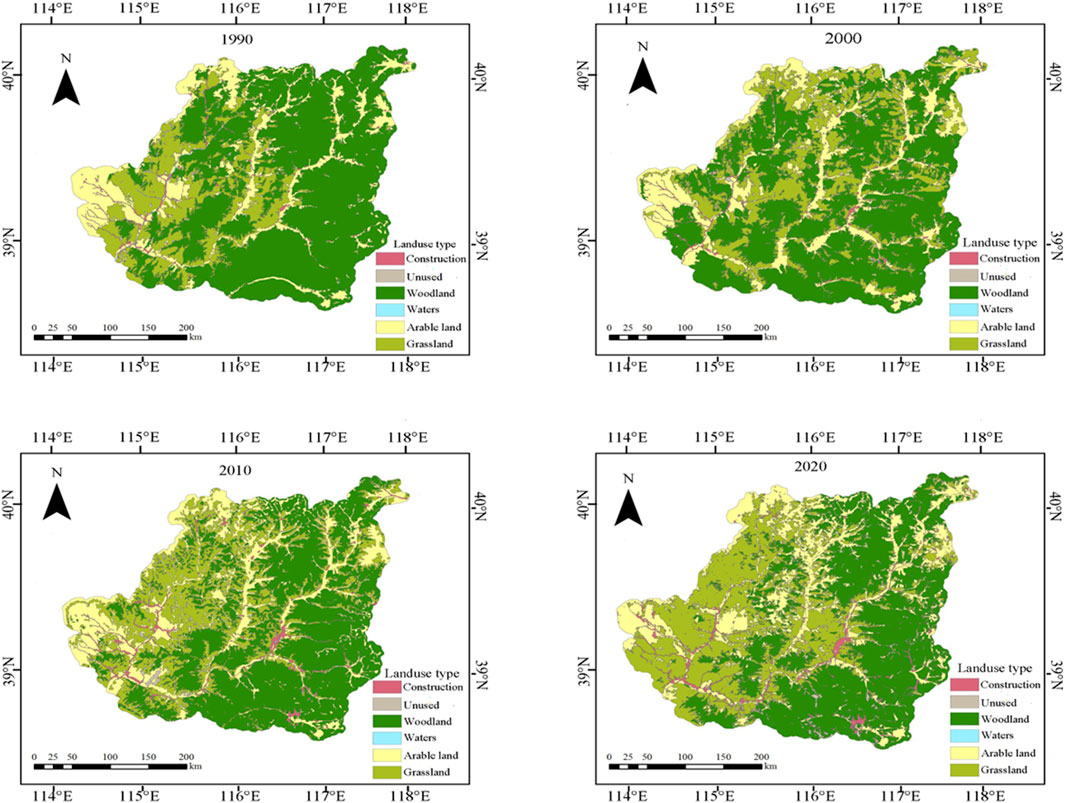
Figure 2. Land use type changes in the upper watershed of the Qingshui River from 1990 to 2020.
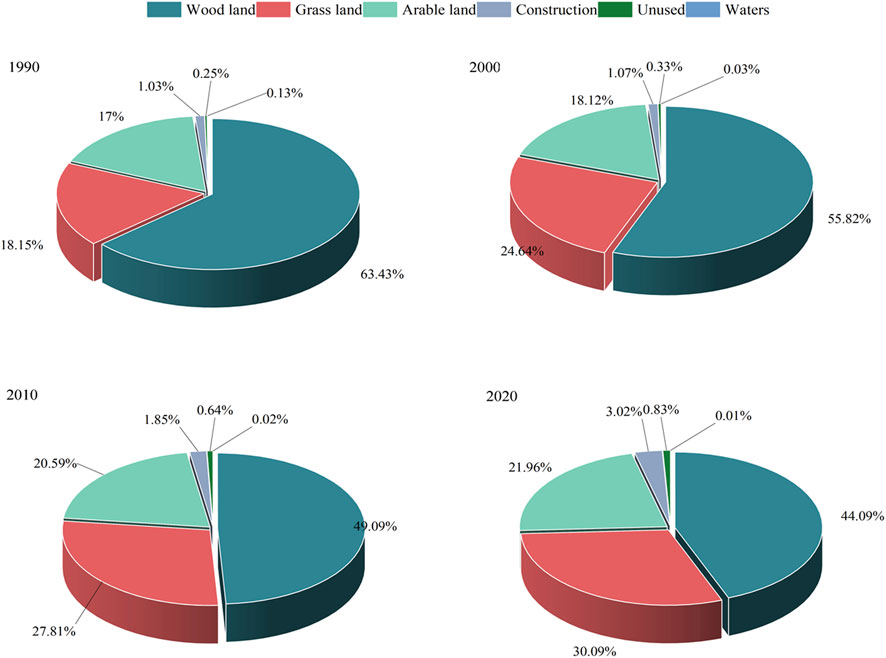
Figure 3. Land use type quantity changes in the upper watershed of the Qingshui River from 1990 to 2020.
Figure 4 shows the dynamic degree of land use of the various land use types in the upper reaches of the Qingshui River every 10-year interval, thereby showing the change rate of different land use types. From 1990–2020, the construction land, residential area, and unused land changed the fastest, reaching 23.22% and 19.31%, respectively, thus belonging to the first level. The second level comprised the water area and grassland, with 9.48% and 6.58% change rates, respectively. Finally, the third level, comprising both cultivated and woodland, had the lowest change rates of 2.92% and 3.05%, respectively. From 1990–2020, the rate of change in woodland, arable land, construction land, and unused land showed a trend of initially increasing and then decreasing. Contrastingly, the water area showed a fluctuating trend of both decreasing and increasing. This could be attributed to the effects of climate change, including the effect of rainfall on river flow. However, the grassland showed an ever-decreasing trend, with the rate of change decreasing from 3.57% to 0.82%. The rate of change for construction land and residential areas increased largely from 0.39% to 6.38%, whereas the rates of change for woodland and arable land only increased slightly from 1.02% to 1.2% and from 0.66% to 1.36%, respectively. However, the rate of unused land change sharply increased from 2000 to 2010, i.e., rising from 3.06% to 9.63%, followed by a decrease of 2.95% in the next 10 years. Finally, the water area also decreased rapidly from 1990 to 2000, with a change rate of 8.06%. Although its change rate was 2.33% from 2000–2010, it then sharply decreased with a change rate of 6.52%.

Figure 4. Rate of change of various land use types in the upper River basin.
Table 4 shows the land transfer matrix of the Qingshui River basin in Zhangjiakou from 1990–2020. From 1990–2020, 511.55 km2 of woodland was converted to other land use types, while only 92.26 km2 was converted from other land use types to woodland. Overall, the reduction in woodland area far exceeded as compared to its increase. The reduced area was mainly converted into grassland and farmlands, with a small part being converted into construction and unused land. From 1990–2020, 151.06 km2 of arable land was converted into other land use types, while 246.77 km2 was converted from other land use types to woodland, thus showing an overall increasing trend. The increased arable land is mainly attributed to the reduced woodland, with a part of it being shared with grassland and construction land. The increase in grassland area was mainly caused by the conversion of forests and arable land. In the same period, 122.99 km2 of grassland were converted to other land use types, while 396.78 km2 were converted from other land use types to grassland, indicating an overall increasing trend. The increase in grassland mainly came from the conversion of forested land, with a smaller portion coming from the conversion of cultivated and construction land. In terms of construction land, 15.82 km2 of construction land was converted to other land use types, whereas 56.97 km2 was converted from other land use types to woodland, which showed a substantial upward trend. The reduced construction land was mainly occupied by grassland and arable land, with some converted into woodland. This increase comes from the conversion of arable land and partly from grassland. Woodland was the main land use type converted into unused land, with arable land being the main land use type converted into the water area. Therefore, both land use types show an increasing trend. Figure 5 shows detailed trend changes in the land use types in the upper Qingshui River basin every decade from 1990–2020. From the land use type transformation trend, the mutual transformation between the different land use types from 1990–2000 was dominated by woodland and then mainly shifted to grassland, followed by arable land. Furthermore, from 2000–2010 and from 2010–2020, mainly woodland and grassland remained the decreasing land use types, followed by arable land. The proportion of land use change during 1990–2000, 2000–2010, and 2010–2020 was 33.38%, 32.51%, and 10.02%, respectively, with the total area of land use change being 779.03, 758.80, and 233.95 km2. In these three intervals, the total area of land use change decreased with increasing time, thus indicating that the intensity of land use change showed a downward trend over time, with the lowest intensity being from 2010–2020.
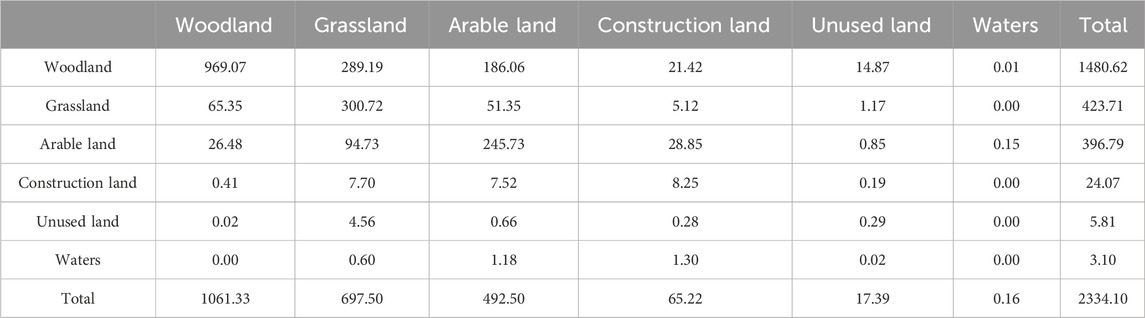
Table 4. Land use transfer matrix from 1990 to 2020 (km2).
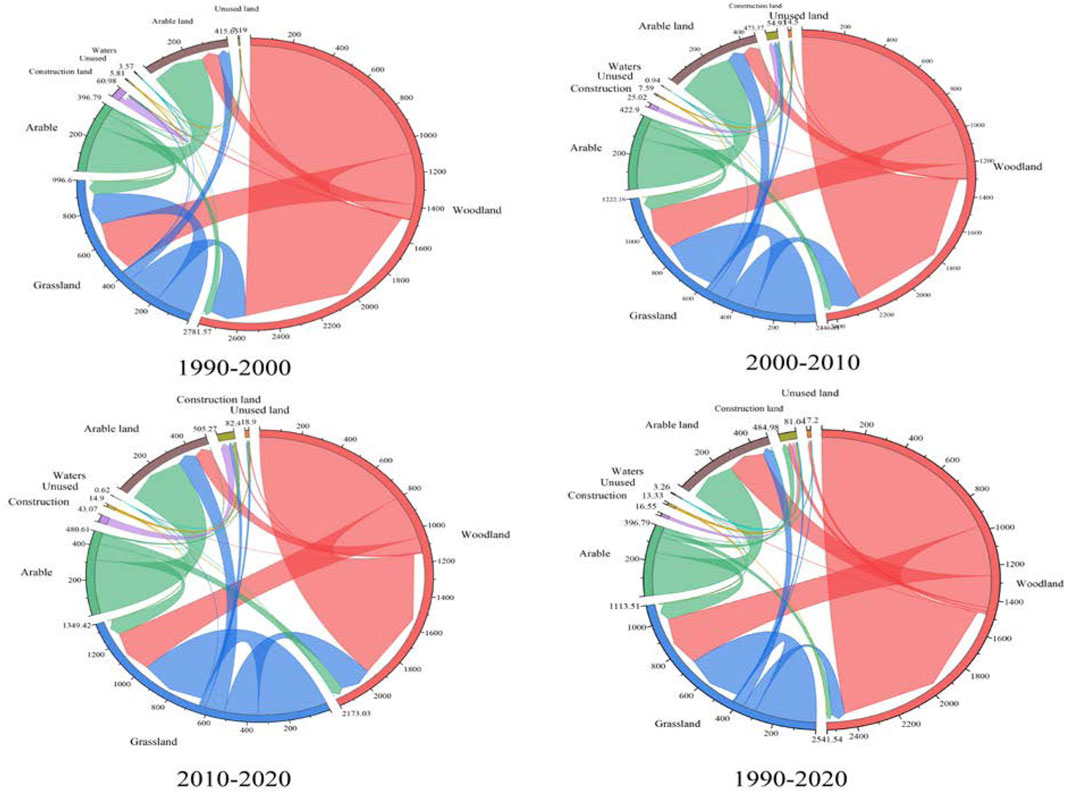
Figure 5. Land use change in the upper watershed of the Qingshui River from 1990 to 2020.
Table 5 shows the socio-economic and meteorological data of the upper reaches of the Qingshui River. Although it shows that the population of the upper reaches increased every 05-year interval from 1990 to 2020, the growth rate remained relatively slow. The gross domestic product (GDP) increased rapidly from 1990–2020, especially from 2010–2015. The secondary industry had the largest output from the overall perspective of the three industries in the past 30 years. In contrast, the tertiary industry output grew the fastest and exceeded in 2020 compared to the secondary industry, indicating that the overall economy of the upper reaches of the Qingshui River basin began shifting towards the upper- and middle-income levels. Especially after the successful bid for the 2015 winter Olympic Games, the tertiary industry grew rapidly, reflecting the high degree of local urbanization. The temperature in the upper reaches of the Qingshui River basin showed an overall upward trend from 1990–2010, with the average increasing from 3.6°C in 1990°C to 4.6°C in 2015 and then falling to 3.2°C in 2020. For the annual average precipitation, the range of change was large, with an average of 300–700 mm. The relationship between the land use type and environmental variables is shown by the RDA three-order diagram (Figure 6), where the characteristic values of axis one and axis two were 0.9937 and 0.0058, respectively. The population and construction land, unused land, arable land, and grassland were positively correlated. The policy of returning farmland to forests was positively and negatively correlated with arable land and woodland, respectively, which indicated that the socio-economic development and implementation of this policy largely impacted the transformation of land use types. It can also be seen from the RDA three-order diagram that there was a negative correlation between woodland and temperature change. Although the temperature in the upper reaches of the Qingshui River basin showed a slowly increasing trend in the past 30 years, the temperature was still relatively low. Some studies have shown that temperature is negatively correlated with vegetation growth. Therefore, the low temperature leads to the slow growth of the woodland, thus impacting its change.
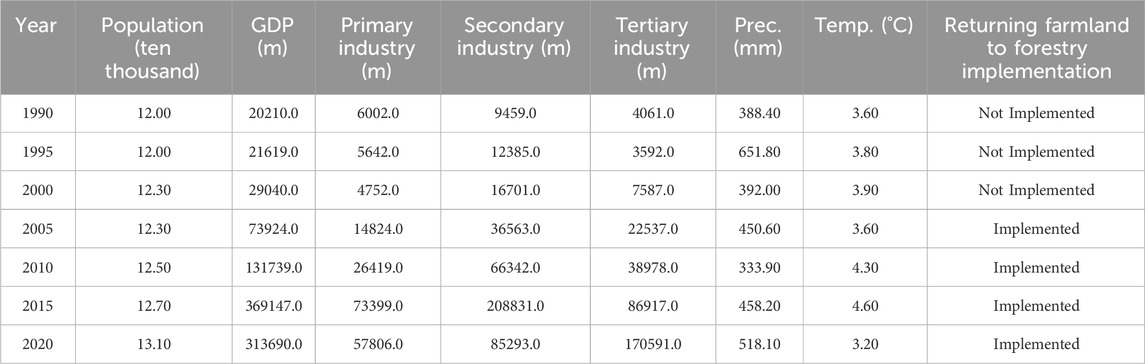
Table 5. Socio-economic and climatic parameters of the upper River basin.
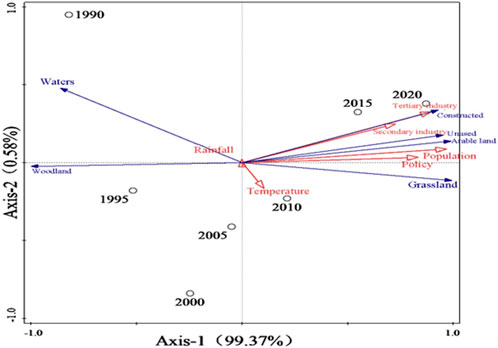
Figure 6. RDA three-sequence diagram showing the interaction between LULC dynamic, socio-economic and climatic parameter.
The watershed’s hydrological processes are largely influenced by LULC changes. LULC change assessment is required to develop land and water resources (Guder et al., 2022). Understanding LULC changes over time is critical for water resource management and land utilization planning (Gashaw et al., 2018). Our study showed that in 2000, the area under the water body and woodland decreased by 0.03% and 55.82%, respectively. While grassland, arable land, construction land, and unused land area increased by 24.64%, 18.12%, 1.07%, and 0.33%. In 2010, the water body area decreased by 0.02% and the woodland area by 49.09%. In 2020, the water and woodland areas further decreased by 0.01% and 44.09% of the total land area, respectively. The areas under grassland, arable land, construction land and unused land increased continuously over time. These results are consistent with those of Tariq et al. (2022), who found a larger impact of LULC change on water bodies and woodlands due to population growth, urbanization, agricultural expansion, and infrastructure development. Results are also consistent with Yao et al. (2021), who analyzed LULC changes in China over the past 4 decades. The study reported that water and woodland declined largely. At the same time, construction land increased rapidly in response to population growth and economic development. The study identified the negative impacts of LULC change on soil quality and water resources. Chen et al. (2018) found that the net area of reclamation increased by 553.6, while the natural water body declined by 574.3 km2 from 1960–2015. Zhai et al. (2021) reported that during 2000–2019, the build-up area increased by 983 km2, and the water and woodland areas reduced by 182.52 and 23.92 km2, respectively. According to a recent global assessment report by the Intergovernmental Science-Policy Platform on Biodiversity and Ecosystem Services, around 75% of the Earth’s land surface has been largely altered by human activities, resulting in declines in biodiversity and ecosystem services all around the world (Díaz et al., 2019). The present study finds that waters and woodland are threatened by LULC changes. The flow diagram shows the interaction and association among different variables (Figure 7). According to the results of this study, from 1990–2000, 2000–2010, and 2010–2020, the transition of land use types primarily involved woodland, followed by grassland, and then arable land. Similar results were found by Dadashpoor et al. (2019) in another region. Furthermore, Lira et al. (2012) reported that forest cover in Brazil declined by 30% and 50% from 1960–1980 and 1980 to 2000, respectively. Ellis and Porter-Bolland (2008) showed that the contrasting annual deforestation rates in Mexico within the two areas, i.e., the Campeche sites, were greater by 0.7% from 2000–2005 compared to Quintana Roo (−0.002%) from 2000–2004. Falcucci et al. (2007) found that the annual decreasing rate of forest cover in Italy was 0.3% in the 1990–2000 period. In terms of quantity, our study showed that woodland leads with 44.09%–63.43%, which indicated a general downward trend. This was followed by grassland (18.15%–30.09%) and arable land (17.06%–21.9%) types. The ratio of construction land to unused land was relatively small (0.26%–0.83%), thus indicating an overall upward trend. The ratio of water area to land area was 0.01%–0.13%, which indicated a downward trend. These results are consistent with previous findings of other study regions (Tan et al., 2020). Mohan et al. (2011) studied the urbanization dynamics and their effect on LULC in India and found that water bodies declined by 52% in the 10-year Yirsaw et al. (2017) studied the modelling of LULC and prediction of future changes in the ecosystem service values in the coastal area of China and found that water bodies reduced by 2.8% in 3 decades. In addition, Kafy et al. (2022) studied changes in LULC to predict the seasonal urban thermal features using machine learning methods in Bangladesh and found that water bodies decreased by 1% from 1995–2020. The primary causes for the shift in land use types in the upper reaches of the Qingshui River were the increasing urbanization process and fast socio-economic growth. A similar result was also found by Xu et al. (2019), which showed that the fundamental cause for the impact on agricultural and construction land was accelerated urbanization. Thus, the findings of this study can serve as the scientific foundation for the environmental conservation and the long-term development of the Qingshui River basin and are consistent with those reported by Yang et al. (2020). Therefore, sustainable land use practices and policies are essential for mitigating the negative impacts of LULC changes on ecological balance (He et al., 2022; Cui et el., 2022). The significance of this study lies in its contribution to our understanding of the complex interactions between land use, economic development, and sustainability. Analyzing the spatiotemporal variation of land use in the Qingshui Basin and identifying its driving factors provides valuable insights for policymakers, stakeholders, and researchers seeking to promote sustainable development in the region and beyond.
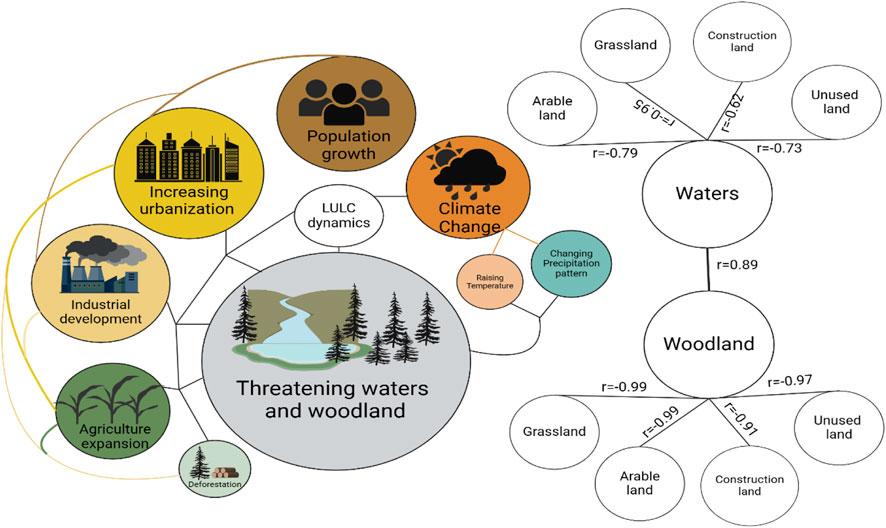
Figure 7. Factors threatening to the waters and woodland. Note: Here, a negative correlation means one land use type is increasing and the other is decreasing. The strong positive correlation between water and woodland indicates both are decreasing.
The LULC change drivers can alter the composition, configuration (Pontius and Millones, 2011) and spatial distribution of LULC (Quan et al., 2020), which can have important ecological, social, and economic impacts (Lambin and Geist, 2008). The relationship between LULC drivers and LULC changes is complex and multifaceted, and its variation depends on the specific context and spatial scale. For example, the primary driver of LULC change globally is the land use change associated with agriculture, while urbanization and forest conversion may be more important drivers locally (Foley et al., 2005). After China’s economic reform, its economy rapidly developed, with population growth and urbanization accelerating, and the construction of land area also increased annually. Previous studies have also reported that land use change is closely related to urbanized development (Zhang et al., 2023). The socio-economic factors, such as GDP and population, are better at explaining the change in land use types in the Hebei Province, while the natural factors, including temperature, precipitation, and slope, were comparatively dependent on the change in land use types (Wang et al., 2022). Although the temperature in the upper watershed of the Qingshui River basin showed a slowly increasing trend in the past 30 years, the temperature was still relatively low. Some studies have shown that temperature is negatively correlated with vegetation growth. Therefore, the low temperature leads to the slow growth of the woodland, thus impacting its change. Moreover, due to the development of the city, the demand for domestic water and production water increased, which reduced the water area (Yao et al., 2021). The relationship between the land use type and environmental variables in the Qingshui River Basin shows that population and construction land, unused land, arable land, and grassland were positively correlated. The policy of returning farmland to forests was positively and negatively correlated with arable land and woodland, respectively, which indicated that the socio-economic development and implementation of this policy largely impacted the transformation of land use types. Besides the economic and social factors, the government’s policy implementation can also cause land use changes in the short term. Previous studies have shown that land use change is affected by agricultural production systems and farming measures. Continuous societal development is damaging the ecosystem, and the government is increasingly focusing on protecting the ecological environment. The implementation of the policy of returning farmland to forests has been effective. However, in the upper watershed of the Qingshui River basin, the conversion of woodland to arable land is still happening.
In this study, the assessment of changing land use types in the watershed area of the Qingshui River in recent decades was conducted via remote sensing and image processing approaches. Temporal variations and spatial maps of different LUCC types from 1990 to 2020 were retrieved in every 10-year period interval. It was seen that water bodies and woodland are decreasing while other land use types are increasing over time. Thus, LULC change could threaten the ecosystem and may lead to significant consequences in the upper watershed area of the Qingshui River Basin in the future. As continuous societal development is damaging the ecological environment, the government is increasingly focusing on protecting the ecological environment. The implementation of the policy of returning farmland to forests has been effective. However, the conversion of woodland to arable land is still happening, with a small area of arable land with poor economic benefits being converted to grassland for the development of tourism. It is essential to protect land and water resources by planning construction and land development. This manuscript presents findings to support ecological environment governance, reveals the law governing land use change, and assists local government in implementing appropriate measures to achieve coordinated and sustainable development of the environment and social economy.
The original contributions presented in the study are included in the article/Supplementary material, further inquiries can be directed to the corresponding authors.
LW: Data curation, Formal Analysis, Investigation, Methodology, Writing–original draft, Writing–review and editing. NW: Data curation, Investigation, Methodology, Writing–original draft, Writing–review and editing. MP: Data curation, Writing–review and editing. QZ: Writing–review and editing, Formal Analysis. DW: Writing–review and editing. YL: Writing–review and editing, Data curation. ZA: Writing–review and editing, Project administration, Resources. LJ: Writing–review and editing, Conceptualization, Funding acquisition, Supervision.
The author(s) declare that financial support was received for the research, authorship, and/or publication of this article. This research was funded by the National Key R&D Plan (2022YFD1500204), the Science and Technology Capacity Improvement Project of Beijing Academy of Agricultural and Forestry Sciences (ZHS202304), Technological Innovation for the Protection and Utilization of Black Land (XDA28130200), the Beijing Academy of Agricultural and Forestry Sciences Youth Fund (QNJJ202214), Beijing Academic Program.
The authors declare that the research was conducted in the absence of any commercial or financial relationships that could be construed as a potential conflict of interest.
All claims expressed in this article are solely those of the authors and do not necessarily represent those of their affiliated organizations, or those of the publisher, the editors and the reviewers. Any product that may be evaluated in this article, or claim that may be made by its manufacturer, is not guaranteed or endorsed by the publisher.
Abbas, Z., Yang, G., Zhong, Y., and Zhao, Y. (2021). Spatiotemporal change analysis and future scenario of LULC using the CA-ANN approach: a case study of the greater Bay area, China. Land 10 (6), 584. doi:10.3390/LAND10060584
Bouaziz, M., Eisold, S., and Guermazi, E. (2017). Semiautomatic approach for land cover classification: a remote sensing study for arid climate in southeastern Tunisia. Euro-Mediterranean J. Environ. Integration 2, 24–27. doi:10.1007/S41207-017-0036-7
Capblancq, T., and Forester, B. R. (2021). Redundancy analysis: a Swiss Army Knife for landscape genomics. Methods Ecol. Evol. 12 (12), 2298–2309. doi:10.1111/2041-210X.13722
Chen, L., Ren, C., Zhang, B., Li, L., Wang, Z., and Song, K. (2018). Spatiotemporal dynamics of coastal wetlands and reclamation in the Yangtze estuary during past 50 Years (1960s–2015). Chin. Geogr. Sci. 28 (3), 386–399. doi:10.1007/S11769-017-0925-3
Cooley, T., and Anderson, G. (2002). FLAASH, a MODTRAN4-based atmospheric correction algorithm, its application and validation. IEEE International Geoscience and Remote Sensing Symposium 3, 1414–1418. doi:10.1109/IGARSS.2002.1026134
Cui, J., Zhu, M., Liang, Y., Qin, G., Li, J., and Liu, Y. (2022). Land use/land cover change and their driving factors in the Yellow River Basin of Shandong Province based on google earth Engine from 2000 to 2020. ISPRS Int. J. Geo-Information 11 (3), 163. doi:10.3390/ijgi11030163
Dadashpoor, H., Azizi, P., and Moghadasi, M. (2019). Land use change, urbanization, and change in landscape pattern in a metropolitan area. Sci. Total Environ. 655, 707–719. doi:10.1016/J.SCITOTENV.2018.11.267
Díaz, S., Settele, J., Brondízio, E., Ngo, H., and Guèze, M. (2019) The global assessment report on biodiversity and ecosystem services: summary for policy makers. Available at: https://ri.conicet.gov.ar/handle/11336/116171.
Du, J., Laghari, Y., Wei, Y. C., Wu, L., He, A. L., Liu, G. Y., et al. (2024). Groundwater depletion and degradation in the North China Plain: challenges and mitigation options. Water 16 (2), 354. doi:10.3390/w16020354
Duan, X., Chen, Y., Wang, L., Zheng, G., and Liang, T. (2023). The impact of land use and land cover changes on the landscape pattern and ecosystem service value in Sanjiangyuan region of the Qinghai-Tibet Plateau. J. Environ. Manag. 325, 116539. doi:10.1016/J.JENVMAN.2022.116539
Ellis, E. A., and Porter-Bolland, L. (2008). Is community-based forest management more effective than protected areas? a comparison of land use/land cover change in two neighboring study areas of the Central Yucatan Peninsula, Mexico. For. Ecol. Manag. 256 (11), 1971–1983. doi:10.1016/J.FORECO.2008.07.036
Falcucci, A., Maiorano, L., and Boitani, L. (2007). Changes in land-use/land-cover patterns in Italy and their implications for biodiversity conservation. Landsc. Ecol. 22 (4), 617–631. doi:10.1007/s10980-006-9056-4
Fan, H., Chen, S., Li, Z., Liu, P., Xu, C., and Yang, X. (2020). Assessment of heavy metals in water, sediment and shellfish organisms in typical areas of the Yangtze River Estuary, China. Mar. Pollut. Bull. 151, 110864. doi:10.1016/j.marpolbul.2019.110864
Flajolet, P., and Noy, M. (2000). Analytic combinatorics of chord diagrams. 12th Int. Conf. FPSAC'00, 191–201. doi:10.1007/978-3-662-04166-6_17
Foley, J. A., DeFries, R., Asner, G. P., Barford, C., Bonan, G., Carpenter, S. R., et al. (2005). Global consequences of land use. Science 309 (5734), 570–574. doi:10.1126/science.1111772
Fu, Y., and Zhang, X. (2020). Mega urban agglomeration in the transformation era: evolving theories, research typologies and governance. Cities 105, 102813. doi:10.1016/j.cities.2020.102813
Gashaw, T., Tulu, T., Argaw, M., and Worqlul, A. W. (2018). Modeling the hydrological impacts of land use/land cover changes in the Andassa watershed, Blue Nile Basin, Ethiopia. Sci. Total Environ. 619–620, 1394–1408. doi:10.1016/J.SCITOTENV.2017.11.191
Guder, A. C., Demissie, T. A., and Ahmed, D. T. (2022). Evaluation of hydrological impacts of land use/land cover changes of Holota Watershed, Upper Awash Sub-basin, Ethiopia. J. Sediment. Environ. 8 (1), 39–55. doi:10.1007/S43217-022-00118-2
Han, J., Wang, J., Chen, L., Xiang, J., Ling, Z., Li, Q., et al. (2021). Driving factors of desertification in Qaidam Basin, China: an 18-year analysis using the geographic detector model. Ecol. Indic. 124, 107404. doi:10.1016/j.ecolind.2021.107404
He, C., Zhang, J., Liu, Z., and Huang, Q. (2022). Characteristics and progress of land use/cover change research during 1990–2018. J. Geogr. Sci. 32 (3), 537–559. doi:10.1007/S11442-022-1960-2
He, J., Jiang, X., Lei, Y., Cai, W., and Zhang, J. (2022). Temporal and spatial variation and driving forces of soil erosion on the loess plateau before and after the implementation of the grain-for-green project: a case study in the Yanhe River Basin, China. Int. J. Environ. Res. Public Health 19 (14), 8446. doi:10.3390/IJERPH19148446
Huang, B., Huang, J., Gilmore Pontius, R., and Tu, Z. (2018). Comparison of Intensity Analysis and the land use dynamic degrees to measure land changes outside versus inside the coastal zone of Longhai, China. Ecol. Indic. 89, 336–347. doi:10.1016/J.ECOLIND.2017.12.057
Kafy, A.Al, Saha, M., Faisal, A.Al, Rahaman, Z. A., Rahman, M. T., Liu, D., et al. (2022). Predicting the impacts of land use/land cover changes on seasonal urban thermal characteristics using machine learning algorithms. Build. Environ. 217, 109066. doi:10.1016/J.BUILDENV.2022.109066
Khan, A., Lisitsa, A., and Vernitski, A. (2021) Gauss-lintel, an algorithm suite for exploring chord diagrams, 197–202. doi:10.1007/978-3-030-81097-9_16
Kong, L., and Tian, G. (2020). Assessment of the spatio-temporal pattern of PM2.5 and its driving factors using a land use regression model in Beijing, China. Environ. Monit. Assess. 192 (2), 95–19. doi:10.1007/s10661-019-7943-9
Laghari, Y., Bai, S., Leghari, S. J., Wei, W., and Laghari, A. H. (2023). Coastal wetlands of Indus River Delta are under risk due to reclamation: a spatiotemporal analysis during the past 50 years from 1972 to 2022. Res. Square. doi:10.21203/rs.3.rs-3301912/v1
Lambin, E., and Geist, H. (2008) Land-use and land-cover change: local processes and global impacts. Springer Science and Business Media. Available at: https://books.google.com/books.
Leta, M. K., Demissie, T. A., and Tränckner, J. (2021). Modeling and prediction of land use land cover change dynamics based on land change modeler (Lcm) in nashe watershed, upper blue nile basin, Ethiopia. Sustainability 13 (7), 3740. doi:10.3390/su13073740
Li, D., and Wang, X. (2021). Land-use change and efficiency in Laos' special economic zones. Land 10 (10), 1012. doi:10.3390/land10101012
Li, K., Feng, M., Biswas, A., Su, H., Niu, Y., and Cao, J. (2020). Driving factors and future prediction of land use and cover change based on satellite remote sensing data by the LCM model: a case study from Gansu province, China. Sensors 20 (10), 2757. doi:10.3390/s20102757
Liang, Y., and Liu, L. (2017). Simulating land-use change and its effect on biodiversity conservation in a watershed in northwest China. Spj.Sci. Org 3 (5). doi:10.1080/20964129.2017.1335933
Lilles and, T., Kiefer, R., and Chipman, J. (2015) Remote sensing and image interpretation. John Wiley and Sons. Available at: https://books.google.com.pk/books.
Liping, C., Yujun, S., and Saeed, S. (2018). Monitoring and predicting land use and land cover changes using remote sensing and GIS techniques—a case study of a hilly area, Jiangle, China. PLOS ONE 13 (7), e0200493. doi:10.1371/JOURNAL.PONE.0200493
Lira, P. K., Tambosi, L. R., Ewers, R. M., and Metzger, J. P. (2012). Land-use and land-cover change in Atlantic Forest landscapes. For. Ecol. Manag. 278, 80–89. doi:10.1016/J.FORECO.2012.05.008
Liu, J., Liu, R., Zhang, Z., Cai, Y., and Zhang, L. (2017). A Bayesian Network-based risk dynamic simulation model for accidental water pollution discharge of mine tailings ponds at watershed-scale. J. Environ. Manag. 246, 821–831. doi:10.1016/J.JENVMAN.2019.06.060
Liu, R., Liu, J., Zhang, Z., Borthwick, A., and Zhang, K. (2015). Accidental water pollution risk analysis of mine tailings ponds in guanting reservoir watershed, Zhangjiakou city, China. Int. J. Environ. Res. Public Health 12 (12), 15269–15284. doi:10.3390/IJERPH121214983
Mmbaga, N. E., Munishi, L. K., and Treydte, A. C. (2017). How dynamics and drivers of land use/land cover change impact elephant conservation and agricultural livelihood development in Rombo, Tanzania. J. Land Use Sci. 12 (2-3), 168–181. doi:10.1080/1747423X.2017.1313324
Mohamed, A., and Worku, H. (2019). Quantification of the land use/land cover dynamics and the degree of urban growth goodness for sustainable urban land use planning in Addis Ababa and the surrounding Oromia special zone. J. Urban Manag. 8 (1), 145–158. doi:10.1016/j.jum.2018.11.002
Mohan, M., Pathan, S. K., Narendrareddy, K., Kandya, A., and Pandey, S. (2011). Dynamics of urbanization and its impact on land-use/land-cover: a case study of megacity Delhi. J. Environ. Prot. 02 (09), 1274–1283. doi:10.4236/JEP.2011.29147
Moro, L. D., Maculan, L. S., Pivoto, D., Cardoso, G. T., Pinto, D., Adelodun, B., et al. (2022). Geospatial analysis with Landsat series and sentinel-3B OLCI satellites to assess changes in land use and water quality over time in Brazil. Sustainability 14 (15), 9733. doi:10.3390/SU14159733
Pontius, R. G., and Millones, M. (2011). Death to Kappa: birth of quantity disagreement and allocation disagreement for accuracy assessment. Int. J. Remote Sens. 32 (15), 4407–4429. doi:10.1080/01431161.2011.552923
Qu, L. A., Chen, Z., Li, M., Zhi, J., and Wang, H. (2021). Accuracy improvements to pixel-based and object-based lulc classification with auxiliary datasets from Google Earth engine. Remote Sens. 13 (3), 453. doi:10.3390/rs13030453
Quan, B., Jr, R. P., and Gis, H. S. (2020). Intensity Analysis to communicate land change during three time intervals in two regions of Quanzhou City, China. Taylor Francis 57 (1), 21–36. doi:10.1080/15481603.2019.1658420
Shahid, M., Cong, Z., and Zhang, D. (2018). Understanding the impacts of climate change and human activities on streamflow: a case study of the Soan River basin, Pakistan. Theor. Appl. Climatol. 134, 205–219. doi:10.1007/s00704-017-2269-4
Shen, S., Yue, P., and Fan, C. (2019). Quantitative assessment of land use dynamic variation using remote sensing data and landscape pattern in the Yangtze River Delta, China. Sustain. Comput. Inf. Syst. 23, 111–119. doi:10.1016/J.SUSCOM.2019.07.006
Tan, J., Yu, D., Li, Q., Tan, X., and Zhou, W. (2020). Spatial relationship between land-use/land-cover change and land surface temperature in the Dongting Lake area, China. Sci. Rep. 10 (1), 9245–9249. doi:10.1038/s41598-020-66168-6
Tariq, A., Mumtaz, F., Majeed, M., and Zeng, X. (2022). Spatio-temporal assessment of land use land cover based on trajectories and cellular automata Markov modelling and its impact on land surface temperature of Lahore district Pakistan. Environ. Monit. Assess. 195 (1), 114–121. doi:10.1007/S10661-022-10738-W
Vu, H. T. D., Tran, D. D., Schenk, A., Nguyen, C. P., Vu, H. L., Oberle, P., et al. (2022). Land use change in the Vietnamese Mekong Delta: new evidence from remote sensing. Sci. Total Environ. 813, 151918. doi:10.1016/j.scitotenv.2021.151918
Wang, B., Zhang, Z., Wang, X., Zhao, X., Yi, L., and Hu, S. (2021). The suitability of remote sensing images at different resolutions for mapping of gullies in the black soil region, northeast China. Remote Sens. 13 (12), 2367. doi:10.3390/rs13122367
Wang, X., Xu, Y. J., and Zhang, L. (2022). Watershed scale spatiotemporal nitrogen transport and source tracing using dual isotopes among surface water, sediments and groundwater in the Yiluo River Watershed, Middle of China. Sci. Total Environ. 833, 155180. doi:10.1016/J.SCITOTENV.2022.155180
Xu, F., Jia, Y., Peng, H., Niu, C., Liu, J., Hao, C., et al. (2019). Vertical zonality of the water cycle and the impact of land-use change on runoff in the Qingshui River Basin of Wutai Mountain, China. Hydrological Sci. J. 64 (16), 2080–2092. doi:10.1080/02626667.2019.1655146
Yang, F., He, F., Li, M., and Li, S. (2020). Evaluating the reliability of global historical land use scenarios for forest data in China. J. Geogr. Sci. 30 (7), 1083–1094. doi:10.1007/s11442-020-1771-2
Yao, Z., Wang, B., Huang, J., Zhang, Y., Yang, J., Deng, R., et al. (2021). Analysis of land use changes and driving forces in the Yanhe River Basin from 1980 to 2015. J. Sensors 2021, 1–11. doi:10.1155/2021/6692333
Yirsaw, E., Wu, W., Shi, X., Temesgen, H., and Bekele, B. (2017). Land use/land cover change modeling and the prediction of subsequent changes in ecosystem service values in a coastal area of China, the su-xi-chang region. Sustainability 9 (7), 1204. doi:10.3390/SU9071204
Zhai, H., Lv, C., Liu, W., Yang, C., Fan, D., Wang, Z., et al. (2021). Understanding spatio-temporal patterns of land use/land cover change under urbanization in wuhan, China, 2000–2019. Remote Sens. 13 (16), 3331. doi:10.3390/RS13163331
Zhang, L., Meng, L., Du, S., Yang, H., Xu, H., Deng, Z., et al. (2021). Evaluation of precipitation infiltration recharge based on elevation effects in Chongli Area, China. Arabian J. Geosciences 14 (22), 2444–2449. doi:10.1007/S12517-021-08770-0
Zhang, Y., Fang, Z., and Xie, Z. (2023). Study on the coupling coordination between ecological environment and high-quality economic development in urban agglomerations in the middle reaches of the Yangtze River. Int. J. Environ. Res. Public Health 20 (4), 3612. doi:10.3390/IJERPH20043612
Zhang, Z., Xu, E., and Zhang, H. (2021). Complex network and redundancy analysis of spatial–temporal dynamic changes and driving forces behind changes in oases within the Tarim Basin in northwestern China. CATENA 201, 105216. doi:10.1016/J.CATENA.2021.105216
Keywords: Qingshui River basin, LULC, transfer matrix, redundancy analysis, driving factors
Citation: Wang L, Wang N, Pang M, Zhang Q, Wei D, Li Y, An Z and Jin L (2024) Analysis of spatiotemporal land use change characteristics in the upper watershed area of the Qingshui River basin from 1990 to 2020. Front. Environ. Sci. 12:1388058. doi: 10.3389/fenvs.2024.1388058
Received: 19 February 2024; Accepted: 20 May 2024;
Published: 06 June 2024.
Edited by:
Weimin Huang, Memorial University of Newfoundland, CanadaReviewed by:
Muhammad Shahid, Brunel University London, United KingdomCopyright © 2024 Wang, Wang, Pang, Zhang, Wei, Li, An and Jin. This is an open-access article distributed under the terms of the Creative Commons Attribution License (CC BY). The use, distribution or reproduction in other forums is permitted, provided the original author(s) and the copyright owner(s) are credited and that the original publication in this journal is cited, in accordance with accepted academic practice. No use, distribution or reproduction is permitted which does not comply with these terms.
*Correspondence: Zhizhuang An, YXp6bHlAMTI2LmNvbQ==; Liang Jin, amlubGlhbmcxOTc2MjAwM0BhbGl5dW4uY29t
Disclaimer: All claims expressed in this article are solely those of the authors and do not necessarily represent those of their affiliated organizations, or those of the publisher, the editors and the reviewers. Any product that may be evaluated in this article or claim that may be made by its manufacturer is not guaranteed or endorsed by the publisher.
Research integrity at Frontiers
Learn more about the work of our research integrity team to safeguard the quality of each article we publish.