 Xiao Shi
 Ming Sun2
95% of researchers rate our articles as excellent or good
Learn more about the work of our research integrity team to safeguard the quality of each article we publish.
Find out more
ORIGINAL RESEARCH article
Front. Environ. Sci. , 21 May 2024
Sec. Atmosphere and Climate
Volume 12 - 2024 | https://doi.org/10.3389/fenvs.2024.1387672
This article is part of the Research Topic Climate-Environment Interactions under Global Warming, volume II View all 10 articles
Compared with surface temperature, the near-surface temperature is more related with human health. However, extensive researches have been conducted on the UHI effect globally using surface temperature considering its accessibility. In this study, a comparative analysis of near-surface and surface urban heat islands in the Yangtze River Delta Region is investigated. This study first proposed a spatialization method suitable for air temperature in highly urbanized areas with complex land cover. Based on this method, a dataset of 1-km gridded air temperature is developed, and an in-depth analysis of the changes of near-surface and surface heat island is further carried out. Results show that both the near-surface urban heat island intensity (NSUHII) and surface urban heat island intensity (SUHII) are rather strong over the past 20 years, presenting similar spatial distributions as well. However, in the rapidly expanding urban areas especially during summer and winter seasons, the difference in magnitude and time variations (R) between NSUHII and SUHII are pronounced. Hence, adaptions and mitigation strategies on NSUHI and SUHI should be developed and implemented separately in such occasions, which is especially important for developed areas such as Yangtze River Delta Region.
Primarily triggered by climate change and the intricate interplay between land surface and atmospheric systems, the heat island effect in urban landscapes takes shape (Krayenhoff et al., 2018; Lu et al., 2023). Climate change has led to an imbalanced distribution of water and heat, leading to a surge in extreme high-temperature occurrences in certain regions. Concurrently, as urbanization rapidly advances, urban spaces and their populations expand exponentially, accompanied by profound shifts in land-use patterns (Aliyazıcıoğlu et al., 2021; Topaloglu, 2022; Morsy and Hadi, 2022). These changes, by manipulating surface albedo and water evaporation, disrupt the equilibrium of surface heat budgets, encompassing both the sensible and latent heat exchanges between land and atmosphere, as well as vertical water vapor transport. Consequently, these alterations reshape meteorological variables like temperature and humidity within the lower atmospheric stratum. Ultimately, this gives rise to a remarkable phenomenon where urban temperatures significantly outstrip those in neighboring rural areas, thus giving birth to the urban heat island effect (UHI) (Manley, 1959; Parry& Chandler, 1966; Oke, 1982; Zhang et al., 2023). Featured by significant spatio-temporal variations and substantial side effects, the UHI effect imposes an obvious impact on regional climate, energy consumption, air pollution and human health (Shahmohamadi et al., 2011; Zhang et al., 2023). In addition, extreme weather events have become increasingly frequent under the context of climate change, which further exacerbate the UHI effect (Shi et al., 2021; Lou et al., 2023). Hence, it is crucial to accurately describe and quantify the UHI effect for the urban sustainable development.
In recent years, extensive researches have been conducted on the UHI effect globally (Ramakreshnan et al., 2019; Han et al., 2020; Hu et al., 2023). Traditional UHI studies primarily use the air temperature data observed at meteorological stations (referred to as near-surface UHIs) (Liu et al., 2021). The observed air temperature data have the advantages of high temporal resolution and high precision, which are widely regarded as the “ground truth” by scholars from various fields (Wang et al., 2016; Abbas and Ismael, 2020). However, sparsely distributed meteorological stations struggle to meet the research needs for various types of UHI effects, leading to uncertainties in the calculation of UHI effects.
Satellite remote sensing enables fast observation of UHI with spatio-temporal continuity. Currently, the UHI studies mostly focus on the LST-related surface heat island effect (Chen et al., 2016; Peng et al., 2016; Wang et al., 2021). The spatial and temporal variations of SUHI have been documented, the SUHI intensity varies greatly by cities, seasons according to previous studies (Imhoff et al., 2010; Yao et al., 2018; Meng et al., 2023). In addition, the long term trends of SUHI and associated drivers have been also investigated. Yao et al. (2018) pointed out significant increasing trends of SUHII in China and increased non-agriculture population and decreasing vegetation were important reasons for increased SUHII. Wang et al. (2021) pointed out anthropogenic factors are considered the most important ones in determining SUHI in the Yangtze River Delta.
With respect to human health and comfort, the near-surface temperature is more direct than surface temperature because human skin is directly in contact with the atmosphere rather than the land surface (Anniballe et al., 2014; Nanayakkara et al., 2023). However, there are still some gaps in studies of near-surface urban heat island, mainly because the near surface temperature cannot be retrieved by remote sensing method. Most of current studies on near-surface urban heat island are based on sparsely distributed meteorological stations, which may have some uncertainties (Shi et al., 2024).
Numerous studies have revealed a mutual interaction between the air temperature and the LST from the energy balance perspective (Liu et al., 2020; Luo et al., 2023; Yao, 2020). However, this interaction is relatively complex considering the physical differences and natural environments between them, which lead to discrepancies when describing the urban thermal effects, and may cause uncertainties for evaluating the impact of urbanization on environment. Weak relationships were reported in both vegetated, barren lands (Xiong et al., 2017) and urban area, especially during the daytime (Yang et al., 2020; Yao et al., 2021). Up to now, there is still a lack of research on comprehensively analyzing the spatio-temporal variation differences between near-surface heat island effects and surface heat island effects within the same study area from different perspectives.
The objective of this study is to investigate and analyze the characteristics of the near-surface UHI and surface UHI in the Yangtze River Delta region based on grid scale air temperature using machine learning method and remote sensing land surface temperatures. The remainder of this paper is organized as follows. Section 2 provides a detailed introduction to the study area, data information and methods used in this study. Section 3 analyzes the accuracy of remote sensing estimation of air temperature, and further investigates the spatial distributions, interrelationships and variation trends of near-surface UHI intensity (NSUHII) and surface UHI intensity (SUHII). Section 4 discusses the strengths and limitations of this study. Finally, the main conclusions are summarized in Section 5.
The Yangtze River Delta (YRD) region is located in the east of China and has an area covers 358,000 square kilometers (Figure 1A). It is one of the three major urban agglomerations (the Beijing-Tianjin-Hebei, the Yangtze River Delta, and the Pearl River Delta) in China (Liu et al., 2017). The overall terrain in the northern part of the study area mainly consists of plain areas, while many mountainous areas are located in the southwestern and southeast part of the study area. The climate over the study area is dominated by the East Asian monsoon with four distinct seasons.
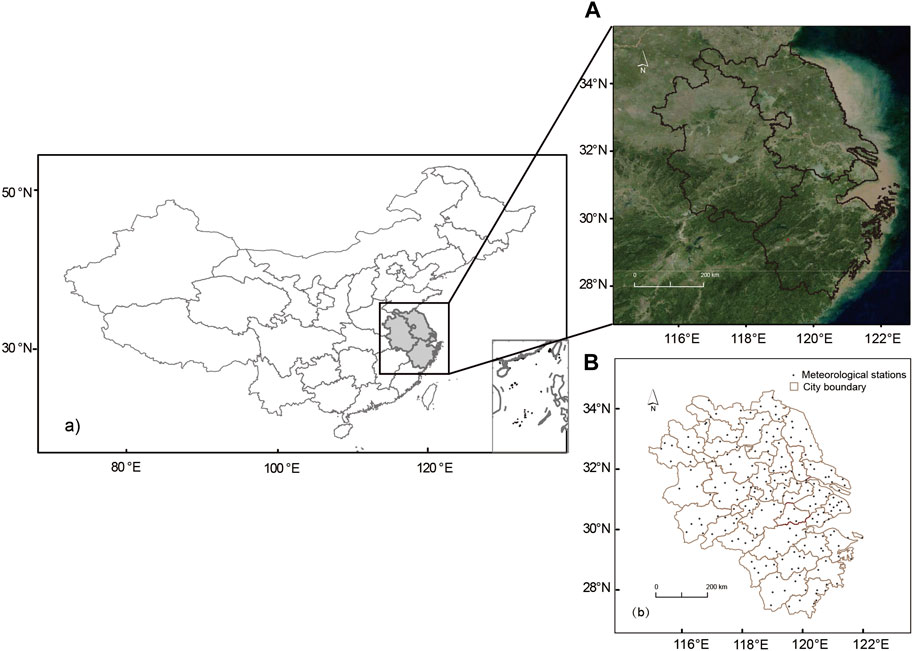
Figure 1. Study area (A) and the spatial distribution of meteorological stations (B).
It consists of three provinces (Jiangsu, Zhejiang and Anhui) and one municipality (Shanghai), with a total of 41 cities (Figure 1B). Mega-cities including Shanghai, Hangzhou, Nanjing and Suzhou are located in this region, with a permanent population accounting for nearly 1/6 of the entire country and an economic aggregate constituting nearly 1/4 of the national total (Sun et al., 2019).
During the urbanization process, this region has undergone dramatic changes in land cover (Jin et al., 2021), where the UHI effect has also become increasingly intense and more severe. In addition, relevant studies have indicated that this region has experienced significant warming trend (Shi et al., 2021). Under the combined influences of climate warming and the rapid expansion of urban areas, the variations of thermal environment in this region have imposed a profound impact on both the ecological environment and social economy (Wang et al., 2021; Yang and Pan, 2011). Hence, it is crucial to study the spatio-temporal variation characteristics of the thermal environment in this region.
The maximum air temperature data for the 2001–2018 period are obtained from 199 national ground meteorological stations, which are provided by the National Meteorological Information Center of China Meteorological Administration. This dataset was subjected to strict quality control procedures including spatial and internal consistency checks, identification of outliers, and manual revision of erroneous data (Chen et al., 2021). The locations of meteorological stations are shown in Figure 1B.
Terra Moderate Resolution Imaging Spectroradiometer (MODIS) is a sensor onboard Terra and Aqua platforms. The MOD11A2 product is an 8-day composite dataset with a spatial resolution of 1 km (Niu et al., 2020; Su et al., 2013; Wang et al., 2023). In this study, we obtained daytime LST, nighttime LST, clear_sky_days and clear_sky_nights data from MOD11A2. In addition, we calculate the rate of clear day (RD) and night (RN) from clear_sky_days and clear_sky_nights data, which are defined as the percentage of days and nights with clear sky. The surface reflectance from MOD09GA product provides the daily reflectance of bands 1–7 with 500-m spatial resolution. It is considered to derived the normalized difference vegetation index (NDVI) and the modified normalized difference water index (MNDWI) in this study, which are input parameters to estimate the air temperature are calculated using this data. The MCD12Q1 land cover type products combined Terra and Aqua data at yearly intervals and with 500-m spatial resolution (Yang and Huang, 2021; Hua and Chen, 2013).
The global nighttime light data during 2001–2018 is obtained from the National Polar-orbiting Partnership (NPP)/Visible-Infrared Imaging Radiometer Suite (VIIRS) data provided by the United States National Oceanic and Atmospheric Administration Earth Observation Group (Li et al., 2020). In addition, to calculate the solar radiation, which is an input parameter for remote sensing estimation, elevation data from the Shuttle Radar Topography Mission (SRTM) is also used. The data specifics used in this study are shown in Table 1.
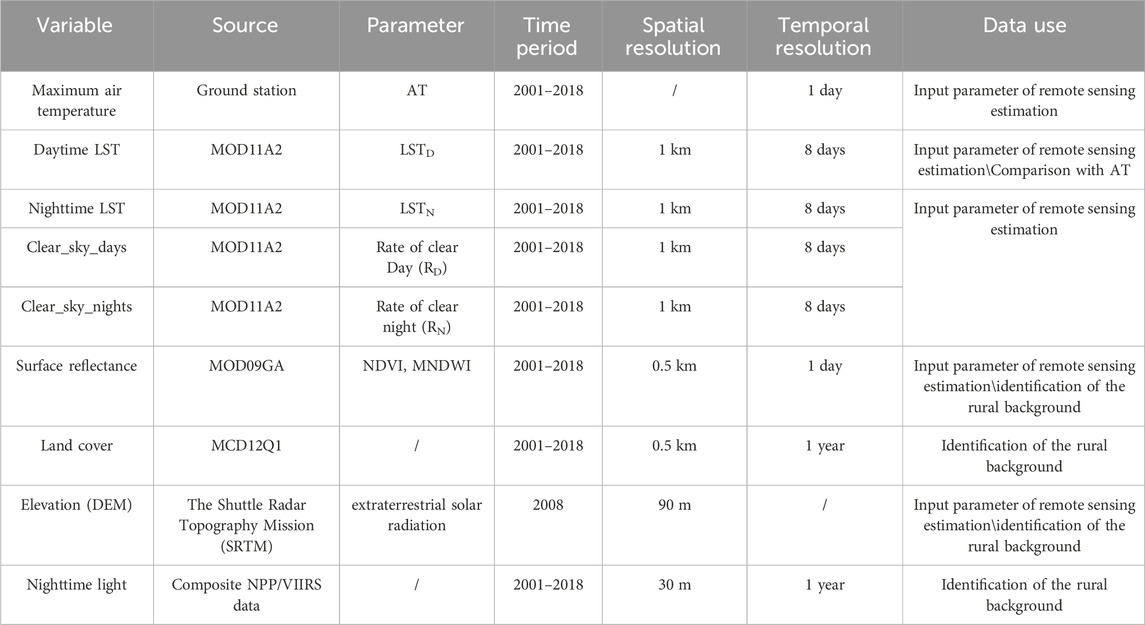
Table 1. Data and related information used in this study.
The core principle of remote sensing estimation for air temperature is to use the relationship between station-observed air temperatures and corresponding independent variables at a certain grid point to predict the air temperature values on this grid. Specifically, the monthly-averaged maximum air temperature from meteorological observation stations is selected as the dependent variable for the estimation models. Eight different types of land surface factors (LSTD, LSTN, RD, RN, NDVI, MNDWI, DEM, extraterrestrial solar radiation) are chosen as independent variables in the remote sensing estimation process of air temperature.
Extraterrestrial solar radiation is an important parameter for evaluating solar energy resources, which refers to the solar radiation that can be received by the earth’s surface without considering the influence of the atmosphere. Here we use the distributed modeling of extraterrestrial solar radiation over rugged terrains proposed by (Zeng et al., 2005) and to calculate monthly average extraterrestrial solar radiation in study area. Extraterrestrial solar radiation on the slope is determined by geography, topographic features and astronomical factors (solar declination, hour Angle). The daily extraterrestrial solar radiation is calculated as follows (Eqs 1–9):
Ws is extraterrestrial solar radiation, T is the length of 1 day (1,140 min), I0 is solar constant (0.082 MJ·m−2·min−1), E0 is correction coefficient of sun-earth distance. u, v, and w are the feature factors related to terrain.
The declination of the sun and correction coefficient of sun-earth distance E0 can be calculated as follows:
Where
Furthermore, four machine learning methods of the Multiple Linear Regression (MLR), Back-Propagation Neural Networks (BPNN), Support Vector Machine (SVM) and Random Forest (RF) are used to fit the relationship between the dependent variable and independent variables at the station scale. 10-fold cross-validation method is used to assess the fitness of selected predictors by comparing the observed and estimated air temperatures. Subsequently, the four models output four datasets of 1-km gridded monthly-averaged maximum air temperature by taking the 1-km independent variable data as the input. Since this study mainly focus on the comparison between near-surface and surface urban heat islands, detailed information about the air temperature estimation process will not be discussed in this study.
To compare and analyze the similarities and differences between near-surface and surface heat island, NSUHII and SUHII are employed. The NSUHII and SUHII are used to quantify the near-surface and surface UHI effect, as follows (Eqs 10, 11):
Where NSUHIIi and SUHIIi refer the near-surface and surface urban heat intensity in pixel i, ATi and LSTi refer the air temperature and LST in pixel i, n is the total number of rural background effective pixels. ATbj and LSTbj represent the air temperature and LST of the corresponding rural background, respectively (Liu et al., 2017).
The appropriate selection of suburban farmland background is the key to calculate urban heat island intensity. For different cities in large urban agglomerations, it is not advisable choosing the same rural background to calculate the temperature difference between urban and rural areas to get the urban heat island intensity (Shi et al., 2021). We use the method proposed by (Liu et al., 2017) to determine the farmland background pixels of each city by combining four criteria: land cover, NDVI, night light index and elevation difference relative to urban central areas. 1) In terms of land cover type, the rural area is selected as the background pixel according to the land cover type of farmland; 2) The annual maximum NDVI ≥0.7 is used as the ideal value to determine the rural background; 3) The night light index ≤15 identifies areas unaffected by human activity; 4) The altitude difference from the city <50 m is preferred to reduce the terrain effect on the heat island intensity. The spatial distributions of land cover type of 2018, annual maximum NDVI of 2018, night light index of 2018 and altitude difference from the city are shown in Supplementary Figure S1.
The non-parametric statistics of Theil-Sen slope (Sen, 1968) is used to determine the linear trend of NSUHII and SUHII during 2001–2018. It is a more robust estimator than the least-square method because it is insensitive to outliers and extreme values, which leading to the robust performance in time series variation trend estimation (Svilicic et al., 2016). The TS estimator is expressed as Eq. 12:
where median denotes the median function, xi and xj are the data values at times i and j, respectively, and ti and tj are the corresponding time series with lengths of n and i < j < n, respectively.
Figure 2 shows the density scatter plot between estimated air temperature data and the referenced air temperature data. Apparently, the linear relationship of these four scatter plots are close to 1:1 lines and the variation ranges of air temperature are similar. However, the outliers of RF method seems to be least among the other three methods, indicating the relatively higher estimated accuracy. The 10-fold cross-validation accuracies of the 1-km gridded air temperature data estimated using four methods (Figure 2) also demonstrate that the RF model outperforms three other models with highest correlation coefficient, least MAE and RMSE. In addition, the spatial distributions of RF-based estimation also indicate that the results are more reasonable than other three methods (Supplementary Figure S2).
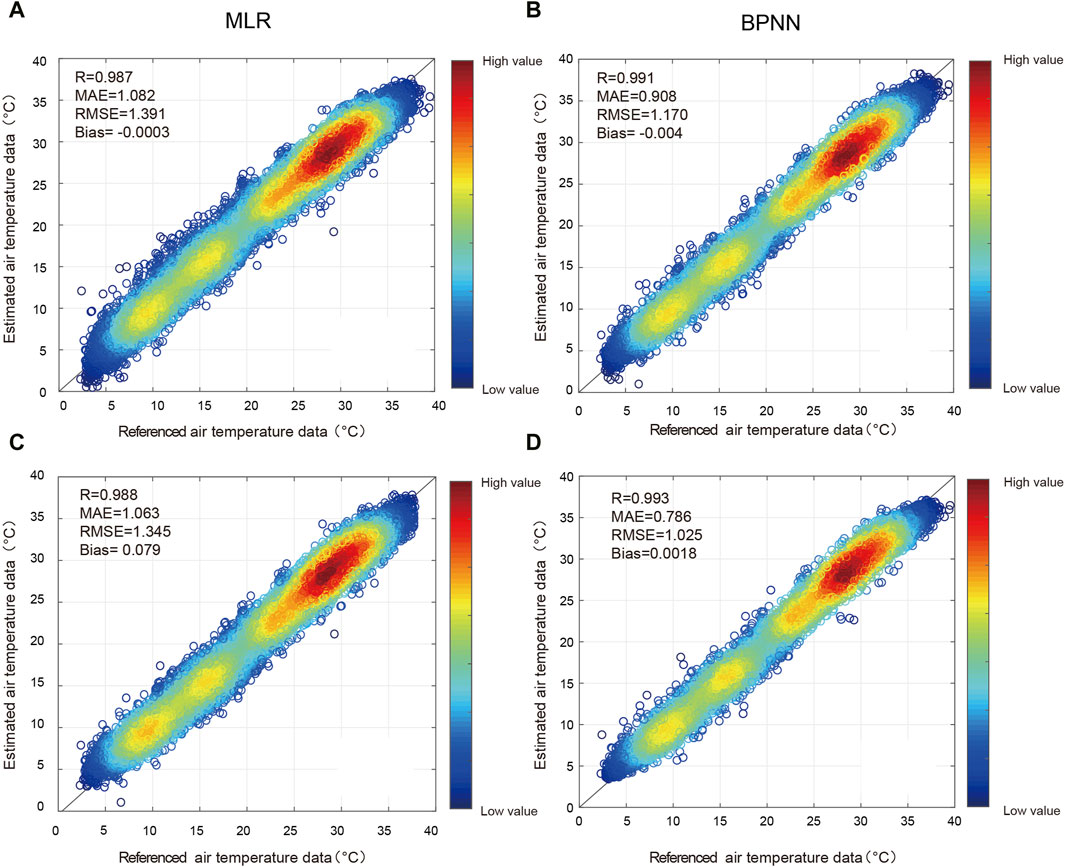
Figure 2. 10-fold cross-validation accuracies of air temperature estimation based on MLR (A), BPNN (B), SVM (C) and RF (D) methods.
Based on the observations from 199 meteorological stations, the accuracy of the 1-km gridded air temperature data estimated using the RF is assessed, as shown in Figure 3. It can be seen that the MAEs and RMSEs are relatively smaller over the entire study area. Particularly, the MAEs and RMSEs in the majority areas of Jiangsu Province are relatively smaller than in Zhejiang Province. This may be attributed to the uniform underlying surface in Jiangsu Province where most areas are relatively flat plains, which is conducive to improving the accuracy of the RF-based estimation model. While the larger MAEs and RMSEs in the southern part of Zhejiang Province are mainly associated with its complex terrains due to numerous mountain ranges. The R values between the estimations and the observations at all stations in the study area are quite high, with the values exceeding 0.995 at most stations. It indicates a good consistency in the temporal variations of air temperature between the estimations and the observations. Consequently, the 1-km gridded air temperature data derived from RF model proves to be an ideal choice for studying the UHIs.
Figure 3. Spatial distributions of maximum air temperature estimation accuracy based on random forest: (A) MAE, (B) RMSE, (C) R.
Using the 1-km gridded air temperature data from air temperature estimation and daytime LST data from the 8-day composite (MODIS) LST product, monthly average NSUHII and SUHII can be derived. Figure 4 illustrates the spatial distributions of NSUHII and SUHII in the study area during 2001–2018. In general, both NSUHII and SUHII are rather strong in the study area over the past 20 years, presenting similar spatial distributions. Higher UHI effect are observed over the YRD core cities such as Shanghai, Nanjing, Taizhou, indicating that both the air temperatures and near surface temperatures in these areas are higher than those of farmland background areas. Noticeable cool island effect is found in mountainous areas, demonstrating the relatively lower temperature compared with those of farmland background areas. However, the SUHII exhibits higher intensity and a broader range of both heat and cool island effects than the NSUHII. The highest NSUHII is recorded in Shanghai City, reaching up to 2.8°C while the highest value of SUHII is found in Taizhou City with SUHII value up to 4.8°C. In addition, the cool island effect of surface temperature is more pronounced over water bodies compare with near surface temperature.
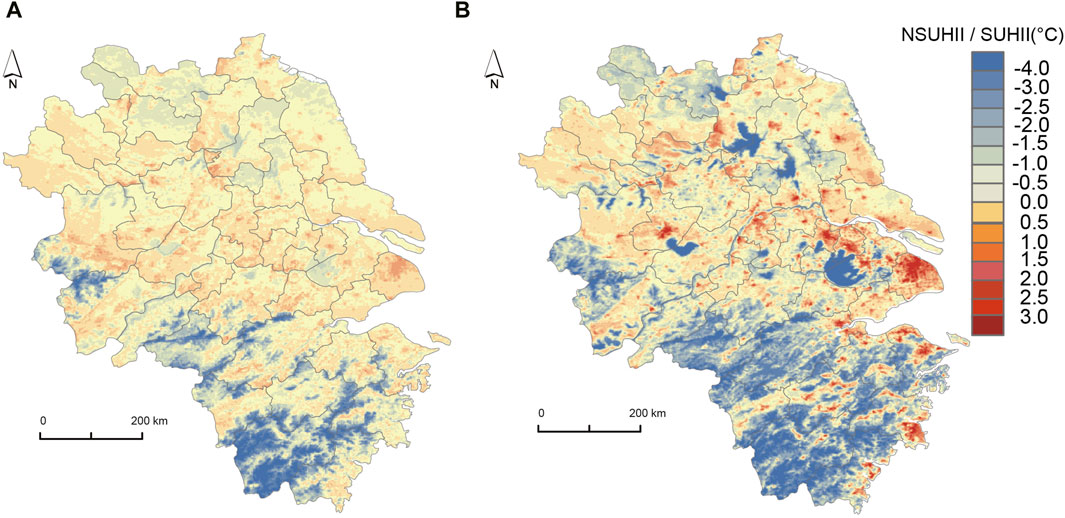
Figure 4. Spatial distributions of NSUHII (A) and SUHII (B) during 2001–2018.
Previous studies have demonstrated that the LST and air temperature are both representations of thermal environment, which impact each other through the land-atmosphere interaction. To better understand the relationship between the SUHII and NSUHII, this study calculates the annual mean differences and monthly correlation coefficient (R) between the two. Figure 5A reveals that in most areas, the annual mean SUHII is higher than the annual mean NSUHII, with the major differences ranging from 0°C to 2°C. The instances where the NSUHII is significantly higher than the SUHII (−2∼ −6°C) are mainly observed in areas with water bodies as the dominant land cover. The reason may be that the cooling effect of water bodies on the LST is relatively direct and pronounced, while the air temperature above water bodies is regulated by the process of latent heat exchange through evaporation, which is relatively indirect and slow. It is also evident that pixels with the SUHII significantly higher than the NSUHII are mainly located in the central urban areas of the core cities in the YRD region (Shanghai, Wuxi, Hangzhou, etc.). Due to the rapid urbanization in these regions, the impervious surfaces are rapidly expanded, which also leads to a great difference between the SUHII and NSUHII. The largest differences between the two are found in summer, while their values are relatively similar in winter, as shown in Supplementary Figure S3. The seasonal variation is also related to the increase in total radiation in summer. The increase in radiation results in the enhanced radiation absorbed by impervious surfaces, leading to a significant LST increase. However, the increase in radiation has no significant impact on the air temperature increase, thereby causing a larger difference between the two in summer.
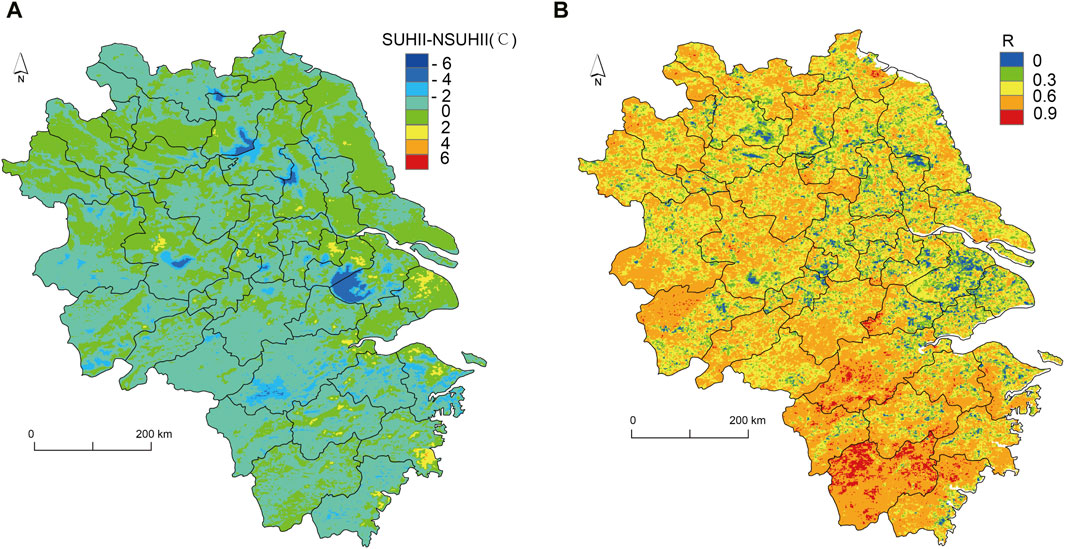
Figure 5. (A) Spatial distribution of differences between the annual mean SUHII and NSUHII during 2001–2018. (B) Spatial distribution of correlation coefficients between the annual SUHII and NSUHII from 2001 to 2018.
Figure 5B displays the spatial distribution of R between annual mean SUHII and NSUHII in the study area from 2001 to 2018. In terms of the R between annual mean SUHII and NSUHII, it is found that the SUHII and NSUHII are positively correlated in most regions, with the R values being rather high (R > 0.6). The R values larger than 0.9 are primarily in the southern part of the study area, mainly caused by the higher values in spring (Supplementary Figure S4). In contrast, the R values are smaller (0 < R < 0.3) in the core cities of the YRD region, indicating that there is a certain degree of correlation in the temporal variation between the SUHII and NSUHII in this region, but there are still some differences. The correlations are the weakest in winter, while strongest in spring (Supplementary Figure S4). It is attributed to the fact that the atmospheric circulation that affects the energy transfer between the surface and near-surface is relatively weaker in winter, resulting a weaker interaction between SUHII and NSUHII. While in summer, the temperature background field is too dominant, diminishing the influence of LST on air temperature. In contrast, the temperature background field is weaker in spring, and the temperature fluctuations are pronounced, resulting in the strongest values.
To better understand the variation characteristics in the long-term time series of NSUHII and SUHII as well as the differences in between, the Theil-Sen slopes of NSUHII and SUHII during 2001–2018 are calculated in the study area, as shown in Figure 6. Positive (negative) trends indicate that the warming rate of air temperature in pixels is higher (lower) than that of corresponding pixels under agricultural background.
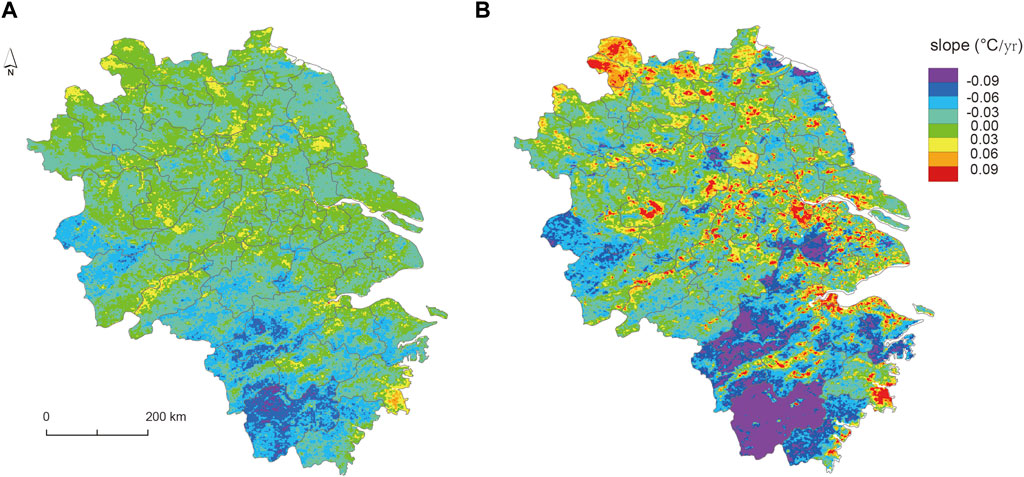
Figure 6. Spatial distributions for Theil-Sen slopes of annual average NSUHII (A) and SUHII (B) from 2001 to 2018.
In the study area, the variation trends of NSUHII present an uneven distribution, with most regions showing relatively weak warming trends (0–0.03°C/yr). Specifically, the warming trends in most of the northern part are slightly higher than those of farmland background areas. Regions with a rapid increase (0.03–0.09°C/yr) in NSUHII are scatteredly distributed in a few areas of each city. Particularly, the areas with rapid increases (>0.09°C/yr) in NSUHII are mainly located in parts of Chizhou and Taizhou Cities in the central and southern parts of the study area, suggesting that the warming rates in these areas are significantly higher than those of farmland background areas. Areas with a cooling trend are mainly found in mountainous regions, with the trend values exceeding −0.06°C/yr.
Compared with the NSUHII, the urban heat island phenomenon is more pronounced in terms of surface temperature than near-surface temperature. The variation trends of SUHII are more significant in urban, mountainous and aquatic areas, resulting in greater spatial distribution differences. Approximately half of the study area exhibits an increasing trend in UHI effects, regions with increasing trends higher than 0.06°C/yr are mainly located in the northern, middle and part of the southern area. The SUHII with the highest warming trend is found in Hefei City, reaching 0.42°C/yr, while the fastest cooling trend is observed in the Taihu region of Suzhou City, reaching −0.24°C/yr. The large variation trends in the SUHII may be associated with changes in vegetation cover. During 2001–2018, as the urbanization accelerates, some vegetation is replaced by impervious surface, which in turn accelerates the changes in SUHII.
Concerning the different urban sizes, population levels, city area and urban built-up area (Table 2), three cities-Shanghai, Wuxi and Jiaxing are selected as typical urban areas. The differences between NSUHII and SUHII variations in these three typical areas are further investigated, as shown in Figure 7.
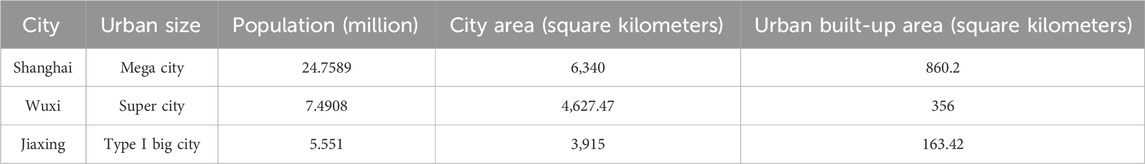
Table 2. Information of three typical urban areas (2023).
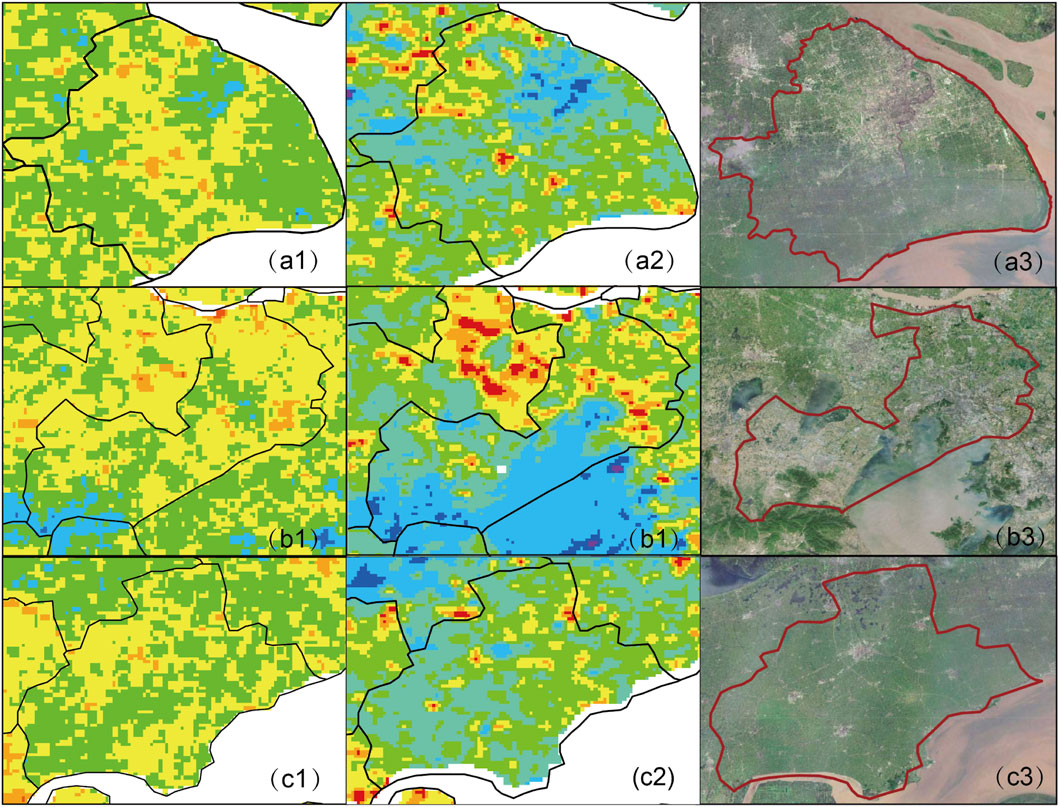
Figure 7. Spatial distributions for Theil-Sen slopes of the multi-year average NSUHII (A1,B1,C1) and SUHII in typical cities in the YRD region from 2001 to 2018 (A2,B2,C2) and corresponding remote sensing images (A3,B3,C3).
According to the remote sensing images (Figure 7A3), the central urban area of Shanghai City exhibits relatively smaller variation trends of NSUHII (Figure 7A1) and SUIHII (Figure 7A2). Various factors may contribute to this phenomenon, such as the increase in green areas within the central urban area and the reconstruction of old urban districts in mega-cities like Shanghai, leading to a decrease in the warming rate within the central urban area.
For Wuxi City, deviations are observed between the distribution of NSUHII and SUHII. While most areas exhibit a slow warming rate (0.03–0.06°C/yr) in the NSUHII (Figure 7B1), the SUHII (Figure 7B2) in the central urban area shows a significantly larger warming trend (0.06–0.12°C/yr) than the areas outside the central urban region and water bodies. Wuxi City is one of the top 10 cities by gross domestic product in the YRD region, and its central urban area has undergone rapid development over the past 2 decades. The slow warming trend in the NSUHII demonstrating that the urbanization in Wuxi City has not had a significant impact on the NSUHII.
In Jiaxing City, the variation trends of NSUHII (Figure 7C1) and SUHII (Figure 7C2) in the central urban area are comparable to those outside the central urban area, with some regions showing a weak warming trend. This phenomenon may be attributed to the fact that Jiaxing City belongs to Type I large city, which has a smaller population and slower economic development in comparison to mega-cities.
Overall, over the past 2 decades, both near-surface and surface UHI effects in the study area have been developing intensely and exhibit an obvious increase trend. The areas with the largest increase rates are not necessarily the most developed regions but rather the fastest developing ones. The increase rate of near-surface NSUHII is smaller than that of SUHII.
Generally, most UHI effect is monitored by satellite remote sensing, which spatial distribution and trends have been widely studied on global, regional and city scale. The study of near-surface UHI effect is normally studied using air temperature data from meteorological stations at 2 m above the ground due to the lack of data. In this study, a spatialization method suitable for air temperature in complex and highly urbanized areas is determined. The RF-based estimation method has good accuracy and outperforms three other remote sensing estimation methods. Hence, it serves as an ideal high-resolution air temperature dataset for studying the UHI effects. This method retains the advantages of station observations in terms of temporal resolution and high precision, and makes up for its disadvantage of spatial discontinuity, thereby achieving good gridding effect. Previous studies also use several machine learning methods for air temperature estimation in different places, however, the estimation accuracies were not as good as this study (Yao et al., 2021). For example, (Yang et al., 2023), also used SVM and RF methods in air temperature estimation in China. Though RF and SVM outperform other methods in in Yang’s study, MAE and RMSE values for RF (RMSE = 2.01, MAE = 1.36) and SVM (RMSE = 2.33, MAE = 1.58) are still larger than results in this study. With the development of machine learning techniques, new deep learning models such as long short-term memory (LSTM) and XGboost are continually emerging (Reichstein et al., 2019; Amato et al., 2020; Yang et al., 2023). Meanwhile, the dense observation stations and new remote sensing data lay the foundations for further enhancing the accuracy of gridded datasets of air temperature. Therefore, research on near-surface UHI effects based on station observed air temperature should move towards the way of greater precision and refinement (Liu et al., 2021; Bird et al., 2022).
The spatial distributions and temporal variations of near-surface UHIs and surface UHIs are quite consistent. Although the SUHII and NSUHII are closely related, there are still certain differences especially in the rapidly expanding urban areas and in summer. The SUHII is mainly influenced by surface properties, including vegetation cover, reflectance and anthropogenic heat, whereas the NSUHII is influenced not only by surface properties but also by meteorological elements under local climate (Arnfield, 2003; Liu et al., 2020). Previous studies have suggested that both SUHII and NSUHII can be used to characterize human comfort, but the NSUHII is a more accurate representation (Yao et al., 2021). In addition, the continuous increase in thermal environments exerts pressure on human health and energy consumption (Zhang et al., 2023), which thus should be given enough attention. Therefore, more attention should be paid to the study of NSUHII and driving factors so as to find applicable mitigation strategies. Previous studies generally analyzed the NSUHII and SUHII effect based on several meteorological stations to represent the air temperature of the entire urban or rural area (Sun et al., 2020; Hu et al., 2019). However, this kind of comparison may cause great uncertainty considering the location and number of stations.
This study only focuses on the UHI effect with respect to daily maximum air temperature, without considering daily minimum air temperature or nighttime UHI effects. However, numerous studies have shown that there are significant differences between nighttime and daytime UHI effects (Sun et al., 2020). Therefore, relevant research can be conducted on the nighttime UHI effect in the future.
In this study, a spatialization method suitable for air temperature in complex and highly urbanized areas is determined. Specifically, the 1-km gridded air temperature data derived from RF method and LST data from the Moderate-resolution Imaging Spectroradiometer are used to analyze the spatial distribution characteristics of NSUHII and SUHII in the YRD region over the past 2 decades. The results show that both the NSUHII and SUHII are rather strong in the study area over the past 20 years, presenting similar spatial distributions. The situation that the NSUHII is higher than the SUHII with significant differences appears over water bodies, while the situation of SUHII higher than the NSUHII is often found in the core areas of rapidly urbanizing cities in the YRD, and the differences are more prominent in summer. Although there is a certain degree of correlation between the temporal variations of SUHII and NSUHII, some discrepancies still exists. Notably, the R values between them are relatively lower in the core areas of rapidly urbanizing cities in the Yangtze River Delta region, with the lowest in winter. From 2001 to 2018, most areas in the study region witnessed an increase in both NSUHII and SUHII, especially in regions with rapid urbanization. However, the area with the largest increase rate is not necessarily the most developed region but the fastest developed one. In well-developed cities, the increase rates in the central urban areas are lower than those in the surrounding regions.
The raw data supporting the conclusion of this article will be made available by the authors, without undue reservation.
XS: Writing–original draft, Writing–review and editing. MS: Validation, Visualization, Writing–original draft. XL: Conceptualization, Writing–review and editing.
The author(s) declare that financial support was received for the research, authorship, and/or publication of this article. This research was funded by Jiangsu Province Marine Science and Technology Innovation Project (JSZRHYKJ202307) and Jiangsu Meteorological Bureau Scientific research project (KM202408 and KZ202303).
The authors declare that the research was conducted in the absence of any commercial or financial relationships that could be construed as a potential conflict of interest.
All claims expressed in this article are solely those of the authors and do not necessarily represent those of their affiliated organizations, or those of the publisher, the editors and the reviewers. Any product that may be evaluated in this article, or claim that may be made by its manufacturer, is not guaranteed or endorsed by the publisher.
The Supplementary Material for this article can be found online at: https://www.frontiersin.org/articles/10.3389/fenvs.2024.1387672/full#supplementary-material
Abbas, W., and Ismael, H. (2020). Assessment of constructing canopy urban heat island temperatures from thermal images: an integrated multi-scale approach. Sci. Afr. 10, e00607. doi:10.1016/j.sciaf.2020.e00607
Aliyazıcıoğlu, K., Beker, F., Topaloğlu, R. H., Bilgilioğlu, B. B., and Çömert, R. (2021). Temporal monitoring of land use/land cover change İn Kahramanmaraş City. Turkish J. Eng. 5 (3), 134–140. doi:10.31127/tuje.707156
Amato, F., Guignard, F., Robert, S., and Kanevski, M. (2020). A novel framework for spatio-temporal prediction of environmental data using deep learning. Sci. Rep. 10 (1), 22243–22311. doi:10.1038/s41598-020-79148-7
Anniballe, R., Bonafoni, S., and Pichierri, M. (2014). Spatial and temporal trends of the surface and air heat island over Milan using MODIS data. Remote Sens. Environ. 150, 163–171. doi:10.1016/j.rse.2014.05.005
Arnfield, A. J. (2003). Two decades of urban climate research: a review of turbulence, exchanges of energy and water, and the urban heat island. Int. J. Climatol. 23 (1), 1–26. doi:10.1002/joc.859
Bird, D. N., Banzhaf, E., Knopp, J., Wu, W., and Jones, L. (2022). Combining spatial and TemporalData to create a fine-resolution daily urban air temperature product from remote sensing land surface temperature (LST) data. Atmosphere 13, 1152. doi:10.3390/atmos13071152
Chen, L., Jiang, R., and Xiang, W. N. (2016). Surface heat island in Shanghai and its relationship with urban development from 1989 to 2013. Adv. Meteorology 2016, 1–15. doi:10.1155/2016/9782686
Chen, Y., Liang, S., Ma, H., Li, B., He, T., and Wang, Q. (2021). An all-sky 1 km daily land surface air temperature product over mainland China for 2003-2019 from MODIS and ancillary data. Earth Syst. Sci. Data 13, 4241–4261. doi:10.5194/essd-13-4241-2021
Han, J., Liu, J., Liu, L., and Ye, Y. (2020). Spatiotemporal changes in the urban heat island intensity of distinct local climate zones: case study of zhongshan district, dalian, China. Complexity 2020, 1–9. doi:10.1155/2020/8820338
Hu, Y., Hou, M., Jia, G., Zhao, C., Zhen, X., and Xu, Y. (2019). Comparison of surface and canopy urban heat islands within megacities of eastern China. ISPRS Journal of Photogrammetry and Remote Sensing 156, 160–168.
Hu, Y., Li, H., Amir Siddique, M., and Liu, D. (2023). Assessing the impact of spatiotemporal land cover changes on the urban heat islands in developing cities with landsat data: a case study in zhanjiang. Atmosphere 14, 1716. doi:10.3390/atmos14121716
Hua, W. J., and Chen, H. S. (2013). Impacts of regional-scale land use/land cover change on diurnal temperature range. Adv. Clim. Change Res. 4, 166–172. doi:10.3724/SP.J.1248.2013.166
Imhoff, M. L., Zhang, P., Wolfe, R. E., and Bounoua, L. (2010). Remote sensing of the urban heat island effect across biomes in the continental USA. Remote Sens. Environ. 114, 504–513. doi:10.1016/j.rse.2009.10.008
Jin, X., Jiang, P., Du, H., Chen, D., and Li, M. (2021). Response of local temperature variation to land cover and land use intensity changes in China over the last 30 years. Clim. Change 164 (3–4), 34–20. doi:10.1007/s10584-021-02955-y
Krayenhoff, E. S., Moustaoui, M., Broadbent, A. M., Gupta, V., and Georgescu, M. (2018). Diurnal interaction between urban expansion, climate change and adaptation in US cities.Nat. Clim. Change 8 (12), 1097, 1103. doi:10.1038/s41558-018-0320-9
Li, X., Zhou, Y., Zhao, M., and Zhao, X. (2020). A harmonized global nighttime light dataset 1992–2018. Sci. Data 7 (1), 168–169. doi:10.1038/s41597-020-0510-y
Liu, K., Li, X., Wang, S., and Li, Y. (2020). Investigating the impacts of driving factors on urban heat islands in southern China from 2003 to 2015. J. Clean. Prod. 254, 120141. doi:10.1016/j.jclepro.2020.120141
Liu, Y., Xu, Y., Weng, F., Zhang, F., and Shu, W. (2021). Impacts of urban spatial layout and scale on local climate: a case study in Beijing. Sustain. Cities Soc. 68 (January), 102767. doi:10.1016/j.scs.2021.102767
Liu, Y. H., Fang, X., Xu, Y., Zhang, S., and Luan, Q. (2017). Assessment of surface urban heat island across China ’ s three main urban agglomerations. Theor. Appl. Climatol. 133, 473–488. doi:10.1007/s00704-017-2197-3
Lou, D., Shi, X., Ullah, W., Shi, D., Li, C., Chai, Y., et al. (2023). Long-term changes in observed soil temperature over Poyang Lake Basin, China, during 1960–2016. Theor. Appl. Climatol. 154, 717–731. doi:10.1007/s00704-023-04522-0
Lu, W., Zhang, D., Ren, Q., Qi, T., and He, C. (2023). Impacts of future urban expansion on natural habitats will intensify in China: scenario analysis with the improved LUSD-urban model. Landsc. Ecol. 38, 2547–2567. doi:10.1007/s10980-023-01740-9
Luo, F., Yang, Y., Zong, L., and Bi, X. (2023). The interactions between urban heat island and heat waves amplify urban warming in Guangzhou, China: roles of urban ventilation and local climate zones. Front. Environ. Sci. 11, 1084473. doi:10.3389/fenvs.2023.1084473
Manley, G. (1959). On the frequency of snowfall in metropolitan England. Q. J. R. Meteorological Soc. 84, 70–72. doi:10.1002/qj.49708435910
Meng, F., Yan, S., Tian, G., and Wang, Y. (2023). Surface urban heat island effect and its spatiotemporal dynamics in metropolitan area: a case study in the Zhengzhou metropolitan area, China. Front. Environ. Sci. 11, 1247046. doi:10.3389/fenvs.2023.1247046
Morsy, S., and Hadi, M. (2022). Impact of land use/land cover on land surface temperature and its relationship with spectral indices in Dakahlia Governorate, Egypt. Int. J. Eng. Geosciences 7 (3), 272–282. doi:10.26833/ijeg.978961
Nanayakkara, S., Wang, W., Cao, J., Wang, J., and Zhou, W. (2023). Analysis of urban heat island effect, HeatStress and public health in colombo,Sri Lanka and shenzhen, China. Atmosphere 14, 839. doi:10.3390/atmos14050839
Niu, L., Tang, R., Jiang, Y., and Zhou, X. (2020). Spatiotemporal patterns and drivers of the surface urban heat island in 36 major cities in China: a comparison of two different methods for delineating rural areas. Sustainability 12, 478. doi:10.3390/su12020478
Oke, T. R. (1982). The energetic basis of the urban heat island. Q. J. R. Meteorological Soc. 108 (455), 1–24. doi:10.1002/qj.49710845502
Parry, M., and Chandler, T. J. (1966). The climate of london. Geogr. Journa 132 (1), 84. doi:10.2307/1793062
Peng, J., Xie, P., Liu, Y., and Ma, J. (2016). Urban thermal environment dynamics and associated landscape pattern factors: a case study in the Beijing metropolitan region. Remote Sens. Environ. 173, 145–155. doi:10.1016/j.rse.2015.11.027
Ramakreshnan, L., Aghamohammadi, N., Fong, C. S., Ghaffarianhoseini, A., Wong, L. P., and Sulaiman, N. M. (2019). Empirical study on temporal variations of canopy-level Urban Heat Island effect in the tropical city of Greater Kuala Lumpur. Sustain. Cities Soc. 44 (November 2018), 748–762. doi:10.1016/j.scs.2018.10.039
Reichstein, M., Camps-Valls, G., Stevens, B., Jung, M., Denzler, J., Carvalhais, N., et al. (2019). Deep learning and process understanding for data-driven Earth system science. Nature 566 (7743), 195–204. doi:10.1038/s41586-019-0912-1
Sen, P. K. (1968). Estimates of the regression coefficient based on kendall's tau. J. Am. Stat. Assoc. 63 (324), 1379–1389. doi:10.1080/01621459.1968.10480934
Shahmohamadi, P., Che-Ani, A. I., Maulud, K. N. A., Tawil, N. M., and Abdullah, N. A. G. (2011). The impact of anthropogenic heat on formation of urban heat island and energy consumption balance. Urban Stud. Res. 2011, 1–9. doi:10.1155/2011/497524
Shi, T., Liu, L., Wen, X., and Qi, P. (2024). Research progress on the synergies between heat waves and canopy urban heat island and their driving factors. Front. Environ. Sci. 12, 1363837. doi:10.3389/fenvs.2024.1363837
Shi, X., Xu, Y., Wang, G., Liu, Y., Wei, X., and Hu, X. (2021). Spatiotemporal variations in the urban heat islands across the coastal cities in the Yangtze River Delta, China. Mar. Geod. 44 (5), 467–484. doi:10.1080/01490419.2021.1897716
Su, Z., De Rosnay, P., Wen, J., Wang, L., and Zeng, Y. (2013). Evaluation of ECMWF’s soil moisture analyses using observations on the Tibetan Plateau. J. Geophys. Res. Atmos. 118 (11), 5304–5318. doi:10.1002/jgrd.50468
Sun, T., Sun, R., and Chen, L. (2020). The trend inconsistency between land surface temperature and near surface air temperature in assessing Urban heat island effects. Remote Sens. 12 (8), 1271. doi:10.3390/RS12081271
Sun, Y., Gao, C., Li, J., Wang, R., and Liu, J. (2019). Evaluating urban heat island intensity and its associated determinants of towns and cities continuum in the Yangtze River Delta Urban Agglomerations. Sustain. Cities Soc. 50 (January), 101659. doi:10.1016/j.scs.2019.101659
Svilicic, P., Vucetic, V., Filic, S., and Smolic, A. (2016). Soil temperature regime and vulnerability due to extreme soil temperatures in Croatia. Theor. Appl. Climatol. 126, 247–263. doi:10.1007/s00704-015-1558-z
Topaloglu, R. H. (2022). Investigation of Land Use/Land Cover change in Mersin using geographical object-based image analysis (GEOBIA). Adv. Remote Sens. 2 (2), 40–46. Available at: https://publish.mersin.edu.tr/index.php/arsej/article/view/247.
Wang, H., Yue, C., and Luyssaert, S. (2023). Reconciling different approaches to quantifying land surface temperature impacts of afforestation using satellite observations. Biogeosciences 20, 75–92. doi:10.5194/bg-20-75-2023
Wang, J., Qingming, Z., Guo, H., and Jin, Z. (2016). Characterizing the spatial dynamics of land surface temperature–impervious surface fraction relationship. Int. J. Appl. Earth Observation Geoinformation 45, 55–65. doi:10.1016/j.jag.2015.11.006
Wang, Z., Meng, Q., Allam, M., Hu, D., Zhang, L., and Menenti, M. (2021). Environmental and anthropogenic drivers of surface urban heat island intensity: a case-study in the Yangtze River Delta, China. Ecol. Indic. 128, 107845. doi:10.1016/j.ecolind.2021.107845
Xiong, J., Thenkabail, P. S., Gumma, M. K., Teluguntla, P., Poehnelt, J., Congalton, R. G., et al. (2017). Automated cropland mapping of continental Africa using Google Earth Engine cloud computing. ISPRS J. Photogrammetry Remote Sens. 126, 225–244. doi:10.1016/j.isprsjprs.2017.01.019
Yang, C., Yan, F., and Zhang, S. (2020). Comparison of land surface and air temperatures for quantifying summer and winter urban heat island in a snow climate city. J. Environ. Manag. 265 (March), 110563. doi:10.1016/j.jenvman.2020.110563
Yang, D., Zhong, S., Mei, X., Ye, X., Niu, F., and Zhong, W. (2023). A comparative study of several popular models for near-land surface air temperature estimation. Remote Sens. 15 (4), 1136. doi:10.3390/rs15041136
Yang, J., and Huang, X. (2021). The 30 m annual land cover dataset and its dynamics in China from 1990 to 2019. Earth Syst. Sci. Data 13 (8), 3907–3925. doi:10.5194/essd-13-3907-2021
Yang, Y., and Pan, P. (2011). Research on the impact of impervious surface area on urban heat island in Jiangsu Province. Int. Symposium Lidar Radar Mapp. 2011 Technol. Appl. 8286, 82861P. doi:10.1117/12.912517
Yao, L., Sun, S., Song, C., Li, J., Xu, W., and Xu, Y. (2021a). Understanding the spatiotemporal pattern of the urban heat island footprint in the context of urbanization, a case study in Beijing, China. Appl. Geogr. 133 (June), 102496. doi:10.1016/j.apgeog.2021.102496
Yao, R., Wang, L., Huang, X., Li, L., Sun, J., Wu, X., et al. (2020). Developing a temporally accurate air temperature dataset for Mainland China. Sci. Total Environ. 706, 136037. doi:10.1016/j.scitotenv.2019.136037
Yao, R., Wang, L., Huang, X., Liu, Y., Niu, Z., Wang, S., et al. (2021b). Long-term trends of surface and canopy layer urban heat island intensity in 272 cities in the mainland of China. Sci. Total Environ. 772, 145607. doi:10.1016/j.scitotenv.2021.145607
Yao, R., Wang, L., Huang, X., Zhang, W., Li, J., and Niu, Z. (2018). Interannual variations in surface urban heat island intensity and associated drivers in China. J. Environ. Manag. 222, 86–94. doi:10.1016/j.jenvman.2018.05.024
Zeng, Y., Qiu, X. F., and Liu, S. M. (2005). Distributed modeling of extraterrestrial solar radiation over rugged terrains. Chin. J .Geophys Chin. 48 (5), 1028–1033.
Zhang, J., Tu, L., and Shi, B. (2023a). Spatiotemporal patterns of the application of surface urban heat island intensity calculation methods. Atmosphere 14, 1580. doi:10.3390/atmos14101580
Keywords: air temperature estimation, land surface temperature, random forest, urban heat island, remote sensing
Citation: Shi X, Sun M and Luo X (2024) Comparative analysis of near-surface and surface urban heat islands in the Yangtze River Delta region. Front. Environ. Sci. 12:1387672. doi: 10.3389/fenvs.2024.1387672
Received: 18 February 2024; Accepted: 08 April 2024;
Published: 21 May 2024.
Edited by:
Haipeng Yu, Chinese Academy of Sciences (CAS), ChinaReviewed by:
Murat Yakar, Mersin University, Mersin, TürkiyeCopyright © 2024 Shi, Sun and Luo. This is an open-access article distributed under the terms of the Creative Commons Attribution License (CC BY). The use, distribution or reproduction in other forums is permitted, provided the original author(s) and the copyright owner(s) are credited and that the original publication in this journal is cited, in accordance with accepted academic practice. No use, distribution or reproduction is permitted which does not comply with these terms.
*Correspondence: Xiaochun Luo, bnRseGM5QDE2My5jb20=
Disclaimer: All claims expressed in this article are solely those of the authors and do not necessarily represent those of their affiliated organizations, or those of the publisher, the editors and the reviewers. Any product that may be evaluated in this article or claim that may be made by its manufacturer is not guaranteed or endorsed by the publisher.
Research integrity at Frontiers
Learn more about the work of our research integrity team to safeguard the quality of each article we publish.