 Amare Haileslassie*
 Meron Teferi Taye
 Wolde Mekuria
- 1International Water Management Institute, Addis Ababa, Ethiopia
- 2Farm Africa, Addis Ababa, Ethiopia
The Bale Ecoregion (BER) is known for its global importance in biodiversity and as a water tower for East African drylands. Land use and land covers (LULC) have been changing for decades, affecting forest ecosystem service values (ESVs), but available information is limited. The present study addresses these gaps by using contrasting watersheds representing the highland, midland, and lowland agroecologies in the BER. LULC classifications were performed using GIS and remote sensing tools. Multisite imagery data (using Landsat image resolution 30 m × 30 m) were generated for four observation periods: 1992, 2002, 2012, and 2022. A recently updated global ESV coefficient and the value transfer valuation method were applied to estimate the changes in ESVs related to LULC changes. The result demonstrates that between 1992 and 2022, forest land has decreased by 3%, 63%, and 22% in the highland, midland, and lowland areas, respectively. Different degrees of loss of ESVs were observed across the study periods and LULC. Of the 21 specific ESVs investigated, the highest annual losses were recorded for water ecosystem services both in the midland and lowland landscape positions. Increased ESVs for cultivated land could not offset losses in food ESVs at the scale of agroecology. Significant impacts of LULC changes on specific ecosystem services, such as water, and changes in natural connectivity between the highland and lowland areas were observed. The result suggests that stakeholders need to co-plan and manage the BER. This evidence provides a scientific underpinning for understanding the connection between LULC change and ESVs and supports informed policy decisions.
1 Introduction
Land use and land cover (LULC) change across scales is gaining increasing attention (Spruce et al., 2020). Land use refers to the main functional role (cropland, coffee agroforestry, and grazing land for livestock production) of land. Land cover denotes its natural/manmade physical attributes (e.g., forest and grassland) (Nanda et al., 2014). Change refers to the conversion/alteration of its uses/attributes due to human intervention (Gashaw et al., 2018a; Abdul Athick and Hankar, 2019). The major conversion observed within Sub-Saharan countries is from forests, shrubs and grasslands, and alpine vegetation to cropland (Nanda et al., 2014; Regasa, et al., 2021). For instance, Foley et al. (2011) also noted that approximately 40% of the earth’s land surface is in agricultural use. Godfray et al. (2010) reported that to meet the soaring global food demand, agricultural production must increase by 70%–100% by 2050. This means that, with the current trend, associated LULC changes will place substantial pressure on ecosystem service values (ESVs) (Foley et al., 2011).
Land use and land cover form one of the important structures of a landscape ecosystem (Tolessa et al., 2017). Landscape structure and functions are highly interconnected. The landscape structure shapes several ecosystem functions (Debie and Awoke, 2023), including provisioning (such as the production of food and water), regulating (control of climate and disease), supporting (nutrient cycles and oxygen production), and cultural (spiritual and recreational benefits) (Tolessa et al., 2017; Haileslassie et al., 2020; Mekuria et al., 2021; Mengist et al., 2022). The degree of soil degradation, runoff, carbon emissions, and decreasing productivity (examples of ESVs) depends on LULC. In this regard, Haileslassie et al. (2020) suggested that land use and land cover (e.g., cultivated, forest lands, soil and water conservation, and water harvesting) are secondary landscape structures.
Hailemariam et al. (2016), Haileslassie et al. (2020), and Regasa et al. (2021) reported that there are substantial LULC changes in Ethiopia. However, the magnitude with which these changes impact the state of the ecosystem and its services in Sub-Saharan Africa (SSA) is not documented sufficiently or limited to a few ESVs (Debie, and Awoke, 2023).
The deforestation rate in Africa is three times greater than the global figure (ADB, 2011). Growing population pressure coupled with reduced agricultural land productivity exacerbates the land cover conversion rate (Bilsborrow, 1992). Unsustainable agricultural practices are one of the chief causes of severe land degradation, leading to a vicious circle of poverty through the reduced availability of natural goods and services of ecosystems (Olsson et al., 2005; UNEP, 2012; Gashaw et al., 2018b). Consequently, poor farmers are abandoning their existing degraded cropland and are extending cultivation to other land use types, and, in turn, their livelihoods are highly vulnerable to environmental and climate change shocks (Scherr, 2000; UNEP, 2012).
Ethiopia’s forest land cover, as indicated in EFAP (1994), has plummeted from 35%–40% to 2.7% from the outset of the 19th century to the early 1990s. Recent estimates by the Global Forest Watch indicated that in 2010, Ethiopia had 12.4 million ha of tree cover, extending over 11% of its land area. In 2022, it lost 19.9 kha of tree cover, equivalent to 17.7 Mt of CO2 emissions. Despite changing forest cover, major types of natural vegetation still widely persist in Ethiopia, ranging from thorny bushes to tropical forests and mountain vegetation (Othow et al., 2017). Currently, there are efforts in Ethiopia, such as the Reduction of Emission from Deforestation and Degradation (REDD+), the country’s voluntary commitment to the Bonn Challenge, and the “green legacy”— the project to plant four billion trees to restore forest land (Melnikova et al., 2007; Kibret et al., 2020).
In the mountainous part of the Bale Ecoregion (BER), as reported by Hailemariam et al. (2016), forest cover reduced by 3.28% during 1985–2015, whereas farmlands expanded by 7.76%. This rate of deforestation, which aggregates the different agroecologies (highland, midland, and lowland), is much lower than the deforestation rate reported by many studies conducted in Ethiopia. For example, since the 1950s, in the Lake Tana sub-basin watersheds, farmlands and settlements expanded by 57.7%; shrubs, forests, and grasslands decreased by 18.6, 83.8, and 53.5%, respectively (Hassen and Assen, 2018). In the Gog district of the Gambella regional state of Ethiopia, the annual deforestation rate since 2002 was recorded to be 1.45% per annum (Othow et al., 2017). In the Bilate Alaba sub-watershed of southern Ethiopia, cultivated land has expanded by 67.38% over the past 45 years (Godebo et al., 2018). In the Chirokella micro-watershed of southeastern Ethiopia, the dense forest cover decreased by over 80% (Assen and Nigussie, 2009). The doubt remains as to the magnitude of losses of the ESVs under such LULC changes and the variation of changes among different agroecologies and policy implications.
While many studies conducted in Ethiopia have often focused on a particular aspect of deforestation, they lack illustrating ESV changes in the context of the driver–pressure–state–impact–response (DPSIR) framework (Kewessa et al., 2019) to provide policy recommendations. Moreover, there are very few comprehensive studies on ESVs across ecoregions under different historical time series, and existing literature often does not account for the connectivity of sub-regions (highland, midland, and lowland) through ecosystem service flows (Tolessa et al., 2017). In this regard, Luedeling et al. (2011) reported that, regionally, there are gaps in the evidence on ESV estimation in the highly heterogeneous landscapes of the East African highland.
The Bale Ecoregion is well-known for its global importance in biodiversity and its numerous ecosystem services—it serves as the water tower for approximately 12 million people in the drier part of East Africa, as over 40 streams drain to the southern drainage system of Oromia and Somali regional states of Ethiopia, the Republic of Somalia, and North Kenya (FZS, 2007). Negative pressures impacting natural resources are a consequence of the increasing demand for food and biomass-based household energy in the BER (Bilsborrow, 1992; FARM Africa, 2008; Green et al., 2022). The sharp upsurge in demand for food can be met either by extensification or intensification. Of these, extensification offers inadequate options in the BER due to limited land and legal restrictions on deforestation. Under such circumstances, as suggested by Abate (2011), detecting LULC change and its implication on ESVs in the context of the driver–pressure–state–impact–response framework is important for understanding the context and planning sustainable intensification pathways to attain the food security SDG in SSA (Haileslassie et al., 2022; Kremen, 2015; Phalan et al., 2011). Thus, the objectives of this study were i) to provide empirical evidence on the LULC conversion magnitude, rate, and pattern of change across time and space for the three study watersheds in the BER and ii) to estimate the LULC conversion effect on ESVs and synthesize its implications for sustainable management.
2 Methodology
2.1 Study area description
The BER is found in the Oromia region1, Bale, and West Arsi zones in Ethiopia and consists of 16 woredas. It covers a total land area of approximately 38,036 km2 (Table 1). It spans across an altitude of 272 m above sea level (masl) in the south to 4,377 masl in the north, which influences the diversity of climate in the BER. Based on the agroecological (traditional altitude belt) system classification offered by Hurni (1998), Ethiopia’s altitude range and rainfall are used as proxy indicators to define agroecological zones, i.e., Wurch and Dega (highland), Woyna-Dega (midland), Kolla (lowland), and Bereha (dry lowland)
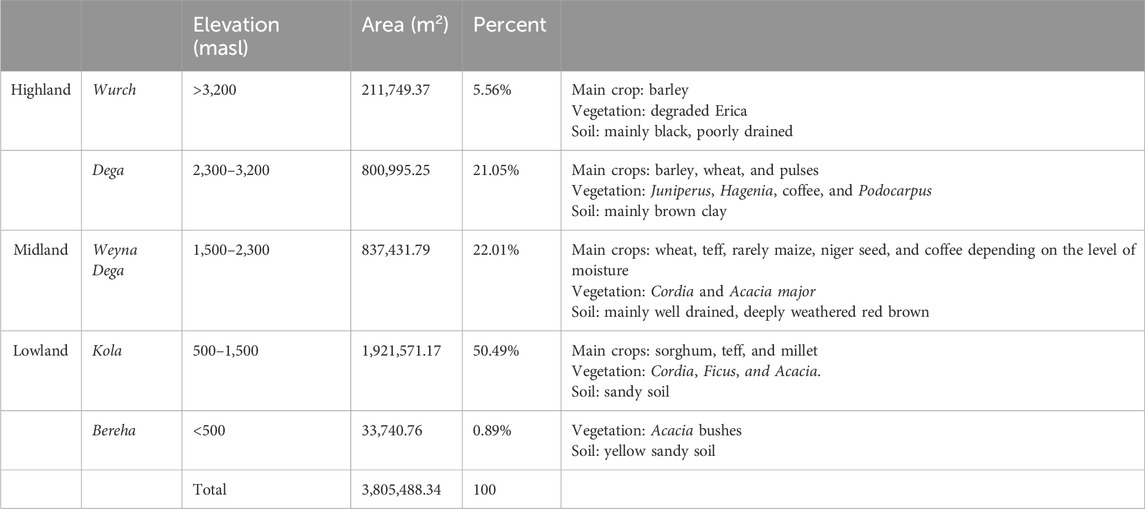
Table 1. Agroecological classification of land areas in the Bale Ecoregion based on the classes of Hurni (1998).
The BER is the source of about 40 springs and discharges to two international river basins—Genale and Wabi Shebelle rivers—flowing to Somalia and Kenya. As a result, the BER is known as a water tower in the dry lowlands (see Table 1).
There are five agroecological zones in the BER. Kola is the drier and has the largest agroecology (covering 50.49% of the BER), followed by -Wona Dega, Dega, Wurch, and Bereha in that order of area extent (Table 1). In the BER, in Wona-Dega and Dega agroecology, a mixed crop–livestock system is practiced, while in Kola, pastoral and agropastoral systems dominate. Bereha and Wurch have temperature and moisture limitations and, thus, are of limited use for agriculture (Hurni, 1998).
This study focuses on three watersheds: Bekaye, Hawao, and Hora Soba, representing the lowland, midland, and highland agroecological zones, respectively (Figure 1). The sizes of the Bekaye, Hawao, and Hora Soba watersheds are 502, 293, and 1,048 ha, respectively. These watersheds were selected as model watersheds for longer-term landscape management intervention, and sediment and water discharge measurements are ongoing following soil and water conservation interventions by a project called “Supporting the Horn of Africa’s Resilience” (SHARE BER).
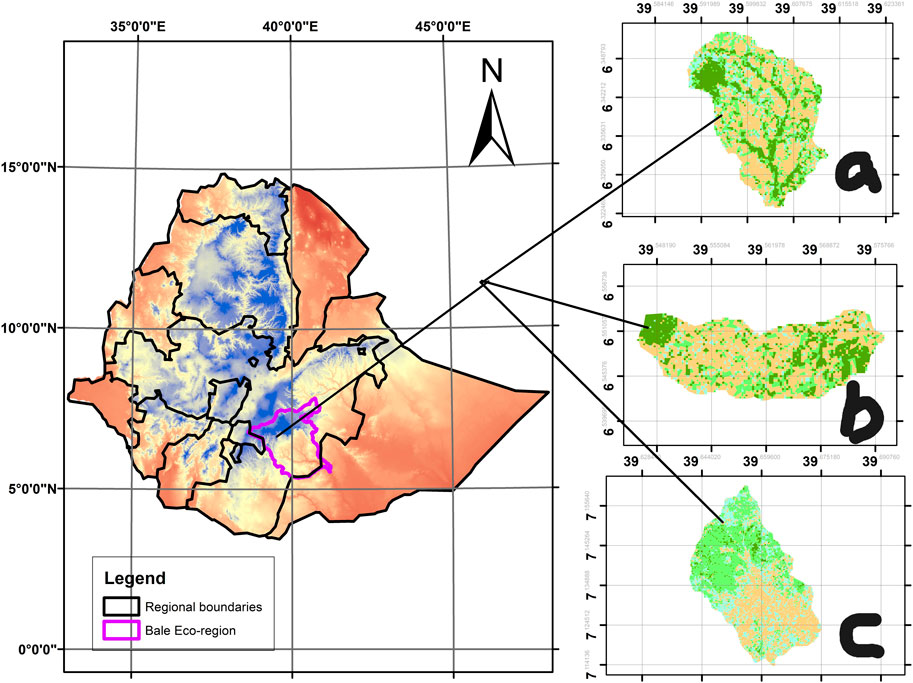
Figure 1. Location of Bale Eco-Region (BER) in Ethiopia and study watersheds in the highland ((A)-Hora Soba), midland ((B)- Hawo), and lowland agroecology (C)-Bekaye) watershed.
2.2 Analytical framework
Figure 2 depicts the overall analytical framework applied in this study. It is designed to facilitate the demonstration of technical data generation of LULC linked to ESV changes by embedding the DPSIR framework (Lalande et al., 2014).
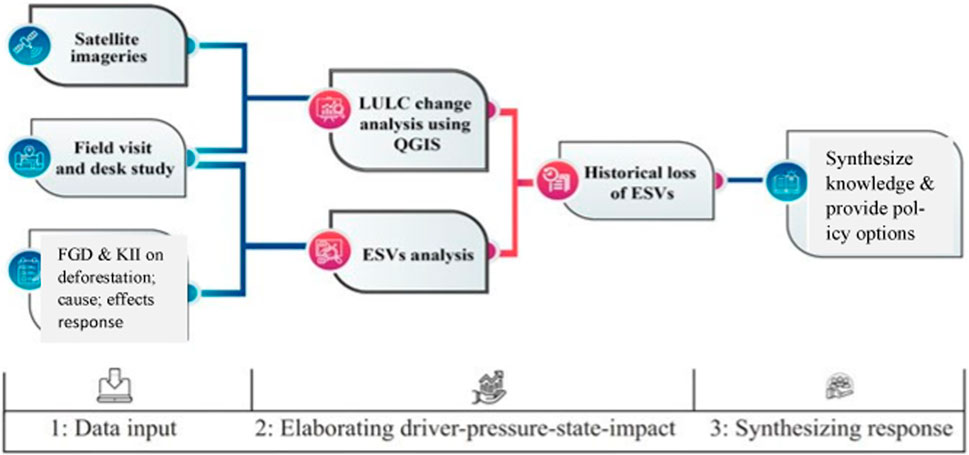
Figure 2. Analytical framework used to study land use land cover changes and its effect on ESVs in the Bale Ecoregion.
DPSIR (driver, pressure, state, impact, and response model of intervention) is a causal framework used to describe the interactions between society and the environment. DPSIR can be applied to diverse circumstances, depending on the outcome targeted (Lalande et al., 2014). Since this study focuses on quantifying LULC changes and their processes and how these changes impact ecosystem service values, we applied DPSIR. The application of DPSIR structures the conceptual understanding of the local community on land use and land cover and ESV change processes (Bell, 2012; Rebecca et al., 2016; Maxim et al., 2009). DPSIR can be constructed before focus group discussion (FGD) and key informant interview (KII) based on the literature and can be used to guide FGD and KII, or it can be constructed post-KII and FGD and empirical findings to better demonstrate and discuss the result and communicate it to policymakers.
Correspondingly, the framework involves data sourcing, elaborating driver–pressure–state–impact, and synthesizing responses (Figure 2). For data sourcing, satellite imagery (Landsat 30 × 30 m), desk study, and field observation on the cause and effects of deforestation were major ingredients (Figure 2). The middle section of the framework presents a discussion on LULC and ESV changes in the context of DPSIR, as shown in Figure 6. Land use and land cover change and ESVs were sequentially studied here (Spruce et al., 2020). The last part is where current national and local responses were illustrated and knowledge for future alternative land use was synthesized. Details are provided in the next section.
2.3 Data type and sources
Following the methods described by Huang et al. (2008), two types of remote sensing images, namely, Landsat and SPOT 5 imageries, were used for LULC change analyses. Georeferenced and radiometrically corrected SPOT 5 imageries were obtained from the Ethiopian Geospatial Institute (EGI) for accuracy assessment, whereas Landsat imageries were accessed from the United States Geological Survey (USGS) website [http://www.usgs.gov (Table 2)]. Landsat images were of medium resolution (30 m). For 1991 and 2006, the images were derived from Thematic Mapper™; for 2016 and 2022, we used Landsat Enhanced Thematic Mapper (ETM) and Landsat 8, respectively. The acquisition dates of the satellite images slightly differ within and between years, although the acquisition was carried out within the dry-season months (January to February). Multispectral satellite images were used (WRS_PATH/RAW = 168/55, 167/56, 168/56, and 167/55; Reference Datum = “WGS84,” Reference Ellipsoid = “WGS84,” Map Projection = “UTM,” and Projection = “UTM”). The selected images are free of clouds, allowing for interpreting diverse types of land use. Digital elevation model (DEM from SRTM) and outlet global positioning system (GPS) coordinates were used for delineating the watershed boundaries of the sample study sites using QSWAT version 3.10.3 (SWATplus plugged-in to QGIS) (Neitsch et al., 2011).
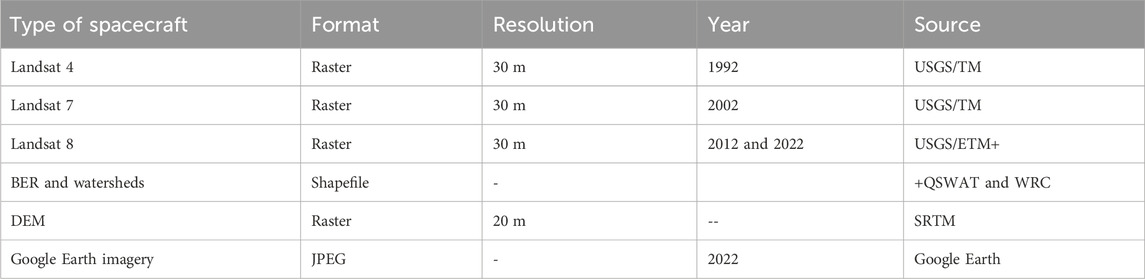
Table 2. Details of raster and vector data used and their sources.
2.4 Image classification and accuracy assessment methods
2.4.1 Defining the spatiotemporal boundaries of the study
The land use and land cover of each studied watershed were analyzed and compared. Consultation with the local communities and Alemayehu et al. (2017) demonstrated that land use change has been severely increasing since 2008, particularly in the lowlands and midlands. To account for the same, breaking into shorter time intervals is critical to validating these local arguments. Thus, LULC changes of 1992–2002, 2002–2012, and 2012–2022 time intervals were considered. Different historical periods and 10-year intervals enable the detection of significant LULC changes.
2.4.2 Image pre-processing
Typical pre-processing operations used include band combination, image clipping, and image enhancement checking for geometric correction. The major image processing steps undertaken here encompass image layer stacking, resampling, and image enhancement of the image dataset. We used ENVI 4.7 for both preprocessing and image processing. Image enhancement allows for a raw image to be readily interpretable for a particular application. The enhancements were operationalized using the same methods as those used by Hailemariam et al. (2016). After these were checked by the image histogram, enhancement was performed using the stretch and stretch to MinMax methods. From the mosaicked image, the portion that fell within the study area was extracted to limit the size of the mosaicked image to that of the study watersheds—Hora Soba, Hawo, and Bekaye (Figure 1).
2.4.3 Image classification
Land use and land cover classification was carried out using both unsupervised and supervised classification methods. First, we categorized all pixels of an image automatically into major land cover classes. In this study, the iterative self-organizing data analysis (ISODATA) technique of image clustering—described by Kantakumar and Neelamsetti (2015) and ERDAS (1999)—was applied to obtain unsupervised image classification. Second, the images representing all the studied dates were supervised and classified using the maximum likelihood classifier algorithm. A classification scheme was subsequently used to nominate major land cover classes, and finally, the classification accuracy was calculated. Following layer stacks and signature editing, image classifications were completed using earth resource data analysis QGIS software, version 3.10.3 (www.qgis.org/en/site/).
The supervised classification approach necessitates a clear idea of the number of land cover types existing in the study area. In the present study, classification algorithms were used to separate the feature space according to the selected training samples designated by the region of interest (ROI). The training sets were identified for each land cover class based on previous field knowledge and using the Google Earth tool. Accordingly, four major land cover classes were designated (Table 3) and chosen for the digital classification of the study watershed images.
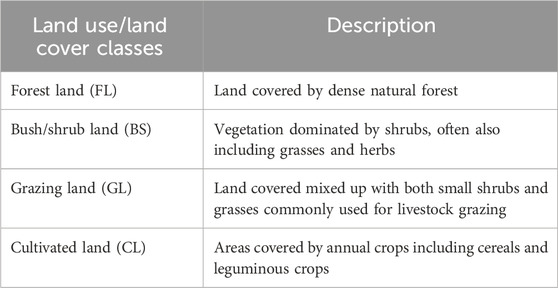
Table 3. Description of the identified LULC classes in the study areas.
2.4.4 Accuracy assessment
The quality of the image classification was checked and quantified against the ground truth. For each study site, 160 training points were generated for the land cover classifications, and 30% of the total training points (48 GCP and 12 GCP for each land cover type) were also collected from the field using Garmin GPS as ground truth points to assess the accuracy of the classified images. We followed multi-step accuracy and performance assessment techniques, as elaborated by Mekuria et al. (2021). We followed visual inspection during field visits and a confusion matrix using user, producer, and overall accuracy indexes and a nonparametric Kappa coefficient (Jensen, J., 2005; Kantakumar and Neelamsetti, 2015; ERDAS, 1999).
2.5 Estimation of losses of ESVs
2.5.1 Estimation of ESVs
One of the key impacts of LULC change is on ecosystem services and their values. However, coupling LULC with ESVs and estimating values per ecosystem service, which is the basis for ESV estimation, is data-intensive (Tolessa et al., 2017; Mekuria et al., 2021; Mengist et al., 2022). Globally, ecosystem service value coefficients have been modified several times since they were first established in 1997 (Costanza et al., 2014; de Groot et al., 2020). For the present study, we used the Ecosystem Services Valuation Database (ESVD), a follow-up to The Economics of Ecosystems and Biodiversity (TEEB) database. The Economics of Ecosystems and Biodiversity, as explained by de Groot et al. (2020), comprised over 1,300 data points from 267 case studies on the monetary values of ecosystem services across all biomes (de Groot et al., 2020). The new updated version of the ESVD contains 4,042 value records based on 693 studies across the world.
The ESVD was utilized to assess ESVs for 1991 (the base year) and 2022 (the study watershed). Although the ecosystem service value coefficients are not specific to the different agroecologies considered in this study, they show the degree of impact of LULC and have important policy implications. Therefore, they help in better understanding the impacts of LULC change, the trends of ecosystem service flow (in the context of the bigger river basins) between the highland, midland, and lowland areas, and its future management implications. Similar approaches have been used by Gashaw et al. (2018b), Mekuria et al. (2021), Richardson et al. (2015), and Tolessa et al. (2017) to estimate ESVs for different agroecologies in complex settings of population and environmental interactions. De Groot et al. (2020) indicated that the number of value records for Africa is about 309, while Asia and Europe have a total of 4,042 value records globally.
Given the complexity of the landscape of the Bale Ecoregion, the estimation of ESVs in this study was based on filtering and matching international values for similar biomes (USD ha yr −1 at 2020 price levels). The process involves two scales: i) four land use and land covers (forest, grazing land, cultivated, and bush/shrub lands) and ii) 21 specific ESVs (water, food, raw materials, genetic resources, medicinal resources, climate regulation, moderation of extreme events, regulation of water flows, erosion prevention, opportunities for recreation and tourism, etc.). We presented the result for all specific ecosystem services, while our discussion emphasizes only prominent ESVs.
The total value of ecosystem services in the LULC for the study period was obtained following the methodology (Eq. 1) suggested by Mekuria et al. (2021), Tolessa et al. (2017), and Mengist et al. (2022).
where ESV is the estimated ecosystem service value, Ak is the area (ha), and VCk is the ESV (USD ha yr −1) as per 2020 price levels for LULC category k. The change in the ecosystem service value for different LULCs was estimated as the difference between the reference year (1991) and 2022. Additionally, we estimated the impacts of LULC changes on 21 specific ecosystem services in the study area; the values of the specific ecosystem services were estimated using Eq. 2 and the value coefficient obtained by de Groot et al. (2020).
where ESVf is the estimated ecosystem service value of function f, Ak is the area (ha), and VCfk is the value coefficient of function f (USD ha yr −1 at 2020 price levels) for LULC category k. The value coefficients can be obtained from the study by de Groot et al. (2020), and Table 4 depicts specific ecosystem service values (Int$/ha/yr) by ecosystem service categories.
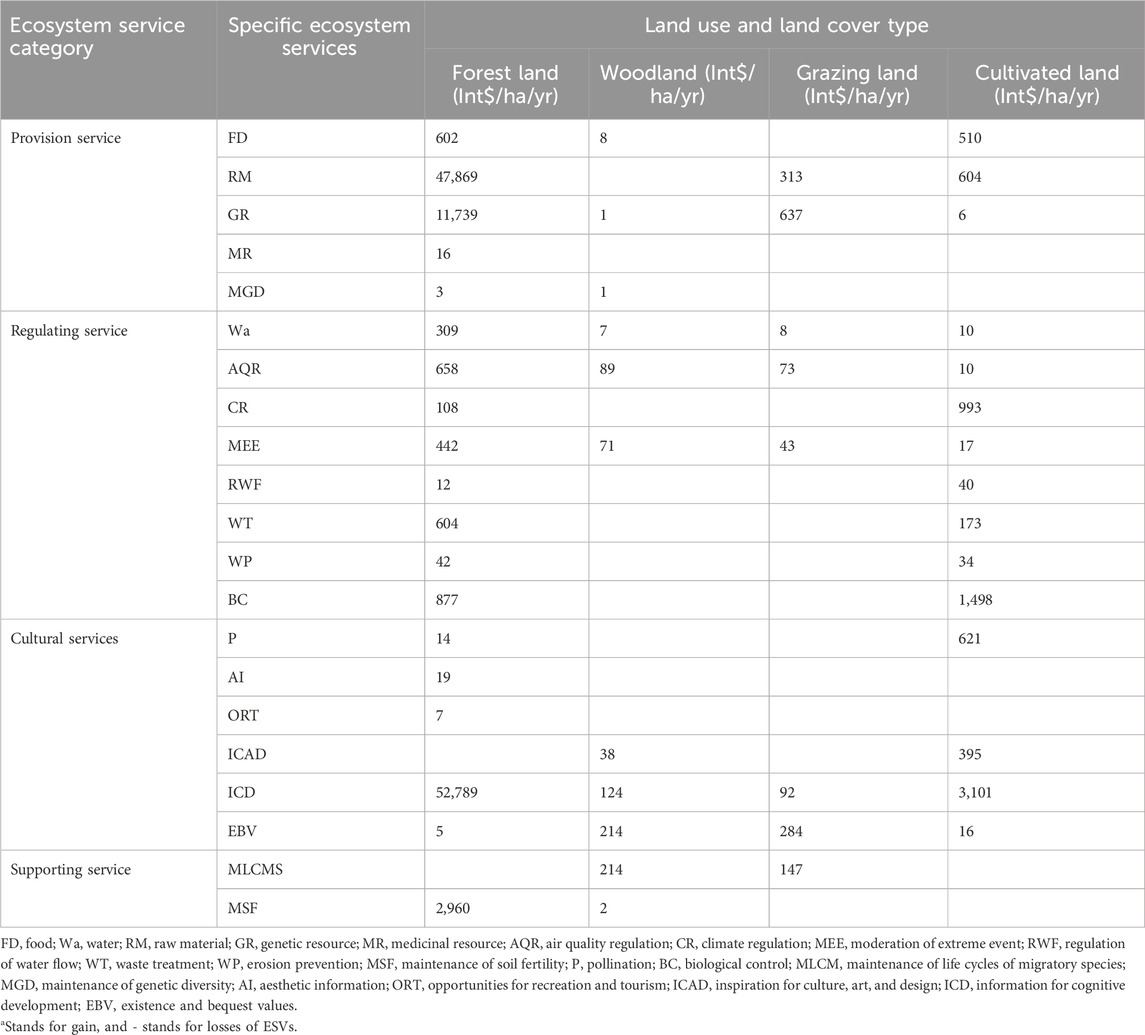
Table 4. LULC and specific ecosystem service values (Int$/ha/yr) by ecosystem service categories.
2.6 Additional data on livelihood and agricultural practices
Madda Walabu University, in collaboration with the International Water Management Institute as part of the SHARE I Bale Ecoregion studies (unpublished data), generated qualitative data from 30 key informants across households in lowland, midland, and highland areas. Fifteen FGDs (four with men, three with women, three with youths, and five with Woreda experts) were conducted. Moreover, 30 key informants were involved in an in-depth interview using checklists prepared on economic activities, utilization of natural resources, constraints on using existing natural resources, temporal variation in natural resources, and other related issues. The study followed a multi-stage sampling procedure to select Woreda, Kebele, and individual participants in the different discussions. While the selection of Woreda and Kebele was systemic, the selection of individual participants was guided by extension agents. At the same time, personal observation was employed to identify economic activities, usages of natural resources, constraints on using existing natural resources, and the current situation of natural resources in the study area. We used this information and literature values to discuss the whole spectrum of LULC and the ESV change in the context of the DPSIR framework.
3 Results
3.1 Accuracy assessment
The overall accuracies of 2022, 2012, 2002, and 1992 varied by the years, LULC types, and study areas. The overall accuracy assessment values (Annex 2) ranged between 96% and 83%. These figures are within the acceptable range of accuracy levels (Hailemariam et al., 2016; Hassen and Assen, 2018).
3.2 Magnitude and rate of LULC changes across the study watersheds
Figures 3–5 depict LULC changes during the observation period for the study watersheds representing highland, midland, and lowland agroecologies in the BER. Apparently, there were differences in the magnitude of gains and losses of areas under different land use types in the three watersheds (Tables 5, 6).
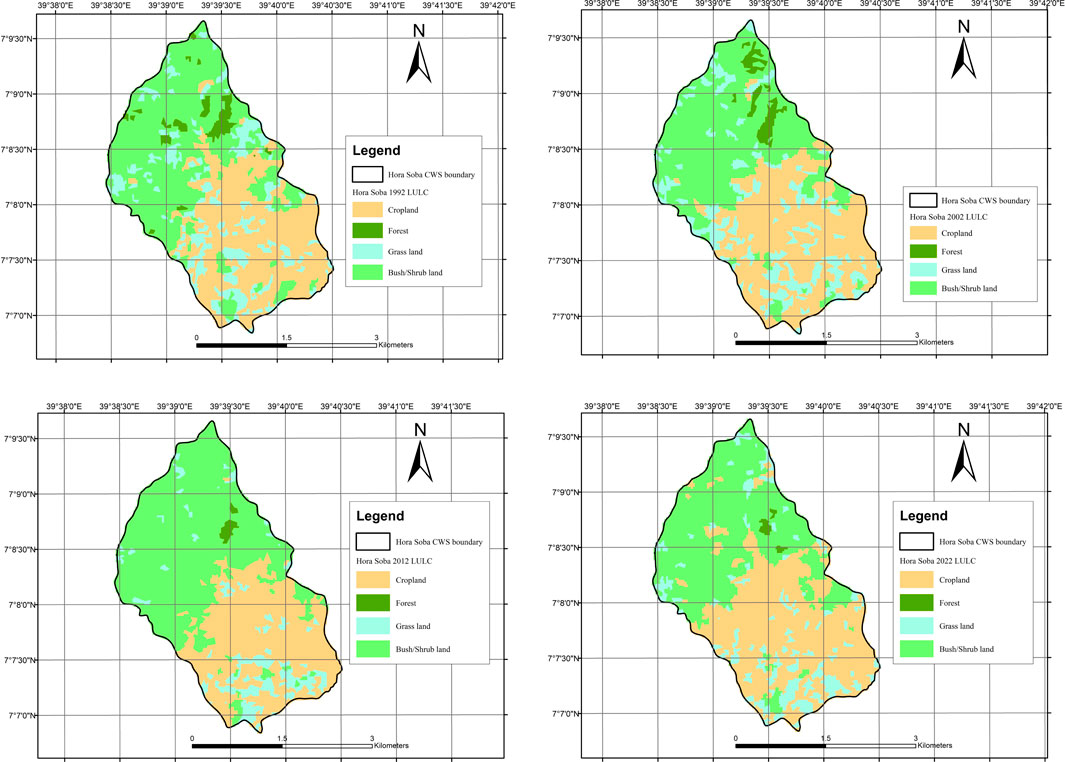
Figure 3. LULC changes in the highland (Hora Soba) watershed of the BER during 1992 -2022 (CWS is for catchment watershed).
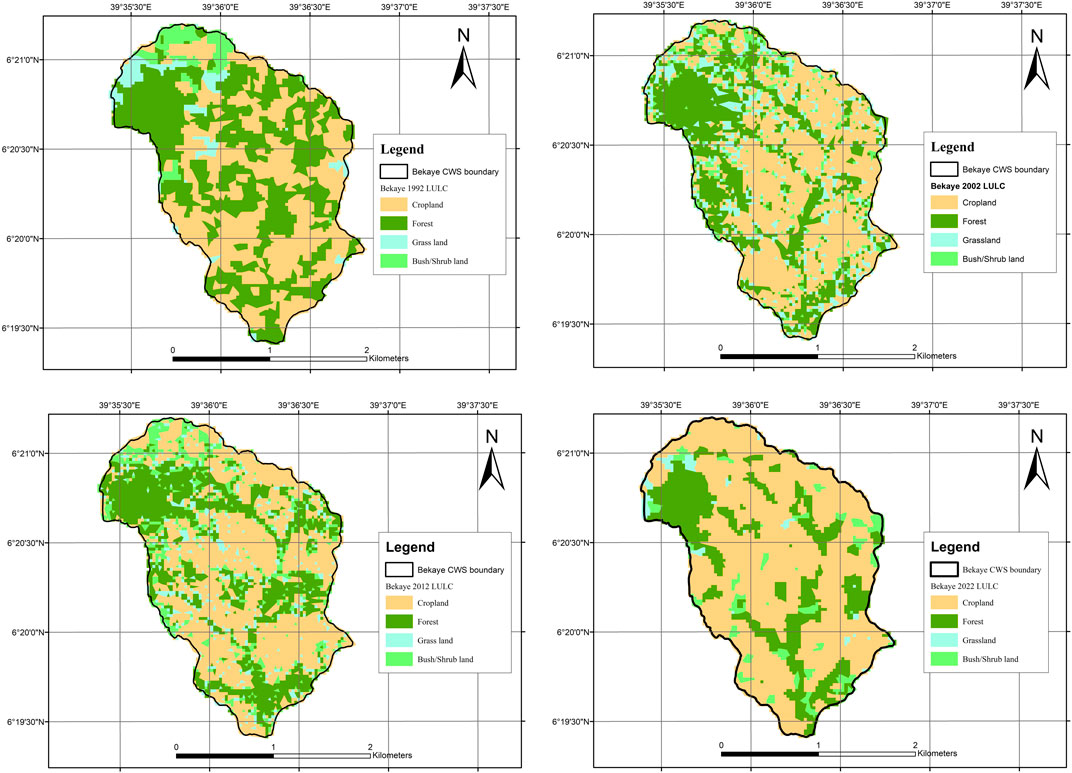
Figure 4. LULC changes in the midland (Hawo) watershed of the BER during 1992 -2022 (CWS is for catchment watershed).
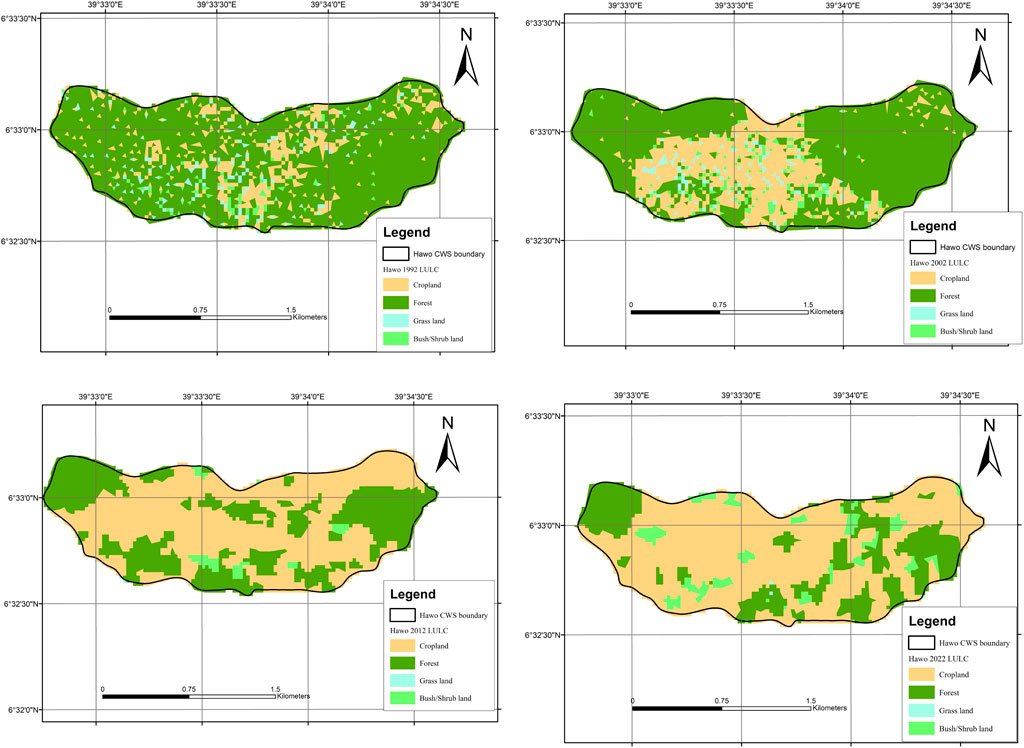
Figure 5. LULC changes in the lowland (Bekaye) of the BER during 1992 -2022 (CWS is for catchment watershed).
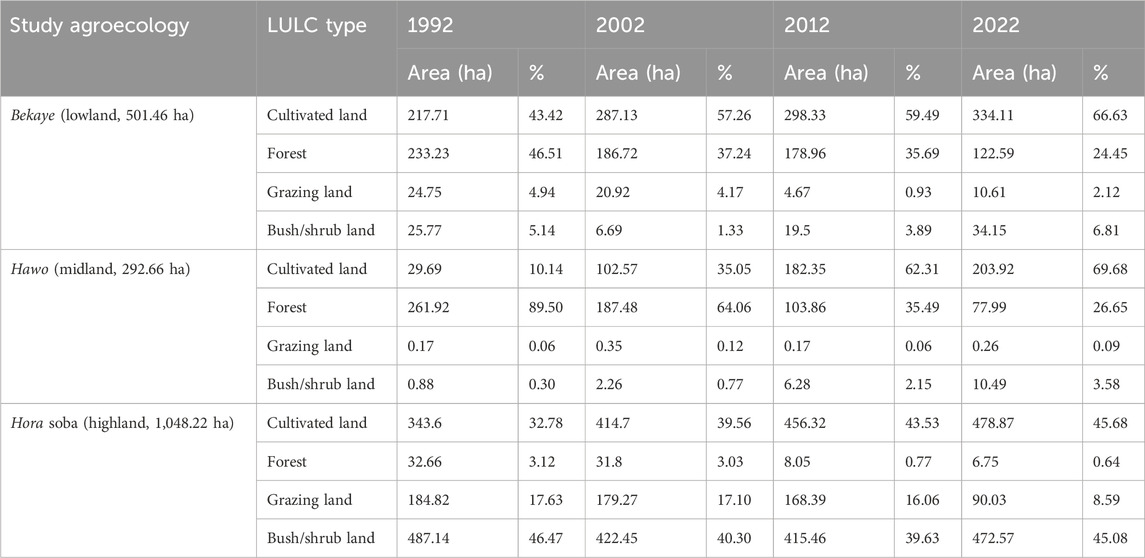
Table 5. Area coverage of major LULC types in the study watersheds (BER).
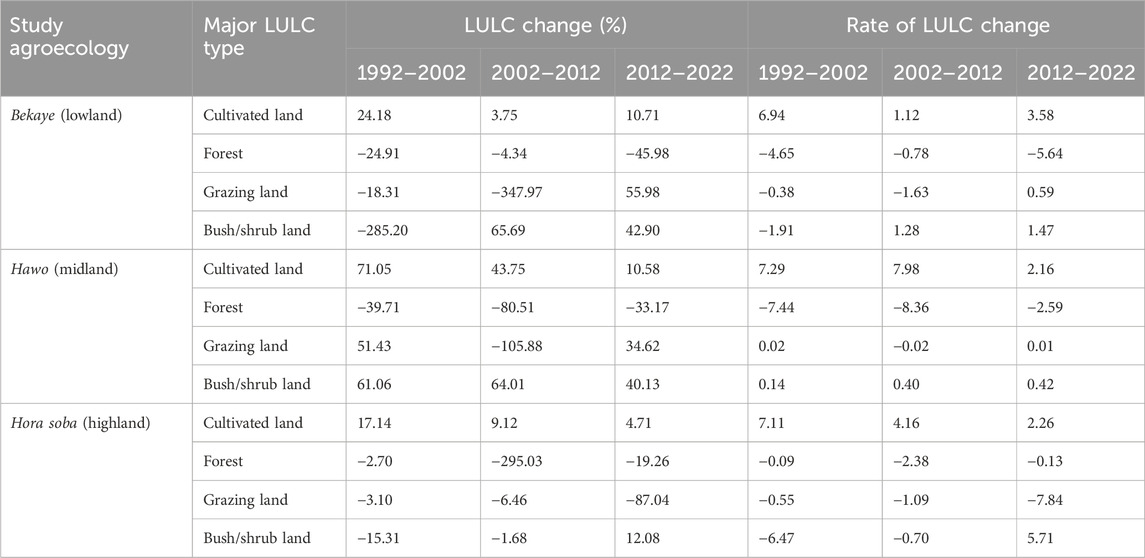
Table 6. Major LULC (%) and decadal rate of change in the study watersheds (BER).
Table 6 illustrates that in the highlands, grazing land continuously shrank at an increasing rate (3%, 7%, and 87% losses) for 1992–2002, 202–2012, and 2012–2022, respectively. Similarly, in the midland and lowland watersheds, grazing land was observed to decrease at an increasing rate during the observation period (Tables 5, 6).
Very sharp LULC changes in the study watersheds were noted, with a sizeable increase in the cultivated land. The observed changes were stronger for the midland and lowland study areas. Consequently, during the entire observation period (1992–2022), the cultivated land in the lowland expanded from 43% to 66%, from 10% to 69% in the midland, and from 16% to 32% in the highland, indicating steeper changes in lowland and midland areas (Tables 5, 6).
Notably, a strong increase in cultivated land across all study watersheds was observed to be at the expense of forest land. A substantial decrease in the forest land area was observed, with different magnitudes among the study watersheds. For instance, in the highlands, forest land decreased from about 3% to 0.64% between 1992 and 2002 (Tables 4, 5). In the midland, forest land steadily decreased from about 89% to 26.6% between 1992 and 2022. In the lowland watershed, forest lands decreased from about 45.51% to 24.45% during 1992–2022. The trend in losses in the forest area seemingly corresponds well to the gain in cultivated land (Annex 1).
The annual rate of forest land degradation in the lowland was −4.65, −0.78, and −5.64 for three consecutive decades of observation. In the midland, the rate of change was of comparable magnitude, while the highland rate of change was smaller than that of the two study sites (Table 6).
3.3 Ecosystem service value changes in relation to LULC in the study watersheds (BER)
The estimation of the overall ESVs for the base year (1992) was 68 million USD, while for 2022, the figure was only 33 million USD (Table 7). This indicates that the total ESV loss over the last 30 years was estimated at >108% from the base year (1992) and at a rate of >1 million USD ha-1 yr-1. Losses from the forest were the highest and estimated at an annual rate of 0.1, 0.7, and 0.4 million USD ha-1 for the highland, midland, and lowland study areas, respectively (Table 7).
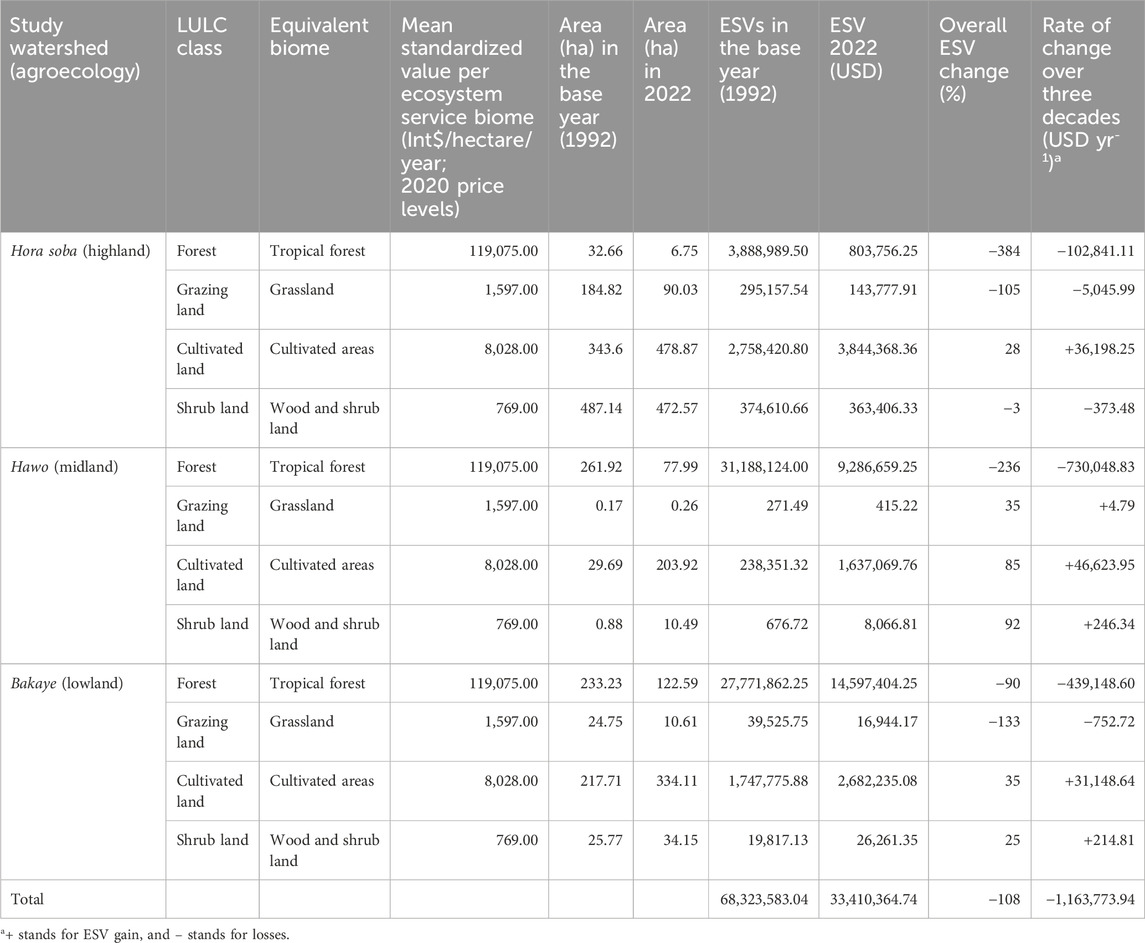
Table 7. LULC classes, the corresponding biomes, and mean standardized values per ecosystem service biome based on the updated values (de Groot et al., 2020) and estimated change in ESVs between 1991 and 2022 for the BER.
In all the study areas, the ESV increase for cultivated land for the study period was substantial, ranging between 85% (at the midland), 35% (lowland), and 28% (highland) (Table 7). The question, however, of whether this change will maintain or improve the baseline year-specific ESVs for food provision remains.
In terms of various specific ESVs depicted in Tables 8–10, substantial losses were recorded. Of the 21 specific ESVs investigated, only 33% showed a value increase for the highland and midland, while for the lowland, the figure was less strong (Tables 8–10). These increasing specific ESV trends include pollination, biological control, and waste treatment in all the study areas (Table 11).
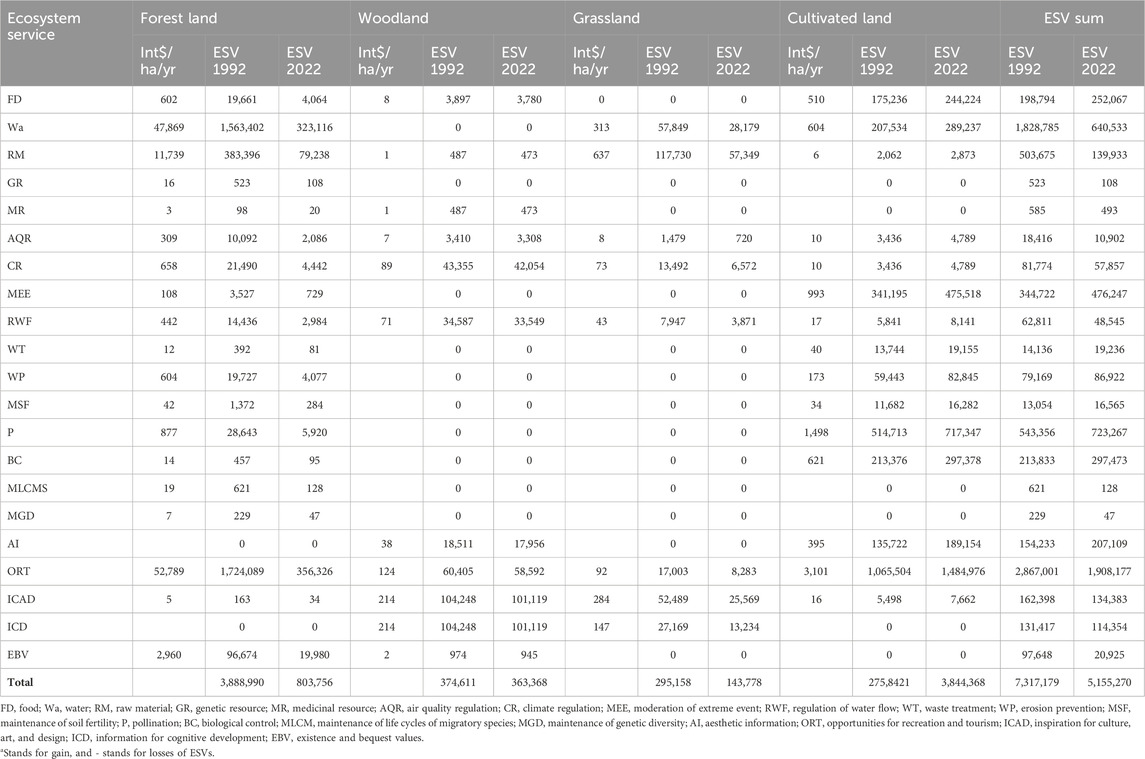
Table 8. Values (Int$/hectare/year; 2020 price levels) of ESVs for four LULC classes in the Hora soba highland.
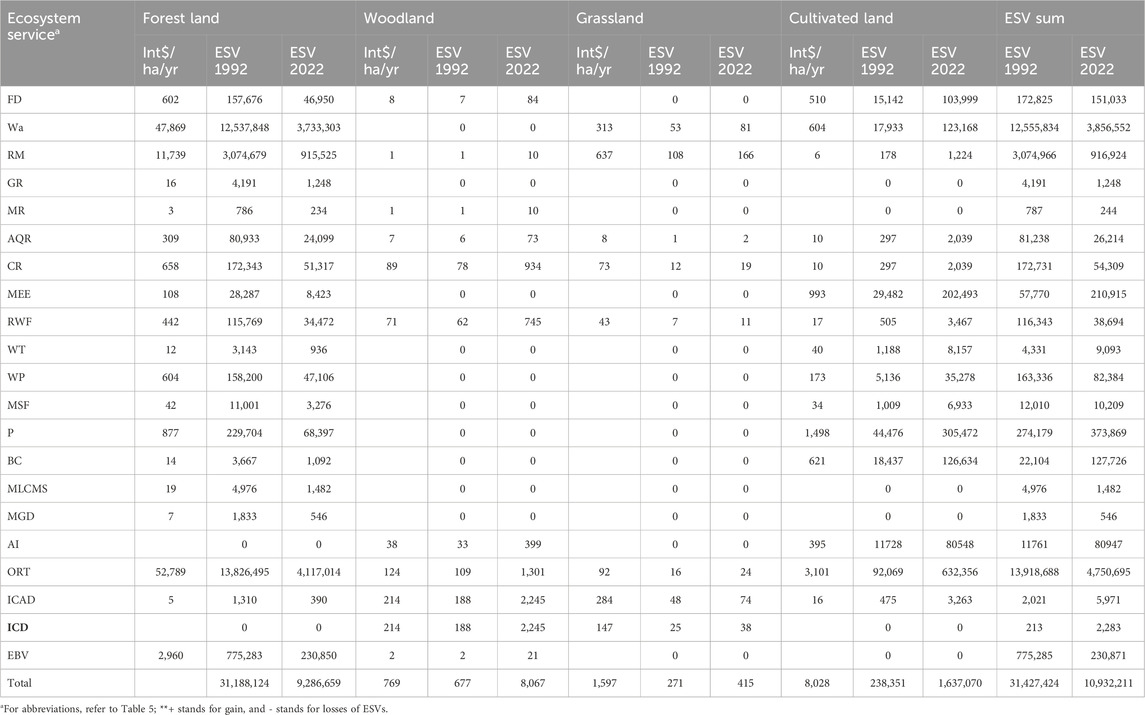
Table 9. Values (Int$/hectare/year; 2020 price levels) of ESVs for four LULC classes in the Hawo midland.
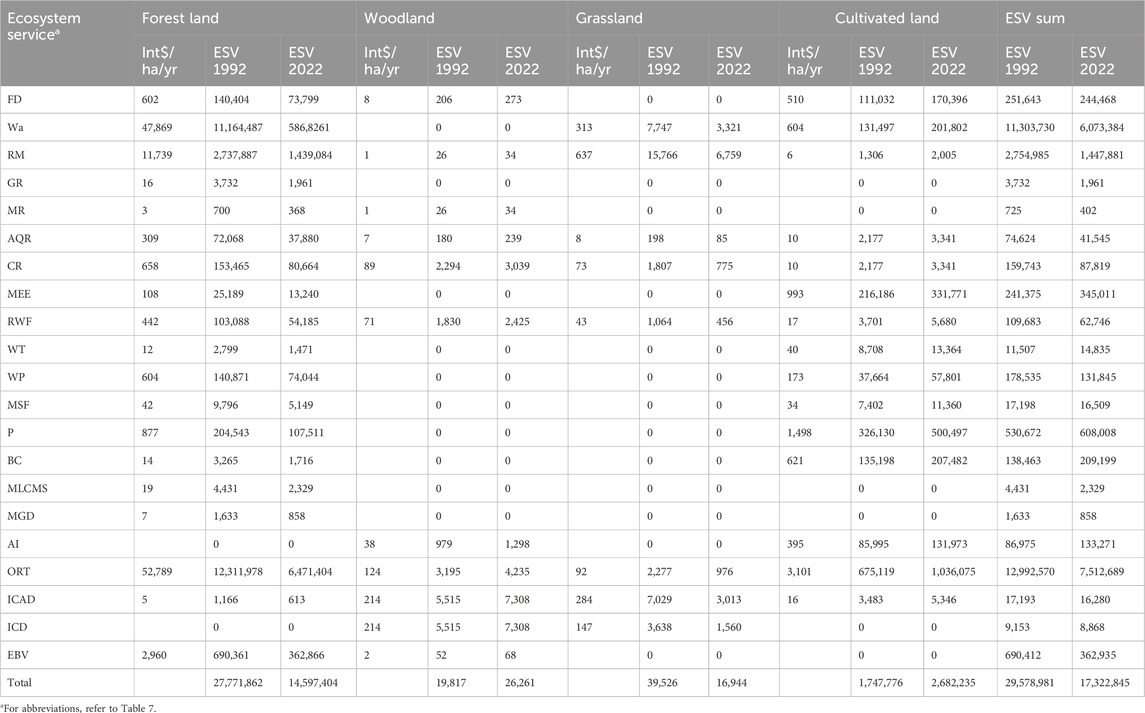
Table 10. Values (Int$/hectare/yr; 2020 price levels) of ESVs for four LULC classes in the Bekaye lowland.
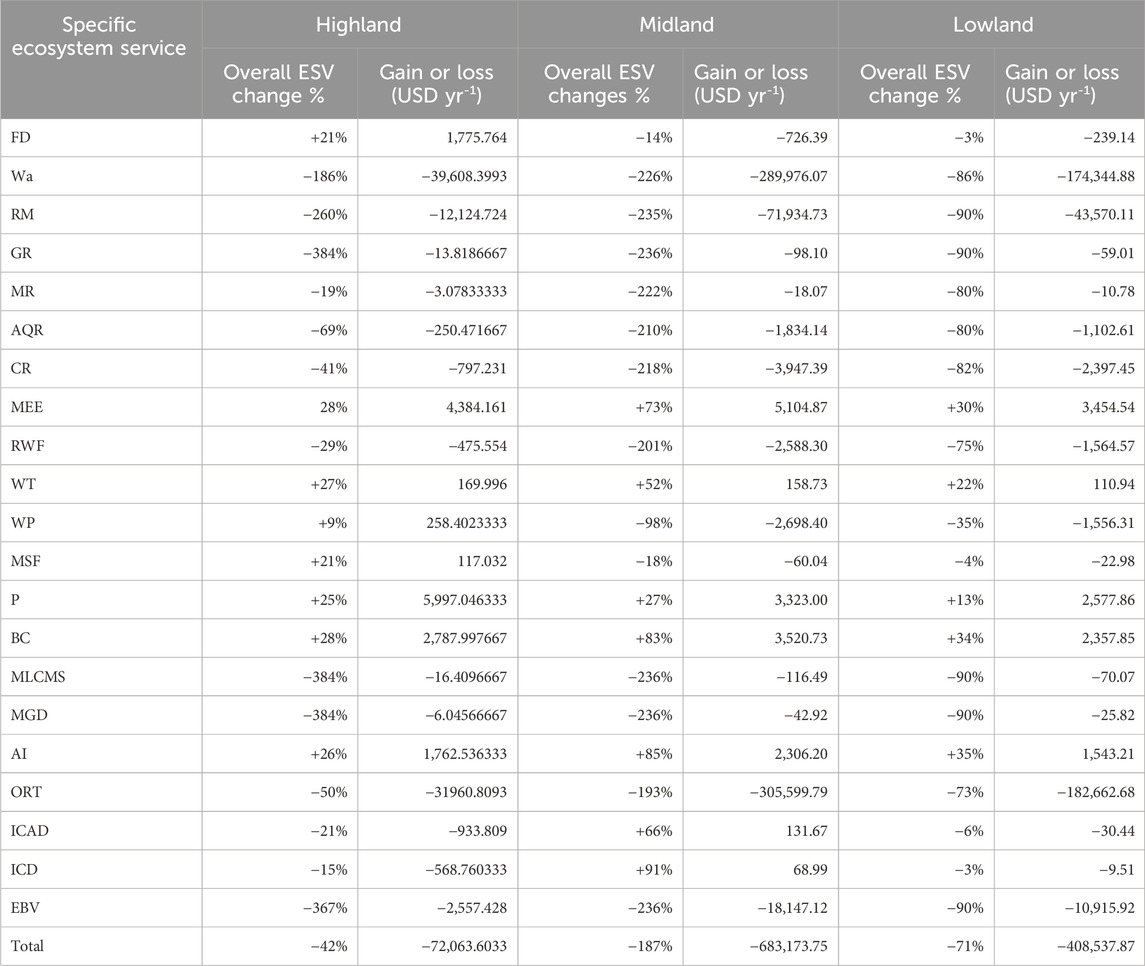
Table 11. Observed percent changes and decadal rate of changes of ESVs by ecosystem service types in the BER.
The highest magnitude of losses was recorded for water (from a change in forest land) and recreation and tourism-related ESVs, with the magnitude of losses differing across the three study sites (Table 11). A loss in water flow regulation values, which links the highland, midland, and lowland areas of the BER, was also observed. Despite the increase in cultivated land, specific ESVs for food have significantly diminished, except for some increase in the highland areas (Table 11).
The sum of the values of overall ESV changes suggests 71% of losses of ESVs in the lowland, 187% in the midland, and 42% in the highland compared to the base year [1992 (Tables 7–9)].
4 Discussion
4.1 Variability of land use and land cover changes across the study agroecologies of the BER
The results revealed that the magnitude of LULC changes in the study areas for the observation periods was divergent. Overall, there was a pressure of a steady increase in cultivated land and a contrasting decrease in forest lands. Information from the FGD indicated that the LULC changes were mainly related to the expansion of agricultural land as a result of the increasing population and the associated demand for food. This substantiates the work of Deribew and Dalacho (2019), who attributed forest LULC change to an expansion of cultivated land in Ethiopia. The drivers, as demonstrated by Hailemariam et al. (2016), are population growth, climate change, and regional policies [see Figure 6 (Bilsborrow, 1992)].
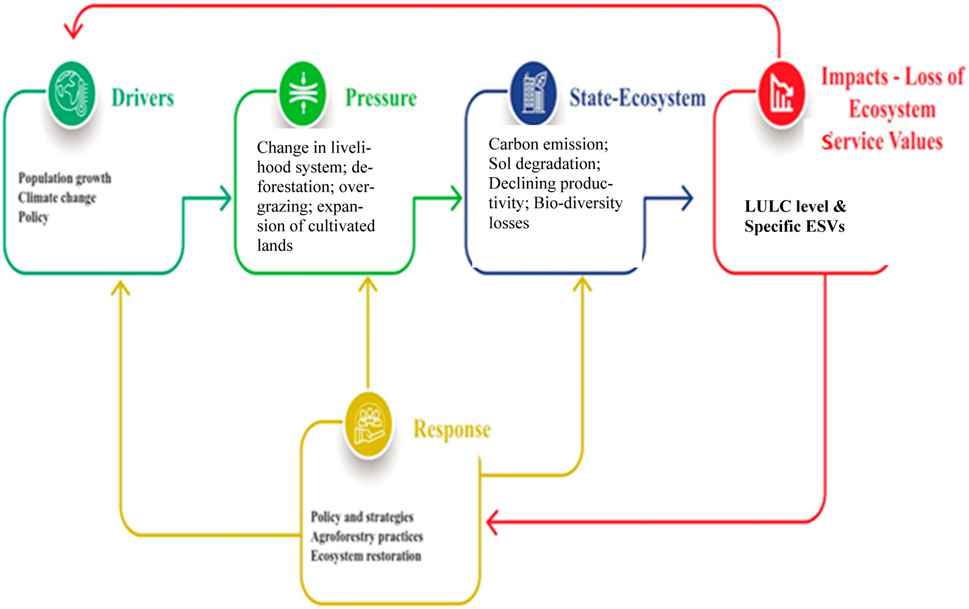
Figure 6. Illustration of DPSIR framework in the context of the study areas.
A closer look at the magnitude and trends of LULC changes in each of the study areas reveals new insights. For instance, in the highland study areas, forest cover decreased from 3.12% in 1992 to >1% in 2022. This is in contrast to the trend in the midland and lowland watersheds, where a stronger and sharper decrease in forest land was observed. The slow rate of deforestation in the highlands could be explained by the ongoing reforestation and land restoration programs, including the practices of participatory forest management (PFM) in Ethiopia, and could be considered one of the responses. We also argue that the remnant forest in the highland areas is mainly on marginal land, which is less suitable for alternative land uses and, thus, does not attract the attention of illegal settlers. PFM is mainly focused on the highland and midland areas, as indicated by Alemneh et al. (2019), Lemenih and Kassa (2014), and Badesso et al. (2020). Discussants from the FGD underlined the critical role of the ongoing PFM approach regarding the rehabilitation and protection of forest land in the highland areas of the BER. Programs such as REDD+ in the BER are highly focused on the PFM approach. Lemenih et al. (2015) reported that the first PFM approach was introduced in Ethiopia in the mid-1990s by Farm Africa, SOS Sahel, GTZ, and JICA. It has been gradually recognized by the government of Ethiopia (policy-influenced) as a mechanism to reverse deforestation and improve the management of state-owned natural forests in the country (Lemenih et al., 2015). Recent findings from the Central Rift Valley by Girma et al. (2023) indicate that PFM improves the livelihood assets of farmers and, in turn, reduces encroachment into forest areas through agroforestry development, soil and water conservation, and the use of non-wood forest products. Despite this emerging evidence, deforestation has remained a challenge in different parts of the country, such as the remote lowland areas in the BER.
The lowland forest area decreased from 47% in 1992 to 25% in 2022. The deforestation rate in the lowland area was stronger than that in the highland areas; on average, it was more than two-fold higher than in the highland, according to the various LULC reports in different parts of the country, such as in the Bilate Alaba catchment (Godebo et al., 2018) and the Goga district of Gambela (Othow et al., 2017). This can be accounted for by the increasing transformation of pastoral communities into agropastoral and sedentary farmers. For example, Hailemariam et al. (2016) argued that drought forces many local people to migrate (pressure created by climate change) from drought-stricken areas to forest regions in the lowland; the latter allows for better space for agriculture, water, foraging opportunities, and irrigation. FGD and KII participants suggested that pastoralists were forced to settle down through the “villagization” program in the lowland ecoregion; thus, regional policy plays a role in accelerating LULC changes (ibid). Rates of deforestation in the three study areas were above the net annual rate of East and West Africa and the national average of 1.28% (FAO, 2015). The average rate of cultivated land increase was slightly different among the highland, midland, and lowland studies, ranging between 4 and 6 ha yr-1. Similarly, Gibbs et al. (2010) estimated that newly cultivated land increased annually by more than 4% in the tropics during the 1980s and 1990s at the cost of forest land (see also Tolessa et al., 2017; Mekuria et al., 2021).
In addition to the spatial variability in the magnitude and rate of deforestation, this study revealed variability in the pattern of LULC changes—how they evolved from one type to another. A closer inspection of the pattern of LULC change epochs illustrates that the general pathway of LULC changes follows forest land–bush/shrub–grassland/grazing land–cultivated land, with some variants and feedback loops across the study agroecology (Annex 1a–c). For example, for all study areas during most observation periods, LULC changed mainly from forest land to cultivated land (Annex 1a–c). However, a unique pattern observed was a change of grassland to bush/shrub in the Hora soba highland during 2012–2022. Arguably, this could be due to recent interventions by government and non-governmental organizations to rehabilitate ecosystems through different interventions, including area exclosure and PFM. Overall, despite the similarity in the overall trends of the LULC change pathway, there are differences in patterns among the study areas. Possibly, this shows a disparity in the management necessary for the conservation of forests and to sustainably restore the ecosystem.
DPSIR is a causal framework for describing the interactions between society and the environment to support evidence-based decision-making. It is significant in this context to understand the key driver and pressure, as shown in Figure 6. Alemayehu et al. (2017 unpublished) reported that population growth is a chief factor driving the increased demand for food and household energy in the BER.
The high population growth rate is a compound effect of the inherent growth and influx of migrants within the BER and from other parts of the country (Rudel, 1991; Bilsborrow, 1992; Hailemariam et al., 2016; Mezgebu and Workineh, 2017). The growth rate is estimated at 3.81% for the entire BER. The population density decreases along the altitude gradient (from highland to lowland), implying population growth as a driving factor that plays different roles in the three watersheds. Discussants during the FGDs confirmed that the strategies for meeting the growing food demand in all the study areas focus on higher production through an expansion of cropland and an increase in livestock population (Rudel, 1991). This is a mechanism by which the driver contributes to change in the state, involving deforestation, change in livelihood strategy, overgrazing, and expansion of cultivated land, as depicted in Figure 6 (Tolessa et al., 2017).
Population growth not only increases pressure through increasing demand for food but also exacerbates the demand for household energy. In this regard, Alemayehu et al. (2017 unpublished) indicated that about 98% of household energy consumption in the BER is sourced from biomass. Third, population growth and the subsequent increase in the area of land for cultivation also warrant the demand for more livestock traction power (Rudel, 1991). In this regard, a positive and strong correlation between human and livestock population growth in the BER has been reported (Hailemariam et al., 2016). However, such an increase in livestock population contrasts with the substantial conversion of grazing land to cultivated land across all study areas. FGDs confirm the shortage of animal feed—as a result, increased overgrazing and increased use of crop residues for animal feed led to more nutrient mining, particularly in the condition where manure is not returned to farmland.
Historically, the lowland of the BER has mainly been pastoral and agropastoral (Elias, 2008). However, FGDs reveal recent changes in the livelihood strategy of the rural community, particularly in the lowland areas. The farming system has shifted from pastoral to agropastoral and a mixed-crop livestock system, causing a sharp decrease in areas of forest land during 1992–2022; this is notable because, about five decades ago, almost all households in the lowland areas of the BER primarily practiced livestock production. A discussion with the Bale Zone Pastoral Office suggested that within the Dallo Manna, Harena Buluk, and Madda Walabu lowland districts, the number of households engaged in pastoralism decreased from 50% to 11.67%. Contrastingly, household dependence on agropastoral and mixed-farming systems increased by 47.67% and 38.83%, respectively. There are several drivers of such changes, which the FGD and scholars such as Hailemariam et al. (2016) and Mezgebu and Workineh (2017) attribute to government policy in response to the negative impacts of climate change in lowland areas.
This shift in livelihood activities in the lowland areas might have been one of the main pressures on the system, according to information obtained from the local administration. Significant considerations include how government policy and climate change drivers intensify the level of pressure on the ecosystem. In this regard, Wynants et al. (2019) argued that these drivers were interdependent. The authors, for instance, attribute this livelihood activity change to a combination of administrative boundary enforcement, settlement policy, and significant population growth (Rudel, 1991; Hailemariam et al., 2016; Mezgebu and Workineh, 2017). Unlike in the past, the lowland communities have now gradually shifted toward cultivating more land for mosaics of crop production. Our observation suggests that only a few of the pastoralists move with their livestock toward unoccupied areas of the BER highland and midland during the dry season (off-cropping) and return to the lowlands during the wet season when the availability of enough pasture and water is secure.
The overall situation of multiple intertwining drivers with a multitude of pressure drives accelerated the change in the state of the ecosystem and the resultant impacts. This complicates the management process and entails the need for an integrated and context-specific approach.
4.2 Extent of change in ESVs across study agroecologies of the BER
Several studies on the changes in LULC and ecosystem services across time in Ethiopia have been reviewed by Haileslassie et al. (2020). However, much of the literature reviewed does not enumerate comprehensive nationwide evidence. Available information at the micro (e.g., farm fields and watersheds) and meso-scale (e.g., river basins and regions) levels indicates that the magnitude of change is enormous and that the direction of change varies across regions and the scale of studies. The result of this study illustrates similar trends: variability in magnitude and intensity of changes across agroecologies (Figures 3–5). Accordingly, population growth, climate change, and government policy-derived livelihood shifts in pastoral and agropastoral communities have incurred deforestation (Mezgebu and Workineh, 2017) and led to losses of ESVs.
The impact on ESVs is far-reaching. Several studies demonstrate the impact of the loss of biodiversity (Figure 6), decreasing crop yield (soil fertility loss), shortage of household energy, vulnerability to climate change (drought), and shortage of animal feed (overgrazing) (Hailemariam et al., 2016; Tolessa et al., 2017; Mekuria et al., 2021; Mengist et al., 2022), leading to the deteriorating state of ESVs. As reported by a survey in the Bale Ecoregion (Alemayehu et al., 2017, unpublished), 56% of those surveyed attribute decreasing soil fertility to land use change. More than 23% of the respondents consider the prevalent overgrazing to be a factor in land use change, while about 16% associated land use change with the pervasiveness of pests and diseases in the BER. The remaining 5% of the respondents attribute frequent droughts to being a significant driver of land use change (Hailemariam et al., 2016; Mengist et al., 2022). The process in the DPSIR framework is not linear. As demonstrated here, various feedback loops are prevalent that intensify the pressure. An example could be decreasing soil fertility, which forces farmers to encroach into forest land, woodland, and grazing lands, thus incurring more losses of ESVs.
The estimate of the losses in the value of general and specific ecosystem services in the BER is troubling (Tolessa et al., 2017; Mekuria et al., 2021; Mengist et al., 2022). The highest value of ESV losses was estimated for the conversion of forest land to agricultural land. This could be attributed to the diverse and stronger magnitude of ESVs of forest in TEEB database and the intensity of forest LULC changes in the study areas.
In terms of specific ESVs, the losses of water-related specific ESVs registered as one of the highest (water supply and flow regulation). Following the same, it is critical to understand how intensifying LULC conversion impacts downstream water users and uses. A review of about 10,000 publications by Acreman et al. (2021) on the effect of nature-based solutions (including forest and wetland) on water quality and availability (proxy indicator for water ESVs) for upstream and downstream water users in Africa indicated that such solutions could improve the water quality. In contrast, the evidence of their effectiveness for improving downstream water resource quantity was inconsistent, with most case studies showing a decrease in water yield where forests (particularly plantations of non-native species) and wetlands are present. Restoration of forests and floodplain wetlands can reduce flood risk, and their conservation can prevent future increases in risk and regulate base flow (ibid).
It is vital to consider the mitigation of these tradeoffs and the enhancement of shared ecosystem service benefits among the upstream and downstream users (highland, midland, and lowland areas). Addressing this through the co-designing of restoration methods for highland, midland, and dry lowland areas is important. It also substantiates the fact that highland, midland, and lowland landscapes, representing different eco-subregions, are not standalone units. They are in continuous interaction, influencing ecosystem service flows and, thus, underpinning their co-management. Significant losses in the regulation of water flow ESV in highland areas demonstrated by this study further substantiate this argument.
The magnitude of longer-term forest land impact on the base flow depends on species composition, tree density, crown–root structure, and the age of the forest stand. In the African context, longer-term monitoring is lacking (Acreman et al., 2021). These data could help separate this aggregate into fall, stem flow, interception, evaporation, etc. It can allow for an improved understanding of the flow components and its management options. The upstream–downstream connectivity of the negative impacts and benefits of land use change calls for inclusive planning mechanisms for sustainable ecosystem restoration and maintenance (Hagos et al., 2018).
Despite a substantial increase in the cultivated land, the gain in food-related ESVs from this land use type could not offset losses of food ESVs from forest and associated LULC. This is notable because of the population growth, increasing food demand, and land conversion as major drivers and pressures in the BER; it dictates the need for restoring forest-related ecosystem services (see also Mengist et al., 2022). Nature-based solutions positively impact ecological landscape quality with the provision of multiple benefits, including enhancing natural capital, promoting biodiversity, mitigating water runoff, increasing water retention, and contributing to climate change adaptations and carbon sequestration (Acreman et al., 2021).
4.3 Limitations of the study and future direction
Mekuria et al. (2023) provided an extensive explanation of the gaps in using the global value of the ecosystem services index. Tolessa et al. (2017) also suggested that ESVs are non-quantifiable and context-specific, and this may imply the underestimation/overestimation of actual values; thus, readers are encouraged to judiciously understand the empirical values. Mekuria et al. (2023) summarized that to address these gaps, the ESVD has been modified several times (2010, 2012, 2014, and 2020). While the persistent improvement implies the added value of the ESVD and the place it has in informing policymakers, it also urges the scientific community to develop ecosystem service value coefficients for local conditions that consider biophysical and social settings. In this paper, the overarching interest is to illustrate the observed trend that provides a scientific underpinning for understanding the LULC change and impacts on ESVs and supports the policy and planning of national programs such as REDD+, Ethiopia’s voluntary commitment to the Bonn Challenge.
5 Conclusion
The objectives of this study were to provide empirical evidence on the LULC conversion rate and pattern across time and space for three study watersheds and to estimate the LULC conversion effect and trends on ESVs. Based on existing practices and empirical evidence, the study also proposes management options and approaches to aid in restoring ecosystem services.
In view of the results, we concluded that diverse magnitudes, trends, and patterns of LULC changes in the study areas considerably impact ESVs. The estimated significant losses of water ESVs and ESVs for water flow regulation in the midland and highland areas can impact livelihood activities in drier lowland areas, which depend on the midland and highland areas for water ecosystem service provision. Increased ESVs for cultivated land could not offset losses in food ESVs at the scale of agroecology. Thus, restoring forest-related ecosystem services is vital. While the stark variation in the impact and response among the study sites entails the need for context-specific conservation, connectivity between the highland and lowland areas through different ecosystem services (such as water) calls for the highland, midland, and lowland stakeholders to co-plan and co-manage the BER.
Data availability statement
The original contributions presented in the study are included in the article/Supplementary Material; further inquiries can be directed to the corresponding author.
Author contributions
AH: conceptualization, formal analysis, funding acquisition, writing–original draft, and writing–review and editing. MT: writing–review and editing, conceptualization, methodology, and supervision. MD: data curation, formal analysis, methodology, software, validation, visualization, and writing–review and editing. WM: conceptualization, formal analysis, methodology, validation, visualization, and writing–review and editing.
Funding
The author(s) declare that financial support was received for the research, authorship, and/or publication of this article. The project is financed by EU.
Acknowledgments
The authors thank the project partners for their constructive comments during the presentation of the draft version at the stakeholders’ workshop. The authors thank Farm Africa and SOS Sahel Ethiopia coordinators working on the Bale Ecoregion and Alemayehu Wudneh for their support during the fieldwork. The authors acknowledge the project “Scaling out integrated and multi-sectoral eco-regional approach in the Bale Ecoregion” (SHARE BER Phase II), for supporting the accomplishment of this activity.
Conflict of interest
The authors declare that the research was conducted in the absence of any commercial or financial relationships that could be construed as a potential conflict of interest.
Author disclaimer
The views expressed in this manuscript are solely attributed to the authors and not to the funding agency.
Publisher’s note
All claims expressed in this article are solely those of the authors and do not necessarily represent those of their affiliated organizations, or those of the publisher, the editors, and the reviewers. Any product that may be evaluated in this article, or claim that may be made by its manufacturer, is not guaranteed or endorsed by the publisher.
Footnotes
1Region, zone, and Woreda are first-, second-, and third-level administrative units in Ethiopia, respectively.
References
Abate, S. (2011). Evaluating the land use and land cover dynamics in borena woreda of South wollo highlands, Ethiopia. J. Sustain. Dev. Afr. 13, 87–107.
Abdul Athick, A. S. M., and Shankar, K. (2019). Data on land use and land cover changes in Adama Wereda, Ethiopia, on ETM+, TM and OLI- TIRS landsat sensor using PCC and CDM techniques. Data Br. 24, 103880. doi:10.1016/j.dib.2019.103880
Acreman, M., Smith, A., Charters, L., Tickner, D., Opperman, J., Acreman, S., et al. (2021). Evidence for the effectiveness of nature-based solutions to water issues in Africa. Environ. Res. Lett. 16, 063007. doi:10.1088/1748-9326/ac0210
African Development Bank (ADB) (2011). Africa in 50 Years’ time: the road towards inclusive growth. Tunis, Tunisia: African Development Bank.
Alemayehu, W., Dejene, N., and Zelalem, D. (2017). Comparative analysis of the cost-effectiveness of natural resource management actions with and without family planning interventions in the bale eco-region. SHARE Project Technical Report.
Alemneh, T., Zaitchik, B. F., Simane, B., and Ambelu, A. (2019). Changing patterns of tree cover in a tropical highland region and implications for food, energy, and water resources. Front. Environ. Sci. 7. doi:10.3389/fenvs.2019.00001
Assen, M., and Nigussie, T. (2009). Land use/cover changes between 1966 and 1996 in chirokella micro-watershed, southeastern Ethiopia. East Afr. J. Sci. 3, 1–8. doi:10.4314/eajsci.v3i1.42778
Badesso, B. B., Madalcho, A. B., and Mena, M. M. (2020). Trends in forest cover change and degradation in Duguna Fango, Southern Ethiopia. Cogent Environ. Sci. 6. doi:10.1080/23311843.2020.1834916
Bell, S. (2012). DPSIR=A problem structuring method? An exploration from the “imagine” approach. Eur. J. Oper. Res. 222, 350–360. doi:10.1016/j.ejor.2012.04.029
Bilsborrow, R. E. (1992). Population growth, internal migration, and environmental degradation in rural areas of developing countries. Eur. J. Popul. 8, 125–148. doi:10.1007/BF01797549
Costanza, R., de Groot, R., Sutton, P., van der Ploeg, S., Anderson, S. J., Kubiszewski, I., et al. (2014). Changes in the global value of ecosystem services. Glob. Environ. Change 26, 152–158. doi:10.1016/j.gloenvcha.2014.04.002
Debie, E., and Awoke, Z. (2023). Assessment of the effects of land use/cover changes on soil loss and sediment export in the Tul Watershed, Northwest Ethiopia using the RUSLE and InVEST models. Int. J. River Basin Manag., 1–16. doi:10.1080/15715124.2023.2187399
de Groot, R., Brander, L., and Solomonides, S. (2020). Update of global ecosystem service valuation database (ESVSD). FSD Report No 2020-06. Wageningen, The Netherlands: ESVSD, 1–58.
Deribew, K. T., and Dalacho, D. W. (2019). Land use and forest cover dynamics in the North-eastern Addis Ababa, central highlands of Ethiopia. Environ. Syst. Res. 8, 8–18. doi:10.1186/s40068-019-0137-1
Earth Resources Digital Analysis System (ERDAS) (1999). ERDAS field guide. Available at: https://openlibrary.org/books/OL15559852M/ERDAS_field_guide (Accessed November 23, 2020).
Elias, E. (2008). Pastoralists in southern Ethiopia: dispossession, access to resources and dialogue with policy makers. Oslo, Norway: Dry Land Coordination Group.
Ethiopian Forestry Action program (EFAP) (1994). The challenge for development: final draft consultant report. Addis Ababa, Ethiopia: EFAP.
FARM Africa (2008). Bale mountains eco-region sustainable development plan: report on Phase I and II planning workshops. Ethiopia: Goba.
Foley, J. A., Ramankutty, N., Brauman, K. A., Cassidy, E. S., Gerber, J. S., Johnston, M., et al. (2011). Solutions for a cultivated planet: research analysis. Nature 478, 337–342. doi:10.1038/nature10452
Food and Agricultural Organization of the United Nation (FAO) (2015). Country report: global forest resources assessment. Rome, Italy: FAO.
Frankfurt Zoological Society (FZS) (2007). Bale mountains national park general management plan. Frankfurt, Germany: FZS.
Gashaw, T., Bantider, A., and Silassie, H. G. (2018a). Land degradation in Ethiopia: causes, impacts and rehabilitation techniques. Environ. Earth Sci. 4, 98–105.
Gashaw, T., Tulu, T., Argaw, M., Worqlul, A. W., Tolessa, T., and Kindu, M. (2018b). Estimating the impacts of land use/land cover changes on Ecosystem Service Values: the case of the Andassa watershed in the Upper Blue Nile basin of Ethiopia. J. Environ. Sci. 31, 219–228. doi:10.1016/j.ecoser.2018.05.001
Gibbs, H. K., Ruesch, A. S., Achard, F., Clayton, M. K., Holmgren, P., Ramankutty, N., et al. (2010). Tropical forests were the primary sources of new agricultural land in the 1980s and 1990s. PNAS 107 (38), 16732–16737. doi:10.1073/pnas.0910275107
Girma, G., Melka, Y., Haileslassie, A., and Mekuria, W. (2023). Participatory forest management for improving livelihood assets and mitigating forest degradation: lesson drawn from the Central Rift Valley, Ethiopia. Curr. Res. Environ. 5, 100205–100212. doi:10.1016/j.crsust.2022.100205
Godebo, M. M., Ulsido, M. D., Jijo, T. E., and Geleto, M. (2018). Influence of land use and land cover changes on ecosystem services in the Bilate Alaba Sub-watershed, Southern Ethiopia. J. Ecol. Nat. Environ. 10, 228–238. doi:10.5897/JENE2018.0709
Godfray, H. C. J., Beddington, J. R., Crute, I. R., Haddad, L., Lawrence, D., Muir, J. F., et al. (2010). Food security: the challenge of feeding 9 billion people. Science 327, 812–818. doi:10.1126/science.1185383
Green, A. R., A Murphy, B. R., Collison, M., Sanchez-Nivicela, H., Anderson, J. L., Morano, T. D., et al. (2022). A response to Cafaro, Hansson & Götmark (2022): shifting the narrative from overpopulation to overconsumption. Biol. Conserv. 273, 109698. doi:10.1016/j.biocon.2022.109698
Hagos, F., van Rooijen, D., Haileslassie, A., Yehualashet, H., and Indries, H. (2018). Investigation of the modalities for an innovative financing mechanism for participatory natural resource management in the Bale Eco-region, Ethiopia. International Water Management Institute Colombo, Sri Lanka.
Hailemariam, S. N., Soromessa, T., and Teketay, D. (2016). Land use and land cover change in the bale. Land 5 (4), 1–22. doi:10.3390/land5040041
Haileslassie, A., Mekuria, W., Schmitter, P., Uhlenbrook, S., and Ludi, E. (2020). Changing agricultural landscapes in Ethiopia: examining application of adaptive management approach. Sustainability 12 (21), 8939. doi:10.3390/su12218939
Haileslassie, A., Mekuria, W., Uhlenbrook, S., Ludi, E., and Schmitter, P. (2022). Gap analysis and methodological framework to assess and develop water centric sustainable agricultural intensification pathways in Sub-Saharan Africa. Front. Water 4, 747610. doi:10.3389/frwa.2022.747610
Hassen, E. E., and Assen, M. (2018). Land use/cover dynamics and its drivers in Gelda catchment, Lake Tana watershed, Ethiopia. Environ. Syst. Res. 6, 4. doi:10.1186/s40068-017-0081-x
Huang, W., Liu, H., Luan, Q., Liu, J., and Liu, H. (2008). Design and construction of spatial decision support system database based on metadata. Proc. SPIE 7146, Geoinformatics 2008 Jt. Conf. GIS Built Environ. Adv. Spatial Data Models Analyses 7146. (10 November 2008). doi:10.1117/12.813097
Hurni, H. (1998). Agroecological Belts of Ethiopia Explanatory notes on three maps at a scale of 1:1,000,000. Available at: https://edepot.wur.nl/484855.
Jensen, J. (2005). Thematic Map accuracy assessment in introductory digital image processing–A remote sensing perspective. USA: Prentice Hall, 495–515.
Kantakumar, L. N., and Neelamsetti, P. (2015). Multi-temporal land use classification using hybrid approach. Egypt. J. Remote Sens. Space Sci. 18, 289–295. doi:10.1016/j.ejrs.2015.09.003
Kewessa, G., Tiki, L., Nigatu, D., and Datiko, D. (2019). Effect of forest coffee management practices on woody species diversity and composition in bale eco-region, southeastern Ethiopia. Open J. 9, 265–282. doi:10.4236/ojf.2019.94015
Kremen, C. (2015). Reframing the land-sparing/land-sharing debate for biodiversity conservation. Ann. N. Y. Acad. Sci. 1355, 52–76. doi:10.1111/nyas.12845
Lalande, N., Cernesson, F., Decherf, A., and Tournoud, M. G. (2014). Implementing the DPSIR framework to link water quality of rivers to land use: methodological issues and preliminary field test. Int. J. River Basin Manag. 12, 201–217. doi:10.1080/15715124.2014.906443
Lemenih, M., Allan, C., and Biot, Y. (2015). Making forest conservation benefit local communities: participatory forest management in Ethiopia. Available at: https://www.farmafrica.org/downloads/resources/pfmfinalweb.pdf.
Lemenih, M., and Kassa, H. (2014). Re-greening Ethiopia: history, challenges and lessons. Forests 5, 1896–1909. doi:10.3390/f5081896
Luedeling, E., Sileshi, G., Beedy, T., and Dietz, J. (2011). “Carbon sequestration potential of agroforestry systems in Africa,” in Carbon sequestration potential of agroforestry systems. Editors P. K. R. Nair, and M. Kumar (Berlin, Germany: Springer), 61–83. doi:10.1007/978-94-007-1630-8_4
Mekuria, W., Diyasa, M., Tengberg, A., and Haileslassie, A. (2021). Effects of long-term land use and land cover changes on ecosystem service values: an example from the Central Rift Valley, Ethiopia. Land 10 (12), 1373. doi:10.3390/land10121373
Mekuria, W., Gedle, A., Tesfaye, Y., and Phimister, E. (2023). Implications of changes in land use for ecosystem service values of two highly eroded watersheds in Lake Abaya Chamo sub-basin, Ethiopia. Ecosyst. Serv. 64, 101564–110416. doi:10.1016/j.ecoser.2023.101564
Melnikova, J., Li, L., Tänzler, D., Tewari, R., Kurdziel, M., Warnecke, C., et al. (2007). Germany’s carbon market cooperation with Ethiopia: prospects for engaging with Article 6 of the Paris Agreement. Available at: https://www.dehst.de/SharedDocs/downloads/EN/project-mechanisms/case_study_AP3-ukraine.pdf;jsessionid=10C38A3995AA9215D33B8A35A65067DC.1_cid292?__blob=publicationFile&v=3.
Mengist, M., Teshome, T., and Feyisa, L. F. (2022). Estimating the total ecosystem services value of Eastern Afromontane Biodiversity Hotspots in response to landscape dynamics. Environ. Sustain. Indic. 14, 100178. doi:10.1016/j.indic.2022.100178
Mezgebu, A., and Workineh, G. (2017). Changes and drivers of afro-alpine forest ecosystem: future trajectories and management strategies in Bale eco-region, Ethiopia. Ecol. Process 6, 42. doi:10.1186/s13717-017-0108-2
Nanda, A., Hajam, R. A., and Ahmed, P. (2014). Changes in land use/land-cover dynamics using geospatial techniques: a case study of Vishav drainage basin. J. Geogr. Reg. Plann 7 (4), 69–77. doi:10.5897/JGRP2014.0443
Neitsch, S. L., Arnold, J. G., Kiniry, J. R., and Williams, J. R. (2011). Soil and water assessment tool theoretical documentation version 2009. Available at: https://hdl.handle.net/1969.1/128050.
Olsson, L., Eklundh, L., and Ardö, J. (2005). A recent greening of the Sahel—trends, patterns and potential causes. J. Arid. Environ. 63, 556–566. doi:10.1016/j.jaridenv.2005.03.008
Othow, O., Gebre, S. L., and Gemeda, D. S. (2017). Analyzing the rate of land use and land cover change and determining the causes of forest cover change in Gog district, Gambella regional state, Ethiopia. J. remote sens. GIS 6, 219. doi:10.4172/2469-4134.1000219
Phalan, B., Onial, M., Balmford, A., and Green, R. E. (2011). Reconciling food production and biodiversity conservation: land sharing and land sparing compared. Science 333, 1289–1291. doi:10.1126/science.1208742
Rebecca, L. L., Murray, A., Rudd, W. A.-H., Baldwin, C., Beger, M., Scott, N. L., et al. (2016). How the DPSIR framework can be used for structuring problems and facilitating empirical research in coastal systems. Environ. Sci. Policy 56, 10–119. doi:10.1016/j.envsci.2015.11.001
Regasa, M. S., Nones, M., and Adeba, D. (2021). A review on land use and land cover change in Ethiopian basins. Land 10, 585. doi:10.3390/land10060585
Richardson, L., Loomis, J., Kroeger, T., and Casey, F. (2015). The role of benefit transfer in ecosystem service valuation. Ecol. Econ. 115, 51–58. doi:10.1016/j.ecolecon.2014.02.018
Rudel, T. I. (1991). Relationships between population and environment in rural areas of developing countries. Popul. Bull. 31, 52–69. PMID: 12343671.
Scherr, S. J. (2000). A downward spiral? Research evidence on the relationship between poverty and natural resource degradation. Food Sci. 25, 479–498. doi:10.1016/S0306-9192(00)00022-1
Spruce, J., Bolten, J., Mohammed, I. N., Srinivasan, R., and Lakshmi, V. (2020). Mapping land use land cover change in the lower mekong basin from 1997 to 2010. Front. Environ. Sci. 8. doi:10.3389/fenvs.2020.00021
Tolessa, T., Senbeta, F., and Kidane, M. (2017). The impact of land use/land cover change on ecosystem services in the central highlands of Ethiopia. Ecosyst. Serv. 23, 47–54. doi:10.1016/j.ecoser.2016.11.010
UNEP (2012). Sahel Atlas of Changing Landscapes: tracing trends and variations in vegetation cover and soil condition. Available at: https://wedocs.unep.org/20.500.11822/8599.
Wynants, M., Kelly, C., Mtei, K. M., Munishi, L. K., Patrick, A., Rabinovich, A., et al. (2019). Drivers of increased soil erosion in East Africa’s agro-pastoral systems: changing interactions between the social, economic and natural domains. Reg. Environ. Change 19, 1909–1921. doi:10.1007/s10113-019-01520-9
Keywords: landscape, water resources, deforestation, East Africa, Africa
Citation: Haileslassie A, Taye MT, Diyessa M and Mekuria W (2024) Land use and land cover changes and their effect on ecosystem service values in the Bale Ecoregion, southeastern Ethiopia. Front. Environ. Sci. 12:1386026. doi: 10.3389/fenvs.2024.1386026
Received: 14 February 2024; Accepted: 30 April 2024;
Published: 27 June 2024.
Edited by:
Christopher Lant, Utah State University, United StatesReviewed by:
Kindu Mekonnen, International Livestock Research Institute, EthiopiaMichael Nones, Polish Academy of Sciences, Poland
Copyright © 2024 Haileslassie, Taye, Diyessa and Mekuria. This is an open-access article distributed under the terms of the Creative Commons Attribution License (CC BY). The use, distribution or reproduction in other forums is permitted, provided the original author(s) and the copyright owner(s) are credited and that the original publication in this journal is cited, in accordance with accepted academic practice. No use, distribution or reproduction is permitted which does not comply with these terms.
*Correspondence: Amare Haileslassie, YS5oYWlsZXNsYXNzaWVAY2dpYXIub3Jn