 Jinfang Wang1
 Zhilei Zhen
94% of researchers rate our articles as excellent or good
Learn more about the work of our research integrity team to safeguard the quality of each article we publish.
Find out more
ORIGINAL RESEARCH article
Front. Environ. Sci. , 21 March 2024
Sec. Social-Ecological Urban Systems
Volume 12 - 2024 | https://doi.org/10.3389/fenvs.2024.1385604
This article is part of the Research Topic Drylands under the Influence of Climate Change and Human Activities View all 15 articles
Scientific assessment of the development status and factors influencing the urban ecological resilience of the Yellow River Basin (YRB) is highly significant for promoting its development. This study constructed an evaluation index system for urban ecological resilience considering the four dimensions of pressure, state, response, and innovation. The spatiotemporal ecological resilience of the urban agglomeration (UA) in the Shanxi section of the YRB from 2012 to 2021 was studied using kernel density estimation, Dagum Gini coefficient, and standard deviation ellipse, and the influencing factors of urban ecological resilience were analyzed using a geographic detector. This research revealed that (1) the ecological resilience of cities in the Shanxi section of the YRB experienced a fluctuation process of rise—fall—rise. The urban ecological resilience generally reflected a gradient decreasing spatial pattern of Central Shanxi UA > South Shanxi UA > North Shanxi UA, and gradually changed from the dual core of “Taiyuan—Jincheng City” to the single core of Taiyuan City. (2) The migration trajectory of urban ecological resilience center of gravity fluctuated in the direction of “northwest-southeast,” and moved 12.63 km to the southeast overall. (3) The water supply per ten thousand Yuan GDP, occupied area of construction land per ten thousand Yuan GDP, green coverage rate in built-up areas, ratio of research and experimental development funds (R&D) to GDP, proportion of science and technology expenditure in local fiscal expenditure, and patent licensing quantity index have a high influence on urban ecological toughness at all stages. This influence was further strengthened by the interaction between factors. This study provides an important scientific basis for shaping high-quality development advantages in the YRB and creating a resilient and livable environment.
With continuously advancing urbanization and industrialization, the excessive use of resources, environmental pollution, climate change, and other problems have a serious impact on the ecosystem (Li and Wang, 2023b), which weakens the ecological carrying capacity, increases the ecological risk, threatens the regional and even entire ecological security, and finally leads to a decrease in ecological resilience. The Yellow River Basin (YRB) is the birthplace of Chinese civilization and is an important economic zone and ecological barrier in China. It plays an important role in maintaining ecological security and promoting economic growth (Huang et al., 2023). In September 2019, China formally established a strategy for ecological protection and high-quality development of the YRB. The “Outline of the Plan for Ecological Protection and High-quality Development of the YRB” was issued in October 2021, which provides an important basis and action guide for the ecological environment protection of the YRB for the present and future.
Urban agglomeration (UA) is an important factor in YRB development. The key to realizing the development of ecological resilience in YRB lies in the effective improvement of urban ecological resilience in the UA (Wang et al., 2024). Shanxi Province is rich in mineral resources and is an important national energy base. Because of its special natural conditions and layout of economic and industrial structures, Shanxi Province has one of the most fragile ecological environments and weakest foundations in the YRB. The Shanxi section of the YRB is located in the arid and semi-arid regions of northern China, with an uneven distribution of resources, lack of water resources, and sensitive and fragile ecosystem. Cities in this region are relatively less resilient to disasters and their risks. Therefore, scientifically evaluating the spatiotemporal evolutionary characteristics and influencing factors of urban ecological resilience in the Shanxi section of the YRB is highly significant to determine the current status of urban ecological resilience in the region and explore ways to improve the adaptability and resilience of urban ecosystems to cope with increasingly serious environmental pressures and natural disasters.
In urbanized areas, the fragmentation of natural habitats, homogenization of species composition, destruction of hydrological systems, and changes in energy flow and nutrient cycling reduce cross-scale ecological resilience (Alberti and Marzluff, 2004). The “urban ecology” category includes human wellbeing, urban livability, ecosystem services, complex adaptive systems, and urban resilience, which emphasize the sustainable development of cities (Wu, 2014). Improving the resilience of urban ecosystems and building resilient cities to resist eco-environmental risks have become research hotspots. The connotations and research strategies for urban ecological resilience are constantly being updated. From the perspective of evolution theory, urban ecological resilience is an inherent property of urban ecosystems that undergoes non-deterministic dynamic evolution with time and emphasizes the learning ability and innovation of the system (Hosseini et al., 2016). Under the increasingly complex situation of system development and change, “evolutionary resilience” is more suitable for the current study of urban ecological resilience, which is helpful in realizing the leap from stable equilibrium to dynamic development (Boschma, 2015). Urban ecological resilience is based on “social-ecological” aspect, which enables urban ecosystems to adjust its structure and change its path to achieve transformation and development (Hosseini et al., 2016), reflecting the ability of urban ecosystem to resist pressure, respond and recover when it is affected by pressure and disturbance (Meerow et al., 2016). China’s ecological environment resilience showed a increasing trend in fluctuations by the longitudinal and horizontal pull-out grading method (Li et al., 2023). Zhou et al. (2022) used the entropy and the linear weighting methods and the obstacle degree model to calculate the ecological resilience level and study its influence factors of UAs in Chengdu-Chongqing Economic Circle, suggesting an upward trend of ecological resilience level and disasters was the main influencing factors. When constructing an urban ecological resilience evaluation system, Yang et al. (2022) used the entropy weight method to evaluate the resilience level of cities in the Chengdu-Chongqing Economic Circle and used the Fuzzy Set Qualitative Comparative Analysis method to analyze the influencing factors, suggesting a relatively low urban resilience level and financial and innovation were the key driving factors. Lately, Liao and Zhang (2023) constructed an urban ecological resilience evaluation model based on resistance, adaptability, and resilience, and evaluated the spatiotemporal change pattern of urban ecological resilience in Guangzhou from 2000 to 2020, which suggested that the areas with low ecological resilience expanded to the northeast and southeast, while the areas with high ecological resilience decreased obviously. To sum up, the analysis showed that evaluation system and evaluation indicators remains in the exploration and improvement stages. At present, an evaluation system for urban ecological resilience research has not yet been developed for the YRB.
In this study, we considered the UA in the Shanxi section of the YRB as the research object, constructed an urban ecological resilience evaluation system from the four dimensions of “pressure-state-response-innovation”, and revealed its spatiotemporal evolution characteristics based on urban socioeconomic data from 2012 to 2021. The Dagum-Gini coefficient was used to analyze spatial differences and their causes, and a standard deviation ellipse was used to analyze the spatial location and development trends of urban ecological resilience. Finally, geographical detectors were used to analyze the driving factors affecting urban ecological resilience. This research will help understand the evolutionary trends of urban ecological resilience in the Shanxi section of the YRB, clarify the development gaps between different UAs, and provide empirical support for shaping the high-quality development advantages of the YRB and creating a resilient and livable environment.
The Shanxi section is located in the middle reaches of the YRB. The Yellow River enters from Laoniuwan, Pianguan County, Xinzhou City, and exits from Nianpangou, Yuanqu County, Yuncheng City, with a total length of 965 km, nearly 1/5 of the total length of the Yellow River. The Shanxi section of the YRB is located in Huangtu plateau, with various topographical features, with mountains and hills accounting for greater than 80%, and plains and basins in mountain valleys for approximately 20%. Shanxi Province has a temperate continental monsoon climate with four distinct seasons. The average annual temperature is 4.2°C–14.2°C and the annual precipitation is 350–625 mm. Based on the administrative unit of Shanxi section of the YRB and considering the integrity of the research region, the study area was defined as Shuozhou City, Xinzhou City, Lvliang City, Taiyuan City, Jinzhong City, Linfen City, Jincheng City and Yuncheng City. The study area was divided into North Shanxi UA (Shuozhou, Xinzhou), Central Shanxi UA (Lvliang, Taiyuan, Jinzhong), and South Shanxi UA (Linfen, Jincheng, Yuncheng) (Figure 1).
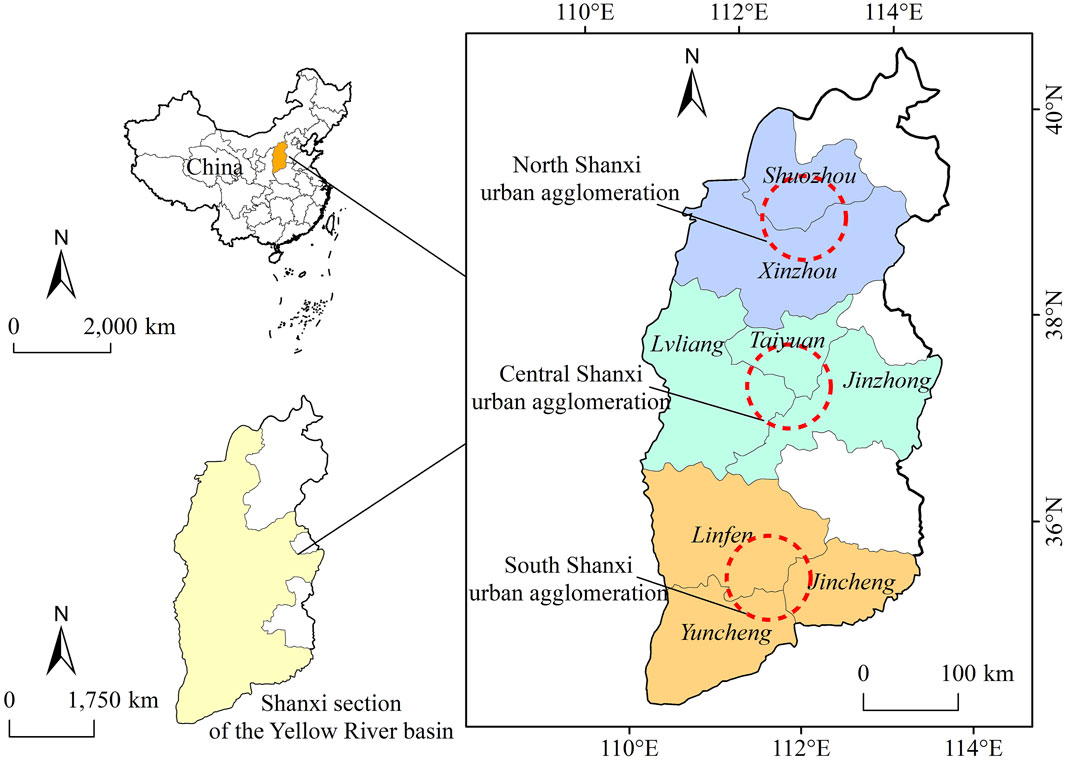
Figure 1. Urban agglomeration (UA) in Shanxi section of the YRB.
The data used in this study were obtained from the Statistical Yearbook of Shanxi Province from 2012 to 2021 (https://tjj.shanxi.gov.cn/tjsj/), Statistical Yearbook of Urban Construction of China (https://www.mohurd.gov.cn/gongkai/fdzdgknr/sjfb/tjxx/jstjnj/index.html), Bulletin of Water Resources of Shanxi Province (https://slt.shanxi.gov.cn/), Bulletin of Environmental Status of Shanxi Province (https://sthjt.shanxi.gov.cn/zwgk/hjgb/hjzkgb/index.shtml), Statistical Bulletin of the National Economic and Social Development of Prefecture-Level Cities, and Final Accounts Report of the Government. The normalized vegetation Index (NDVI) was obtained from the Resource and Environmental Science and Data Center of the Chinese Academy of Sciences (http://www.resdc.cn/). Missing data were supplemented using linear interpolation. The initial data can be found in Supplementary Table S1.
The entropy method (Wang et al., 2018; Chen et al., 2021) was used to assign the weight of the urban ecological resilience index of the UA in the Shanxi section of the YRB. First, the original data were normalized to ensure comparability (Chen et al., 2022). The formula is as follows:
Here,
Second, the specific gravity (
Third, the information entropy (
Finally, the weight (
Based on existing documents (Li and Wang, 2023b; Huang et al., 2023), this study constructed an index system of urban ecological resilience from the four dimensions of “pressure-state-response-innovation” (Table 1). Among the dimensions, pressure indicates the disturbance and impact of human production and living activities on the urban ecosystem (Zhou et al., 2022); state refers to the recovery state of the urban ecosystem in the face of pressure in terms of ecological environment and biological resources (Zhou et al., 2022); response is the ability to adjust the function and structure of the ecosystem upon disturbance (Li and Wang, 2023b); and innovation is the ability of the ecosystem to achieve ecological resilience evolution and development through learning and innovation (Wang et al., 2024).
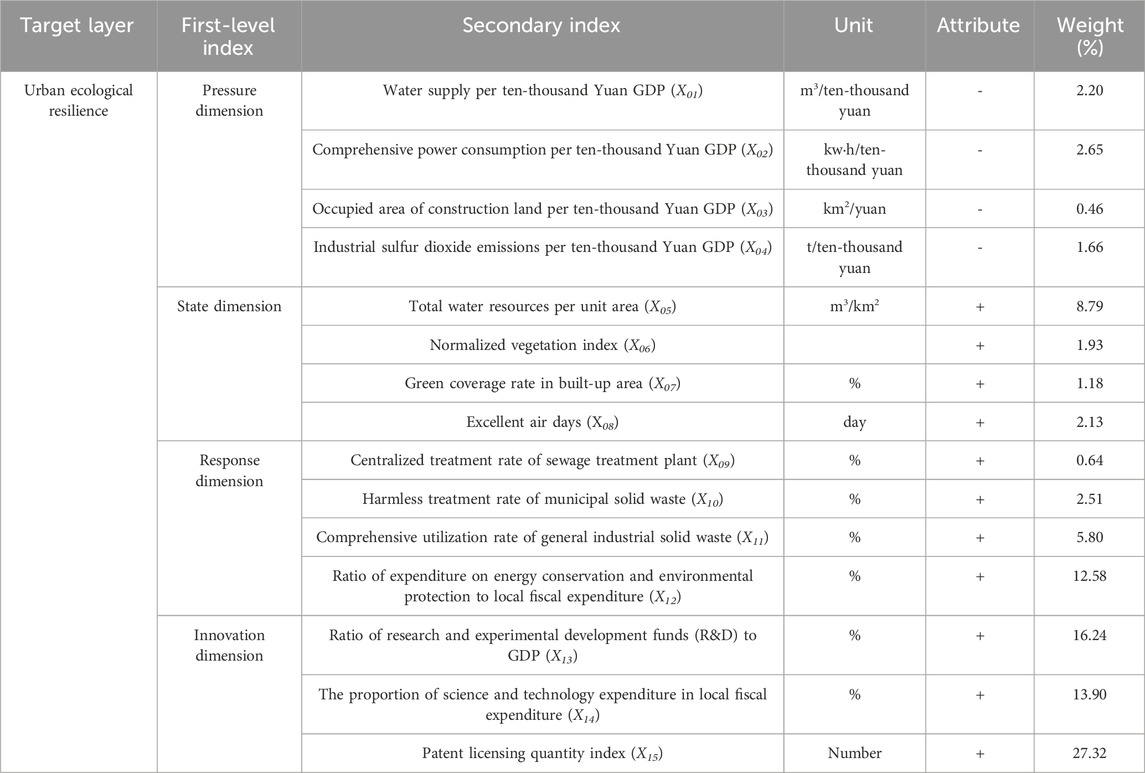
Table 1. Index system of urban ecological resilience.
Kernel density estimation describes the distribution characteristics of random variables using continuous density curves (Zambom and Ronaldo, 2013) and is a nonparametric estimation method for studying spatially unbalanced distributions. The formula is as follows:
Here,
The Dagum-Gini coefficient can measure several sub-regions decomposed from the study area and calculate overall, intra-regional, and inter-regional differences (Zhang et al., 2022). The formula is as follows:
Here,
The Dagum–Gini coefficient can be divided into three parts: intra-regional difference
Here,
Using the standard deviation ellipse model, the main spatial layout and dynamic development trend of UA urban ecological resilience in the Shanxi section of the YRB were analyzed for the study period (Yuill, 1971; Song et al., 2017). The formula is as follows:
Here,
A geographic detector is a first-order statistical method for detecting spatial differentiation and indicating the driving force behind it (Wang and Xu, 2017). The formula is as follows:
Here,
Interaction detection identifies the interaction effects of different influencing factors and evaluates the effect of increasing or weakening the dependent variable when these factors work together (Wang et al., 2010). First, the
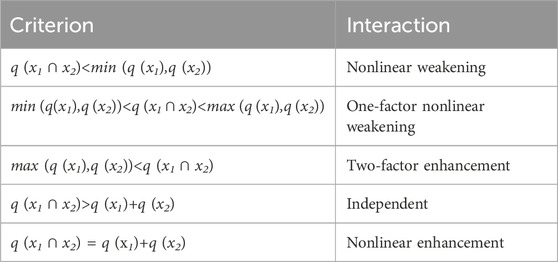
Table 2. Interaction types of two independent variables on dependent variables.
During the period 2012–2021, the average level of ecological resilience in UAs of the Shanxi section of YRB was relatively low, and had experienced a fluctuation trend of “rise—fall—rise,” with an overall upward trend (Figure 2). The average urban ecological resilience increased from 0.192 in 2012 to 0.233 in 2013, fell to a minimum of 0.188 in 2015, and then slowly rose to 0.319 by 2021, with a average of 0.213 from 2012 to 2021. The urban ecological resilience of the Central Shanxi UA was always higher than the average level of the study area, with an annual average of 0.269 and an average annual growth rate of 8.15%. The urban ecological resilience of South Shanxi UA was slightly lower than average, with an annual average of 0.194 and an average annual growth rate of 4.92%. The development in the North Shanxi UA was relatively backward, with an annual average of 0.158 and an average annual growth rate of 1.44%.
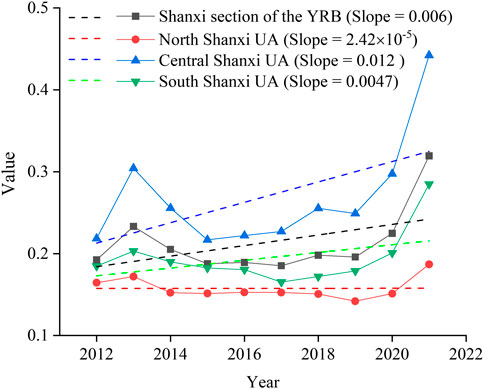
Figure 2. Trend of urban ecological resilience of UAs in Shanxi Section of the YRB.
The kernel density estimate (Figure 3) revealed that the Shanxi section of the YRB had an overall right shift in 2012 and 2021. The kernel density curves in Central Shanxi UA and South Shanxi UA gradually shifted to the right to different degrees, indicating improvements in the level of urban ecological resilience and some achievements in the ecological protection of the YRB. The curve of North Shanxi UA had a small movement to the right, and with no noticeable improvement in urban ecological resilience.
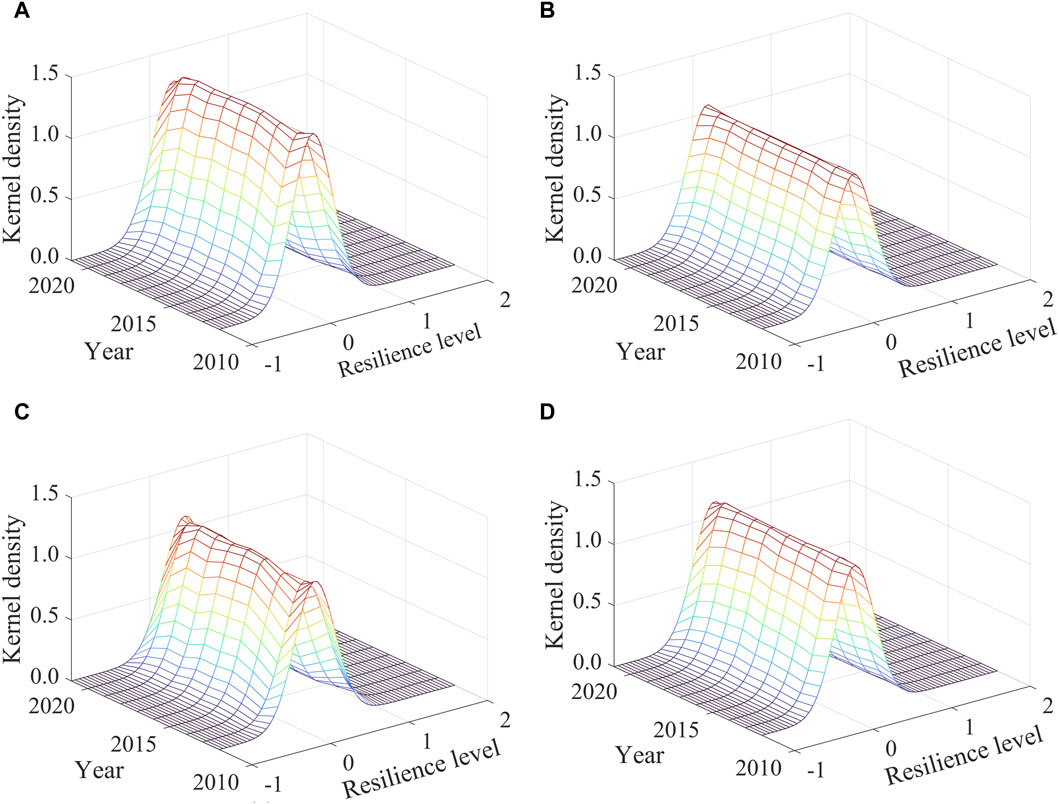
Figure 3. Kernel density estimation of urban ecological resilience of UA in Shanxi Section of the YRB. (A) Shanxi section of the YRB. (B) North Shanxi UA. (C) Central Shanxi UA. (D) South Shanxi UA.
In terms of the curve distribution pattern (Figure 3), the main peak of the kernel density curve in the Shanxi section of the YRB decreased, and the width gradually increased after fluctuation, indicating a gradually increasing absolute difference in urban ecological resilience in the study area. The width and height of the main peak of the North Shanxi UA decreased slightly, with no large change overall, indicating that the absolute difference in urban ecological resilience in the region was stable, with a decreasing trend. The height of the main peak of the Central Shanxi UA first increased and then decreased, and the width fluctuated and then decreased slightly, indicating that the absolute difference in urban ecological resilience in the region tended to decrease. The main peak of the South Shanxi UA exhibited a downward trend and the width increased slightly, indicating a gradual expansion in the absolute difference in urban ecological resilience.
From the perspective of the curve distribution ductility (Figure 3), the left trailing distribution of the Shanxi section of the YRB remained unchanged, the right trailing gradually elongated, and the extension of the curve expanded. High values of urban ecological resilience have appeared and gradually increased in this region. The curve of the North Shanxi UA was basically unchanged on the left trailing and slightly elongated on the right trailing, with little change overall, indicating that the curve of the North Shanxi UA had a certain extension convergence, with more synchronous urban development in the region. The curves of the Central Shanxi UA and South Shanxi UA shortened annually, while the right trailing gradually lengthened, indicating that the extension of these regional distribution curves was expanding.
In terms of polarization characteristics, the kernel density curves of the Shanxi section of the YRB and the three urban agglomerations were all single peaks, indicating that the level of urban ecological resilience was in a single equilibrium, with no noticeable polarization.
As suggested by Fan (2023) and the actual situation of urban ecological resilience in the Shanxi section of the YRB, the UAs was divided into five levels by the deviation ratio around the average of 0.213: low, medium-low, medium, medium-high, and high (Table 3). The urban ecological resilience of the Shanxi section of the YRB generally exhibited a gradient of decreasing spatial pattern in the order Central Shanxi UA > South Shanxi UA > North Shanxi UA (Figure 4). In Central Shanxi UA, the ecological resilience of Taiyuan City was high, rising from 0.299 in 2012 to 0.485 in 2021. The level of ecological resilience in Jinzhong City improved significantly from 0.184 in 2012 to 0.545 in 2021. The level of ecological resilience in Lvliang City increased slowly from 0.172 in 2012 to 0.296 in 2021. In the South Shanxi UA, the ecological resilience of Jincheng City was high, ranging from 0.240 in 2012 to 0.408 in 2021, Yuncheng City from 0.151 in 2012 to 0.211 in 2021, and Linfen City from 0.164 in 2012 to 0.235 in 2021. The two cities in Northern Shanxi UA were below the medium level, and the level of resilience was low.

Table 3. Classification of urban ecological resilience.
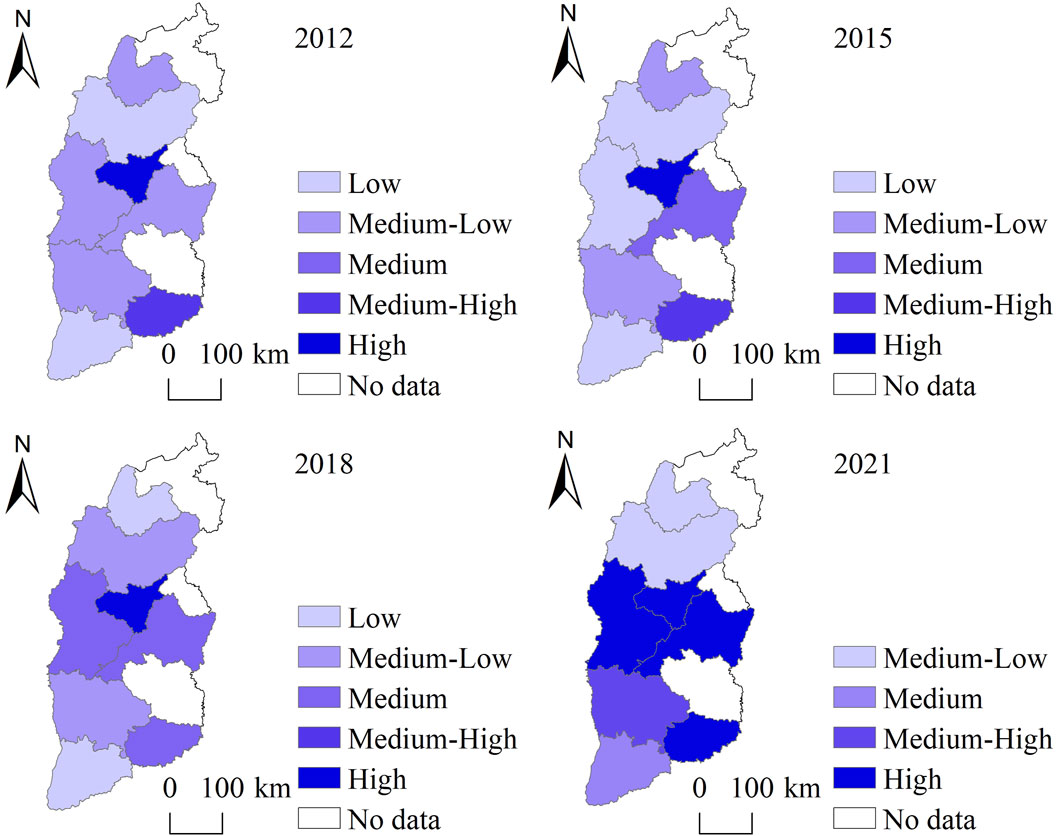
Figure 4. Spatial distribution of urban ecological resilience of UA in Shanxi Section of the YRB.
From 2012 to 2021, the urban ecological resilience gradually changed from Taiyuan—Jincheng City spatial dual-core leadership to Taiyuan City as a single core. The ecological resilience of Taiyuan, the capital of the Shanxi Province, was significantly higher than that of the other cities, resulting in a decrease in ecological resilience from the core to the peripheral cities. Economic and industrial development in North Shanxi has been restricted by resources for a long time. The ecological environment base is weak, and the improvement of urban ecological resilience is slow. In future developments, special attention should be paid to the ecological protection and governance of other cities.
From the changes in the urban ecological resilience grade in the Shanxi section of the YRB (Figure 5), a city with a medium-high level of ecological resilience in 2012 was optimized to a high level by 2021. Of the four cities that were at medium-low level in 2012, two developed to a high-level, one developed to a medium-high level, one remained at a medium-low level. Of the two cities that were at low-level in 2012, one developed to a medium-level, one developed to a medium-low level. One high-level cities in 2012 remained unchanged by 2021. The ecological resilience level of each city showed a trend of continuous optimization, generally floating at two adjacent levels, which indicates that although Shanxi Province attached great importance to the protection of the ecological environment and the industrial structure has gradually adjusted in the past 10 years, the urban eco-environmental problems have not been fully alleviated.
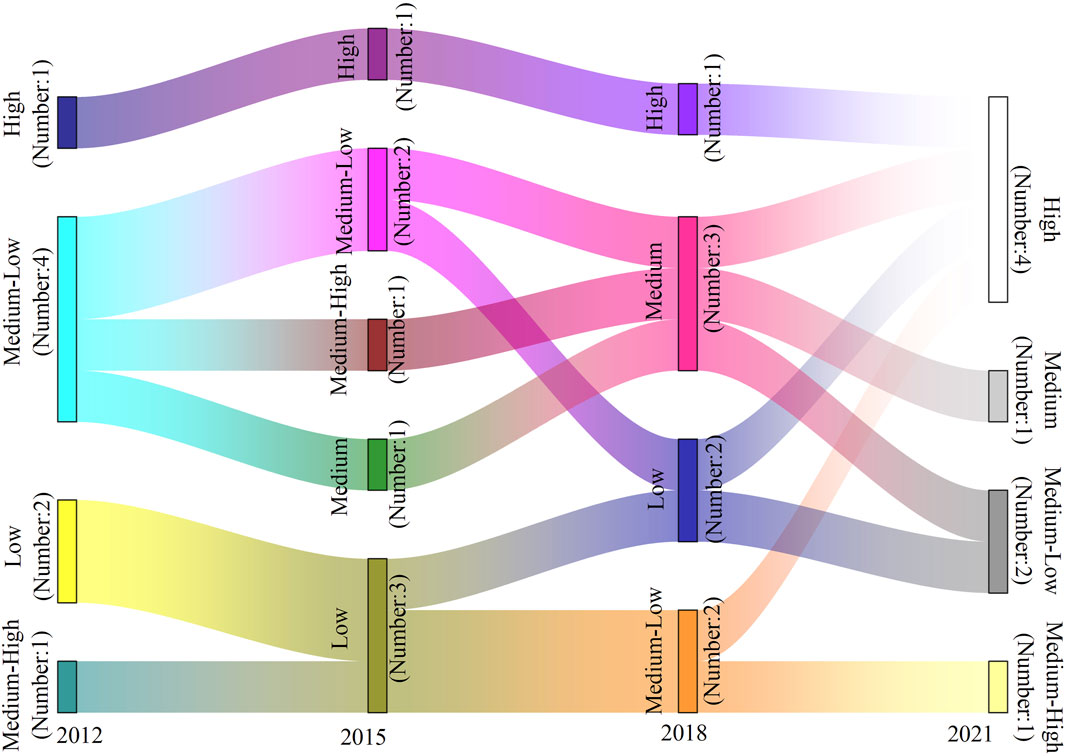
Figure 5. Change of ecological resilience grade of the UA in Shanxi Section of the YRB.
The Gini coefficient of ecological resilience in the UAs of the Shanxi section of the YRB remained relatively low with a fluctuating upward trend (Figure 6). It decreased during 2013–2016 and 2018–2019, indicating a narrowing gap in urban ecological resilience and improved spatial balance during these periods. The increase in the Gini coefficient during 2012–2013, 2016–2018, and 2019–2021 indicated an expanding gap in urban ecological resilience, with evident spatial disequilibrium during these periods. The Gini coefficient in 2021 was the highest over the past decade, indicating that efforts should be made to narrow the differences between cities in the Shanxi section of the YRB.
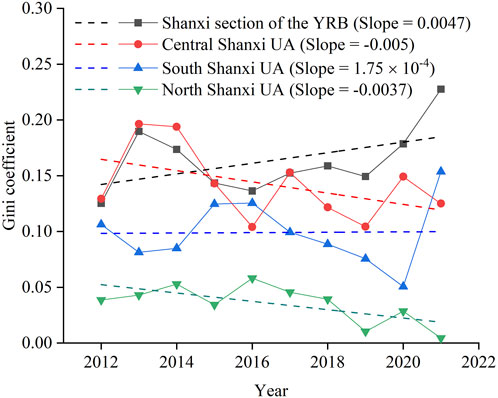
Figure 6. Difference of urban ecological resilience of the UA in Shanxi Section of the YRB.
The average Gini coefficient of the UAs was in the order: Central Shanxi (0.142) > South Shanxi (0.099) > North Shanxi (0.036) (Figure 6). The Central Shanxi UA had the highest Gini coefficient, indicating that the difference in ecosystem adaptability and resilience was owing to economic growth between cities within the UA. The ecological resilience of the North Shanxi UA was affected by geographical factors and the economic industrial structure. The regional differences were small and far lower than the average level in the Shanxi section of the YRB. Central Shanxi UA exhibited a fluctuating change with a decreasing trend. The regional difference in South Shanxi UA first decreased and then suddenly increased from 2020 to 2021, surpassing the Central Shanxi UA. The North Shanxi UA exhibited a fluctuating decreasing trend, the difference in ecological resilience between the two cities in the region gradually decreased, and development was gradually balanced.
The order of the average Gini coefficients among the three UAs in the Shanxi section of the YRB was: North and Central Shanxi (0.252) > Central and South Shanxi (0.191) > North and South Shanxi (0.118). The gap in natural conditions, economic and social development, and ecological level between the North, Central, and South Shanxi UAs led to the greatest difference in ecological resilience between the North and Central Shanxi UAs and the smallest difference between the North and South Shanxi UAs. Evolutionally, although differences in the urban ecological resilience among the three UAs displayed several fluctuations in 2013, 2016, and 2018, overall they exhibited an upward trend, and the differences among the UAs gradually increased (Figure 7). The urban ecological resilience of Central Shanxi UA has grown rapidly in the past 10 years, and the difference between this and the other two UAs has gradually increased. The natural environment foundation of North Shanxi UA is weak, the infrastructure is not perfect, social and economic development is relatively lagging, and the improvement in urban ecological resilience is relatively slow.
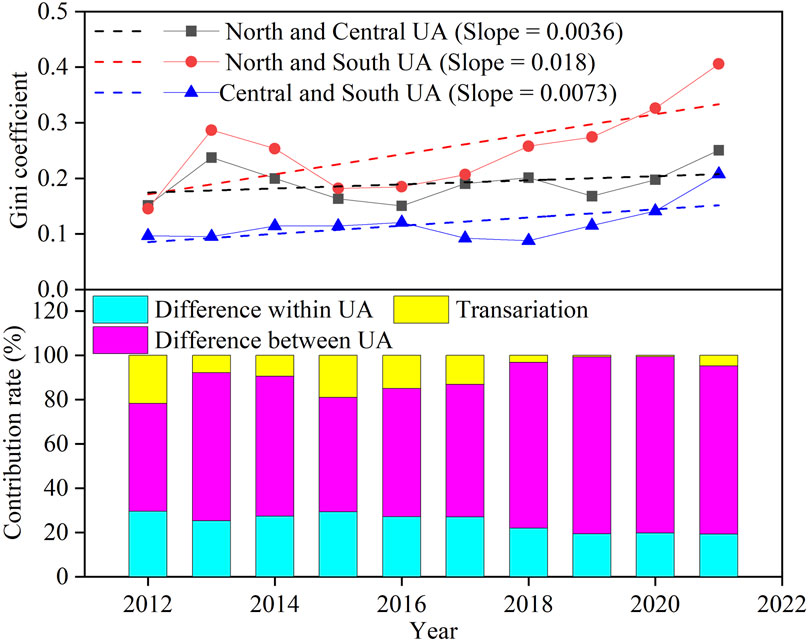
Figure 7. Difference and contribution rate of urban ecological resilience of UAs in Shanxi Section of the YRB.
The contribution rate of differences among UAs (65.82%) > differences within UAs (24.59%) > transariation (9.59%) (Figure 7). The development of differences within the UAs in the Shanxi section of the YRB was relatively stable, and exhibited a narrowing trend. The difference in change was mainly caused by the difference among the UAs, and this difference exhibited a rising trend. Combined with the above results, we should pay attention to the development of urban ecological resilience in North Shanxi UA and narrow the differences among the regions of North, Central, and South Shanxi UAs.
From 2012 to 2021, the ecological resilience of UAs in the Shanxi section of the YRB demonstrated a north-south distribution and moved slightly to the southeast (Figure 8). The azimuth decreased from 4.02° in 2012° to 3.73° in 2015, then increased to 4.38° in 2018, and finally decreased to 3.11° in 2021, indicating a counterclockwise shift in urban ecological resilience (Table 4). The centers of urban ecological resilience in 2012, 2015, 2018, and 2021 were located in Lvliang Wenshui County (112.159591°E, 37.325122°N), Jinzhong Pingyao County (112.177048°E, 37.295967°N), Lvliang Wenshui County (112.158105°E, 37.344768°N), and Jinzhong Pingyao County (112.234174°E, 37.227414°N), respectively. The trajectory of the center of gravity fluctuated in the northwest-southeast direction and moved 3.61 km from 2012 to 2015, 5.88 km from 2015 to 2018, 14.76 km from 2018 to 2021, and 12.63 km to the southeast overall. The standard deviation elliptical long axis continuously shortened from 452.53 km in 2012 to 406.45 km in 2021, the short axis increased from 152.91 km in 2012 to 160.39 km in 2021, and the oblateness decreased from 0.662 in 2012 to 0.605 in 2021. This indicates a clear agglomeration effect on the urban ecological resilience of the YRB along the long axis and an expansion trend along the short axis. From 2012 to 2021, the elliptical coverage area decreased from 54,346.16 km2 to 51,200.56 km2, with a total reduction of 3,145.6 km2, which further indicates a gradual enhancement in the single core agglomeration model of the urban ecological resilience in Shanxi section of the YRB and a strengthening of the radiation effect of Central Shanxi UA on other cities.
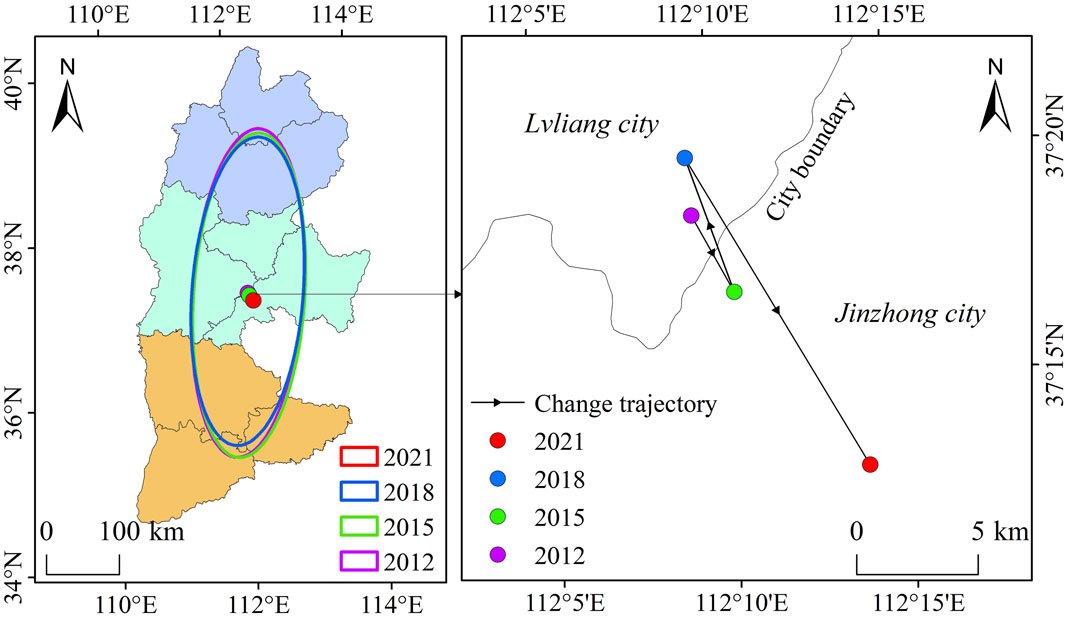
Figure 8. Standard deviation ellipse and center of gravity trajectory of urban ecological resilience in Shanxi section of the YRB.
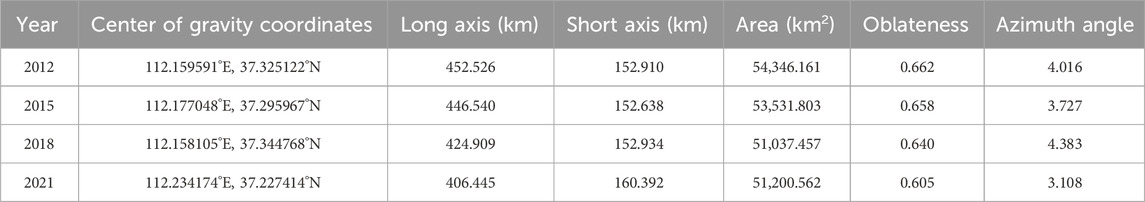
Table 4. Standard deviation ellipse parameters of urban ecological resilience of UA.
We considered the value of urban ecological resilience in the Shanxi section of the YRB as the dependent variable and the 15 influencing factors in Table 1 as independent variables. First, the data for each factor were converted into grade data using the natural breakpoint method. Then, the explanatory power q of each factor was calculated by introducing a geographical detector, that is, the influence of each factor on urban ecological toughness. The results indicated the top five influencing factors were X01 > X07 > X13 > X05 > X06 in 2012; X01 > X14 > X06 > X12 > X13 in 2015; X07 > X14 > X13 > X03 > X15 in 2018; and X03 > X15 > X10 > X12 > X07 in 2021 (Figure 9). Although the degree of influence of each factor on urban ecological resilience was different during different periods, the water supply per ten-thousand Yuan GDP, occupied area of construction land per ten-thousand Yuan GDP, green coverage rate in built-up areas, ratio of research and experimental development funds (R&D) to GDP, proportion of science and technology expenditure in local fiscal expenditure, and patent licensing quantity index were higher at each stage, which had a higher influence on urban ecological resilience.
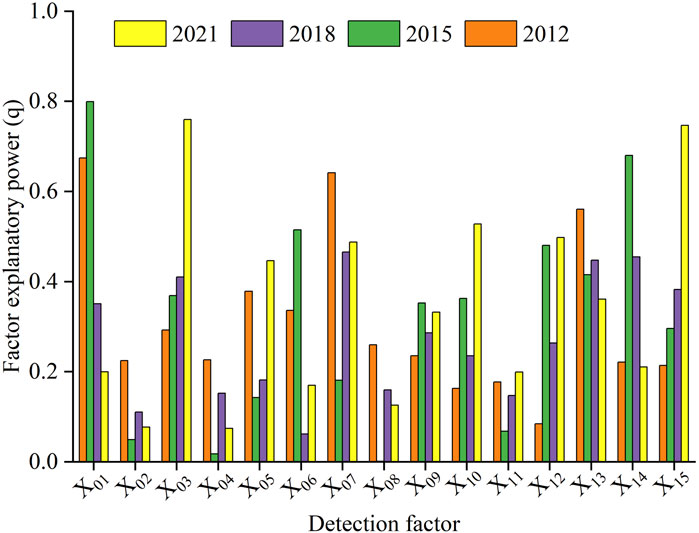
Figure 9. Explanatory power of different detection factors.
The results of the factor interaction detection revealed that most types of factor interactions were nonlinear enhancements (Figure 10). The q values of the interactions among the 15 factors in 2012, 2015, 2018, and 2021 increase significantly, indicating that the degree of interaction among the factors is significantly greater than a single factor. In 2012, X01, X07, and X13 had the most significant interactions with other factors; in 2015, X01, X06, and X14 had the most significant interactions with other factors; in 2018, X03 and X07 had the most significant interactions with other factors; and in 2021, X03 and X15 had the most significant interactions with other factors. The evolution of the interaction between two factors from 2012 to 2021 further shows that these factors are the leading factors affecting urban ecological resilience, and their influence tended to increase annually.
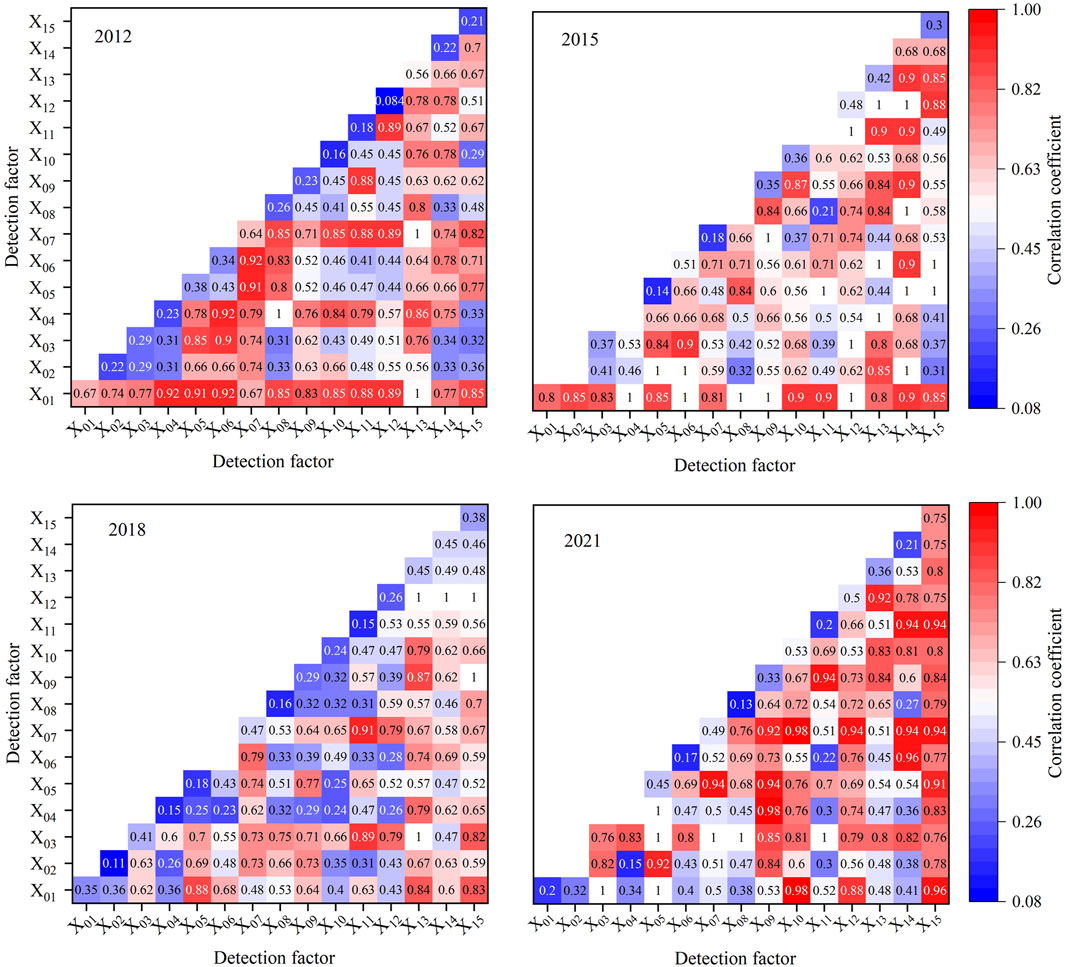
Figure 10. Results of interactive detection of urban ecological resilience factors.
Due to the development of urbanization and industrialization, the urban ecological environment is under great pressure. Resource-based cities have a long history and resource advantages, and have been the driving force of rapid economic development (Mohamed et al., 2021; Al-Housani et al., 2023). However, overdevelopment and serious environmental degradation are inevitable side effects of the development of resource-based cities (Taelman et al., 2018). As a province with large coal resources, Shanxi’s economic and industrial structure is relatively simple, the problem of ecological environmental debt is prominent, and ecological protection remains arduous.
Urban ecological resilience provides a set of new methods and tools for exploring the nonlinear relationship between urban ecosystems (Bottero et al., 2020; Zhao et al., 2021). Based on the theory of landscape ecology, the research paradigm of ecological network “identifying ecological source-building resistance surface-extracting ecological corridor” is established to explore how to enhance the resilience of ecosystem from the ecological point of view (Qiao et al., 2023; Wang et al., 2023). However, these studies often ignore the importance that ecological resilience is affected by human social activities. At present, The index system for evaluating urban ecological resilience still has limitations, and it is necessary to consider the impact of social activities on the ecosystem more comprehensively (Scheffer et al., 2015; Jia et al., 2023). When constructing the index system, we drew lessons from previous research results and highlighted the importance of ecosystem innovation ability. The weight assignment result of the entropy method further illustrates the important position of innovation development in the evaluation system. The analysis of the spatiotemporal evolution of urban ecological resilience reveals that the overall level of urban ecological resilience in the study area is low, which is consistent with existing research results of urban ecological resilience in the YRB (Li et al., 2023a; Wang et al., 2024). The results of this study reveal that the level of urban ecological resilience in the Shanxi Section of the YRB has an overall growth trend; however, the growth process of each UA fluctuates is slow, and the growth rate varies greatly. Since the 18th Communist Party of China National Congress made the strategic decision to “vigorously promote the construction of an ecological civilization,” the traditional development model of the YRB has improved, and the average level of ecological resilience of UAs in the Shanxi section of YRB improved during the study period. However, the process of improvement is difficult and must be repeated. In 2012, the level of urbanization gradually improved, the social and economic levels developed, and the natural growth rate of the population increased, exceeding the carrying capacity of ecological resources, which further affected the development of urban ecological resilience. Since 2015, with the vigorous promotion of supply-side reforms, Shanxi has begun to explore the transformation of its resource-based economy. The Soil and Water Conservation Plan of Shanxi Province (2016–2030) was declared in 2017, and the ecological restoration of “two mountains, seven rivers, and one watershed” was launched in 2018, guaranteeing the improvement of urban ecological resilience.
Taiyuan, the provincial capital city, has a leading advantage in terms of ecological resilience. The integrated development of Taiyuan, Xinzhou, and Jinzhong City is strengthening the coordinated development of surrounding cities. However, regional development in the North Shanxi UA lags behind, and is insufficient and unbalanced, which is the main reason for the difference in urban ecological resilience with other UAs. The results of the center-of-gravity migration also indicate that the development power of the North Shanxi UA is insufficient, and the center of gravity has moved to the southeast. According to the Outline of the National Plan for the Protection of Ecologically Fragile Areas (https://www.mee.gov.cn/), the two cities in Northern Shanxi belong to ecologically fragile areas and are most affected by human activities because of their special natural geographical conditions and concentrated mineral resources. The regional development of North Shanxi urgently needs to strengthen its ties with other regions and form a mutual aid link for overall development to enhance the urban ecological resilience of Shanxi Province.
Tong et al. (2023) suggested that both natural and human factors affected the spatial distribution of ecological resilience of the northernslope of Tianshan Mountain. Shi et al. (2022) suggested that socio-economic development was the main influencing factors of urban ecological resilience. In the present study, X01 and X03 in the pressure dimension had relatively high explanatory power, indicating the pressure of urban ecological resilience in the Shanxi Section of the YRB, mainly from urban water consumption intensity and land development intensity. In the state dimension, X07 reflected the level of urban greening, with higher influence level, indicating that increasing the green coverage area in built-up areas can effectively improve the quality of the urban ecological environment. In the response dimension, X09, X10, and X12 had the same intensity of forces, indicating that environmental governance, improvement in human settlements, and level of investment in environmental protection play important roles in the improvement of urban ecological resilience. The three factors X13, X14, and X15 in the innovation dimension had strong explanatory power, which demonstrates the importance of urban ecosystems in adapting to external disturbances and obtaining ecological resilience through learning and innovation functions. Considering the factors that restrict the development of urban ecological resilience, there are a few suggestions for the development of the Shanxi Section of the YRB.
(1) Scientific and technological innovations play a positive role in promoting urban ecological resilience. To improve urban ecological resilience, we should focus on the advantages of scientific and technological innovation, increase the introduction and training of researchers, and attach importance to investing scientific and technological funds and research and experimental development funds in the North Shanxi UA. Moreover, we should improve the output of scientific research in Central Shanxi and enhance the transformation capacity of urban ecosystems.
(2) The pressure of urban ecological resilience should be transformed and industrial transformation and upgradation encouraged, a green industrial system should be built, and the urban development model for high energy consumption changed. Strengthen common links among UAs, benign interactions among cities have to be encouraged, and a multidimensional cooperation mechanism established.
(3) Continue increasing efforts to promote ecological restoration and management of the YRB. The level of water resource management should be improved and water quality significantly improved, forest coverage and green coverage in built-up areas increased, urban green spaces expanded, the comprehensive utilization rate of general industrial solid waste strengthened, harmless treatment rate of domestic waste improved, centralized treatment rate of sewage treatment plants, and other urban pollution control efforts implemented.
It is necessary to acknowledge the limitations of this work. Considering the data availability, this study selected prefecture-level cities in the Shanxi Section of the YRB as the research objects. The sample size was relatively small, and the research scale was not detailed enough. Counties can be added for further detailed exploration to reflect the developmental status of urban ecological resilience more accurately. In addition, the related research on urban ecological resilience is still under exploration, with relatively limited references, The evaluation system is also still being improved, which needs to be further refined.
By constructing an evaluation index system for urban ecological toughness, this study explores the spatiotemporal evolution characteristics and dynamic development trends of urban ecological resilience in the Shanxi section of the YRB and discusses the influencing factors.
(1) From 2012 to 2021, the average level of urban ecological resilience in the Shanxi Section of the YRB was relatively low. The urban ecological resilience gradually transformed from the dual core of Taiyuan—Jincheng City to Taiyuan City as a single core, exhibiting a decreasing trend from the core to the peripheral cities.
(2) The spatial differences in the ecological resilience of the UAs in the Shanxi Section of the YRB are mainly caused by interregional differences, and this difference has an increasing trend. The largest regional differences were observed between Central Shanxi UA and North Shanxi UA, and those between North Shanxi UA and South Shanxi UA are minimal. During the study period, the standard deviation ellipse of urban ecological resilience in the UA in the Shanxi section of the YRB displayed a counterclockwise shifting trend; the oblateness decreased by 0.057, and the ellipse coverage area decreased by 3,145.6 km2. The center of gravity migration trajectory fluctuated in the “northwest-southeast” direction, and overall moved 12.63 km to the southeast.
(3) The water supply per ten-thousand Yuan GDP, occupied area of construction land per ten-thousand Yuan GDP, green coverage rate in built-up area, ratio of research and experimental development funds (R&D) to GDP, proportion of science and technology expenditure in local fiscal expenditure, and patent licensing quantity index have relatively high factor explanatory power at each stage. Most factor interaction types are nonlinear enhancements and the degree of influence of the interaction between factors is greater than a single factor.
The raw data supporting the conclusion of this article will be made available by the authors, without undue reservation.
JW: Methodology, Writing–original draft. ZL: Methodology, Writing–review and editing. YC: Conceptualization, Writing–review and editing. ZZ: Conceptualization, Writing–review and editing. SW: Writing–review and editing.
The author(s) declare that financial support was received for the research, authorship, and/or publication of this article. This research was funded by the Planning Subject of Philosophy and Social Sciences in Shanxi Province (No.2023YY069) and the Research Project of Philosophy and Social Sciences at Shanxi Universities (No. 2023W048).
Author ZL was employed by Shanxi Yituo Land Engineering Consulting Co., Ltd.
The remaining authors declare that the research was conducted in the absence of any commercial or financial relationships that could be construed as a potential conflict of interest.
All claims expressed in this article are solely those of the authors and do not necessarily represent those of their affiliated organizations, or those of the publisher, the editors and the reviewers. Any product that may be evaluated in this article, or claim that may be made by its manufacturer, is not guaranteed or endorsed by the publisher.
The Supplementary Material for this article can be found online at: https://www.frontiersin.org/articles/10.3389/fenvs.2024.1385604/full#supplementary-material
Alberti, M., and Marzluff, J. M. (2004). Ecological resilience in urban ecosystems: linking urban patterns to human and ecological functions. Urban Ecosyst. 7, 241–265. doi:10.1023/B:UECO.0000044038.90173.c6
Al-Housani, M. I., Koç, M., and Al-Sada, M. S. (2023). Investigations on entrepreneurship needs, challenges, and models for countries in transition to sustainable development from resource-based economy—Qatar as a case. Sustainability 15, 7537. doi:10.3390/su15097537
Boschma, R. (2015). Towards an evolutionary perspective on regional resilience. Reg. Stud. 49, 733–751. doi:10.1080/00343404.2014.959481
Bottero, M., Datola, G., and De Angelis, E. (2020). A system dynamics model and analytic network process: an integrated approach to investigate urban resilience. Land 9, 242. doi:10.3390/land9080242
Chen, H., Xu, J., Zhang, K., Guo, S., Lv, X., Mu, X., et al. (2022). New insights into the DPSIR model: revealing the dynamic feedback mechanism and efficiency of ecological civilization construction in China. J. Clean. Prod. 348, 131377. doi:10.1016/j.jclepro.2022.131377
Chen, Y., Su, X., and Zhou, Q. (2021). Study on the spatiotemporal evolution and influencing factors of urban resilience in the Yellow River Basin. Int. J. Environ. Res. Public Health. 18(19), 10231. doi:10.3390/ijerph181910231
Fan, Z. Y. (2023). Research on evolution of spatial-temporal patterns and influencing factors of urban resilience in China’s loess plateau. Lanzhou: Lanzhou University. doi:10.27204/d.cnki.glzhu.2023.000579
Hosseini, S., Barker, K., and Ramirez-Marquez, J. E. (2016). A review of definitions and measures of system resilience. Reliab. Eng. Syst. Saf. 145, 47–61. doi:10.1016/j.ress.2015.08.006
Huang, J., Zhong, P. S., Zhang, J. Z., and Zhang, L. (2023). Spatial-temporal differentiation and driving factors of ecological resilience in the Yellow River Basin, China. Ecol. Indic. 154, 110763. doi:10.1016/j.ecolind.2023.110763
Jia, H., Luo, P., Yang, H., Luo, C., Li, H., Cheng, Y., et al. (2023). Constructing an indices system for evaluating the ecological integrity of forests in western Sichuan, China based on structural equation modeling. Ecol. Indic. 146, 109745. doi:10.1016/j.ecolind.2022.109745
Li, D., Yang, W., and Huang, R. (2023a). The multidimensional differences and driving forces of ecological environment resilience in China. Environ. Impact Asses. 98, 106954. doi:10.1016/j.eiar.2022.106954
Li, G. Z., and Wang, L. Q. (2023b). Study of regional variations and convergence in ecological resilience of Chinese cities. Ecol. Indic. 154, 110667. doi:10.1016/j.ecolind.2023.110667
Liao, Z., and Zhang, L. (2023). Spatio-temporal analysis and simulation of urban ecological resilience in Guangzhou City based on the FLUS model. Sci. Rep. 13, 7400. doi:10.1038/s41598-023-33342-5
Meerow, S., Newell, J. P., and Stults, M. (2016). Defining urban resilience: a review. Landsc. Urban Plan. 147, 38–49. doi:10.1016/j.landurbplan.2015.11.011
Mohamed, B. H., Ari, I., Al-Sada, M. b.S., and Koç, M. (2021). Strategizing human development for a country in transition from a resource-based to a knowledge-based economy. Sustainability 13, 13750. doi:10.3390/su132413750
Qiao, Q., Zhen, Z., Liu, L., and Luo, P. (2023). The construction of ecological security pattern under rapid urbanization in the Loess Plateau: a case study of Taiyuan City. Remote Sens. 15 (6), 1523. doi:10.3390/rs15061523
Scheffer, M., Carpenter, S. R., Dakos, V., and van Nes, E. H. (2015). Generic indicators of ecological resilience: inferring the chance of a critical transition. Annu. Rev. Ecol. Evol. Syst. 46, 145–167. doi:10.1146/annurev-ecolsys-112414-054242
Shi, C., Zhu, X., Wu, H., and Li, Z. (2022). Assessment of urban ecological resilience and its influencing factors: a case study of the beijing-tianjin-hebei urban agglomeration of China. Land 11, 921. doi:10.3390/land11060921
Song, Y., Gui, Z., Wu, H., and Wei, Y. (2017). A web-based framework for visualizing industrial spatiotemporal distribution using standard deviational ellipse and shifting routes of gravity centers. Int. Arch. Photogramm. Remote Sens. Spat. Inf. Sci. XLII–2/W7, 129–135. doi:10.5194/isprs-archives-XLII-2-W7-129-2017
Taelman, S. E., Tonini, D., Wandl, A., and Dewulf, J. (2018). A holistic sustainability framework for waste management in European cities: concept development. Sustainability 10, 2184. doi:10.3390/su10072184
Tong, Y., Lei, J., Zhang, S., Zhang, X., Rong, T., Fan, L., et al. (2023). Analysis of the spatial and temporal variability and factors influencing the ecological resilience in the urban agglomeration on the northern slope of tianshan mountain. Sustainability 15, 4828. doi:10.3390/su15064828
Wang, J. F., Li, X. H., Christakos, G., Liao, Y. L., Zhang, T., Gu, X., et al. (2010). Geographical detectors-based health risk assessment and its application in the neural tube defects study of the Heshun Region, China. Int. J. Geogr. Inf. Sci. 24, 107–127. doi:10.1080/13658810802443457
Wang, J. F., and Xu, C. D. (2017). Geodetector: principle and prospective. Acta Geogr. Sin. 72, 116–134. doi:10.11821/dlxb201701010
Wang, M. X., Zhao, H. H., Cui, J. X., Fan, D., Lv, B., Wang, G., et al. (2018). Evaluating green development level of nine cities within the Pearl River Delta, China. J. Clean. Prod. 174, 315–323. doi:10.1016/j.jclepro.2017.10.328
Wang, S. M., Ning, W. P., Niu, J. L., and An, K. (2024). Spatiotemporal differentiation and convergence of urban ecological resilience in the Yellow River Basin: an empirical analysis based on 61 cities in seven major urban agglomerations. Arid. Land Geogr. 47, 93–103. doi:10.12118/j.issn.1000-6060.2023.323
Wang, Y., Cai, Y., Xie, Y., Chen, L., and Zhang, P. (2023). An integrated approach for evaluating dynamics of urban eco-resilience in urban agglomerations of China. Ecol. Indic. 146, 109859. doi:10.1016/j.ecolind.2023.109859
Wu, J. G. (2014). Urban ecology and sustainability: the state-of-the-science and future directions. Landsc. Urban Plan. 125, 209–221. doi:10.1016/j.landurbplan.2014.01.018
Yang, M., Jiao, M., and Zhang, J. (2022). Research on urban resilience and influencing factors of Chengdu-Chongqing economic Circle. Sustainability 14, 10585. doi:10.3390/su141710585
Yuill, R. S. (1971). The standard deviational ellipse; an updated tool for spatial description. Geogr. Ann. B 53, 28–39. doi:10.1080/04353684.1971.11879353
Zambom, A. Z., and Ronaldo, D. (2013). A review of kernel density estimation with applications to econometrics. Int. Econ. Rev. 5, 20–42. doi:10.48550/arXiv.1212.2812
Zhang, L., Ma, X., Ock, Y. S., and Qing, L. (2022). Research on regional differences and influencing factors of Chinese industrial green technology innovation efficiency based on dagum Gini coefficient decomposition. Land 11, 122. doi:10.3390/land11010122
Zhao, R., Fang, C., Liu, H., and Liu, X. (2021). Evaluating urban ecosystem resilience using the DPSIR framework and the ENA model: a case study of 35 cities in China. Sustain. Cities Soc. 72, 102997. doi:10.1016/j.scs.2021.102997
Keywords: Yellow River Basin, urban ecological resilience, spatiotemporal evolution, high quality development, influencing factors
Citation: Wang J, Lv Z, Cao Y, Wang S and Zhen Z (2024) Spatial-temporal evolution and influencing factors of ecological resilience in urban agglomerations: a case study of Shanxi section of the Yellow River Basin. Front. Environ. Sci. 12:1385604. doi: 10.3389/fenvs.2024.1385604
Received: 14 February 2024; Accepted: 11 March 2024;
Published: 21 March 2024.
Edited by:
Xiaoping Wang, Northwest A&F University, ChinaReviewed by:
Wang Juan, Soil and Water Conservation Monitoring Center of Pearl River Basin, Pearl River, ChinaCopyright © 2024 Wang, Lv, Cao, Wang and Zhen. This is an open-access article distributed under the terms of the Creative Commons Attribution License (CC BY). The use, distribution or reproduction in other forums is permitted, provided the original author(s) and the copyright owner(s) are credited and that the original publication in this journal is cited, in accordance with accepted academic practice. No use, distribution or reproduction is permitted which does not comply with these terms.
*Correspondence: Zhilei Zhen, emhlbmNoZW5nQHN4YXUuZWR1LmNu
Disclaimer: All claims expressed in this article are solely those of the authors and do not necessarily represent those of their affiliated organizations, or those of the publisher, the editors and the reviewers. Any product that may be evaluated in this article or claim that may be made by its manufacturer is not guaranteed or endorsed by the publisher.
Research integrity at Frontiers
Learn more about the work of our research integrity team to safeguard the quality of each article we publish.