 Jiaer Zhang1,2Yuxin Xie1,2Jingru Zhang3Mai Ye3Jieyi Diao1,2Jianwen Wang1,2Qiongping Sun1,2
 Tieyu Wang1,2*
- 1Guangdong Provincial Key Laboratory of Marine Disaster Prediction and Prevention, Shantou University, Shantou, China
- 2Institute of Marine Sciences, Shantou University, Shantou, China
- 3Guangdong Provincial Academic of Environmental Science, Guangzhou, China
Perfluoroalkyl substances (PFAS) are an emerging class of contaminants that have been produced since the 1950s. The first report on PFAS to raise global concerns was published in 2001. Since then, many countries have implemented policies to control PFAS. In this study, PFAS in the water, sediment, and biota in coastal areas were surveyed to review their use since their earliest production by using chronological methods combined with previous policy restrictions imposed on PFAS. In the meantime, reports of existing PFAS were evaluated to assess the ecological and health risks of seafood consumption by coastal populations. Following the restrictions on PFAS, the concentrations of PFAS have been decreasing steadily. With regard to the current occurrences of PFAS in water and sediment, there is almost no ecological risk. However, different gender and age groups are still at risk of exposure to perfluorooctane sulfonate and require constant monitoring. It is expected that the negative impacts of PFAS on the environment and human health will continue to decrease with the implementation of the emerging pollution control policy by the Chinese government in 2023.
1 Introduction
Perfluoroalkyl substances (PFAS) are an emerging class of contaminants that are characterized by the replacement of hydrogen atoms in the carbon chain with fluorine atoms (Wang et al., 2018; Evich et al., 2022). They are widely used in industrial and commercial applications owing to their unique chemical properties (Nilsson et al., 2023). The earliest production of PFAS dates back to the 1950s when 3M Company manufactured perfluorooctanoic acid (PFOA) and perfluorooctane sulfonate (PFOS) (3M Company, 1999, 2000). Owing to their thermal stability, surfactant, and hydrophobic properties, they have been widely used in various industries, including aerospace, food packaging, fire extinguishing foam, electronics, semiconductors, and textiles (Zushi et al., 2011; Pan et al., 2020; Chirikona et al., 2022). Given the popularity of PFAS in the industry, 3M Company subsequently began to produce PFAS in large quantities.
The first paper on PFAS was published in 2001 in the journal Environmental Science and Technology (Giesy and Kannan, 2001). Since then, several related articles have been published, highlighting the potential harm to the environment and human health from the use of PFAS; this has raised public concern about their use (Fenton et al., 2021). Because of their unique physical and chemical properties as well as extensive utilization, PFAS persist in the environment in air, water, soil, sediment, and organisms, while also migrating among these media (Yao et al., 2017; Liu et al., 2019; Yin et al., 2022). Goodrow et al. (2020) reported that the PFOS levels in almost all fish species were high enough to trigger fish consumption advisories. The Agency for Toxic Substances and Disease Registry (ATSDR) has indicated that PFAS are linked to harmful health effects, including reduced kidney function, metabolic syndrome, thyroid disruption, and adverse pregnancy outcomes. Ward-Caviness et al. (2022) noted that PFAS are linked to dyslipidemia, hypertension, ischemic heart disease, and osteoporosis.
Owing to the significant risks posed by PFAS to the environment and human health, many countries have implemented stringent monitoring measures for dynamic hazards. In 2009, PFOS (including its salts and related compounds) was listed in Annex B (restriction) of the Stockholm Convention, prompting strict regulation. Subsequently, in 2013, the Chinese government imposed restrictions on the use of PFOS and its derivatives, mandating their phase-out use and exploration of alternative substances. Continuing this trend, in 2019, PFOA (as well as its salts and related compounds) was listed in Annex A (elimination, with specific exemptions) of the Stockholm Convention. The Chinese government has promulgated new pollutant control actions since 2022 that are aimed at strengthening the management of persistent organic pollutants, endocrine disruptors, and antibiotics while effectively ensuring the safety of the environment and people’s health.
The detection of PFAS in water and biota provides effective information on the current use of PFAS (Anschutz and Charbonnier, 2020; Sebastiano et al., 2021), especially after the implementation of restrictive policies in various countries. Sediments have the capacity for adsorption and desorption of PFAS, so they are recognized as significant reservoirs for these compounds (Eschauzier et al., 2010). Analyzing sediment core chronology, PFAS concentrations, and sediment grain sizes can enable researchers to elucidate the historical trends in PFAS use, compare changes in the PFAS levels following different regulatory measures, and evaluate the efficacy of such interventions (Mourier et al., 2019). Seafood is the main route of human exposure to PFAS (Gao et al., 2020; Du et al., 2021); therefore, it is essential to analyze the sources of PFAS, assess the risks to marine organisms, and evaluate the dietary exposure risks to coastal populations (Mu et al., 2022). This enables the evaluation of whether PFAS still present health risks to coastal populations following the enactment of various regulatory measures.
The objectives of the present study were as follows: (1) to analyze the occurrences of PFAS in water, sediments, and biota from an intensively developed coastal area; (2) to trace the PFAS using principal component analysis (PCA) and cluster analysis to estimate the current PFAS emissions; (3) to trace the historical trends of PFAS by chronology, sediment grain sizes, and concentrations; and (4) to assess the ecological risk to marine biota and exposure risk to coastal residents. The present study provides data and evidence to support the implementation of the China Control Action Plan for emerging pollutants.
2 Materials and methods
2.1 Sample collection
All sediment and seawater samples were collected in November 2021 from the eastern region of the South China Sea (Figure 1). A total of 10 sampling points were selected, namely, W1/S1, W2, W3/S3, W4, W5, W6/S6, W7, W8, W9, and W10/S10. Here, “W” denotes water, and “S” denotes sediment. The sampling point W1/S1 was located in a densely populated area that had undergone a dredging project. Points W3/S3 and W4 were situated in close proximity to an aquaculture zone, while W6/S6 was situated near Guangdong province’s renowned aquaculture area. Finally, points W9 and W10 were situated far from shore. The sediment samples were collected using an SDI VC-D sediment sampling rig. The samples were then immediately cut into 2 cm pieces, sealed in zipper storage bags, and stored in a refrigerator. Seawater samples (from about 50 cm below the water surface) were collected using a stainless steel container and stored in 2-L polypropylene (PP) containers. In total, four surface sediment samples, two sediment cores, and 10 seawater samples were collected and transported to the laboratory before being stored at −20°C. All tools and containers were cleaned at least three times with Milli-Q water and methanol. The information on the sampling sites is listed in Supplementary Table S1.
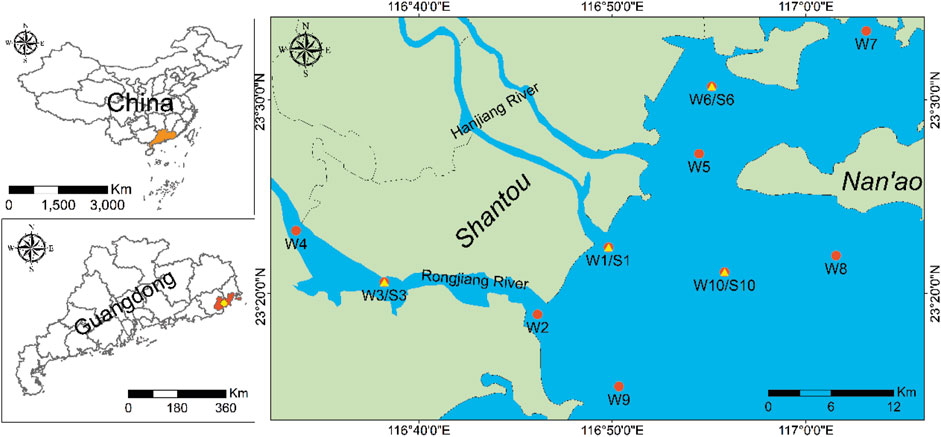
Figure 1. Locations of the environmental samples in the study area. The red circles are water sample sites, and the yellow triangles are sediment sample sites.
2.2 Materials and reagents
A total of 21 PFAS standards (PFBS, PFHxS, PFOS, PFDS, PFBA, PFPeA, PFHxA, PFHpA, PFOA, PFNA, PFDA, PFUnDA, PFDoA, PFTrDA, PFTeDA, PFHxDA, PFODA, PFMOPrA, PFMOBA, ANODA, and F-53B) and 9 PFAS internal standards (13C4PFBA, 13C4 PFHxA, 13C4 PFOA, 13C4 PFNA,13C4 PFDA, 13C4 PFUndA, 13C2 PFDoA, 18O2 PFHxS, and 13C4 PFOS) were purchased from Wellington Laboratories (Guelph, ON, Canada). The internal standards each had purity equal to or exceeding 98%. Acetonitrile, methanol, and methyl tert-butyl ether (MTBE) were purchased from J.T. Baker (Phillipsburg, NJ, United States). Ammonium acetate was purchased from J&K Chemicals. Detailed information is listed in Supplementary Table S2.
2.3 Sample treatment
Seawater samples were prepared and purified according to the following methods (Wang et al., 2019; Diao et al., 2022). Fiberglass filters (GFF, Whatman, O.D. 47 mm, 0.7 μm) were used to filter the seawater samples. Then, 5 ng of the internal standard was added to an 800-mL sample of seawater before extraction by solid-phase extraction (SPE). Specifically, the OASIS WAX cartridges were treated with 4 mL of 0.1% NH4OH in methanol, 4 mL of methanol, and 4 mL of Milli-Q water, followed by 25 mM ammonium acetate that was used to wash the cartridge after extraction. The cartridges were eluted using 4 mL of 25 mmol ammonium acetate, 4 mL of methanol, and 4 mL of 0.1% NHOH in methanol. The eluate was concentrated to 0.5 mL using high-purity nitrogen. Finally, a nylon filter was used to filter the concentrated solution into a 1.5-mL PP snap-top autosampler via a polyethylene (PE) septa. The full details are given in the Supplementary Material.
The sediment samples were wrapped in aluminum foil and frozen at −20°C in a refrigerator. After freeze-drying the samples for 48 h, the sediment samples were ground into powder in a grinding machine. Next, about 2 g of the sediment sample, 2 mL of the sodium hydroxide: acetonitrile solution (8:2), and 5 ng of the internal standard were added to a 50-mL PP tube, followed by ultrasonication with an ultrasonic cleaner and the subsequent addition of 20 mL of acetonitrile. After shaking for at least 30 min at 250 rpm, a 100-μL solution of 2 mol/L hydrochloric acid was added. The mixture was then centrifuged at 3,000 rpm for 15 min, and the organic layer was separated into a new PP tube. This solution was then evaporated using a nitrogen stream. The ENVI-Carb was cleaned three times with 1 mL of methanol, and the concentrated solution was transferred to the ENVI-Carb. The PP tube was also cleaned with 3 mL of methanol, and the solution was transferred to the ENVI-Carb. The following steps were the same as those of the SPE method (Chen et al., 2019; Sun et al., 2021a).
The biological samples were dissected and freeze-dried at −50°C for 72 h. A grinding machine was used to grind the muscle tissue into powder. Approximately 1 g of the biological sample was added into a 15-mL PP tube along with 1 mL of 0.5 M TBAHS, 2 mL of Na2CO3 aqueous solution, 5 ng of the internal standard, and 5 mL of MTBE. The remaining steps are the same as those used to analyze the sediment samples (Sun et al., 2021b).
2.4 Instrumental analysis
A Thermo Ultimate 3,000 Infinity HPLC System equipped with a Thermo TSQ ENDURA LC/MS System was used for electrospray ionization (ESI) in the negative ion mode with multiple reaction monitoring (MRM) of the target analytes. The HPLC-ESI-MS instrument conditions are listed in Supplementary Table S3. An Agilent ZORBAX Eclipse Plus (C18, 2.1 × 100 mm, 3.5 μm, Agilent) connected with a guard column (Agilent) was used as the column. The mobile phase used was 2 mM of ammonium acetate (A) and 100% acetonitrile (B). Then, 5-μL samples were extracted and injected into the column at 0.3 mL/min. Supplementary Table S4 lists the chemical formulas, parent ions, quantitative ions, and qualitative ions of the PFAS tested in this study.
2.5 Sediment chronology
The sediment core samples were analyzed for radionuclides at the State Key Laboratory of Estuarine and Coastal Sciences, East China Normal University (Shanghai, China). The 210Pb and 137Cs radioactive dating techniques were used to determine the activities of 210Pb, 137Cs, 226Ra, and other radioactive isotopes in each of the sediment samples (Appleby, 2008; Zhang Y. Q. et al., 2021). The specific operation steps were as follows: a freeze-dried and ground sample was placed in a clean PP tube for compaction and testing after 1 month. The samples were analyzed using gamma spectrometry by counting for at least 24 h. The excess 210Pb (210Pbex) activity in the sample was determined from the difference between the total 210Pb activity and 226Ra activity.
2.6 Determination of sediment grain size
After drying the soil sample, approximately 5 g were retrieved to remove impurities (Lund et al., 2021). Chemical pretreatment was then performed before testing: (1) the samples were each treated with 30% H2O2 for 24 h to remove organic matter; (2) to remove carbonate impurities, 10% HCl was used for 24 h; (3) the particle size distribution of each sample was measured using the Mastersizer 3,000 (Malvern Panalytical, UK). The average value of each sample was obtained from three repeated measurements, and the guaranteed error was less than 0.1%. The theoretical basis of the Mastersizer 3,000 is the Michaelis scattering theory, with a measuring range of 0.02–2000 μm and granularity resolution of up to 0.01 φ.
2.7 Quality assurance and control
To reduce the influence of background contamination, field and laboratory blanks were prepared. Twenty samples were used to prepare a blank, which was then analyzed in the same manner as the samples. The results showed that the concentrations in all the blanks were significantly lower than those of the samples. All experimental tools were cleaned at least three times using Milli-Q water and methanol. The limit of detection (LOD) was given by a 3:1 signal-to-noise ratio, and the limit of quantification (LOQ) was determined by a 10:1 signal-to-noise ratio. The rates of recovery for water, sediment, and biota ranged between 80% and 120%. The gradients of the curves were set at concentrations of 0.005, 0.05, 0.1, 1, 10, 50, 100, and 200 ng/mL with 10 ng/mL of the internal standards. Each of the PFAS had a correlation coefficient (R2) of around 0.99. The LOD, LOQ, and recovery rates are shown in Supplementary Table S5.
2.8 Data analysis
2.8.1 Bioaccumulation factor
The bioaccumulation factor (BAF) was used to represent the accumulation of pollutants in aquatic organisms. The calculation of the BAF is given by the following equation (Liu et al., 2017; Du et al., 2021):
where Cbiological is the concentration of a single PFAS in the organism; Cwater is the concentration of a single PFAS in water.
2.8.2 Risk quotient
The risk quotient (RQ) is a common index of ecological risk and is calculated by the following equation (Zhao et al., 2013; Yang et al., 2020):
The RQmix of a PFAS is calculated by summing the RQs of the individual PFAS:
where MEC is the measured environmental concentration (ng/L; ng/g dw) and PNEC is the predicted no-effect concentration of a single chemical. The PNEC values used in this study were derived from the literature.
2.8.3 Estimated daily intake (EDI) and hazard ratio (HR)
Seafood intake is an important pathway for PFAS to enter the human body. In this study, the seafood consumption, population, age distribution, and sex ratio of Shantou city were used to calculate the risk of exposure to PFAS for different age groups and genders. The calculation of EDI is based on the following equation (Vassiliadou et al., 2015):
where C is the average concentration of PFAS in seafood, IR is the average daily intake of seafood (g/day), and BW is the average body weight of the residents (kg).
To quantitatively determine the health risks of PFAS, the hazard ratio (HR) was calculated using the following equation (Wang et al., 2017):
where RfD is the benchmark derived from toxicological experiments. The RfD data in this study were gathered from the published literature, and the detailed information is shown in the Supplementary Material.
PCA and hierarchical cluster analysis were used to group the compositions of PFAS at different sampling points and to characterize the possible sources of the PFAS. Origin 2019 (Origin Lab Corp., MA, United States) and the SPSS 22.0 Statistics program (Chicago, IL, United States) were used for the statistical analyses.
3 Results and discussion
3.1 PFAS in water, sediment, and typical marine biota
In this study, a total of four perfluoroalkyl sulfonic acids (PFSAs: PFBS, PFHxS, PFOS, and PFDS) and 12 perfluorinated carboxylic acids (PFCAs: PFBA, PFPeA, PFHxA, PFHpA, PFOA, PFNA, PFDA, PFUnDA, PFDoA, PFTrDA, PFTeDA, and PFHxDA) were detected in the water, sediment, and biota samples. Figure 2 displays the molecular structures of the principal PFAS compounds examined. As the concentrations of PFDS were lower than those of MDL, they are not discussed henceforth. Additionally, the investigation revealed the presence of four emerging PFAS compounds (ADONA, PFMOBA, PFMOPrA, and F-53B) in both sediment and water samples. Detailed information on the detection rates (DRs) is listed in Supplementary Table S6.
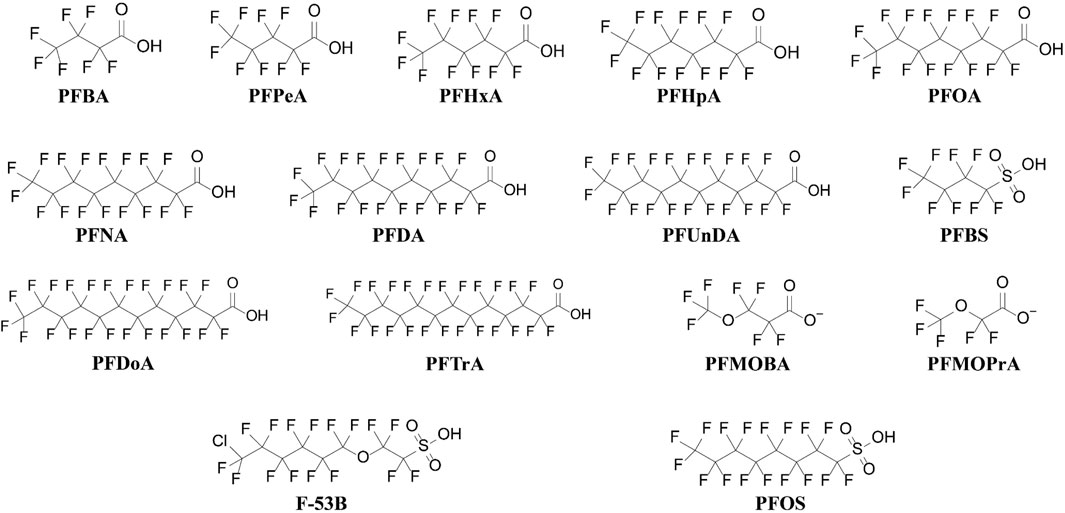
Figure 2. Structures of the main PFAS.
The concentrations of the PFAS in the water samples ranged from 13.08 to 57.70 ng/L, with an average of 29.60 ng/L (Figure 3A). Notably, higher PFAS concentrations were recorded in samples from the streamway (W3: 57.70 ng/L, W4: 43.83 ng/L) and the bay (W6: 42.06 ng/L) compared to the other locations. Offshore sampling sites (W8: 13.08 ng/L, W9: 20.33 ng/L, W10: 17.18 ng/L) had low concentrations compared to the other sites (Table 1). In the surface sediment samples, the concentrations ranged from 0.96 to 1.35 ng/g dw, with an average of 1.17 ng/g dw. The inshore (S1: 1.35 ng/g dw) and streamway (S3: 1.34 ng/g dw) locations registered the highest PFAS concentrations, whereas the lowest concentration was detected offshore (S10: 1.04 ng/g dw). Interestingly, in the surface sediments of the stream (S3), bay (S6), and offshore (S10) sites, the highest concentrations were not found in the top layer (0–4 cm), but rather in the second layer (4–8 cm), as illustrated in Figure 3B. As the ocean sediment is the ultimate sink for the PFAS, these results provide new evidence for the depletion of PFAS stocks in the surrounding market in the context of gradual phase-out and restriction. The detailed water and sediment concentrations are listed in Supplementary Table S7, and the surface sediment core concentrations are listed in Supplementary Table S8.
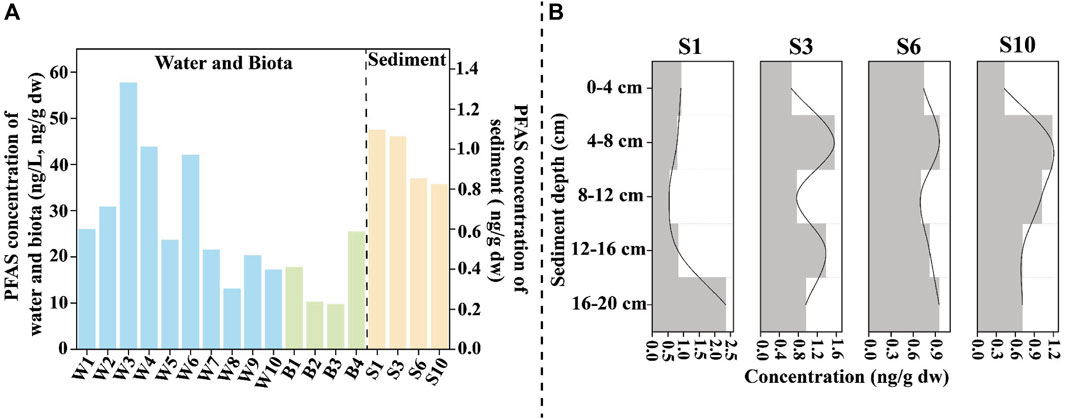
Figure 3. Concentrations of PFAS in the environmental matrix and biota. (A) PFAS in the water, biota, and sediment samples; (B) PFAS in the sediment cores (0–20 cm).
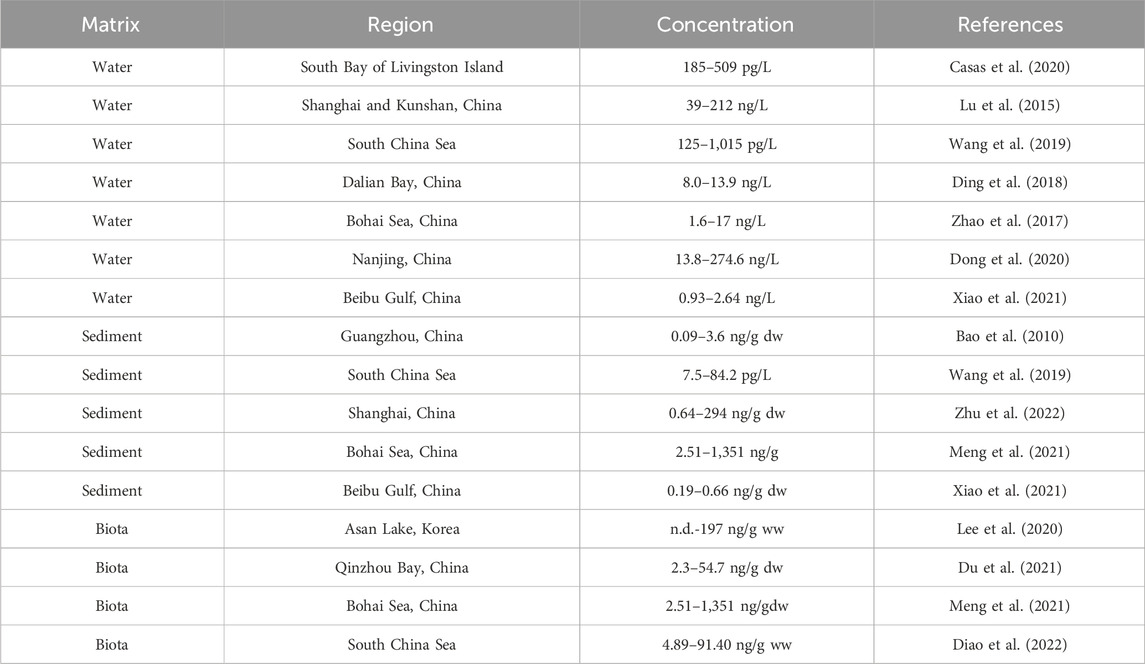
Table 1. Concentrations of PFAS in other locations around the world.
S1 and W1 are situated on the east coast of Shantou city, an area affected by both sea reclamation and intense human activity. W3 and W4 are located downstream of the Rong River, which flows through a densely populated area and has the highest concentration of pollutants. In contrast, W2, which is situated near the estuary, benefits from the natural dilution and dispersion processes inherent to such geographic settings, which help mitigate pollutant concentrations. Despite this natural advantage, pollutant levels at W2 remain elevated compared to those in adjacent waters, underscoring the persistent impact of human activity on the environment. W6 is close to the coast and is an offshore aquaculture area, where the abandonment of aquaculture equipment may lead to the continuous release of PFAS. In addition, W6 is located in a bay, which reduces the water exchange capacity of this region. W8, W9, and W10 are situated far from the shore and are subject to dilution by seawater; therefore, the concentrations of PFAS were low. The water and sediment samples showed similar trends, revealing high levels of PFAS in the nearshore areas, which decrease toward open marine waters.
The concentrations in the biota samples ranged from 9.71 to 25.44 ng/g dw, with an average of 15.80 ng/g dw. Notably, higher PFAS concentrations were detected in organisms occupying higher trophic levels, such as Clarias macrocephalus and Portunus gladiator Fabricius, with concentrations of 17.79 ng/g dw and 25.44 ng/g dw, respectively. Mytilus edulis (B2: 10.26 ng/g dw) and Ostrea gigas Thunberg (B3: 9.71 ng/g dw) are in the low trophic level, so their PFAS concentrations were lower than those in B1 and B4 (Supplementary Table S9). When comparing these results to those of other studies, the PFAS levels in the biota from the eastern region of the South China Sea are considered to be moderate to low (Table 1), suggesting a varied distribution of PFAS contamination across different marine environments and species.
3.2 Compositions of PFAS in the environment and biota
In this study, a total of 16 target PFAS compounds, including three novel PFAS (F-53B, PFMOBA, and PFMOPrA), were identified in water samples, as illustrated in Figure 4. The frequencies of detection and concentrations of the long-chain PFAS (C > 8) were lower than those of the short-chain PFAS (C < 8). This trend is attributed to the higher water solubility and lower n-octanol/water partition coefficients of the short-chain PFAS, making them more prevalent in aquatic environments. The higher proportion of short-chain PFAS in the South China Sea was consistent with the observations of previous studies (Zheng et al., 2017; Wang et al., 2019). The dominant compounds were PFBA (49.43%–90.76%; 10.05 ng/L to 46.12 ng/L) and PFOA (3.12%–10.31%; 1.35 ng/L to 2.33 ng/L). Compared with other studies, Wang et al. (2018) reported the presence of PFBA (17.8 pg/L to 340.8 pg/L) and PFOA (< LOQ to 400.7 pg/L), which were the main compounds in the coastal region of the South China Sea. The noted increase in PFBA levels and decrease in PFOA concentrations suggest transitions in PFAS usage from long-chain to short-chain compounds in coastal areas. Specifically, PFPeA was detected exclusively offshore (W9), and PFUnDA was found only in the river samples (W4). Notably, the novel PFAS PFMOBA and PFMOPrA were detected in all water samples, replacing PFOA and PFOS. F-53B was detected at five sites. The toxicological implications of these novel PFAS are not fully understood, and the study by Woodlief et al. (2021) suggests potential effects on the immune system. With the increasing use of novel PFAS, their release into the environment is expected to increase over time. Unlike long-chain PFAS, which can be treated through traditional processes, novel PFAS pose challenges for treatment and have toxicological potential (Zhang et al., 2021; Woodlief et al., 2021).
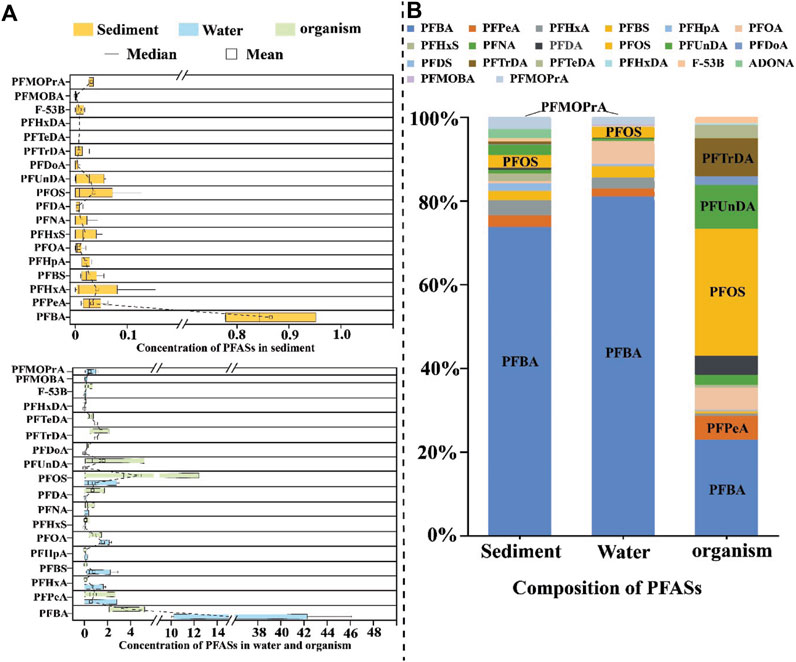
Figure 4. PFAS concentrations and compounds in the water, sediment, and biota: (A) 18 compounds of the PFAS in sediment (yellow), water (blue), and biota (green); (B) percentage compositions of 20 PFAS compounds in the sediment, water, and biota.
Seventeen PFAS were detected in the sediment samples: 10 PFCAs (PFBA, PFPeA, PFHxA, PFHpA, PFOA, PFNA, PFDA, PFUnDA, PFDoA, and PFTrDA), 3 PFSAs (PFBS, PFHxS, and PFOS), and 4 novel PFAS (F-53B, ADONA, PFMOBA, and PFMOPrA). In contrast to the water samples, PFTrDA and ADONA were detected and PFHxDA was not found in the sediment samples. Similar to the findings in the water samples, short-chain PFAS were more frequently detected in the sediments than long-chain PFAS, indicating a significant transfer of short-chain compounds from water to sediment. Notably, PFTrDA was detected in the surface sediment at a streamway sampling site (S3); the deposition process at this site is known to be influenced by external factors and is also possibly impacted by shipping and human activities. Sediments are recognized as the ultimate sink for PFAS compounds with eight or more carbon atoms owing to their higher n-octanol/water partition coefficients (Prevedouros et al., 2006). Despite the prohibition of long-chain PFAS, which limits their presence in water samples, they were still identifiable in the sediment samples. PFBA (73.97%; 0.78–0.99 ng/g), PFHxA (3.58%; nd. to 0.15 ng/g), and PFOS (3.05%; nd. to 0.12 ng/g) were the dominant compounds. Similar results were reported by Diao et al. (2022), who found that short-chain PFAS had higher DRs than long-chain PFAS in sediments. However, Mourier et al. (2019) reported contrasting results, which may be caused by the discharge of short-chain PFAS along the coast of the South China Sea. A significant amount of the short-chain PFAS was then rapidly deposited from the water into the sediment. In the surface sediment, PFBA was still the major compound, while PFDA, PFUnDA, and PFOA were the dominant long-chain PFAS (Supplementary Figure S1). Notably, the layers extending from 4 to 12 cm depth in the streamway (S3), bay (S6), and offshore (S10) sites exhibited higher concentrations of the long-chain PFAS, indicating their extensive use in the past. Interestingly, high concentrations of long-chain PFAS were observed at the inshore site (S1) in the 0–4 cm and 16–20 cm layers, possibly due to sediment layer disturbances from past reclamation projects. Similar to the water samples, PFMOPrA, a novel PFAS, was found in the surface sediments from all sites, indicating that PFMOPrA was rapidly transported from the water to the sediment.
Sixteen PFAS were detected in the biota samples: 12 PFCAs (PFBA, PFPeA, PFHxA, PFHpA, PFOA, PFNA, PFDA, PFUnDA, PFDoA, PFTrDA, PFTeDA, and PFHxDA), 3 PFSAs (PFBS, PFHxS, and PFOS), and 1 novel PFAS (F-53B). Among these, PFOS, PFBA, and PFUnDA were the predominant compounds in the biota samples, with concentrations ranging from 0.32 to 12.42 ng/g dw for PFOS, 2.14 to 5.20 ng/g dw for PFBA, and 0.07 to 5.19 ng/g dw for PFUnDA. As seen in Supplementary Figure S2, the concentrations of the short-chain PFAS in M. edulis (B2) and O. gigas Thunberg (both filter feeders) were higher than those in the other two biota samples. In contrast, C. macrocephalus (B1, long-chain PFAS concentration: 12.53 ng/g dw) and P. gladiator Fabricius (B4, 22.92 ng/g dw) as the omnivores had higher concentrations of the long-chain PFAS. It is likely that filter feeders source their food from water-based plankton, while omnivores source their food from marine plants and animals. On the other hand, marine flora and fauna may contribute to the accumulation of long-chain PFAS in omnivores, explaining their higher levels of long-chain PFAS. Filter feeding may thus result in elevated levels of short-chain PFAS in the seawater.
3.3 Correlation between sediment chronology and PFAS concentration
The examination of sediment core samples from inshore (S1) and offshore (S10) locations in this study provides an understanding of the spatial distribution and temporal accumulation of PFAS in marine sediments. The length of the S1 sediment core is 120 cm, and the length of the S10 sediment core is 146 cm. The concentrations of PFAS in the S1 sediment core ranged from 0.54 to 2.34 ng/g, and those in the S10 sediment core were in the range of 0.43–1.17 ng/g. The median grain sizes ranged from 5.86 to 93.63 μm in S1 and from 5.80 to 7.56 μm in S10. In S1, there were no significant changes in grain size at a depth of 0–70 cm, but the grain sizes beyond 70 cm were significantly larger than those above, with the maximum grain size observed at 90–94 cm. In S10, the grain size showed a gradually decreasing trend, with a minimum value of 120–122 cm. Overall, the values of the PFAS concentrations and grain sizes in the sediment core of S1 were higher than those of S10. Larger grain sizes may provide more surface area for the adsorption of PFAS, leading to higher concentrations in certain sediment layers. The concentrations of PFAS and grain sizes in the sediment cores are listed in Supplementary Table S10.
The deposition dates of the sediments were determined based on vertical changes to 137Cs and sediment grain sizes. For the S1 sediment core, the observation that the surface layer (0–12 cm) was significantly eroded by external forces complicated the dating process, indicating that this layer was rapidly deposited over the last 10 years but cannot be dated with precision. The rest of the S1 sediment core, however, could be accurately dated, revealing a deposition rate of 0.94 cm/year. This rate allows chronological reconstruction of the sediment deposition back to the year 1910, providing over a century’s worth of environmental pollution data. The chronological determination of the S10 sediment core accurately reflects the age of each layer, with a deposition rate of 1.24 cm/year. Accurate dating of the S10 layers extends even further back in time, to the year 1880, thus offering a longer historical perspective on sediment deposition and the associated environmental changes.
As shown in Figure 5, the vertical profile of the sediment and its division into three distinct segments based on the analysis of PFAS concentrations provide a compelling narrative of the environmental impacts of industrial development, policy changes, and environmental management over time. This analysis offers insights into the temporal dynamics of PFAS pollution as well as its relationship with socioeconomic developments and regulatory interventions.
(1) First segment: Policy limitation period (2000s–2020s). During this period, many countries successively implemented policies to restrict the use of PFAS, including the restrictions placed by the Chinese government on long-chain PFAS, such as PFOS and its related compounds, as listed in the Stockholm Convention. Consequently, the concentration of PFAS in S10 showed a gradual increase in the 2000s, followed by a sharp decline after reaching a peak in the early 2010s. In S1, the peak occurred in the early 2000s and then decreased gradually. After 2010, the concentration of PFAS in S1 remained low; this can be attributed to the influence of local human activities and land-based pollution sources, particularly in areas with high industrial activity or significant land development projects. Compared with S1, the concentration peak of PFAS in S10, which is far from land, has a hysteresis, which means that the PFAS concentration in the sediment is predominantly influenced by land-based pollution. From this, it can be seen that the concentrations of PFAS have been decreasing steadily during the policy period. It is expected that the concentrations of PFAS in the environment will decrease further and that the impacts of PFAS on the environment and humans will be mitigated after the implementation of the new pollution control action plan by the Chinese government in 2023.
(2) Second segment: High-speed development period (1980s–2000s). This period marks a significant phase in China’s economic development and is characterized by rapid industrialization and urbanization, especially in regions like Shantou, which was designated as a special economic zone in 1981. The concentrations of PFAS in S1 increased gradually, possibly owing to the rapid growth of industries, especially the textile and toy industries, in the early stages of reform and opening up.
(3) Third segment: PFAS early-stage period (before the 1980s). The historical baseline for PFAS pollution can be traced back to the mid-20th century, coinciding with the initial production and use of these chemicals. The early stage of PFAS usage was between the 1950s and 1980s. In this period, PFAS concentrations in both S1 and S10 showed upward trends, and the growth rate for S10 was faster. PFOS was first produced and used in 1949, suggesting that the PFAS present in sediments prior to the 1950s originated from upper sediment deposition. Prior to the 1950s, the PFAS concentrations were low and decreased gradually. However, PFAS concentrations exhibited low values from 90 to 94 cm for S1 and an increasing trend from 120 to 122 cm for S10. This increase can be attributed to the effects of sediment grain size on the longitudinal migration of pollutants within the sediments.
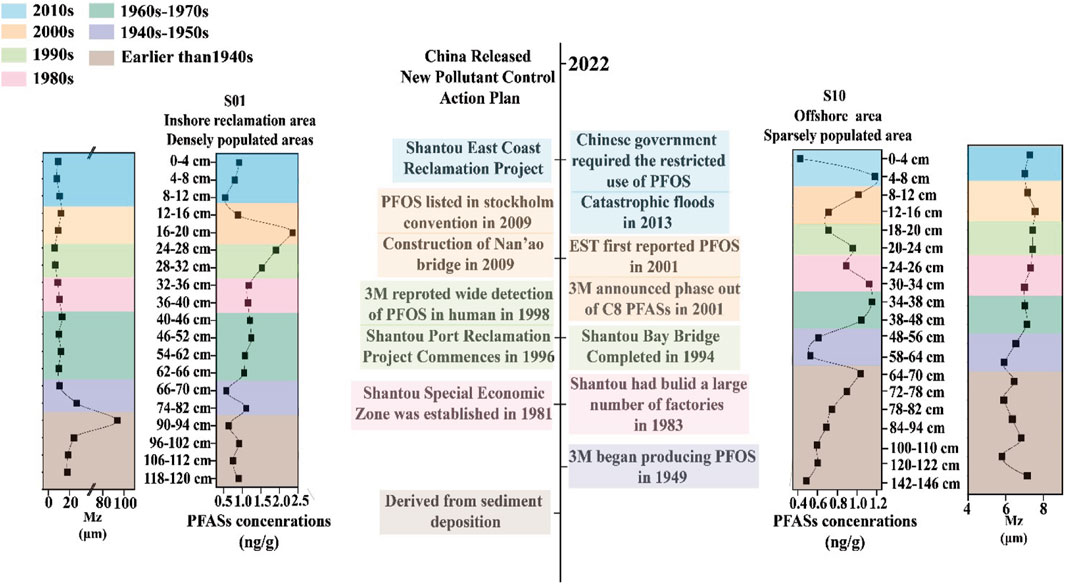
Figure 5. Sediment chronology, particle size, PFAS concentration, and events.
3.4 Source appointments in the sediments, water, and biota
The use of PCA and cluster analysis in this study provides a nuanced understanding of the origins, distributions, and behaviors of PFAS compounds across different environmental matrices (sediment, water, and biota) and geographical locations (inshore and offshore). These analyses help dissect the complex environmental dynamics of PFAS pollution, highlighting the interplay between historical industrial discharges, current emissions, and the natural environmental processes that redistribute these pollutants.
PCA was used in this study to explore the origins of different PFAS compounds (Xiao et al., 2021) and to determine the similarities among the sampling sites (Figure 6A). PC1 and PC2 accounted for 39.81% and 21.34% of the total variations, respectively. PC1 was identified as a long-chain PFAS due to its close relationship with PFNA, PFOS, PFDA, PFUnDA, PFDoA, PFTeDA, PFTrDA, and PFHxDA, with the exception of F-53B, which is classified as a novel PFAS. Long-chain PFAS have been banned in China, and all of the identified long-chain PFAS in PC1 may have therefore come from the residues of past industrial discharges. Owing to the phase-out of long-chain PFAS, short-chain PFAS have been widely used as substitutes. Notably, PFOA removal rates in wastewater treatment plants were negative, and it was observed that fluorotelomers can transform into PFOA via the treatment process. The PFAS components identified in PC2 may originate from domestic sewage and industrial wastewater. This is similar to the previous findings that PFOA, PFOS, PFHxS, PFBA, and PFHxA were the most dominant PFAS compounds found in domestic effluents (Zhang et al., 2021; Zhou et al., 2022). PFPeA and PFHxS were significantly negatively correlated with PC2. Zhang et al. (2016) reported that PFPeA was the major component in the Beijing atmosphere. It is inferred that PFPeA and PFHxS may have originated from atmospheric sedimentation. Moreover, water samples are clustered in the left part of the PCA, and sediment and biota samples (B2: M. edulis and B3: O. gigas Thunberg) are clustered in the lower part of the PCA. These results suggest that there were differences in the PFAS concentrations between the water, sediment, and biota samples. However, the results of the sediment and biota samples (B2 and B3) were found to be relevant; this may be due to the filter-feeding mode, which enriches the PFAS from the sediments, and the benthic life affected by the sediments.
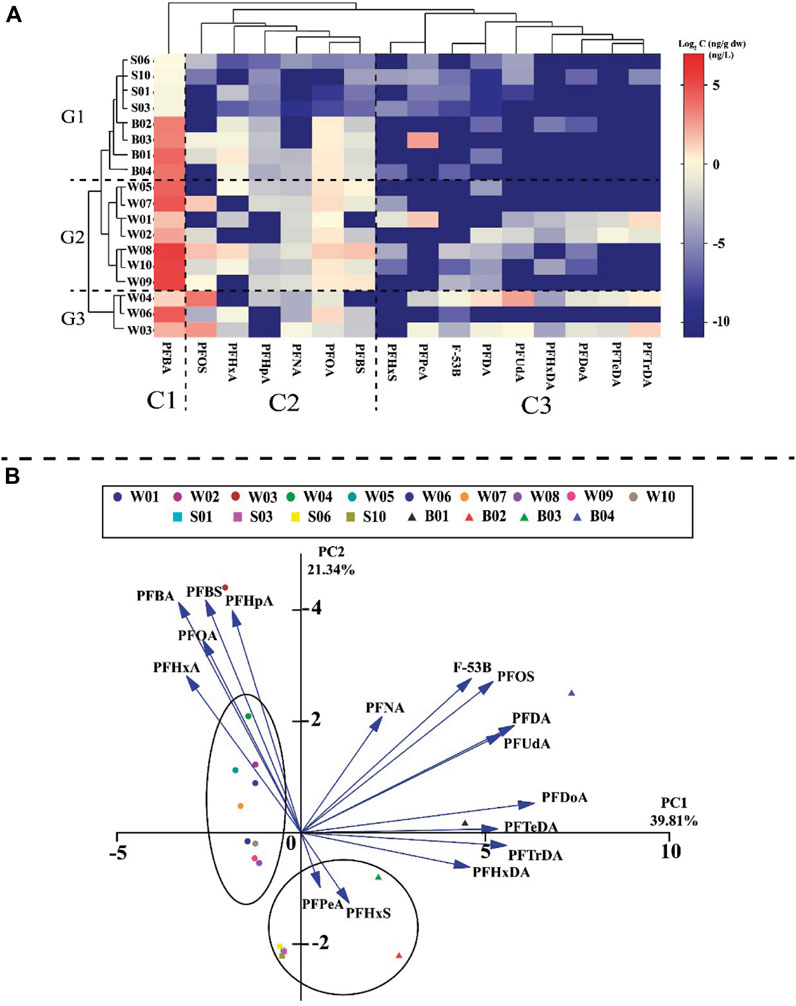
Figure 6. Analysis of potential PFAS sources of contamination in the environment and biota: (A) heatmap of Log2 values for the 16 individual PFAS; (B) PCA results for the 16 PFAS.
Cluster analysis was used in this study to categorize the PFAS and determine the origins of their various components (Chen et al., 2021; Mu et al., 2022). As shown in Figure 6B, the PFAS were clustered into three groups. C1: The isolation of PFBA in its own category suggests unique sources or behaviors distinct from other PFAS compounds. This could imply specific industrial or consumer product-related emissions. C2: Containing PFOS, PFHxA, PFHpA, PFNA, PFOA, and PFBS, it likely represents the PFAS with common industrial applications. C3: Containing PFHxS, PFPeA, F-53B, PFDA, PFUnDA, PFHxDA, PFDoA, PFTeDA, and PFTrDA. This classification was similar to that of PCA. Additionally, the sample points were divided into three distinct groups. The first group (G1) consisted of biota and sediment samples. The second group (G2) comprised water samples (W1, W2, W5, W7, W8, W9, and W10), which were further divided into two subgroups (inshore: W1, W2, W5, and W7; offshore: W8, W9, and W10). Water samples W3, W4, and W6 were assigned to the third group (G3).
The results of this study show that areas close to the coast (inshore) are significantly affected by pollution due to activities of nearby human populations and industries. Nan’ao Island, which is located near these coastal areas, acts as a natural barrier, and this barrier effect can prevent pollutants from dispersing effectively into the open ocean. As a result, pollutants, including harmful chemicals, tend to accumulate in these inshore areas, leading to higher levels of pollution compared to areas farther from the coast (offshore). In contrast, the sampling sites located offshore and away from land did not experience any barrier effects from the island; hence, the offshore group displayed significantly lower pollutant concentrations than the other sites. This was consistent with the horizontal transport pattern in the ocean, which spread from nearshore regions with high human activity to more remote seas.
3.5 Assessments of human health and environmental risks
The RQ is a common index used to assess ecological risk. The MEC and PNEC are the measured environmental concentration and predicted no-effect concentration, respectively. A value of RQ >1 indicates high potential risk, 0.1 < RQ ≤ 1 represents moderate potential risk, and RQ <0.1 suggests minimal potential risk. The PNEC values are listed in Supplementary Table S11 (Pan et al., 2014; Xiao et al., 2021). PFOA and PFOS have the potential to pose toxic effects on various trophic levels of organisms, while seawater and sediments have the capacity to directly or indirectly affect marine biota. Therefore, it is necessary to understand the environmental risks of sediment and seawater PFOA and PFOS aquatic systems. According to Figure 7A, the RQ values of sediment samples range from 0.032 to 0.259 for PFOS and from 2.9 × 10⁻⁴ to 2.3 × 10⁻³ for PFOA. The results of the sediment samples show that most of the surveyed areas had negligible risks, with RQ values <0.1. Only one inshore sediment sample (S1: RQ = 0.259) showed a medium risk. For the water samples, the values of RQ were <0.1 for all PFAS compositions. In the water and sediment sampling areas, the RQ of a mixture of 10 PFAS was less than 0.1, except for S1, indicating that the PFAS in marine waters and sediments east of Guangdong pose minimal potential risks. Currently, PFAS do not cause serious risks to the aquatic ecosystem of the coastal area of eastern Guangdong, but their long-term risks (high bioaccumulation and biomagnification) cannot be ignored (Du et al., 2021; Diao et al., 2022).
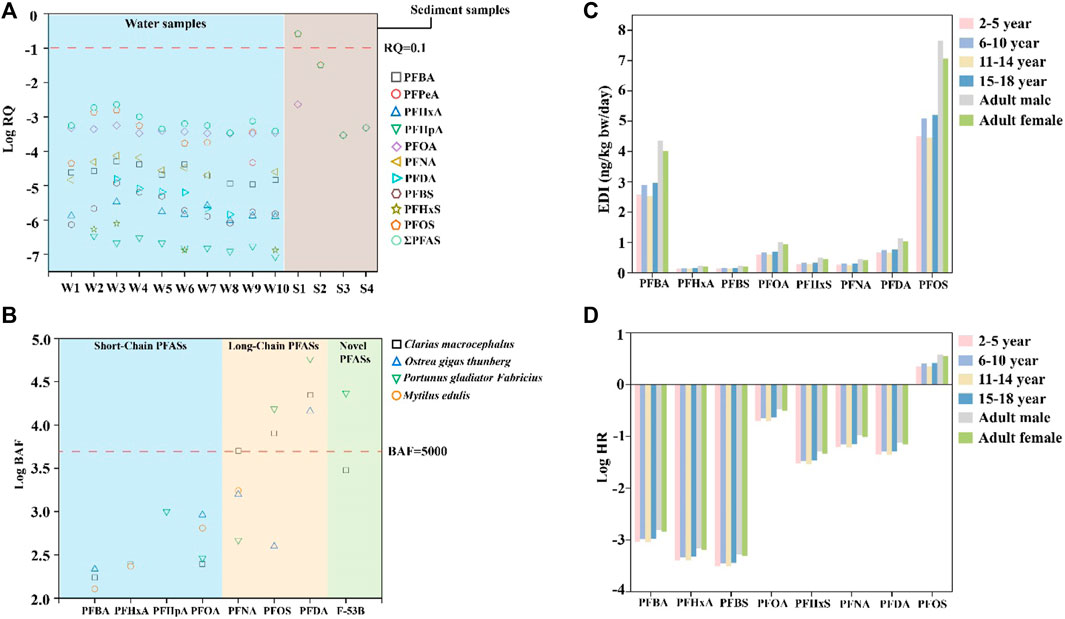
Figure 7. Risk assessment of PFAS in the environment, biota, and humans: (A) Log10 RQ values of the water and sediment samples; (B) Log10 BAF values of the biota samples; (C) EDI values of different age groups and genders; (D) Log10 HR values of different age groups and genders.
The absence of significant ecological risks from PFAS in the ocean does not imply the absence of enrichment within marine biota. Figure 7B shows the BAF, a crucial parameter for analyzing the partitioning behavior of organic contaminants in aquatic ecosystems (Du et al., 2021). The BAFs of eight PFAS (PFBA, PFHxA, PFNA, PFDA, PFOA, PFOS, PFHpA, and F-53B) were calculated in this study. Both P. gladiator Fabricius and C. macrocephalus are top predators that demonstrate significant bioaccumulation of long-chain PFAS. This observation implies that PFAS concentrations in these apex predators can increase substantially through trophic transfer, as supported by the findings of Diao et al. (2022) and Xiao et al. (2021). The novel PFAS F-53B also shows bioaccumulation in P. gladiator Fabricius, suggesting that humans may be ingesting new PFAS through the enrichment of marine biota. These findings suggest that top predators tend to accumulate long-chain PFAS. Therefore, it is advisable to limit the consumption of such seafood species. While direct PFAS accumulation in the marine biota was not deemed significant, the potential for bioaccumulation and its implications on both marine organisms and human health warrants careful consideration. BAF values are listed in Supplementary Table S12.
A small number of top predators showed enrichment effects for long-chain PFAS, which could lead to PFAS accumulation in humans through consumption of these seafood species and thereby pose risks to human health. To quantify this risk, the EDI and HR methods are utilized in this work, focusing primarily on PFBA, PFOA, PFHxA, PFBS, PFOS, PFHxS, PFNA, and PFDA. These metrics offer insights into the potential health risks posed by PFAS exposure across different age and gender demographics. A value of HR >1 indicates that the current PFAS exposure may pose a potential risk to humans. As shown in Supplementary Table S14, the EDI values for the eight PFAS ranged from 0.13 to 7.65 ng/kg⋅bw/day. The EDI order among PFAS is as follows: PFOS > PFBA > PFDA > PFOA > PFHxS > PFNA > PFBS > PFHxA. Notably, adolescents (aged 15–18 years) exhibited the highest EDI values, likely due to increased food consumption during their rapid growth phase. In the maturity group, the value of EDI was higher for men than women. The values of HR ranged from 3.07 × 10⁻⁴ (PFBS) to 3.82 (PFOS). Except for PFOS, the HR values of the other seven PFAS were less than 1. This was consistent with the findings of a previous study in the Beibu Gulf and Yellow Sea (Zhang et al., 2016). The order of HR was as follows: PFOS > PFOA > PFNA > PFDA > PFHxS > PFBA > PFHxA > PFBS. The particularly vulnerable groups to PFAS exposure were those in the age ranges of 6–10 and 15–18 years, with men facing a higher risk than women. Supplementary Tables S13–S15 outline these EDI and HR data.
4 Conclusion
The comprehensive analysis of PFAS in the eastern part of the South China Sea reported in this work highlights the presence and implications of these chemicals in marine environments. A total of 16 PFAS were detected in water and biota samples, and 17 PFAS were detected in sediments collected from the eastern part of the South China Sea, with total concentrations ranging from 13.08 to 57.70 ng/L, 0.96–1.35 ng/g, and 9.71–25.44 ng/g dw, respectively. PFBA, PFOS, and PFUnDA were the main PFAS in the water, sediment, and biota samples. Overall, the concentrations of PFAS in this area are at moderate levels.
Ever since PFOS and PFOA (including their salts and related compounds) were respectively listed in Annex B (restriction) in 2009 and Annex A (elimination, with specific exemptions) in 2019 of the Stockholm Convention, and relevant policies were implemented to restrict the use of long-chain PFAS in China in 2013, the concentrations of long-chain PFAS in sediments have decreased rapidly. These policies have, therefore, proven effective. The main sources of existing PFAS are industrial pollution, domestic sewage, and aquaculture wastewater discharge. The RQ analysis in this study reveals that most of the investigated areas exhibit no significant ecological risks (RQ <0.1), suggesting minimal immediate environmental threats. Although the ecological risks were not significant, PFOS, PFDA, and F-53B were enriched in the top predators (P. gladiator Fabricius), raising concerns about bioaccumulation and the potential for trophic transfer, thereby posing indirect risks to human health through seafood consumption. PFOS still poses exposure risks to different gender and age groups, so this compound requires special attention. The exposure risk for men was higher than that for women, and the exposure risks for people aged 6–10 and 15–18 years were greater than those for other age groups.
Data availability statement
The original contributions presented in the study are included in the article/Supplementary Material, and further inquiries may be directed to the corresponding author.
Ethics statement
The manuscript presents research on animals that do not require ethical approval for their study.
Author contributions
JZ: data curation, formal analysis, investigation, writing–original draft, and writing–review and editing. YX: data curation, formal analysis, investigation, and writing–original draft. JZ: data curation, formal analysis, investigation, methodology, software, and writing–original draft. MY: conceptualization, project administration, resources, and writing–original draft. JD: data curation, formal analysis, investigation, methodology, software, and writing–review and editing. JW: data curation, investigation, software, and writing–original draft. QS: formal analysis, investigation, methodology, software, and writing–review and editing. TW: conceptualization, funding acquisition, methodology, project administration, supervision, validation, and writing–review and editing.
Funding
The author(s) declare that financial support was received for the research, authorship, and/or publication of this article. This study was supported by the National Natural Science Foundation of China (Grant No. 42077375), the Program for University Innovation Team of Guangdong Province (2022KCXTD008), the STU Scientific Research Foundation for Talents (NTF20001), and the Special Fund Project for Environmental Protection of Guangdong Province (2023-12).
Acknowledgments
The authors would like to acknowledge Feng Wang and Professor Zhongping Lai for their assistance in the analysis of chronology.
Conflict of interest
The authors declare that the research was conducted in the absence of any commercial or financial relationships that could be construed as a potential conflict of interest.
The author(s) also declare that there was an editorial board member of Frontiers at the time of the submission of this manuscript. However, this had no impact on the peer review process or final decision.
Publisher’s note
All claims expressed in this article are solely those of the authors and do not necessarily represent those of their affiliated organizations or those of the publisher, editors, and reviewers. Any product that may be evaluated in this article or claim that may be made by its manufacturer is not guaranteed or endorsed by the publisher.
Supplementary material
The Supplementary Material for this article can be found online at: https://www.frontiersin.org/articles/10.3389/fenvs.2024.1380232/full#supplementary-material
References
Anschutz, P., and Charbonnier, C. (2020). Sampling pore water at a centimeter resolution in sandy permeable sediments of lakes, streams, and coastal zones. Limnol. Oceanogr. Methods 19, 96–114. doi:10.1002/lom3.10408
Appleby, P. G. (2008). Three decades of dating recent sediments by fallout radionuclides: a review. Holocene 18, 83–93. doi:10.1177/0959683607085598
Bao, J., Liu, W., Liu, L., Jin, Y., Ran, X., and Zhang, Z. (2010). Perfluorinated compounds in urban river sediments from Guangzhou and Shanghai of China. Chemosphere 80, 123–130. doi:10.1016/j.chemosphere.2010.04.008
Casas, G., Martinez-Varela, A., Roscales, J. L., Vila-Costa, M., Dachs, J., and Jimenez, B. (2020). Enrichment of perfluoroalkyl substances in the sea-surface microlayer and sea-spray aerosols in the Southern Ocean. Environ. Pollut. 267, 115512. doi:10.1016/j.envpol.2020.115512
Chen, C. E., Yang, Y. Y., Zhao, J. L., Liu, Y. S., Hu, L. X., Li, B. B., et al. (2021). Legacy and alternative per- and polyfluoroalkyl substances (PFASs) in the West River and North River, south China: occurrence, fate, spatio-temporal variations and potential sources. Chemosphere 283, 131301. doi:10.1016/j.chemosphere.2021.131301
Chen, L. G., Tsui, M. M. P., Lam, J. C. W., Wang, Q., Hu, C. Y., Wai, O. W. H., et al. (2019). Contamination by perfluoroalkyl substances and microbial community structure in Pearl River Delta sediments. Environ. Pollut. 245, 218–225. doi:10.1016/j.envpol.2018.11.005
Chirikona, F., Quinete, N., Gonzalez, J., Mutua, G., Kimosop, S., and Orata, F. (2022). Occurrence and distribution of per- and polyfluoroalkyl substances from multi-industry sources to water, sediments and plants along nairobi river basin, Kenya. Int. J. Environ. Res. Public Health 19, 8980. doi:10.3390/ijerph19158980
Diao, J., Chen, Z., Wang, T., Su, C., Sun, Q., Guo, Y., et al. (2022). Perfluoroalkyl substances in marine food webs from South China Sea: trophic transfer and human exposure implication. J. Hazard Mater 431, 128602. doi:10.1016/j.jhazmat.2022.128602
Ding, G., Xue, H., Yao, Z., Wang, Y., Ge, L., Zhang, J., et al. (2018). Occurrence and distribution of perfluoroalkyl substances (PFASs) in the water dissolved phase and suspended particulate matter of the Dalian Bay, China. Chemosphere 200, 116–123. doi:10.1016/j.chemosphere.2018.02.093
Dong, H., Lu, G., Yan, Z., Liu, J., Yang, H., Zhang, P., et al. (2020). Distribution, sources and human risk of perfluoroalkyl acids (PFAAs) in a receiving riverine environment of the Nanjing urban area, East China. J. Hazard Mater 381, 120911. doi:10.1016/j.jhazmat.2019.120911
Du, D., Lu, Y., Zhou, Y., Li, Q., Zhang, M., Han, G., et al. (2021). Bioaccumulation, trophic transfer and biomagnification of perfluoroalkyl acids (PFAAs) in the marine food web of the South China Sea. J. Hazard Mater 405, 124681. doi:10.1016/j.jhazmat.2020.124681
Eschauzier, C., Haftka, J., Stuyfzand, P. J., and de Voogt, P. (2010). Perfluorinated compounds in infiltrated river rhine water and infiltrated rainwater in coastal dunes. Environ. Sci. Technol. 44, 7450–7455. doi:10.1021/es100471z
Evich, M. G., Davis, M. J. B., McCord, J. P., Acrey, B., Awkerman, J. A., Knappe, D. R. U., et al. (2022). Per- and polyfluoroalkyl substances in the environment. Science 375, eabg9065. doi:10.1126/science.abg9065
Fenton, S. E., Ducatman, A., Boobis, A., DeWitt, J. C., Lau, C., Ng, C., et al. (2021). Per- and polyfluoroalkyl substance toxicity and human health review: current state of knowledge and strategies for informing future research. Environ. Toxicol. Chem. 40, 606–630. doi:10.1002/etc.4890
Gao, L., Liu, J., Bao, K., Chen, N., and Meng, B. (2020). Multicompartment occurrence and partitioning of alternative and legacy per- and polyfluoroalkyl substances in an impacted river in China. Sci. Total Environ. 729, 138753. doi:10.1016/j.scitotenv.2020.138753
Giesy, J. P., and Kannan, K. (2001). Global distribution of perfluorooctane sulfonate in wildlife. Environ. Sci. Technol. 35, 1339–1342. doi:10.1021/es001834k
Goodrow, S. M., Ruppel, B., Lippincott, R. L., Post, G. B., and Procopio, N. A. (2020). Investigation of levels of perfluoroalkyl substances in surface water, sediment and fish tissue in New Jersey, USA. Sci. Total Environ. 729, 138839. doi:10.1016/j.scitotenv.2020.138839
Lee, Y. M., Lee, J. Y., Kim, M. K., Yang, H., Lee, J. E., Son, Y., et al. (2020). Concentration and distribution of per- and polyfluoroalkyl substances (PFAS) in the Asan Lake area of South Korea. J. Hazard Mater 381, 120909. doi:10.1016/j.jhazmat.2019.120909
Liu, Y., Zhang, Y., Li, J., Wu, N., Li, W., and Niu, Z. (2019). Distribution, partitioning behavior and positive matrix factorization-based source analysis of legacy and emerging polyfluorinated alkyl substances in the dissolved phase, surface sediment and suspended particulate matter around coastal areas of Bohai Bay, China. Environ. Pollut. 246, 34–44. doi:10.1016/j.envpol.2018.11.113
Liu, Z., Lu, Y., Shi, Y., Wang, P., Jones, K., Sweetman, A. J., et al. (2017). Crop bioaccumulation and human exposure of perfluoroalkyl acids through multi-media transport from a mega fluorochemical industrial park, China. Environ. Int. 106, 37–47. doi:10.1016/j.envint.2017.05.014
Lu, Z., Song, L., Zhao, Z., Ma, Y., Wang, J., Yang, H., et al. (2015). Occurrence and trends in concentrations of perfluoroalkyl substances (PFASs) in surface waters of eastern China. Chemosphere 119, 820–827. doi:10.1016/j.chemosphere.2014.08.045
Lund, S., Mortazavi, E., Platzman, E., Kirby, M., Stoner, J., and Okada, M. (2021). Rock magnetic variability of quaternary deep-sea sediments from the Bering Sea and their environmental implications. Deep Sea Res. Part I Oceanogr. Res. Pap. 172, 103487. doi:10.1016/j.dsr.2021.103487
Meng, L., Lu, Y., Wang, Y., Ma, X., Li, J., Lv, J., et al. (2021). Occurrence, temporal variation (2010–2018), distribution, and source appointment of per- and polyfluoroalkyl substances (PFAS) in mollusks from the bohai sea, China. ACS ES&T Water 2, 195–205. doi:10.1021/acsestwater.1c00346
Mourier, B., Labadie, P., Desmet, M., Grosbois, C., Raux, J., Debret, M., et al. (2019). Combined spatial and retrospective analysis of fluoroalkyl chemicals in fluvial sediments reveal changes in levels and patterns over the last 40 years. Environ. Pollut. 253, 1117–1125. doi:10.1016/j.envpol.2019.07.079
Mu, H., Li, J., Chen, L., Hu, H., Wang, J., Gu, C., et al. (2022). Distribution, source and ecological risk of per- and polyfluoroalkyl substances in Chinese municipal wastewater treatment plants. Environ. Int. 167, 107447. doi:10.1016/j.envint.2022.107447
Nilsson, S., Braunig, J., Carey, R. N., Hui, J., Smurthwaite, K., Toms, L. M., et al. (2023). Longitudinal measurements of per- and poly-fluoroalkyl substances (PFAS) in archived human serum samples between 1975 and 1995 in Australia. J. Hazard. Mater. 443, 130307. doi:10.1016/j.jhazmat.2022.130307
Pan, C. G., Wang, Y. H., Yu, K. F., Zhang, W., Zhang, J., and Guo, J. (2020). Occurrence and distribution of perfluoroalkyl substances in surface riverine and coastal sediments from the Beibu Gulf, south China. Mar. Pollut. Bull. 150, 110706. doi:10.1016/j.marpolbul.2019.110706
Pan, C. G., Ying, G. G., Zhao, J. L., Liu, Y. S., Jiang, Y. X., and Zhang, Q. Q. (2014). Spatiotemporal distribution and mass loadings of perfluoroalkyl substances in the Yangtze River of China. Sci. Total Environ. 493, 580–587. doi:10.1016/j.scitotenv.2014.06.033
Prevedouros, K., Cousins, I. T., Buck, R. C., and Korzeniowski, S. H. (2006). Sources, fate and transport of perfluorocarboxylates. Environ. Sci. Technol. 40, 32–44. doi:10.1021/es0512475
Sebastiano, M., Jouanneau, W., Blevin, P., Angelier, F., Parenteau, C., Gernigon, J., et al. (2021). High levels of fluoroalkyl substances and potential disruption of thyroid hormones in three gull species from South Western France. Sci. Total Environ. 765, 144611. doi:10.1016/j.scitotenv.2020.144611
Sun, Q., Bi, R., Wang, T., Su, C., Chen, Z., Diao, J., et al. (2021a). Are there risks induced by novel and legacy poly- and perfluoroalkyl substances in coastal aquaculture base in South China? Sci. Total Environ. 779, 146539. doi:10.1016/j.scitotenv.2021.146539
Sun, Q., Xiong, Y., Bi, R., Zhan, X., Fan, Y., Su, C., et al. (2021b). Occurrence, profile, and potential risks of novel and legacy polyfluoroalkyl substances in bullfrogs: pilot study in an intensive aquaculture region, China. Front. Environ. Sci. 9, 786297. doi:10.3389/fenvs.2021.786297
Vassiliadou, I., Costopoulou, D., Kalogeropoulos, N., Karavoltsos, S., Sakellari, A., Zafeiraki, E., et al. (2015). Levels of perfluorinated compounds in raw and cooked Mediterranean finfish and shellfish. Chemosphere 127, 117–126. doi:10.1016/j.chemosphere.2014.12.081
Wang, G., Lu, J., Xing, Z., Li, S., Liu, Z., and Tong, Y. (2017). Occurrence, distribution, and risk assessment of perfluoroalkyl acids (PFAAs) in muscle and liver of cattle in xinjiang, China. Int. J. Environ. Res. Public Health 14, 970. doi:10.3390/ijerph14090970
Wang, Q., Tsui, M. M. P., Ruan, Y., Lin, H., Zhao, Z., Ku, J. P. H., et al. (2019). Occurrence and distribution of per- and polyfluoroalkyl substances (PFASs) in the seawater and sediment of the South China sea coastal region. Chemosphere 231, 468–477. doi:10.1016/j.chemosphere.2019.05.162
Wang, Z. Y., DeWitt, J., Higgins, C. P., and Cousins, I. T. (2018). A never-ending story of per- and polyfluoroalkyl substances (PFASs)? (vol 51, pg 2508, 2017). Environ. Sci. Technol. 52, 3325. doi:10.1021/acs.est.8b00599
Ward-Caviness, C. K., Moyer, J., Weaver, A., Devlin, R., and Diaz-Sanchez, D. (2022). Associations between PFAS occurrence and multimorbidity as observed in an electronic health record cohort. Environ. Epidemiol. 6, e217. doi:10.1097/ee9.0000000000000217
Woodlief, T., Vance, S., Hu, Q., and DeWitt, J. (2021). Immunotoxicity of per- and polyfluoroalkyl substances: insights into short-chain PFAS exposure. Toxics 9, 100. doi:10.3390/toxics9050100
Xiao, S.-K., Wu, Q., Pan, C.-G., Yin, C., Wang, Y.-H., and Yu, K.-F. (2021). Distribution, partitioning behavior and potential source of legacy and alternative per- and polyfluoroalkyl substances (PFASs) in water and sediments from a subtropical Gulf, South China Sea. Environ. Res. 201, 111485. doi:10.1016/j.envres.2021.111485
Yang, L., Zhou, Y., Shi, B., Meng, J., He, B., Yang, H., et al. (2020). Anthropogenic impacts on the contamination of pharmaceuticals and personal care products (PPCPs) in the coastal environments of the Yellow and Bohai seas. Environ. Int. 135, 105306. doi:10.1016/j.envint.2019.105306
Yao, Y., Chang, S., Zhao, Y., Tang, J., Sun, H., and Xie, Z. (2017). Per- and poly-fluoroalkyl substances (PFASs) in the urban, industrial, and background atmosphere of Northeastern China coast around the Bohai Sea: occurrence, partitioning, and seasonal variation. Atmos. Environ. 167, 150–158. doi:10.1016/j.atmosenv.2017.08.023
Yin, C., Pan, C. G., Xiao, S. K., Wu, Q., Tan, H. M., and Yu, K. (2022). Insights into the effects of salinity on the sorption and desorption of legacy and emerging per-and polyfluoroalkyl substances (PFASs) on marine sediments. Environ. Pollut. 300, 118957. doi:10.1016/j.envpol.2022.118957
Zhang, C., He, X., Li, Z., Zhang, S., Li, H., Jin, M., et al. (2016). Perfluorinated compounds (PFCs) in ambient air particulates (PM2.5, PM10, TSP) in beijing. Pol. J. Environ. Stud. 25, 459–464. doi:10.15244/pjoes/60176
Zhang, W., Cao, H., and Liang, Y. (2021a). Plant uptake and soil fractionation of five ether-PFAS in plant-soil systems. Sci. Total Environ. 771, 144805. doi:10.1016/j.scitotenv.2020.144805
Zhang, Y. Q., Xu, M. Y., Wu, T., Li, Z. R., Liu, Q. J., Wang, X. L., et al. (2021b). Sources of fine-sediment reservoir deposits from contrasting lithological zones in a medium-sized catchment over the past 60 years. J. Hydrol. 603, 127159. doi:10.1016/j.jhydrol.2021.127159
Zhao, Z., Tang, J., Mi, L., Tian, C., Zhong, G., Zhang, G., et al. (2017). Perfluoroalkyl and polyfluoroalkyl substances in the lower atmosphere and surface waters of the Chinese Bohai Sea, Yellow Sea, and Yangtze River estuary. Sci. Total Environ. 599-600, 114–123. doi:10.1016/j.scitotenv.2017.04.147
Zhao, Z., Tang, J., Xie, Z., Chen, Y., Pan, X., Zhong, G., et al. (2013). Perfluoroalkyl acids (PFAAs) in riverine and coastal sediments of Laizhou Bay, North China. Sci. Total Environ. 447, 415–423. doi:10.1016/j.scitotenv.2012.12.095
Zheng, H. Y., Wang, F., Zhao, Z., Ma, Y. X., Yang, H. Z., Lu, Z. B., et al. (2017). Distribution profiles of per- and poly fluoroalkyl substances (PFASs) and their re-regulation by ocean currents in the East and South China Sea. Mar. Pollut. Bull. 125, 481–486. doi:10.1016/j.marpolbul.2017.08.009
Zhou, Y., Yang, L., Wang, T., Meng, J., Shi, B., Bi, R., et al. (2022). Optimizing the fugacity model to select appropriate remediation pathways for perfluoroalkyl substances (PFASs) in a lake. J. Hazard Mater 438, 129558. doi:10.1016/j.jhazmat.2022.129558
Zhu, Q., Qian, J., Huang, S., Li, Q., Guo, L., Zeng, J., et al. (2022). Occurrence, distribution, and input pathways of per- and polyfluoroalkyl substances in soils near different sources in Shanghai. Environ. Pollut. 308, 119620. doi:10.1016/j.envpol.2022.119620
Keywords: perfluoroalkyl substances, composition, sediment core, source identification, risk assessment
Citation: Zhang J, Xie Y, Zhang J, Ye M, Diao J, Wang J, Sun Q and Wang T (2024) Perfluoroalkyl substances in the environment and biota from the coasts of the South China Sea: profiles, sources, and potential risks. Front. Environ. Sci. 12:1380232. doi: 10.3389/fenvs.2024.1380232
Received: 01 February 2024; Accepted: 11 March 2024;
Published: 12 April 2024.
Edited by:
Andrew Hursthouse, University of the West of Scotland, United KingdomReviewed by:
Shangwei Zhang, Beijing Normal University, ChinaMandana Barghi, University of Toronto, Canada
Copyright © 2024 Zhang, Xie, Zhang, Ye, Diao, Wang, Sun and Wang. This is an open-access article distributed under the terms of the Creative Commons Attribution License (CC BY). The use, distribution or reproduction in other forums is permitted, provided the original author(s) and the copyright owner(s) are credited and that the original publication in this journal is cited, in accordance with accepted academic practice. No use, distribution or reproduction is permitted which does not comply with these terms.
*Correspondence: Tieyu Wang, d2FuZ3RAc3R1LmVkdS5jbg==