 Hao Zhang1,2
 Rui Qi
 Keying Wang
95% of researchers rate our articles as excellent or good
Learn more about the work of our research integrity team to safeguard the quality of each article we publish.
Find out more
ORIGINAL RESEARCH article
Front. Environ. Sci. , 01 March 2024
Sec. Environmental Economics and Management
Volume 12 - 2024 | https://doi.org/10.3389/fenvs.2024.1370938
This article is part of the Research Topic Low-carbon transition of energy infrastructures View all 14 articles
Introduction: Within the global framework of carbon emissions constraints, the digital economy has become a new strategy for cities to achieve sustainable development. Scholarly literature exploring the spatial spillover and spatial mechanisms of the digital economy on carbon emissions is notably scarce.
Methods: To estimate the spatial impact of digital economy on carbon emissions, this paper conducted spatial analysis with the spatial Dubin model and panel data of 215 cities in China from 2011 to 2019.
Results: The results show that there is a growing regional agglomeration of the digital economy, whereas the spatial evolution of carbon emissions displays low liquidity and high stability. Second, the digital economy directly reduces urban carbon emissions, and this conclusion is supported through a series of robustness tests. However, there exist negative spatial spillover effects of digital economy on carbon emissions reduction in neighboring cities. Third, mechanism analysis reveals that the digital economy mainly affects urban carbon emissions through two paths: industrial structure upgrading and green technology innovation. Moreover, the influence of digital economy exhibits heterogeneity, with a more pronounced effect observed in the central cities and in large and medium-sized cities, as well as in cities with a high agglomeration of the new energy industry.
Discussion: Our paper not only presents new documentary evidence for understanding the relationship between digitalization and decarbonization, but also provides specific references for policy making to accelerate low-carbon urban development.
With the exacerbation of global warming and intensification of economic competition, China, as the world’s largest carbon emitter, confronts significant challenges in reducing carbon emissions. In 2022, China’s total carbon dioxide emissions reached approximately 11.5 billion tons. 2023 United Nations Climate Change Conference (COP28) emphasized further curbing greenhouse gas emissions, and urged developing countries to progressively attain net-zero emissions of greenhouse gases. In response to the need for controlling carbon emissions and steering the economy toward green development, the Chinese government formally pledged at the 2020 United Nations General Assembly to achieve carbon peak by 2030 and carbon neutrality by 2060 (Dual-Carbon Target). Simultaneously, the breakthrough and innovation of information technology have propelled the ongoing expansion of the digital economy, facilitated the digital transformation of the industry, and led the society to the digital era (Goldfarb and Tucker, 2019). In 2022, China’s digital economy has surged to 7.46 trillion dollars, contributing over 41% to GDP and ranking second in the global. Consequently, digital economy has indisputably emerged as a crucial metric for economic growth across all sectors, serving as a key driving force for bolstering the national competitiveness (Liu et al., 2022).
In recent research, the economic impact and spatial effect of the digital economy and low-carbon development have garnered significant attention. From the aspect of digital economy, a body of literature have underscored its capacity to reduce transaction costs (Müller, 2019; Xu et al., 2019), enhance resource allocation efficiency (Ma and Zhu, 2022), stimulate technology upgrading (Ning et al., 2022), optimize enterprise operation efficiency (Mikalef et al., 2019) and move the clean energy developing process forward (Chen, 2022), etc. Concurrently, the digital economy exhibits obvious spatial spillover effects (Varlamova and Kadochnikova, 2023), especially in the domains of urban green technology innovation (Dian et al., 2024), green total factor productivity (Lyu et al., 2023), and haze control (Tan and Chen, 2022). All these benefits mentioned associated with the digital economy could contribute to fostering high-quality economic development (Wang et al., 2022b). As for low-carbon development, its purpose is to achieve economic development while conserving energy and reducing carbon emissions. Carbon emission is a pivotal aspect of low-carbon development (Zhou et al., 2023). Scholars have analysed the temporal and spatial evolution of carbon emissions from the perspective of global (Smith et al., 2021), countries (Sporkmann et al., 2023) and regions (Shan et al., 2022). Moreover, existing literature still explores the relationship between low-carbon development and key dimensions including energy structure (Wang et al., 2016), transformation of economic development modes (Li and Wei, 2021), and industrial planning adjustment (Zheng et al., 2021).
With the implementing of China’s Dual-Carbon Target, the intricate relationship between digital economy and carbon emissions has emerged as a research focus (Zhang J. et al., 2022). The impact of digital economy on urban carbon emissions is multi-dimensional and complex. Numerous studies have verified that the development of digital economy can foster a decline in regional carbon emissions (Zhang W. et al., 2022; Yi et al., 2022), thereby facilitating the achievement of Dual-Carbon Target. However, there are also studies showing the digital economy itself also needs a low-carbon transition (Thornbush and Golubchikov, 2019; Akberdina and Osmonova, 2021). Low-carbon is not an inherent nature of the digital economy. The extensive development of digital economy has also given rise to carbon emissions challenges. Additional studies highlight the non-linear relationship between digital economy and carbon emissions (Xu C. et al., 2023). Digital industrial technology, for instance, will increase carbon emissions intensity during the upgrading process, but the upstream and downstream enterprises empowered by digital technology will ultimately reduce the carbon emissions (Zeng and Yang, 2023). In the context of Dual-Carbon Target, there is a discernible and accelerating convergence between the digital economy and low-carbon development. This prompts scholarly reflection on the relationship between the digital economy and carbon emissions. Can the digital economy propel low-carbon development? What specific mechanisms underlie the potential impact of digital economy? Answering these questions holds substantial theoretical and practical significance for the low-carbon transformation of economic and social development.
The possible contributions of this paper include three main aspects. 1) Research perspectives. There is a scarcity of studies discussing the spatial mechanisms of digital economy despite many scholars have acknowledged the spatial effects of digital economy. This study delved into both direct and indirect effects, analyzing the spatial spillover mechanisms of digital economy and their impact on carbon emissions. This provides theoretical references for regional coordinated efforts aimed at carbon emissions reduction. 2) Research methodologies. We combined traditional econometric models with geographic information tools in our study. Using the Slope function, we visualized the spatial-temporal evolution of the digital economy and carbon emissions. Under the dual influence of geographic distance and economic distance, we empirically examined the spatial impact of the digital economy on carbon emissions using a spatial Durbin model. Furthermore, employing a two-stage transmission effect model with spatial effects, we explored the spatial mediation mechanism of the digital economy. 3) Research objects. We conducted heterogeneous analysis considering geographical location, city size, and the agglomeration of new energy industry. This provides specific recommendations for cites at different development levels in formulating policies related to digital economic development.
Using a panel dataset encompassing 215 cities from 2011 to 2019, we explored the spatial impact of the digital economy on carbon emissions. Initially, we conduct a thorough analysis of the spatio-temporal evolution between the digital economy and carbon emissions. Subsequently, we empirically investigate the direct and indirect effects of digital economy on carbon emissions by spatial econometric model. Furthermore, we check a series of robustness test and evaluate the heterogeneity. Finally, we discuss the mechanism affecting urban carbon emissions from the perspective of industrial structure upgrading and green technology innovation.
The remainder of this paper is structured as follows. Section 2 elucidates the theoretical analysis and provides research hypotheses. Section 3 details the methodologies and variable descriptions. Section 4 presents the results and discussion. Section 5 provides conclusion, policy implications and limitations.
As a new economic form, the digital economy has engendered new production and consumption patterns, spawning new business forms (Guo et al., 2023). The impact of digital economy on urban carbon emissions can be reflected in the following four aspects. First, the digital economy has accelerated the construction of urban digital infrastructure. Notably, the construction of digital infrastructure, represented by 5G base stations and cloud computing data centers, accelerates information dissemination, promotes telecommuting and remote work, thereby curtailing urban traffic activities (Huang et al., 2023). The shared economy model facilitated by digital technologies has enhanced the efficiency of urban resources utilization, consequently mitigating carbon emissions arising from resource profligacy. Second, the digital economy has propelled the widespread application of digital technologies in the industrial field, enhancing the production and organizational efficiency (Tan et al., 2023). Digital technology helps enterprises effectively monitor the energy consumption states, identify production process with high energy consumption, thereby reducing energy consumption during production stages (Zhang L. et al., 2022). Third, the digital economy facilitates the involvement of data as a crucial factor in production (Wang et al., 2023). It has reshaped the hierarchy of production factors, weakened the over-dependence of enterprises on labor and energy (Gan et al., 2023), and made data factor as the paramount production factor in the digital era (Farboodi et al., 2019). The digital economy optimizes the input structure of production factors and improves the allocation efficiency of resources, ultimately mitigating carbon emissions (Goldfarb and Tucker, 2019). Fourth, the digital economy has optimized the energy consumption structure of cities. On the one hand, digital technology helps to reduce the costs of renewable resources, facilitating increased penetration of renewable energy into the energy market (Lyu and Liu, 2021). On the other hand, digital technology is embedded in the production process of energy, assisting enterprises in achieving dynamic and efficient management of energy production, thereby contributing to the decarbonization of energy production (Wang and Shao, 2023).
The digital economy has compressed the space-time distances, improved the efficiency of information transmission, and strengthened economic linkages between regions (Banalieva and Dhanaraj, 2019). The digital economy has spatial spillover effects on regional economic growth (Hao X. L. et al., 2023), technological innovation (Ren et al., 2022), and resource allocation (Ma and Zhu, 2022), subsequently influencing the carbon emissions of nearby areas. According to New Economic Geography Theory (Wilson, 2011), the phenomena of knowledge spillover and environmental spillover exhibit dual character in regional development, characterized by positive spillover and negative spillover. Consequently, the spillover effects of the digital economy on adjacent carbon emissions also manifest this duality. On one hand, there is a positive spillover. The digital economy expedites the cross-regional flow of funds, clean technologies, and environmental protection concepts (Zhang W. et al., 2022), thereby reducing transportation costs and resource waste and promoting regional carbon reduction. On the other hand, there may be a negative spillover as well. The digital economic growth has driven the construction of digital infrastructure in surrounding regions, intensifying energy consumption. The rapid expansion and high value-added characteristics of the digital economy attract premium production factors, resulting in the loss of resources in surrounding areas, which is detrimental to regional carbon reduction.
Derived from the above analysis, our paper proposes the hypotheses 1a and 1b.
Hypothesis 1a. (H1a): The development of digital economy has a positive impact on the reduction of carbon emissions in cities.
Hypothesis 1b. (H1b): The impact of the digital economy on carbon emissions exhibits spatial spillover effects, but the direction of these spillover effects needs further empirical investigation.
The digital economy can promote the upgrading of industrial structure through digital industrialization and industrial digitalization (Yu et al., 2023). In terms of digital industrialization, the development of digital economy has fostered many emerging industries, including industrial Internet, software and information technology service industries. Compared with the traditional industry, the digital industry exhibits a fast growth rate in output value, featuring low dependence on fossil fuels, and gradually become the engine of urban economic growth. In terms of industrial digitization, the utilization of big data has advanced the construction of enterprise informatization, the transformation of operation models, and the innovation of production. The integration of data factor with the service industry has spawned new service industries like electronic payment, online shopping, and smart medical care, opening new markets for the tertiary industry.
The upgrading of industrial structure promotes carbon reduction through industrial structure rationalization and optimization. First, industrial structure rationalization can coordinate various production departments, fostering the rational allocation of production resources. This process facilitates the flow of capital and labor factors towards sectors characterized by higher added value and cleaner production (Zeng and Yang, 2023), guiding industries towards low-carbon development. Second, the upgrading of industrial structure promotes the transition of industries from lower to higher levels, thus fostering the adoption of cleaner production modes. Discernible variations exist in the energy consumption coefficients across diverse industries, with the secondary industry exhibiting a higher coefficient compared to the tertiary industry. The digital economy directly expands the proportion of tertiary industry in the overall economy (Wang et al., 2022a), accelerating the evolution of the secondary industry to the tertiary industry (Bai et al., 2023). This contributes to mitigate the energy consumption during industrial development, and realize the ‘decoupling’ between economic development and carbon emissions. According to above analysis, this paper proposes the second hypothesis.
Hypothesis 2. (H2): The upgrading of industrial structure plays an intermediary role between the digital economy and carbon emissions.
The digital economy, characterized by high innovation and strong integration (Meng et al., 2023), significantly promotes the continuous progress of green technology innovation. First, it accelerates the integration and sharing of information resources, enriched the information acquisition channels for enterprises and academic setting. Si et al. (2023) believed that digital economy has speeded up knowledge dissemination and accumulation, thereby enhancing the efficiency of green technology innovation. Secondly, the digital economic agglomeration has promoted the agglomeration of innovative and scientific talents (Ren et al., 2022). The integration of digital technology with other industries expedites the formation of new industries (Yin et al., 2023), leading to the creation of new jobs that attract innovative talents. This job agglomeration generates a talent agglomeration effect, which could lay a foundation for urban green technology innovation. Additionally, the digital economy could mitigate the information asymmetry between lenders and borrowers in financial markets, broadening financing channels for green technology innovation activities (Ma, 2023).
The green technology innovations affect carbon emissions throughout the production, consumption and end treatment phases (Du et al., 2019). In the process of production, green technology innovation helps to enhance energy efficiency (Xu X. et al., 2023), lowering carbon emissions per unit of output (Du and Li, 2019). In the process of consumption, the innovations of clean energy technology reduce the acquisition cost of clean energy, bringing more clean energy to the energy supply market, and fostering a low-carbon energy consumption structure (Lee et al., 2023). In the process of end treatment, the innovation of pollution control technology drives waste treatment, thereby reducing end carbon emissions (Xu et al., 2021). Therefore, the third hypothesis of this paper is proposed. The influencing mechanism of digital economy on urban carbon emissions is showed in Figure 1.
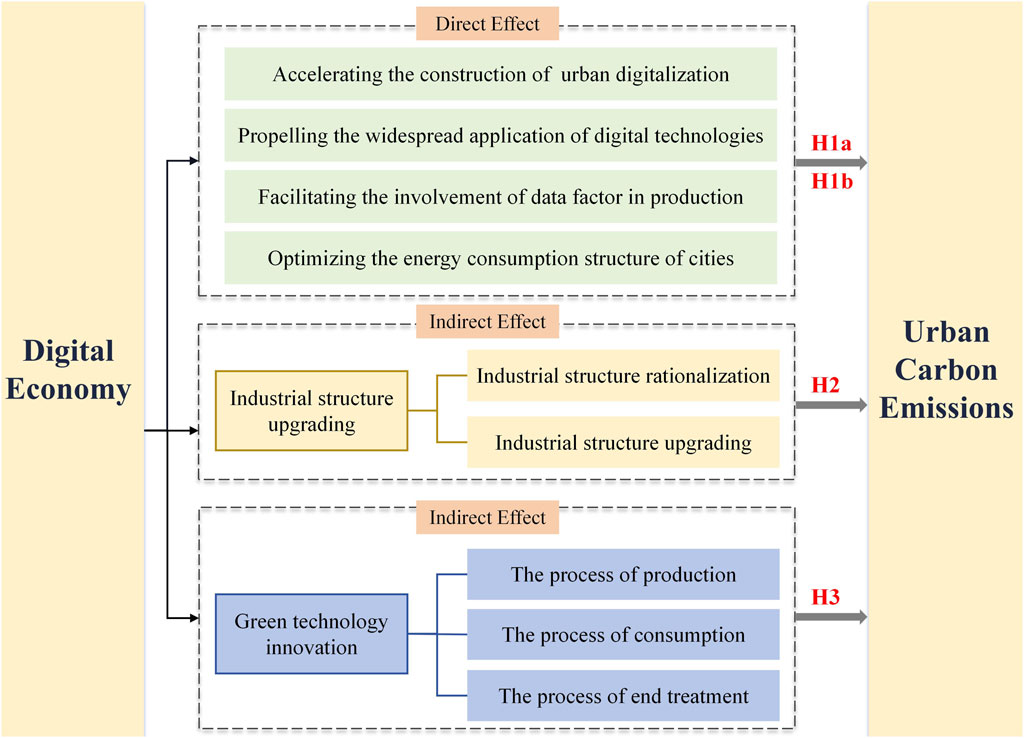
FIGURE 1. Influencing mechanism of digital economy on urban carbon emissions.
Hypothesis 3. (H3): The innovation of green technology plays an intermediary role between the digital economy and carbon emissions.
Functioning as an objective weighting method, the entropy method can distinguish the impact intensity of various indicators, thereby illustrating the effectiveness of the information they convey (Dong et al., 2022). The traditional entropy method is mostly utilized for cross-sectional data analysis, with limited applicability to panel data. Referring to Yi et al. (2022), we used an improved entropy method for weighting estimation in panel data.
First, normalize the indicators:
In Eq. 1,
Second, calculate the information entropy value
In Equation 2,
Third, calculate the entropy redundancy
The M is the total number of indicators. The weight
Finally, the
To detect the trend of carbon emissions and digital economy across various cities from 2011 to 2019, this paper utilized the slope function for trend analysis (Wang et al., 2020; Zhang H. et al., 2022). The trend serves as a direct indicator of the fluctuations in carbon emissions and the growth rate of digital economy within each city. The specific formula is as shown in Eq. 6:
Where
This paper employed the global Moran’s I index to conduct a spatial autocorrelation test, examining the potential spatial relationship between digital economic development and carbon emissions. The calculation formula is presented in Eq. 7:
In Equation 7,
According to the spatial distribution characteristics, spatial clustering can be classified into four types: High-High cluster (H-H), High-Low cluster (H-L), Low-High cluster (L-H), and Low-Low cluster (L-L).
Considering theoretical analysis and Hypothesis 1b, a potential spatial correlation emerges between the digital economy and urban carbon emissions. Conventional panel regressions neglect spatial interactions among variables, possibly leading to biased empirical results (Li and Wang, 2022). Therefore, a spatial econometric model needs to be established.
Commonly spatial econometric models include spatial lag model (SLM), spatial error model (SEM), and spatial Durbin model (SDM) (LeSage and Pace, 2009). The SDM, an extended form that combines the SLM and SEM, incorporates spatial effects of both independent and dependent variables into the model. Compared with the SLM and SEM, the SDM provides enhanced explanatory capabilities for relationships among spatial variables (Elhorst, 2010). For testing Hypothesis 1a and 1b, the following SDM is constructed:
In Eq. 10,
To test hypotheses 2 and 3, this study examined the influencing mechanism of Dige by setting industrial structure upgrading and green technological innovation as mediating variables. Taking spatial effects into account, we built a two-stage transmission effect model for mechanism analysis (Li and Wang, 2022). The model helps circumvent the evident endogeneity issues in the third step of the traditional three-step method. The specific setting form is as follows:
In Equation 11,
The explained variable is the carbon emissions (Carbon) of cities. Carbon dioxide emissions intuitively reflect the carbon emissions status. The calculation of carbon emissions is based on the research findings of Shan et al. (2022). Fossil energy use and the production processes of industrial goods, such as cement, are identified as the primary sources of carbon emissions (Shan et al., 2022). The energy consumption of 47 socio-economic sectors is multiplied by the fuel emission coefficients to obtain energy-related carbon emissions. The cement production is multiplied by the emission coefficient per unit to obtain cement product-related carbon emissions. The summation of these two components yields the total carbon emissions for each city. To enhance data stability, logarithmic transformation (lnCarbon) was applied.
The core explanatory variable is the digital economy (Dige). Considering the extensive nature of Dige, a singular indicator falls short of providing a comprehensive reflection of the level of digital economic development. Consequently, this paper has constructed an evaluation index system to assess the urban Dige, encompassing four dimensions: digital infrastructure construction, digital industry, digital inclusive finance, and digital development vitality (Table 1). The construction of the index system draws upon existing research (Zhang J. et al., 2022; Yi et al., 2022; Wang and Shao, 2023) and incorporates indicators for Dige sourced from the International Telecommunication Union and the China Academy of Information and Communications Technology.
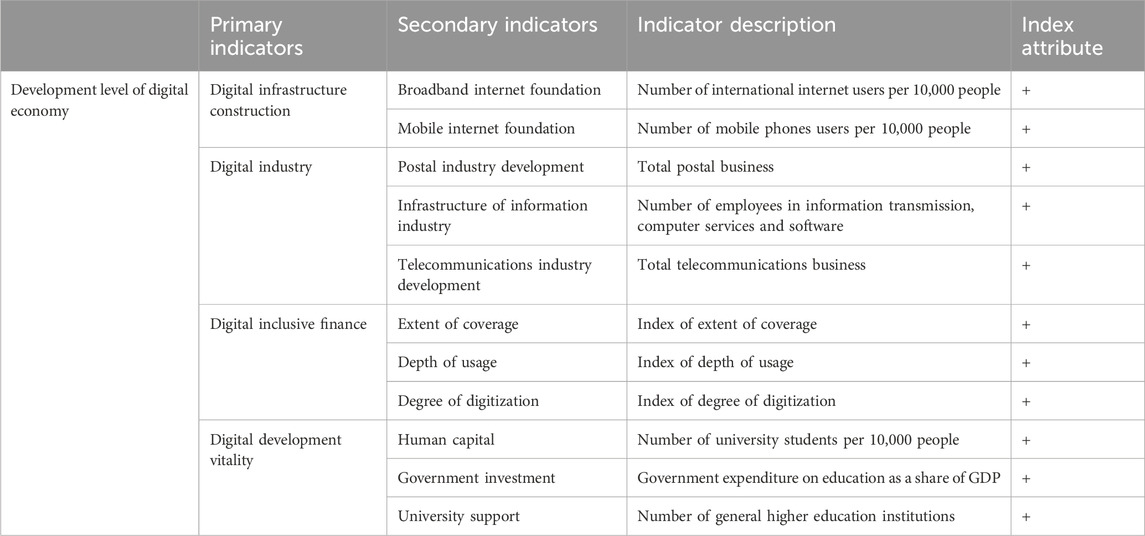
TABLE 1. Evaluation index system for the development level of digital economy in Chinese cities.
The digital infrastructure construction serves as a foundational element for the evolution of Dige. The digital industry constitutes the core of digital economic advancement. The digital inclusive finance expands the scope and forms of financial services, furnishing essential financial support for Dige. The digital development vitality reflects the innovative prowess and inherent potential embedded within Dige.
Industrial structure upgrading (Uis). The proportion of the three industries’ output value to the GDP intuitively reflects the industrial structure. We utilized the ratio of the tertiary industry’s output value to that of the secondary industry to characterize Uis (Zhang W. et al., 2022).
Green technological innovation (Gti). As the ultimate outcome of innovative activities, the quantity of patents serves as an indicator reflecting the level of technological innovation (Li and Wang, 2022). In our paper, the green technology innovation is delineated through two indicators: the number of green patent applications per 10,000 people (Gti1) and the number of green patents granted per 10,000 people (Gti2).
Considering the impact of economic and social factors on carbon emissions, this study introduced the following control variables. 1) Economic development level (lnPGDP): The economic development level is recognized as a pivotal determinant impacting carbon emissions (Li and Wei, 2021), expressed by per capita GDP. 2) Financial development level (lnfinance): The advancement of financial markets is conducive to enhancing the efficiency of capital utilization. It enables businesses secure more capital for green technological innovation, assisting in reducing carbon emissions (Ran and Zhang, 2023), expressed by the proportion of year-end financial loan balances to GDP. 3) Transportation (lnProad): Urban expansion has heightened the demand for transportation, with transportation-related carbon emissions emerging as a main source of carbon emissions (Sun et al., 2017). It is characterized by the road mileage per 10,000 people. 4) Government intervention (lnPfe): Governments implement specific measures to intervene in urban activities, thus influencing carbon emissions (Zhang J. et al., 2022), expressed by per capita fiscal expenditure. 5) Urbanization level (lnUrban): As a key indicator of modernization, urbanization significantly impacts carbon emissions (Zhang et al., 2017), expressed by the proportion of urban population in the total population.
Based on the continuity and comprehensiveness of data, this study established a panel dataset with 215 cities in China from 2011 to 2019. Interpolation method was applied to address sporadic data gaps, culminating in a dataset comprising 1,935 observational samples. The carbon emissions data were sourced from the China Carbon Accounting Database (https://www.ceads.net.cn/). Other data mainly came from the “China Urban Statistical Yearbook”, as well as the statistical yearbooks of individual cities. The data on green patents were obtained from the China National Intellectual Property Administration (https://www.cnipa.gov.cn/). The digital inclusive finance indices were derived from Peking University Digital Finance Research Center and Ant Group Research Institute (Guo et al., 2020). For non-ratio data, a logarithmic transformation was applied. For data points containing zero values, a logarithmic transformation with an addition of one was employed. Descriptive statistics for the variables are presented in Table 2.
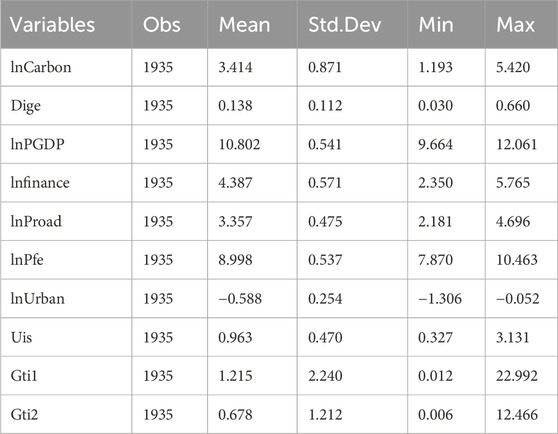
TABLE 2. Descriptive statistics.
Table 3 shows the results of spatial autocorrelation tests. The Moran’s I indices for carbon emissions and Dige from 2011 to 2019 have passed significance tests at the 1% and 5% levels, respectively. Both Dige and carbon emissions exhibit significant spatial correlation during the study period.
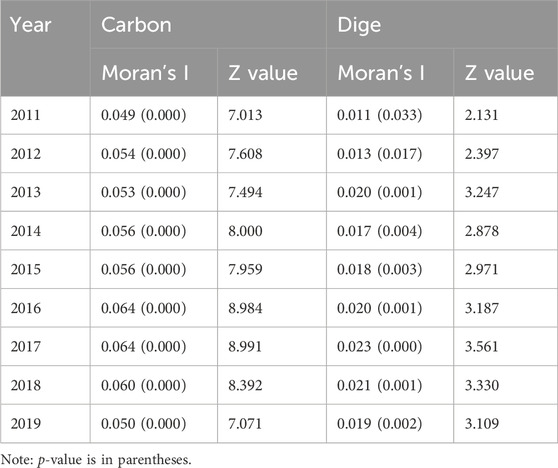
TABLE 3. Spatial autocorrelation test for urban carbon emissions and digital economy from 2011 to 2019.
Figure 2 illustrates the spatiotemporal distribution of urban carbon emissions and Dige in 2011, 2015, and 2019. It reveals significant regional variations, indicating distinctive disparities across the country.
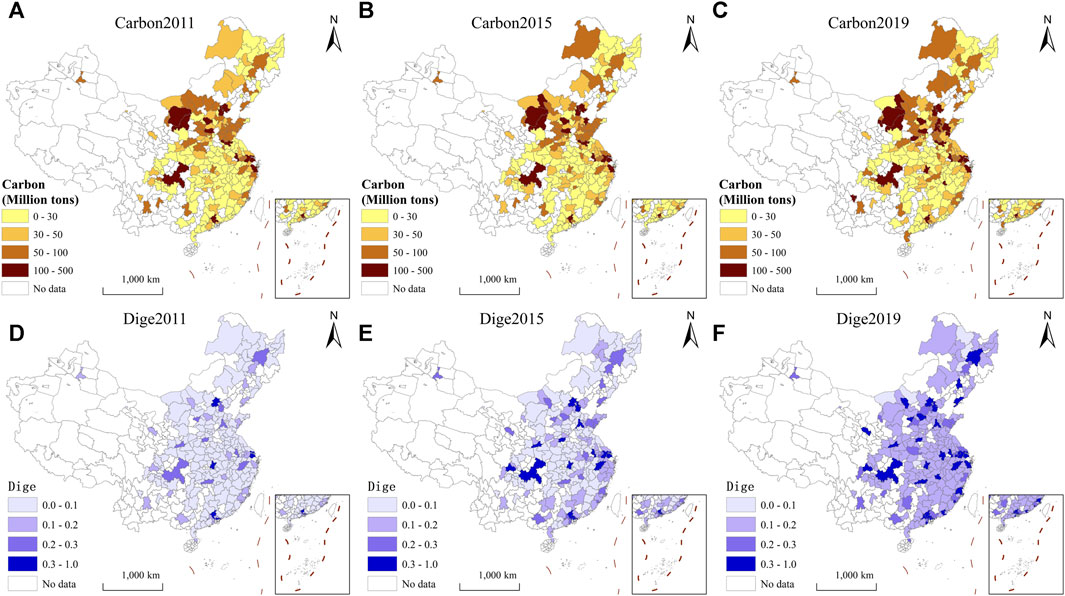
FIGURE 2. Spatial distribution of urban carbon emissions and digital economy among Chinese cities. (A): Carbon emission in 2011; (B): Carbon emission in 2015; (C): Carbon emission in 2019; (D) Dgie in 2011; (E) Dige in 2015; (F): Dige in 2019. Note: Referring to Cai et al. (2018), this paper categorized carbon emissions (units: million tons) into four levels: first level (Carbon<30), second level (30≤Carbon<50), third level (50≤Carbon<100) and fourth level (100≤Carbon<500). Drawing on the work of Yi et al. (2022) and considering the practical context of urban development, this paper categorized the index of digital economic development levels into four levels: first level (Dige<0.1), second level (0.1≤Dige<0.2), third level (0.2≤Dige<0.3) and fourth level (0.3≤Dige<1).
From 2011 to 2019, the evolution of carbon emissions exhibited characteristics of low mobility and high stability. In comparison to 2011, the carbon emissions levels of 157 cities remained unaltered in 2019, accounting for 73.02%. Cities with elevated carbon emissions are mainly concentrated in the north of the Qinling Mountains and the Huaihe River. This distribution aligns with the higher coal proportion in the energy structure in the northern region. Meanwhile, cities in the southern regions such as the Yangtze River Delta and the Pearl River Delta also demonstrate high carbon emissions, associated with factors such as industrial agglomeration and high population density.
From 2011 to 2019, the average level of urban Dige has significantly increased. The index values of Dige in 189 cities have experienced a growth exceeding 100%, constituting 87.91% of all cities. The numerical range has shifted from 0.02 to 0.63 in 2011 to 0.09–0.86 in 2019. However, a widening gap in development level among cities has emerged. Spatially, cities in the southern region exhibit higher levels compared to those in the northern region. Meanwhile, cities in the eastern region surpass those in the central region, while the central region outperforms the western region.
Figure 3 illustrates the dynamic trends in carbon emissions and Dige for each city from 2011 to 2019. For carbon emissions (Figure 3A), 37.67% of cites showed a decreasing trend in carbon emission, while 62.33% of cities demonstrated an increasing trend. The most obvious increasing trends appeared in the central and eastern regions of Inner Mongolia, the northern part of Shaanxi Province, and the border region encompassing Hebei, Shanxi, Henan, and Shandong provinces. For digital economy (Figure 3B), over 43.26% of cities have a growth slope below 0.01, indicating slower growth. Cities with elevated levels of Dige are predominantly concentrated in key regions, including the Beijing-Tianjin-Hebei Region, Yangtze River Delta, Sichuan-Chongqing, and Pearl River Delta areas. Regions with a stronger economic foundation tend to attract digital technology talents, fostering innovation and the development of Dige.
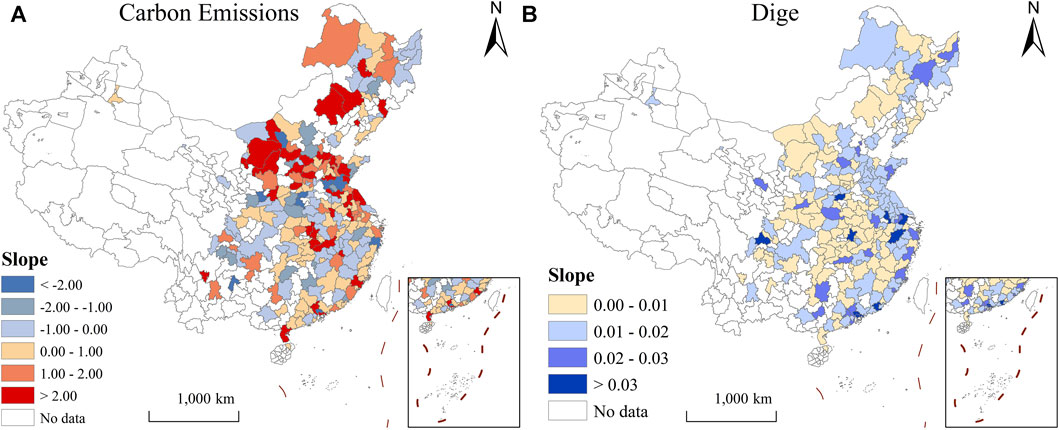
FIGURE 3. Trends in Carbon emissions and Dige in Chinese cities from 2011 to 2019. (A): Carbon emissions; (B): Dige.
Figure 4 depicts the spatial agglomeration of carbon emissions and digital economy in 2011, 2015, and 2019. For carbon emissions, the spatial agglomeration effect is more pronounced in the northern regions. High-high (H-H) agglomeration areas are primarily located in the Beijing-Tianjin-Hebei region, central Inner Mongolia, northern Shaanxi Province, the Shandong Peninsula and the Yangtze River Delta region, displaying a tendency toward contraction. Low-low (L-L) agglomeration regions are contiguous in western Hunan Province, central-southern Jiangxi Province, and northwestern Fujian Province. High-Low (H-L) agglomeration regions encompass Chongqing, Wuhan, and Guangzhou, while Low-high (L-H) agglomeration regions include cities like Langfang, Hengshui, and Cangzhou. For digital economy, the spatial agglomeration effect is exhibiting an expanding trend. H-H agglomeration regions include Tianjin, Shanghai, and Guangzhou, while H-L agglomeration regions encompass provincial capitals like Chongqing, Wuhan, Changsha, Nanchang, and Zhengzhou. The radiating effect of regional digital economic centers is intensifying.
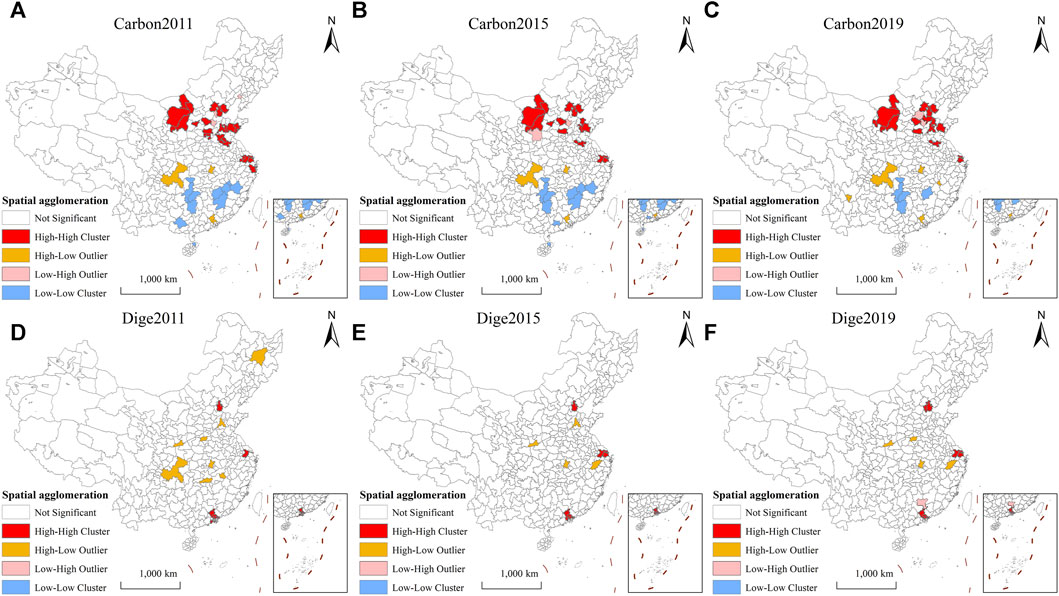
FIGURE 4. LISA maps of carbon emissions and digital economy among Chinese cities. (A): Spatial agglomeration of carbon emission in 2011; (B): Spatial agglomeration of carbon emission in 2015; (C): Spatial agglomeration of carbon emission in 2019; (D) Spatial agglomeration of Dgie in 2011; (E) Spatial agglomeration of Dige in 2015; (F): Spatial agglomeration of Dige in 2019.
Table 4 presents the results of the fitness tests for spatial models. Firstly, all LM test statistics are significant at the 1% level, indicating the superiority of choosing the spatial econometric model. Secondly, the LR test results are all significant at the 1% level, leading to the rejection of SLM and SEM, thus favoring the selection of SDM. Lastly, the Hausman test is passed at the 1% significance level, suggesting that the fixed-effects SDM is the optimal choice.
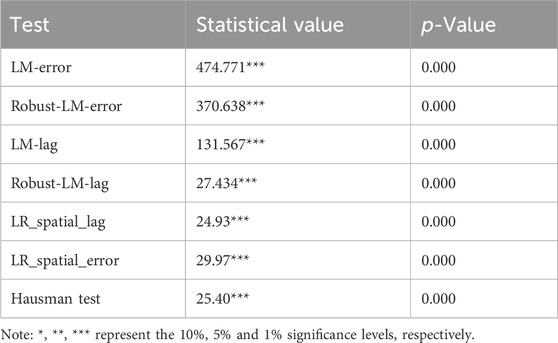
TABLE 4. Fitness tests for spatial econometric models.
Table 5 shows the benchmark regression results. A double fixed effects OLS was used for comparison in (1) column. (2)–(5) columns display the estimated coefficients and effect decomposition of the SDM. The spatial autoregressive coefficient (ρ) of carbon emissions is significantly positive at the 5% level, indicating a pronounced spatial dependence in the distribution of carbon emissions. The coefficients of Dige are consistently significantly positive in columns (1)–(5), indicating that digital economic development has effectively reduced urban carbon emissions. Hypothesis 1a is validated. Simultaneously, the coefficient of the spatial interaction term for Dige (W×Dige) is significant at the 5% level, implying the potential presence of spatial spillover effects of digital economy on carbon emissions.
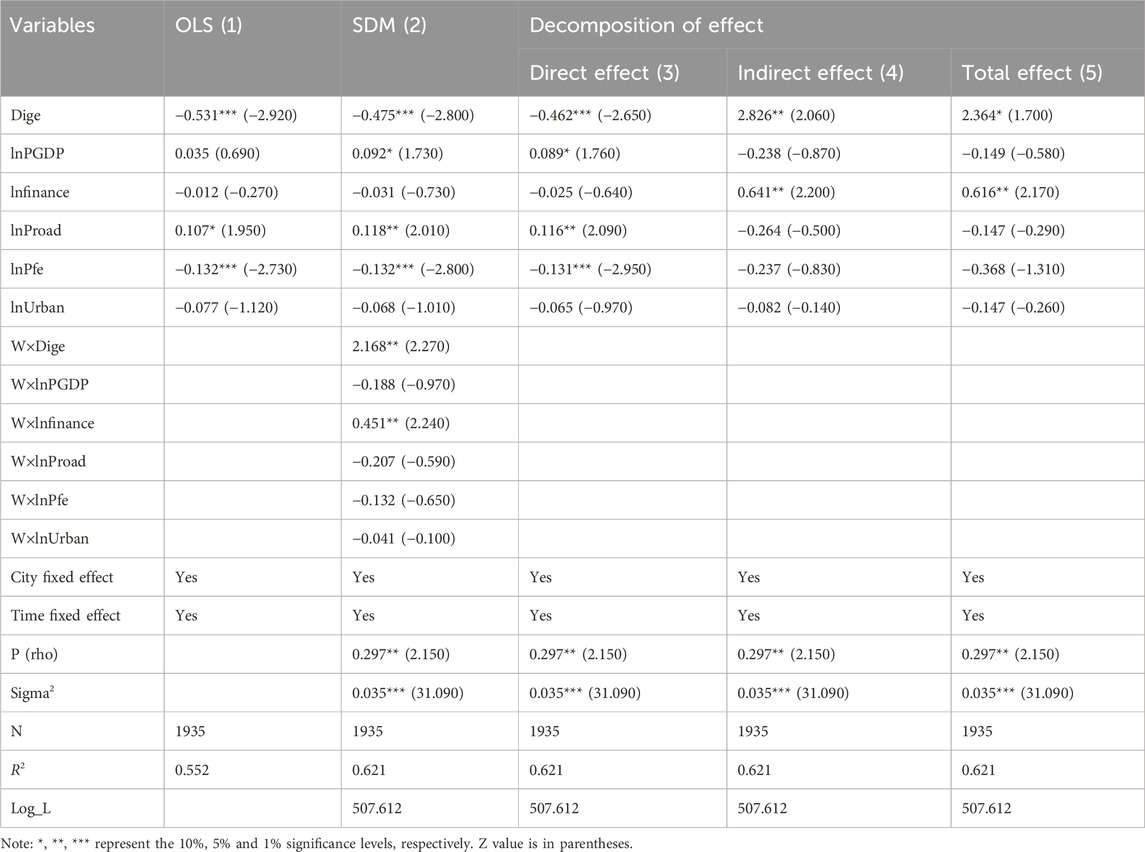
TABLE 5. Benchmark regression results.
We further decomposed the impact of various variables on carbon emissions into direct effects, indirect effects, and overall effects. In columns (3)–(5), the direct effect of Dige is significantly negative at the 1% level, while the indirect effect demonstrated a positive correlation at the 5% significance level. Increases in the level of Dige in neighboring regions amplify the pressure for carbon reduction in the local regions. It could be that the development of the local digital economy has driven the construction of digital infrastructure in surrounding areas, thereby exacerbating energy consumption and carbon emissions in those neighboring regions. Moreover, the high value-added nature of the digital economy squeezes the survival space of high carbon-emitting, low-profit industries, which compels these industries to relocate to surrounding areas, resulting in a geographical shift of carbon emissions. Hypothesis 1b is validated, and the spatial spillover of digital economy to carbon emission is negative.
Regarding the control variables, the economic level has exerted a catalytic effect on the carbon emissions, suggesting that the economic growth has not fostered a low-carbon development model. The financial development does not show a significant impact on carbon emissions in the local region, but it markedly stimulates carbon emissions in neighboring regions. It could be that the financial capital tends to flow more towards high-carbon industries than green enterprises. The transportation infrastructure significantly promotes carbon emissions. The transportation infrastructure enhances inter-city transport capacity, thereby amplifying carbon emissions from motor vehicles. As a powerful approach for controlling carbon emissions, government intervention demonstrates a notable reduction in carbon emissions. Through fiscal measures and administrative interventions, local governments guide enterprises towards low-carbon development. The urbanization rate does not distinctly affect regional carbon emissions.
A potential reverse causality exists between the digital economy and urban carbon emissions. To relieve the endogeneity, we used the instrumental variable (IV) estimation. The first IV is the geographical distance from each city to Hangzhou (lndigiv1) (Li and Wang, 2022). Hangzhou, birthplace of digital financial giants like Alibaba and home to Electronic World Trade Platform (eWTP), is driving the development of digital economy in China. Proximity to Hangzhou is expected to enhance the spillover effects, correlating with a higher level of digital economy. Thus, the first IV satisfies the correlation. Meanwhile, it is noteworthy that Hangzhou is merely one of the provincial capitals, and proximity to Hangzhou does not dictate carbon emissions levels, satisfying the exogeneity. The second IV is the per capita postal and telecommunication services (lndigiv2) across cities in 1984 (Bai et al., 2023). The application of digital technology originated with the popularization of postal and telecommunications services. Consequently, regions with advanced postal and telecommunications infrastructure are expected to demonstrate a high level of digital economy, thus meeting the correlation. Additionally, the historical data in 1984 have a negligible impact on contemporary carbon emissions, satisfying the exogeneity. We interacted the IVs with time trend terms to obtain panel data.
We employed a Two-Stage Least Squares (2SLS) regression analysis, and the results are presented in Table 6. The Kleibergen-Paap rk LM and Kleibergen-Paap rk Wald F serve as the outcomes of the Underidentification test and Weak Identification test, respectively, both significantly rejecting the null hypothesis of weak instrument variables. This underscores the effectiveness of IVs. Even with two IVs, the digital economy still significantly promoted carbon emissions reduction. The instrumental variable test further confirms Hypothesis 1.
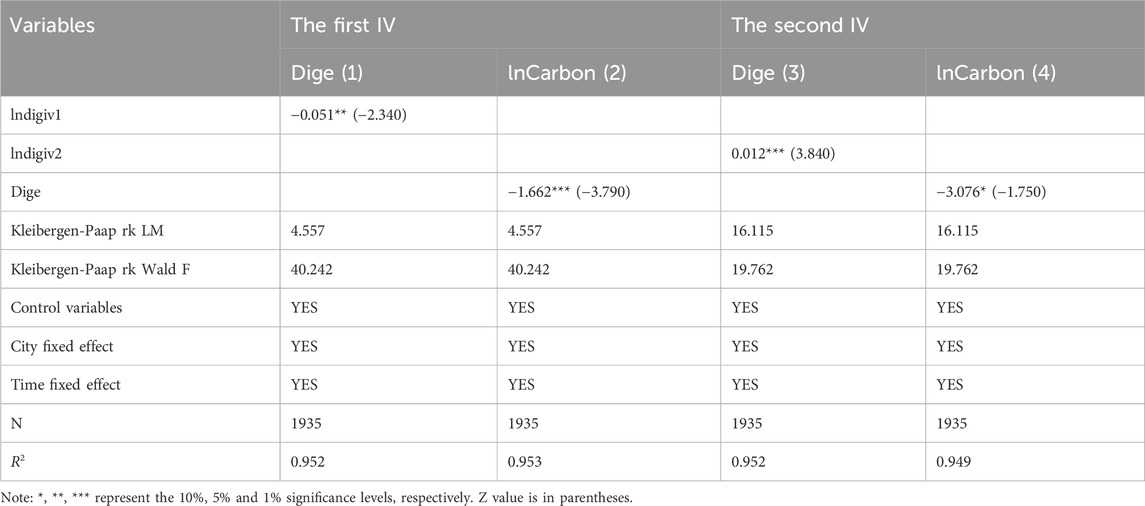
TABLE 6. The test results of IV.
Table 7 shows the results of other robustness tests. Firstly, column (1) indicates that, in the absence of control variables, the restraining effect of the digital economy on carbon emissions has also passed the significance test at the 1% level.
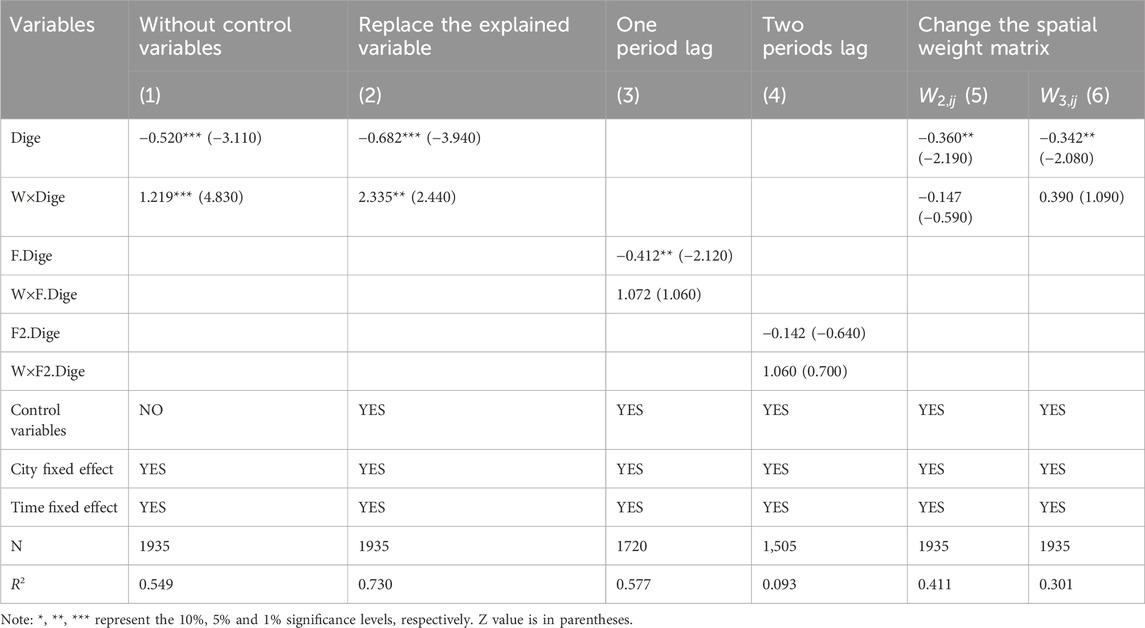
TABLE 7. Robustness test results.
Secondly, we introduced the per capita carbon emissions as a new explained variable for robustness testing. In column (2), after replacing the explained variable, the regression coefficient of the digital economy remains significantly negative at the 1% level. Compared with the coefficient in benchmark regression, the digital economy demonstrates a more pronounced effect on reducing per capita carbon emissions.
Thirdly, this paper introduced lagged periods of one and two for the digital economy. Column (3) shows that coefficient for lag one is significantly negative, which not only affirms the robustness of the benchmark regression results but also indicates a temporal lag in the impact of the digital economy on urban carbon emissions. However, the estimated coefficient for lag two Dige is not significant in column (4), indicating a diminishing effect of the digital economy over time.
Fourthly, this study conducted a robustness test by substituting the inverse-distance matrix with the economic distance matrices (Xu et al., 2021). Two economic distance weighting matrices are denoted as
Table 8 reports the results of the mechanism tests. Both industrial structure upgrading and green technological innovation play a significant mediating role in the process of carbon reduction facilitated by the digital economy. Column (1) and (2) show that the digital economy does enhance urban carbon reduction by propelling industrial structure upgrading, thus confirming Hypothesis 2. The indirect effects of the digital economy on industrial structure upgrading are found to be negative. The “Internet plus” broadens the value-added scope of the service industry. In pursuit of higher returns, service industries in regions with lower digital economy levels tends to migrate towards regions with higher digital economy levels. Consequently, neighboring regions with advanced digital economies act as a siphon, attracting high value-added industries away from the local region and diminishing the capacity for industrial upgrading.
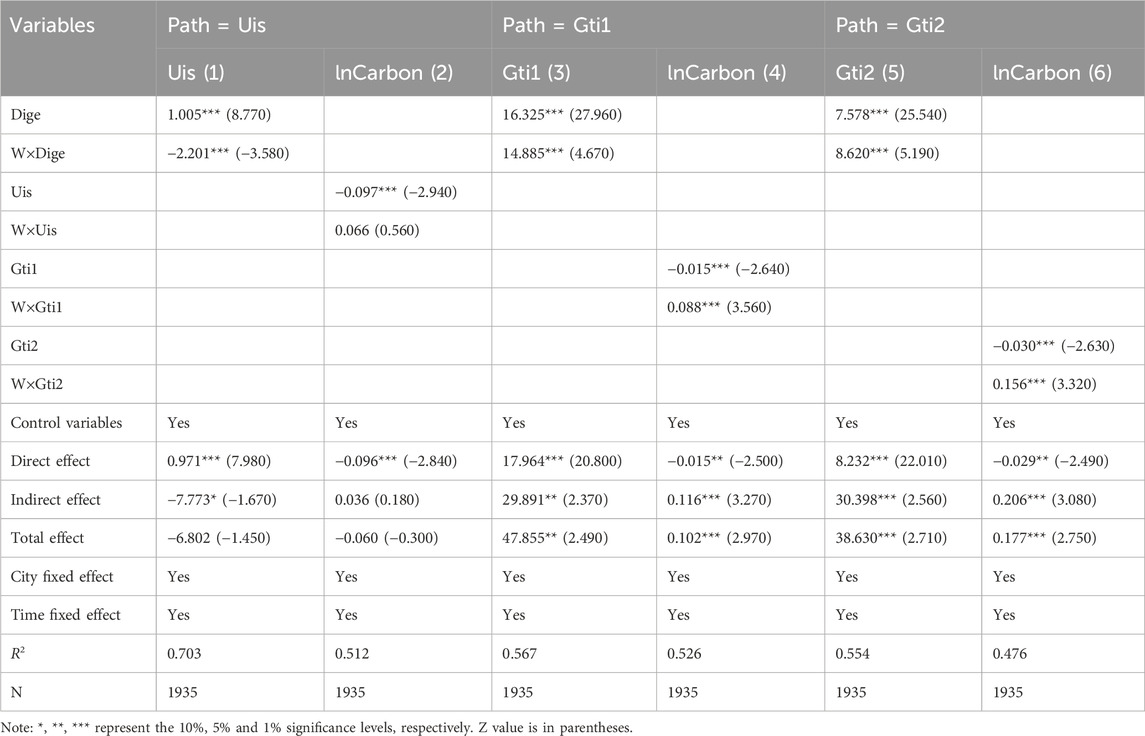
TABLE 8. Mechanism verification.
According to the columns (3) to (6), the digital economy could reduce carbon emissions through green technological innovation. The Hypothesis 3 is confirmed. Combining the regression results of (3) and (5), it can be observed that the promotion effect of the digital economy on green patent applications surpasses that on green patent grants. This discrepancy may arise from the long review period for patent grants, introducing its statistical time lags. The impact of the digital economy on current green technological innovation activities is more immediately evident in the number of green patent applications. The digital economy exhibits positive indirect effects on green patent applications and green patent grants in neighboring regions. The acceleration of information dissemination within the digital economy enhances the spatial spillover of knowledge and technology (Luo et al., 2023). This contributes to reduce the acquisition costs for enterprises pursuing green technologies, which facilitates the establishment of environmentally friendly production patterns within regions.
Due to regional disparities, there exists obvious heterogeneity in both the levels of digital economic development and carbon emissions. In accordance with Chinese regional classification, cities are divided into three regions: eastern, central, and western. Columns (1) to (3) of Table 9 are the regression results. For eastern cities, the digital economy significantly reduces carbon emissions in local regions, but its impact on neighboring cities is not significant. For central cities, the digital economy have the stronger emission reduction effect compared to other regions. However, it also exacerbates carbon emissions in neighboring cities. For western region, the coefficient of the digital economy is insignificant. The coal utilization rate and carbon emissions intensity in the central cities are relatively high. Concurrently, the digital economy is rapid ascending in the central region, thereby rendering the marginal emission reduction effects more pronounced.
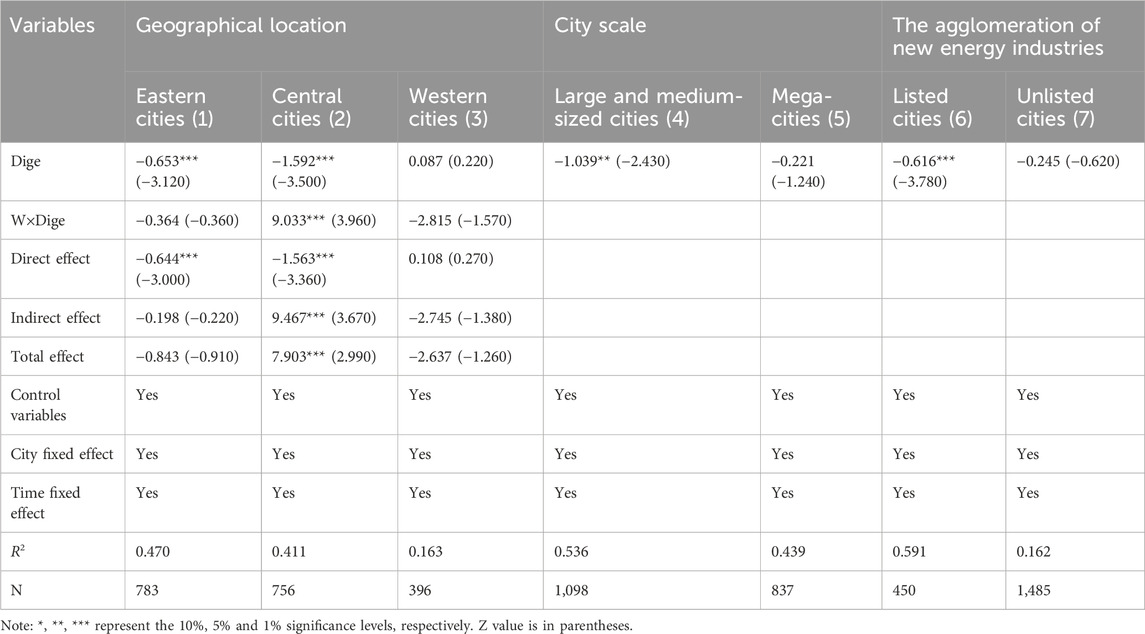
TABLE 9. Heterogeneity analysis.
Population size is an important heterogeneity factor affecting both carbon emissions and digital economy. According to the Chinese criteria for urban scale classification, cities are categorized as large and medium-sized cities (population below 5 million) or mega-cities (population equal to or exceeding 5 million). Considering the dispersed geographical distribution and low spatial correlation arising from this classification, we utilized a double fixed-effect OLS for analysis. According to columns (4) and (5) of Table 9, for large and medium-sized cities, the digital economy exhibits a significantly positive effect on carbon reduction. However, for mega-cities, the estimated coefficient of Dige did not pass the significance test. This could be that population agglomeration increases regional resource consumption and enhances transportation intensity, leading to higher carbon emissions. Furthermore, the development of digital economy could enhance residents’ consumption capacity, partially offsetting the carbon reduction effect inherent to the digital economy itself.
The development of new energy industry has become a key of addressing the contradiction between global climate warming and escalating energy consumption (Xu and Lin, 2018). The impact of the digital economy on carbon emissions exhibits heterogeneity based on the agglomeration of new energy industry. The Hurun Institute assessed the agglomeration of new energy industry in various cities from three dimensions: the agglomeration of high-quality enterprises, the agglomeration of small and medium-sized enterprises, and the agglomeration of investment enthusiasm. “2023 Hurun Chinese New Energy Industry Agglomeration City Ranking” has been issued, featuring a total of 50 cities. Leveraging the Hurun Report, this paper categorized cities into listed cities and unlisted cities, employing a double fixed-effect OLS regression for analysis.
The results in columns (6) and (7) demonstrate that the digital economy significantly reduces carbon emissions in listed cities, whereas its impact on carbon emissions in unlisted cities is not significant. This phenomenon is mainly ascribed to the robust integration between the digital economy and the new energy industry. The digital economy plays a crucial role in offering technological support for the new energy industry (Kittner et al., 2017). Concurrently, the advancement of new energy industry further catalyzes the growth of digital economy. Cities with a high agglomeration of the new energy industry exhibit an elevated level of digital economic development, leading to a more pronounced effect in reducing carbon emissions.
With the panel data of 215 cities from 2011 to 2019, this study calculated the development level of digital economy and explored the spatial-temporal evolution trend of digital economy and carbon emissions. Then, employing spatial empirical methods, this study quantitatively analysed the spatial impact of digital economy on urban carbon emissions, examining its mechanism and heterogeneity. The main conclusions are as follows.
(1) Digital economy development and urban carbon emissions both show strong spatial correlation. The levels of digital economy development have significantly improved in most cities, but the gap between cities shows a widening trend. The spatio-temporal evolution of digital economy is conspicuous, with a gradual rise in spatial agglomeration. Meanwhile, carbon emissions exhibit a relatively stable spatio-temporal evolution.
(2) The development of digital economy has a positive effect on urban carbon emissions reduction. After a series of robustness tests, this conclusion remains valid. The impact of digital economy on carbon emissions exists negative spatial spillover. While digital economy helps reduce carbon emission in the region, it concurrently heightens the burden of carbon reduction in neighboring regions. The spatial mechanism test shows that industrial structure upgrading and green technology innovation play mediating roles between digital economy and carbon emissions.
(3) The impact of digital economy on carbon emissions is heterogeneous with geographical location, city scale and new energy industry agglomeration. The reduction in emissions is more obvious in central cities, large and medium-sized cities as well as cities with a high agglomeration of new energy industry.
Based on the conclusions, the following policy implications for urban carbon reduction are proposed.
(1) It is supposed to expand the scale of digital economy to empower cities for digital transformation. Given the low development status of digital economy in many cities, there is huge space for digital economic growth in Chinese cities. The construction of the information infrastructure should be promoted to achieve higher quality connectivity, facilitating the development of digital industries such as big data, the Internet, and 5G.
(2) The focus should be on fostering the development of key metropolitan areas such as Shanghai, Beijing, Guangzhou, etc., and extend the regional radiation effect of digital economy center cities. It is suggested to establish regional digital technology research platforms to break digital barriers, so as to propel the diffusion of digital technologies among cities. Western region cities could be encouraged to cooperate with the central and eastern region cities in the digital economy sphere, aiming to narrow the “digital gap” through technology transfer and industrial cooperation.
(3) Greater attention should be paid to upgrading the industrial structure and strengthening green technology innovation. It is recommended to drive urban industrial upgrading by advancing digital industries and leverage the role of the digital economy in promoting the tertiary industry. Increase the supply of premium digital products and services on the supply side, while expand the digital consumer market on the demand side. The government should intensify its support for green technology innovation and augment financial support for related innovation activities. Direct efforts should be made towards researching key low-carbon technologies, such as carbon storage and carbon capture, aiming to provide technical support.
(4) Differentiated policies based on the specific urban development are proposed to be implemented. According to local conditions such as the geographical position, the city scale and the agglomeration of new energy industry, the specific plans for digital economy should be made. Policy formulation could be appropriately tilted toward western cities to expand their digital economy scale. Additionally, in cities with a pre-existing foundation in the new energy industry, it is imperative to intensify substantial support for these industries.
This study also exists some limitations, necessitating some improvements in future research. First, our study covers the period 2011–2019. Since 2020, the global COVID-19 outbreak has catalyzed the rapid expansion of digital economy, particularly online activities. In the era of the pandemic and its aftermath, it is imperative to delve deeper into the relationship between the digital economy and carbon emissions. Secondly, our study focuses on the city level, lacking the micro-level exploration. The deep integration of digital economy into enterprise-societal progress has hastened shifts in production and lifestyle. Consequently, there is a necessity to integrate micro and macro research perspectives and systematically examine the impact of digital economy on carbon emissions. Micro-level research centered around enterprises could be further expanded. Thirdly, limited by data availability, this study does not define specific indicators related to data factor within the evaluation system. Considering the growing importance of data factor in productive activities (Hao X. et al., 2023), future research need incorporate relevant evaluation indicators. Fourthly, the measurement of green technological innovation requires further refinement. While the number of patents can reflect the outcomes of technological innovation activities, its capacity for elucidating the process of technological innovation is limited. Future efforts may study the process from perspectives such as financial investment, technical personnel, and related factors.
Publicly available datasets were analyzed in this study. This data can be found here: China Carbon Accounting Database (https://www.ceads.net.cn/); China Urban Statistical Yearbook; China National Intellectual Property Administration (https://www.cnipa.gov.cn/); Peking University Digital Finance Research Center and Ant Group Research Institute.
HZ: Conceptualization, Data curation, Methodology, Writing–original draft. RQ: Conceptualization, Methodology, Writing–review and editing. YL: Writing–review and editing. TW: Data curation, Methodology, Writing–review and editing. FZ: Data curation, Writing–review and editing. QZ: Data curation, Writing–review and editing. KW: Conceptualization, Writing–review and editing.
The author(s) declare that financial support was received for the research, authorship, and/or publication of this article. This research was funded by 2023 Annual Open Research Project on Collaborative Innovation Center for Emissions Trading system Co-constructed by the Province and Ministry (Grant Number 23CICETS-YB006), National Social Science Foundation Project (Grant Number 2022BTJ051) and the Youth Project of Hubei Provincial Natural Science Foundation (Grant Number 2022CFB769).
Authors FZ and QZ were employed by Safecleen Technology Co., Ltd.
The remaining authors declare that the research was conducted in the absence of any commercial or financial relationships that could be construed as a potential conflict of interest.
All claims expressed in this article are solely those of the authors and do not necessarily represent those of their affiliated organizations, or those of the publisher, the editors and the reviewers. Any product that may be evaluated in this article, or claim that may be made by its manufacturer, is not guaranteed or endorsed by the publisher.
The Supplementary Material for this article can be found online at: https://www.frontiersin.org/articles/10.3389/fenvs.2024.1370938/full#supplementary-material
Akberdina, V., and Osmonova, A. (2021). Digital transformation of energy sector companies. Paper presented at the E3S Web of Conferences.
Bai, T. T., Qi, Y., Li, Z. H., and Xu, D. (2023). Digital economy, industrial transformation and upgrading, and spatial transfer of carbon emissions: the paths for low-carbon transformation of Chinese cities. J. Environ. Manage. 344, 118528. doi:10.1016/j.jenvman.2023.118528
Banalieva, E. R., and Dhanaraj, C. (2019). Internalization theory for the digital economy. J. Int. Bus. Stud. 50, 1372–1387. doi:10.1057/s41267-019-00243-7
Cai, B., Guo, H., Cao, L., Guan, D., and Bai, H. (2018). Local strategies for China's carbon mitigation: an investigation of Chinese city-level CO2 emissions. J. Clean. Prod. 178, 890–902. doi:10.1016/j.jclepro.2018.01.054
Chen, P. Y. (2022). Is the digital economy driving clean energy development? -New evidence from 276 cities in China. J. Clean. Prod. 372, 133783. doi:10.1016/j.jclepro.2022.133783
Dian, J., Song, T., and Li, S. L. (2024). Facilitating or inhibiting? Spatial effects of the digital economy affecting urban green technology innovation. Energy Econ. 129, 107223. doi:10.1016/j.eneco.2023.107223
Dong, F., Hu, M., Gao, Y., Liu, Y., Zhu, J., and Pan, Y. (2022). How does digital economy affect carbon emissions? Evidence from global 60 countries. Sci. Total Environ. 852, 158401. doi:10.1016/j.scitotenv.2022.158401
Du, K., and Li, J. (2019). Towards a green world: how do green technology innovations affect total-factor carbon productivity. Energy Policy 131, 240–250. doi:10.1016/j.enpol.2019.04.033
Du, K., Li, P., and Yan, Z. (2019). Do green technology innovations contribute to carbon dioxide emission reduction? Empirical evidence from patent data. Technol. Forecast Soc. Change 146, 297–303. doi:10.1016/j.techfore.2019.06.010
Elhorst, J. P. (2010). Applied spatial econometrics: raising the bar. Spat. Econ. Anal. 5 (1), 9–28. doi:10.1080/17421770903541772
Farboodi, M., Mihet, R., Philippon, T., and Veldkamp, L. (2019). “Big data and firm dynamics,” in Paper presented at the AEA papers and proceedings.
Gan, C., Yu, J., Zhao, W., and Fan, Y. (2023). Big data industry development and carbon dioxide emissions: a quasi-natural experiment. J. Clean. Prod. 422, 138590. doi:10.1016/j.jclepro.2023.138590
Goldfarb, A., and Tucker, C. (2019). Digital economics. J. Econ. Lit. 57 (1), 3–43. doi:10.1257/jel.20171452
Guo, B., Wang, Y., Zhang, H., Liang, C., Feng, Y., and Hu, F. (2023). Impact of the digital economy on high-quality urban economic development: evidence from Chinese cities. Econ. Model. 120, 106194. doi:10.1016/j.econmod.2023.106194
Guo, F., Wang, J., Wang, F., Kong, T., Zhang, X., and Cheng, Z. (2020). Measuring China’s digital financial inclusion: index compilation and spatial characteristics. China Econ. Q. 19 (4), 1401–1418. doi:10.13821/j.cnki.ceq.2020.03.12
Hao, X., Wang, X., Wu, H., and Hao, Y. (2023a). Path to sustainable development: does digital economy matter in manufacturing green total factor productivity? Sustain. Dev. 31 (1), 360–378. doi:10.1002/sd.2397
Hao, X. L., Li, Y. H., Ren, S. Y., Wu, H. T., and Hao, Y. (2023b). The role of digitalization on green economic growth: does industrial structure optimization and green innovation matter? J. Environ. Manage. 325, 116504. doi:10.1016/j.jenvman.2022.116504
Huang, Y., Hu, M., Xu, J., and Jin, Z. (2023). Digital transformation and carbon intensity reduction in transportation industry: empirical evidence from a global perspective. J. Environ. Manage. 344, 118541. doi:10.1016/j.jenvman.2023.118541
Kittner, N., Lill, F., and Kammen, D. M. (2017). Energy storage deployment and innovation for the clean energy transition. Nat. Energy 2 (9), 17125–17126. doi:10.1038/nenergy.2017.125
Lee, C.-C., Wang, C.-s., He, Z., Xing, W.-w., and Wang, K. (2023). How does green finance affect energy efficiency? The role of green technology innovation and energy structure. Renew. Energy 219, 119417. doi:10.1016/j.renene.2023.119417
Li, G., and Wei, W. (2021). Financial development, openness, innovation, carbon emissions, and economic growth in China. Energy Econ. 97, 105194. doi:10.1016/j.eneco.2021.105194
Li, Z., and Wang, J. (2022). The dynamic impact of digital economy on carbon emission reduction: evidence city-level empirical data in China. J. Clean. Prod. 351, 131570. doi:10.1016/j.jclepro.2022.131570
Liu, L., Ding, T., and Wang, H. (2022). Digital economy, technological innovation and green high-quality development of industry: a study case of China. Sustainability 14 (17), 11078. doi:10.3390/su141711078
Luo, S., Yimamu, N., Li, Y., Wu, H., Irfan, M., and Hao, Y. (2023). Digitalization and sustainable development: how could digital economy development improve green innovation in China? Bus. Strategy Environ. 32 (4), 1847–1871. doi:10.1002/bse.3223
Lyu, W., and Liu, J. (2021). Artificial Intelligence and emerging digital technologies in the energy sector. Appl. energy 303, 117615. doi:10.1016/j.apenergy.2021.117615
Lyu, Y., Wang, W., Wu, Y., and Zhang, J. (2023). How does digital economy affect green total factor productivity? Evidence from China. Sci. Total Environ. 857, 159428. doi:10.1016/j.scitotenv.2022.159428
Ma, D., and Zhu, Q. (2022). Innovation in emerging economies: research on the digital economy driving high-quality green development. J. Bus. Res. 145, 801–813. doi:10.1016/j.jbusres.2022.03.041
Ma, K. (2023). Digital inclusive finance and corporate green technology innovation. Finance Res. Lett. 55, 104015. doi:10.1016/j.frl.2023.104015
Meng, X.-N., Xu, S.-C., and Hao, M.-G. (2023). Can digital-real integration promote industrial green transformation: fresh evidence from China's industrial sector. J. Clean. Prod. 426, 139116. doi:10.1016/j.jclepro.2023.139116
Mikalef, P., Boura, M., Lekakos, G., and Krogstie, J. (2019). Big data analytics and firm performance: findings from a mixed-method approach. J. Bus. Res. 98, 261–276. doi:10.1016/j.jbusres.2019.01.044
Müller, J. M. (2019). Antecedents to digital platform usage in Industry 4.0 by established manufacturers. Sustainability 11 (4), 1121. doi:10.3390/su11041121
Ning, J., Yin, Q., and Yan, A. (2022). How does the digital economy promote green technology innovation by manufacturing enterprises? Evidence from China. Front. Environ. Sci. 10, 967588. doi:10.3389/fenvs.2022.967588
Ran, C., and Zhang, Y. (2023). The driving force of carbon emissions reduction in China: does green finance work. J. Clean. Prod. 421, 138502. doi:10.1016/j.jclepro.2023.138502
Ren, S., Li, L., Han, Y., Hao, Y., and Wu, H. (2022). The emerging driving force of inclusive green growth: does digital economy agglomeration work? Bus. Strategy Environ. 31 (4), 1656–1678. doi:10.1002/bse.2975
Shan, Y., Guan, Y., Hang, Y., Zheng, H., Li, Y., Guan, D., et al. (2022). City-level emission peak and drivers in China. Sci. Bull. 67 (18), 1910–1920. doi:10.1016/j.scib.2022.08.024
Si, S., Hall, J., Suddaby, R., Ahlstrom, D., and Wei, J. (2023). Technology, entrepreneurship, innovation and social change in digital economics. Elsevier, 102484.
Smith, L. V., Tarui, N., and Yamagata, T. (2021). Assessing the impact of COVID-19 on global fossil fuel consumption and CO2 emissions. Energy Econ. 97, 105170. doi:10.1016/j.eneco.2021.105170
Sporkmann, J., Liu, Y., and Spinler, S. (2023). Carbon emissions from European land transportation: a comprehensive analysis. Transp. Res. D. Transp. Environ. 121, 103851. doi:10.1016/j.trd.2023.103851
Sun, D. J., Zhang, Y., Xue, R., and Zhang, Y. (2017). Modeling carbon emissions from urban traffic system using mobile monitoring. Sci. Total Environ. 599, 944–951. doi:10.1016/j.scitotenv.2017.04.186
Tan, J. R., and Chen, L. (2022). Spatial effect of digital economy on particulate matter 2.5 in the process of smart cities: evidence from prefecture-level cities in China. Int. J. Environ. Res. Public Health 19 (21), 14456. doi:10.3390/ijerph192114456
Tan, L., Yang, Z., Irfan, M., Ding, C. J., Hu, M., and Hu, J. (2023). Toward low-carbon sustainable development: exploring the impact of digital economy development and industrial restructuring. Bus. Strategy Environ. doi:10.1002/bse.3584
Thornbush, M. J., and Golubchikov, O. (2019). Sustainable urbanism in digital transitions: from low carbon to smart sustainable cities. Springer.
Varlamova, J., and Kadochnikova, E. (2023). Modeling the spatial effects of digital data economy on regional economic growth: SAR, SEM and SAC models. Mathematics 11 (16), 3516. doi:10.3390/math11163516
Wang, D., Liao, H., Liu, A., and Li, D. (2023). Natural resource saving effects of data factor marketization: implications for green recovery. Resour. Policy 85, 104019. doi:10.1016/j.resourpol.2023.104019
Wang, J., Dong, K., Dong, X., and Taghizadeh-Hesary, F. (2022a). Assessing the digital economy and its carbon-mitigation effects: the case of China. Energy Econ. 113, 106198. doi:10.1016/j.eneco.2022.106198
Wang, J., Wang, B., Dong, K., and Dong, X. (2022b). How does the digital economy improve high-quality energy development? The case of China. Technol. Forecast Soc. Change 184, 121960. doi:10.1016/j.techfore.2022.121960
Wang, L., and Shao, J. (2023). Digital economy, entrepreneurship and energy efficiency. Energy 269, 126801. doi:10.1016/j.energy.2023.126801
Wang, W., Li, Y., Lu, N., Wang, D., Jiang, H., and Zhang, C. (2020). Does increasing carbon emissions lead to accelerated eco-innovation? Empirical evidence from China. J. Clean. Prod. 251, 119690. doi:10.1016/j.jclepro.2019.119690
Wang, Z., Zhu, Y., Zhu, Y., and Shi, Y. (2016). Energy structure change and carbon emission trends in China. Energy 115, 369–377. doi:10.1016/j.energy.2016.08.066
Wilson, J. (2011). Colonising space: the new economic Geography in theory and practice. New Polit. Econ. 16 (3), 373–397. doi:10.1080/13563467.2010.504299
Xu, B., and Lin, B. (2018). Assessing the development of China's new energy industry. Energy Econ. 70, 116–131. doi:10.1016/j.eneco.2018.01.001
Xu, C., Zhao, W., Li, X., Cheng, B., and Zhang, M. (2023a). Quality of life and carbon emissions reduction: does digital economy play an influential role? Clim. Policy, 1–16. doi:10.1080/14693062.2023.2197862
Xu, L., Fan, M., Yang, L., and Shao, S. (2021). Heterogeneous green innovations and carbon emission performance: evidence at China's city level. Energy Econ. 99, 105269. doi:10.1016/j.eneco.2021.105269
Xu, Q., Hu, Q., Chin, T., Chen, C., Shi, Y., and Xu, J. (2019). How supply chain integration affects innovation in a digital age: moderating effects of sustainable policy. Sustainability 11 (19), 5460. doi:10.3390/su11195460
Xu, X., Cui, X., Zhang, Y., Chen, X., and Li, W. (2023b). Carbon neutrality and green technology innovation efficiency in Chinese textile industry. J. Clean. Prod. 395, 136453. doi:10.1016/j.jclepro.2023.136453
Yi, M., Liu, Y., Sheng, M. S., and Wen, L. (2022). Effects of digital economy on carbon emission reduction: new evidence from China. Energy Policy 171, 113271. doi:10.1016/j.enpol.2022.113271
Yin, S., Pamucar, D., Ullah, K., and Garg, H. (2023). Editorial: fuzzy mathematical model and optimization in digital green innovation for Industry 5.0. Front. Environ. Sci. 11, 1269419. doi:10.3389/fenvs.2023.1269419
Yu, W., Zhang, L., and Yang, C. (2023). The impact of the digital economy on enterprise innovation behavior: based on CiteSpace knowledge graph analysis. Front. Psychol. 14, 1031294. doi:10.3389/fpsyg.2023.1031294
Zeng, J., and Yang, M. (2023). Digital technology and carbon emissions: evidence from China. J. Clean. Prod. 430, 139765. doi:10.1016/j.jclepro.2023.139765
Zhang, H., Wang, Y. W., Wang, C., Yang, J. M., and Yang, S. W. (2022a). Coupling analysis of environment and economy based on the changes of ecosystem service value. Ecol. Indic. 144, 109524. doi:10.1016/j.ecolind.2022.109524
Zhang, J., Lyu, Y., Li, Y., and Geng, Y. (2022b). Digital economy: an innovation driving factor for low-carbon development. Environ. Impact Assess. Rev. 96, 106821. doi:10.1016/j.eiar.2022.106821
Zhang, L., Mu, R., Zhan, Y., Yu, J., Liu, L., Yu, Y., et al. (2022c). Digital economy, energy efficiency, and carbon emissions: evidence from provincial panel data in China. Sci. Total Environ. 852, 158403. doi:10.1016/j.scitotenv.2022.158403
Zhang, N., Yu, K., and Chen, Z. (2017). How does urbanization affect carbon dioxide emissions? A cross-country panel data analysis. Energy Policy 107, 678–687. doi:10.1016/j.enpol.2017.03.072
Zhang, W., Liu, X. M., Wang, D., and Zhou, J. P. (2022d). Digital economy and carbon emission performance: evidence at China's city level. Energy Policy 165, 112927. doi:10.1016/j.enpol.2022.112927
Zheng, J., Shao, X., Liu, W., Kong, J., and Zuo, G. (2021). The impact of the pilot program on industrial structure upgrading in low-carbon cities. J. Clean. Prod. 290, 125868. doi:10.1016/j.jclepro.2021.125868
Keywords: digital economy, urban carbon emissions, spatial spillover effect, mediating effect, heterogeneity
Citation: Zhang H, Qi R, Liu Y, Wang T, Zhong F, Zhou Q and Wang K (2024) The spatial impact of digital economy on carbon emissions reduction: evidence from 215 cities in China. Front. Environ. Sci. 12:1370938. doi: 10.3389/fenvs.2024.1370938
Received: 15 January 2024; Accepted: 15 February 2024;
Published: 01 March 2024.
Edited by:
Le Wen, University of Auckland, New ZealandReviewed by:
Song Wang, Northeastern University, ChinaCopyright © 2024 Zhang, Qi, Liu, Wang, Zhong, Zhou and Wang. This is an open-access article distributed under the terms of the Creative Commons Attribution License (CC BY). The use, distribution or reproduction in other forums is permitted, provided the original author(s) and the copyright owner(s) are credited and that the original publication in this journal is cited, in accordance with accepted academic practice. No use, distribution or reproduction is permitted which does not comply with these terms.
*Correspondence: Keying Wang, d2FuZ2tleWluZ0AxMjYuY29t
Disclaimer: All claims expressed in this article are solely those of the authors and do not necessarily represent those of their affiliated organizations, or those of the publisher, the editors and the reviewers. Any product that may be evaluated in this article or claim that may be made by its manufacturer is not guaranteed or endorsed by the publisher.
Research integrity at Frontiers
Learn more about the work of our research integrity team to safeguard the quality of each article we publish.