 Xiaojing You1
 Jiaxin Wu
- 1Jiangsu Maritime Institute, Nanjing, China
- 2School of International Economics and Trade, Nanjing University of Finance and Economics, Nanjing, China
- 3School of Management Science and Engineering, Nanjing University of Information Science and Technology, Nanjing, China
Green insurance (GI), as an innovative product integrating environmental protection and the financial sector, not only contributes to improving regional environmental quality (EQ) but also enhances corporate environmental risk management and awareness, driving the flourishing development of green finance and the environmental protection industry. Therefore, understanding the relationship between GI and EQ is crucial. This article delves into the mechanisms through which GI influences EQ, proposing a hypothesis that suggests an inverted “U” shape impact. Subsequently, based on panel data from 30 provinces in China spanning from 2000 to 2021, nonlinear regression models and threshold regression models were constructed to test the hypothesis. The research findings indicate: (1) Results from the fixed-effects regression model demonstrate that the impact of GI on China’s EQ follows an inverted “U” shape. (2) Results from the threshold regression model also reveal an inverted “U” shape impact of GI on China’s EQ, with a threshold value of 2.196. (3) Economic level and industrial structure exhibit significant inhibitory effects on EQ improvement. Technological level and environmental regulations demonstrate notable promotional effects. Population size shows no significant impact on EQ improvement. The study identifies a nonlinear effect of GI on EQ improvement, surpassing existing linear effect research, deepening the understanding of its impact on EQ, and contributing to the enhancement of regional EQ.
1 Introduction
In recent years, environmental pollution has emerged as one of the most pressing global challenges. Taking air pollution as an example, the 2023 Global Air Quality Report released by the International Energy Agency revealed that only seven countries worldwide met the World Health Organization’s PM2.5 guideline standards in 2023. A staggering 92.5% of countries and regions fell short of these standards (Dimitroulopoulou et al., 2023). Green insurance (GI), as an innovative product merging environmental protection with the financial sector, offers a novel avenue for enhancing environmental quality (EQ) (Hu et al., 2023). Therefore, this study aims to illuminate the impact of GI on regional EQ, unraveling its underlying mechanisms in environmental governance. It seeks to provide insights and inspiration for the development of regional green finance and the enhancement of EQ.
In recent years, China has experienced rapid economic growth, marked by swift strides in marketization, industrialization, and internationalization. However, escalating environmental pollution has emerged as a bottleneck hindering China’s sustainable development. Furthermore, China’s enormous population, rapid industrialization and urbanization, and export-oriented economy have propelled it to become one of the world’s largest carbon emitters. Nevertheless, the Chinese government has actively promoted ecological civilization construction in recent years, implementing a series of environmental protection policies and measures. Lastly, China stands as a significant testing ground for the development of green finance. In 2023, China’s GI revenue reached 229.7 billion yuan, with payouts totaling 121.5 billion yuan, spanning various sectors including transportation infrastructure, clean energy, and wastewater treatment (Wen et al., 2024). In summary, China’s environmental governance practices and the advancement of green finance wield significant influence and serve as exemplary models for global environmental protection endeavors.
To thoroughly investigate the impact of GI on regional EQ, this paper first constructs an EQ evaluation index system to conduct an in-depth assessment of the current EQ in China. Furthermore, through an in-depth research of the impact mechanisms of GI on EQ, the hypothesis is proposed that the impact of GI on China’s EQ follows an inverted “U” shape. Subsequently, this paper uses panel data from 30 provinces in China from 2000 to 2021 to construct nonlinear panel regression models and threshold regression models to validate the proposed hypotheses. Finally, based on the research findings, recommendations for strategies to promote the improvement of China’s EQ are put forward. Studying the impact of GI on regional EQ can provide a new theoretical perspective for the field of environmental economics. Deepen the understanding of the coordinated relationship between environmental protection and economic development. To provide support for building more effective environmental governance theories. On the other hand, this article intends to examine the inverted U-shaped nonlinear relationship between GI and EQ, which goes beyond the scope of traditional linear analysis. Deepening its understanding of the impact on EQ can provide scientific basis for government environmental governance. Promote the transformation of the economy towards a green and sustainable direction.
The significance of this study lies in the ambiguity surrounding the operational mechanisms of GI as an emerging tool for environmental protection. A comprehensive investigation into the impact of GI on EQ holds paramount importance. Moreover, empirical analysis of the relationship between GI and EQ can furnish governmental bodies with scientific grounds for formulating more precise environmental policies. Finally, by delving into the inverted U-shaped relationship between GI and EQ, this study aids in unveiling the latent mechanisms of GI in environmental governance, thereby offering valuable insights and inspiration for the development of green finance.
Compared to previous studies, the primary contribution of this research lies in its systematic exploration of the impact of GI on the EQ of Chinese provinces through the introduction of a threshold regression model. Furthermore, it substantiates the existence of an inverted U-shaped relationship. Additionally, this study accounts for the heterogeneity among Chinese provinces, robustly examining the validity of its findings, thus enhancing the credibility and persuasiveness of the research outcomes.
2 Literature review
With the continuous severity of global environmental issues, enhancing EQ has become a focal point of widespread attention in academic and policy domains. Regional EQ is influenced by various factors. Some studies have found that the production processes of heavy industry often generate large amounts of industrial solid waste, wastewater, and exhaust gases (Wang et al., 2023a). The production and use of fossil fuels also result in significant greenhouse gas emissions (Gillingham and Stock, 2018). Therefore, the industry structure dominated by heavy industry and the energy structure dominated by fossil fuels are important factors affecting regional EQ. On the other hand, advanced technological levels contribute to the improvement of clean technologies and resource utilization efficiency (Wang et al., 2024). Environmental protection policies enacted and enforced by the government directly impact the behavior of businesses and individuals (Wang et al., 2023b). Therefore, technological levels and environmental protection policies are crucial factors in enhancing regional EQ. In addition, some scholars have found that the increase in the level of urbanization is often accompanied by the rapid development of industrialization and extensive infrastructure construction, leading to increased emissions of pollutants and a decrease in regional EQ (Liang et al., 2019). However, other scholars have different findings, suggesting that urbanization improves the utilization of production factors, reduces resource waste, and lowers pollutant emissions (Li et al., 2022). Finally, a minority of scholars have delved into the impact of factors such as foreign direct investment (FDI) (Wang et al., 2023c), population mobility (Dhondt et al., 2012), and motor vehicles (Montag, 2015) on regional EQ.
GI, as an emerging insurance model, aims to enhance EQ through financial means (Mills, 2009). In recent years, numerous scholars have extensively researched the development and application of GI. Through theoretical analysis, many scholars have found that GI plays a positive role not only in strengthening enterprise environmental risk management (Yang and Zhang, 2022) but also in accelerating the layout of green industries (Mills, 2003) and promoting innovation in green technologies (Hu et al., 2023). It can continuously enhance public and societal environmental awareness (Brogi et al., 2022), guide the direction of social funds (Desalegn, 2023), and promote the improvement of regional EQ. On the other hand, a minority of scholars, through empirical research, have delved into the impact of GI on EQ. The research by Ning and other scholars indicates that GI, through flexible premium designs, incentivizes enterprises to adopt more environmentally friendly production methods, encouraging the reduction of pollution emissions (Ning et al., 2023). Studies by Hou and others indicate that enterprises purchasing GI allocate more funds to environmental protection projects (Hou and Wang, 2022). A limited number of scholars have delved into an empirical analysis to further investigate the impact of GI on environmental pollution. Scholars such as Ning have uncovered that the differentiated premium design of GI serves as an incentive for enterprises to adopt more environmentally friendly production methods, thereby exerting a promoting effect on the enhancement of regional EQ (Ning et al., 2023). The research conducted by Hou and others reveals that enterprises purchasing GI allocate more funds to environmental construction, leading to a reduction in pollution emissions (Hou and Wang, 2022). However, divergent conclusions have been drawn by some scholars who argue that GI may impede the improvement of EQ. Lu and collaborators found that an excessive reliance on GI could diminish the proactive innovation in green technologies by enterprises, ultimately hindering long-term benefits for the enhancement of regional EQ as companies merely satisfy minimum environmental standards (Lu et al., 2022). In their study focused on China’s environmental protection industry, Yang and team discovered a relatively modest impetus of GI on the environmental protection industry and a limited impact on the improvement of EQ (Hou and Wang, 2022).
In conclusion, the study of the impact of GI on EQ is still in its infancy as an emerging field. Existing research outcomes suggest a linear relationship between GI and EQ, yet discrepancies and contradictions persist among these findings. Some studies assert the positive effects of GI, while others hold opposing views. This paper aims to employ threshold regression and nonlinear models to examine the inverted U-shaped relationship, thereby elucidating the aforementioned contradictions. By transcending traditional linear analyses, this research deepens our comprehension of how GI influences EQ. It provides a more nuanced and profound perspective for the study of GI and EQ, ultimately empowering governments to tailor and adjust GI policies with greater precision. This strategic approach maximizes the positive impact on the environment, fostering sustainable regional development.
3 Influencing mechanism and hypothesis
GI plays a crucial role in improving regional EQ, and its impact on EQ varies at different stages, as shown in Figure 1.
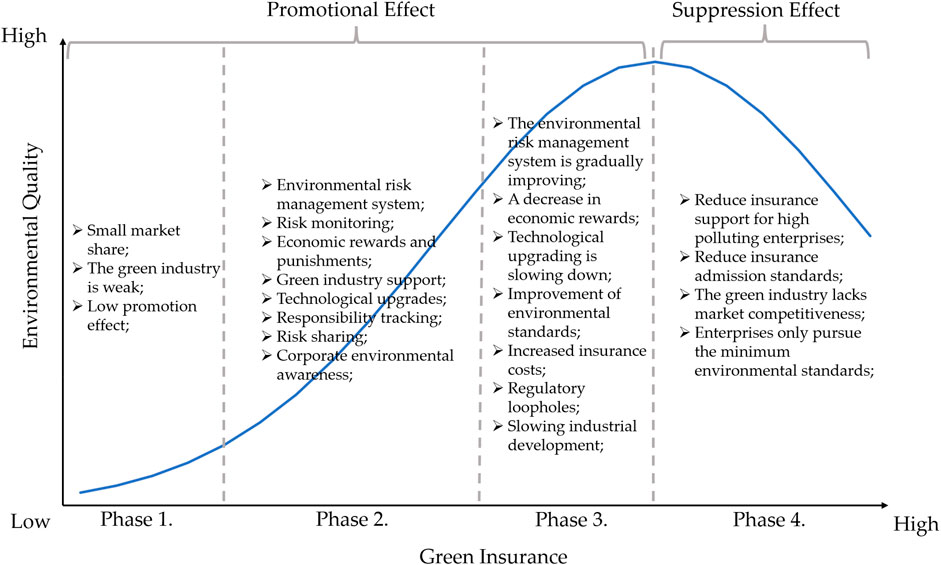
Figure 1. Analysis chart of impact mechanism.
First is the initiation stage of the promotion effect. In the early introduction of GI, regional society and government have a low level of attention to EQ issues. The development of the green industry is weak, and businesses have a limited understanding of GI. This leads to a small market share for GI and a lower promotion effect on EQ (Zhu et al., 2023).
Second is the expansion stage of the promotion effect. As EQ issues receive widespread attention from society and government, the GI market gradually expands, and the EQ promotion effect of GI significantly increases. This includes the improvement of enterprise environmental risk management systems, risk monitoring, economic incentives and penalties, technological upgrades and applications, environmental responsibility tracking, risk sharing, support for green industries, etc., effectively promoting a rapid improvement in regional EQ. Moreover, with the increase in corporate information transparency and the emphasis on corporate environmental responsibility by society, companies begin to take voluntary environmental measures, accelerating the improvement of EQ (Rahmatiar, 2018).
Third is the slowing stage of the effect. As the GI market continues to expand, certain factors contribute to the gradual slowdown of the EQ promotion effect of GI (Lee and Fung, 2023). First, enterprise environmental risk management systems are becoming increasingly perfected, and pollution reduction measures that are relatively easy to implement have become widely adopted. Second, environmental standards are gradually increasing, environmental incentive mechanisms are insufficient, and green technologies face bottlenecks, leading to rising environmental costs and a slowdown in the promotion effect. Third, the growth of the green industry is slowing, with the primary factor affecting green industry development no longer being a lack of funds but rather technological breakthroughs. Fourth, with the expansion of the GI market, market supervision may lag behind market changes, leading to regulatory loopholes in the GI market.
Fourth is the suppression effect stage. When the market share of GI reaches saturation, the promotional effect of GI transforms into a suppression effect. On one hand, as competition intensifies in the GI market and related regulations become stricter, insurance companies are compelled to raise environmental standards and reduce support for highly polluting enterprises (Wang et al., 2021). On the other hand, with the comprehensive expansion of the GI market, excessive reliance by the government, industry, and enterprises on the EQ promotion effect of GI leads to the government lowering environmental standards, the green industry lacking market competitiveness, and enterprises merely meeting the minimum environmental standards, resulting in a decline in EQ (Wang et al., 2014).
In summary, this paper proposes a research hypothesis: In China, the impact of GI on EQ follows an inverted “U” shape. There is a positive relationship up to a certain extent, but with the influence of various factors, this relationship may reverse.
4 Methodology and data
4.1 Environmental quality evaluation
4.1.1 Evaluation index system of environmental quality
Since the 21st century, global environmental pollution issues have become more prominent. Different regions choose various environmental indicators for EQ assessments based on their specific circumstances. For example, air quality index, carbon emission index, noise pollution index, etc. Some scholars integrate multiple environmental dimensions such as atmosphere, water, soil, ecology, and noise to establish a comprehensive evaluation index, thereby conducting a comprehensive assessment of regional EQ. According to the analysis of the impact paths of GI on regional EQ, it can be observed that currently, GI in China primarily focuses on industrial pollutant emissions, with minimal impact on residential pollution (Shi et al., 2023). In light of the mentioned characteristics, this paper draws extensively upon the contributions of scholars such as Miao in the research field (Miao et al., 2016). Ultimately, nine specific indicators were selected to establish a comprehensive EQ evaluation index from the critical dimensions of regional environmental carrying capacity and environmental governance level. The detailed interpretation of these indicators is presented in Table 1.
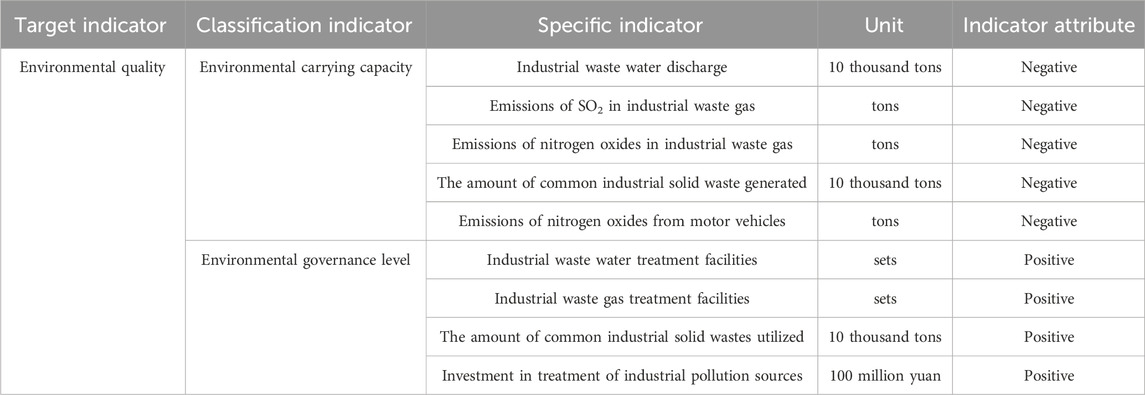
Table 1. Chinese EQ evaluation indicators.
4.1.2 Evaluation method for environmental quality
Evaluating regional EQ requires not only the establishment of an EQ evaluation index system but also the determination of weights for each indicator. In the academic realm, methods for determining indicator weights can be categorized into subjective and objective approaches. Subjective methods rely on personal judgment, such as expert scoring and the analytic hierarchy process (AHP). Objective methods, on the other hand, use data and mathematical models to determine weights, including the entropy method and principal component analysis. Objective weighting methods, relying on mathematical models and data analysis, are more scientific and objective, less susceptible to personal subjective views, and more flexible in dealing with complex issues and multi-criteria decision-making. Drawing on the research of scholars like Cheng, this paper applies the entropy method to further evaluate regional EQ (Cheng et al., 2023).
The entropy method is a mathematical approach used for multi-criteria decision analysis. It is primarily employed to determine the weights of each decision factor for a better understanding and evaluation of various alternative solutions. The steps in applying the entropy method include:
Step 1, data standardization processing. Standardize the data of each indicator in the EQ evaluation index. Ensure that the data for each indicator is within the same dimension and range of variation. The standardized processing formulas for positive and negative indicator data are shown in formula (1) and formula (2), respectively.
Step 2, calculate the entropy value. Calculate the entropy value of each indicator in the evaluation index system using the formula (3). Among them, p_ij is the proportion of the jth data under indicator i, and N is the number of samples in the dataset. The entropy value reflects the uncertainty and information content of the indicator, and the larger the value, the higher the information uncertainty.
Step 3, calculate the weights. Calculate the weight of the entropy value for each indicator, as shown in formula (4). Among them, k is the number of indicators.
Step 4, normalize weights. Normalize the calculated weights to ensure that the sum of weights for each indicator is 1.
4.2 Regression models construction
To test the hypothesis that the impact of GI on EQ in China follows an inverted “U” shape, this paper first introduces the quadratic term of the core explanatory variable to construct a nonlinear regression model. Secondly, borrowing from Hansen’s method, a threshold regression model based on GI for EQ is constructed (Yi and Xiao, 2018).
4.2.1 Variable selection and data interpretation
Through a comprehensive review of existing research results on factors influencing EQ, we found a diverse range of factors affecting regional EQ, including economic, population, industrial, technological, energy, and policy factors. Combining the commonalities in the development of EQ across Chinese provinces, we systematically selected six key influencing factors, as shown in Table 2.
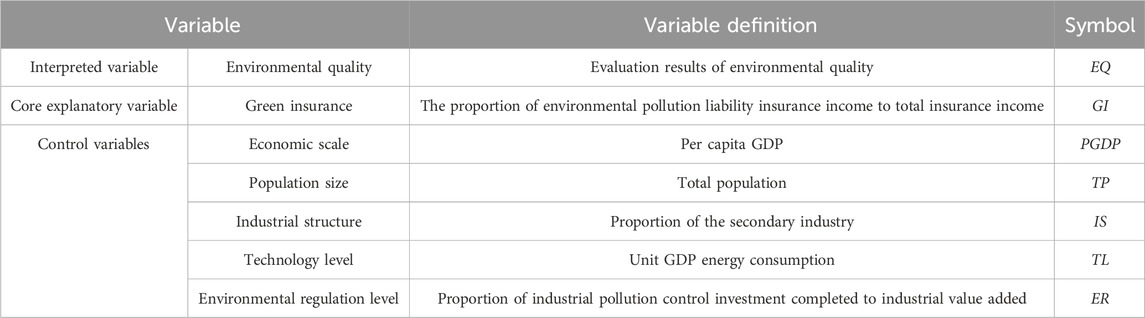
Table 2. Variable descriptions.
Interpreted variable: The EQ of various provinces in China is calculated based on the EQ evaluation index system constructed in the previous sections.
Core explanatory variable: The GI of various provinces in China is expressed by the proportion of environmental pollution liability insurance revenue to the total insurance revenue.
Control variables: (1) Selecting per capita GDP to reflect the regional economic development level. Regions with higher economic development levels may have more industrial activities and transportation, leading to increased emissions of pollutants such as exhaust gases and wastewater. Therefore, this indicator may decrease regional EQ (Lu et al., 2017). (2) Selecting total population to reflect the regional population level. Regions with large population concentrations may lead to higher levels of industrialization and urbanization, thereby increasing pollutant emissions. At the same time, the demand from a large population also drives more traffic and production activities, increasing pollutant emissions. Therefore, this indicator may decrease regional EQ (Li et al., 2019). (3) Selecting the proportion of the secondary industry to reflect regional industrial structure characteristics. The secondary industry, compared to the primary and tertiary industries, requires more production materials and may emit more pollutants. Therefore, this indicator may decrease regional EQ (Chen et al., 2021). (4) Selecting unit GDP energy consumption to reflect regional technological level. Advanced technological levels imply more efficient resource utilization, which can reduce fossil fuel consumption and even use clean energy. Therefore, this indicator may increase regional EQ (Mughal et al., 2022). (5) Selecting the proportion of investment in industrial pollution control to industrial value-added to reflect the level of environmental regulation. Reasonable environmental regulations can promote the upgrading of pollution control facilities by enterprises, reduce pollution emissions, and achieve improvement in regional EQ (Yang et al., 2018).
Considering the availability and completeness of the data, this paper selects relevant data from 30 provinces in China for the period 2000-2021 to investigate the relationship between GI and EQ. The dataset does not include data from the regions of Hong Kong, Macao, Taiwan, and Tibet. GI data is obtained from the annual “China Insurance Yearbook,” while other data is collected from the annual “China Statistical Yearbook,” “China Environmental Statistical Yearbook,” and provincial statistical yearbooks. It is important to note that, to prevent the influence of non-stationarity of macro data on empirical results, all variables have been log-transformed. For missing data, we used either the mean imputation method or the nearest neighbor interpolation method for supplementation.
4.2.2 Nonlinear regression model (NRM)
This article uses a quadratic regression model to test the hypothesis that the impact of GI on China’s EQ is an inverted “U” shape. The coefficients of the quadratic regression model bear an intuitive interpretation. The coefficient of the linear term variable signifies the slope of the linear relationship within the model, while the coefficient of the quadratic term variable reflects the concavity or convexity of the nonlinear relationship. This imparts a heightened level of intuitiveness and operability to the explication of the model outcomes. The underlying principle of the model unfolds as follows: when the coefficient of the quadratic term variable takes a negative value, the model manifests a inverted U-shaped form after the variable reaches a certain level. This configuration aligns with our conceptualization of an inverted U-shaped relationship, wherein the optimal EQ is attained when the GI level is moderate. Conversely, under excessively high or low GI levels, the EQ might experience a decline. A notably negative coefficient of the quadratic term variable indicates the presence of an inverted U-shaped relationship between GI and EQ.
To test the hypothesis that the impact of GI on EQ in China follows an inverted “U” shape, this paper introduces the quadratic term of GI (Haans et al., 2016). And introduce other variables that affect EQ, such as PGDP, TP, IS, TL, and ER. The complete nonlinear regression model for studying EQ is shown in Formula (5). In the Formula (5),
4.2.3 Threshold regression model (TRM)
To further test the hypothesis that the impact of GI on EQ in China follows an inverted “U” shape, this paper employs Hansen’s proposed threshold panel model to analyze the influence of GI on EQ at different development stages. This paper constructs a regional environmental quality threshold regression model using GI as a threshold variable. The final model is shown in Formulas (6) and (7) (Lv and Xu, 2023). The meanings of each character in formulas (6) and (7) are consistent with those in formula (1). In addition,
The threshold regression model consists of two components: one capturing the linear relationship below the threshold and the other above the threshold. Such a model structure enhances the flexibility to depict the nonlinear impact of GI on EQ. It allows for modeling variations in EQ near the threshold. The pivotal aspect of the threshold regression model lies in the examination of the threshold. Through hypothesis testing on the threshold, it can be determined whether there exists a threshold for the impact of GI on EQ. This aids in comprehending at what level of GI the impact on EQ is optimized. The threshold regression model furnishes explanations for both stages below and above the threshold, enabling researchers to gain a clearer understanding of the mechanism through which GI affects EQ. Such interpretability holds practical guidance for policy formulation and operational practices.
5 Results and discussions
5.1 Descriptive statistical analysis
The results of the descriptive statistical analysis are shown in Table 3. The extreme values of the seven variables are relatively small, mostly within two digits, and each variable has a small skewness and a large kurtosis. This indicates that the sample data distribution is relatively symmetrical, but with heavier tails. In addition, the p-values of the JB statistics are all less than 0.05, rejecting the null hypothesis. There is sufficient evidence to conclude that the seven variables do not follow a normal distribution.
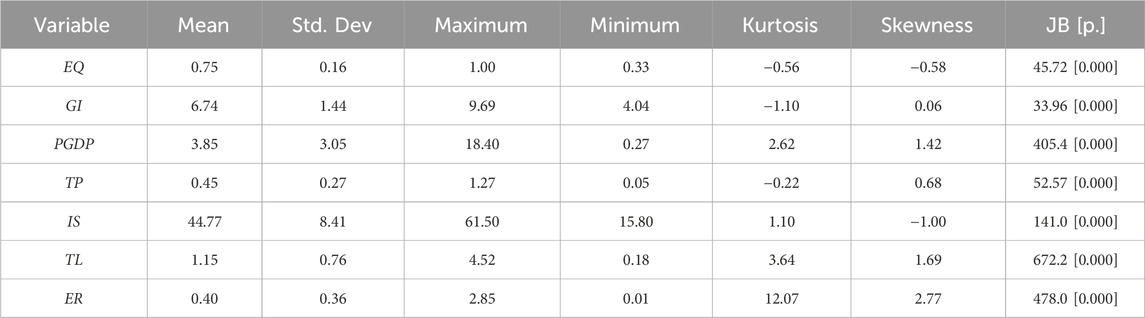
Table 3. Descriptive statistical analysis results.
5.2 Unit root test
Unit root testing is a crucial step in time series analysis and is used to detect whether time series data exhibits non-stationarity. Non-stationary time series data can lead to potential issues in many statistical methods and models, making unit root testing essential for the accuracy and reliability of subsequent analyses. This paper employs LLC test, ADF test, and IPS test to conduct unit root tests on the selected variables, as shown in Table 4. The test statistics of the three unit root testing methods are significantly larger than the critical values, leading to the acceptance of the alternative hypothesis that the sequence is stationary.
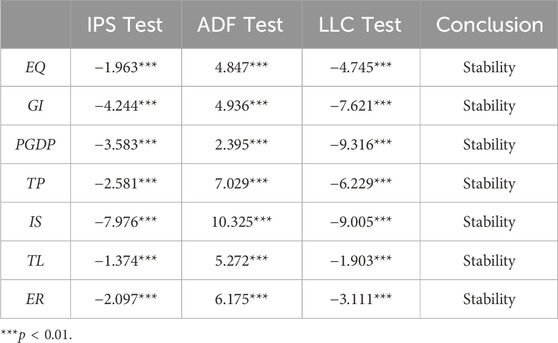
Table 4. Unit root test results.
5.3 Results and discussion of the nonlinear panel regression model
5.3.1 Results
In testing the hypothesis that the impact relationship between green insurance and environmental quality is an inverted “U” shape using a nonlinear panel regression model, it is necessary to determine whether to use a fixed effects model or a random effects model. These two models handle heterogeneity among individuals in panel data differently. Therefore, this paper employs the Hausman test method to test the fixed effects model against the random effects model. The results are shown in Table 5. The test results indicate a chi-square value of 57.98, with a corresponding probability value of 0.0000. Consequently, this research rejects the random effects regression model and tends to choose the fixed effects regression model.

Table 5. Hausman test results.
The results of the fixed effects regression model are shown in Table 6, with an R-squared equal to 0.893, indicating that the explanatory variables included in the model can effectively explain the variation in the dependent variable. The p-values corresponding to
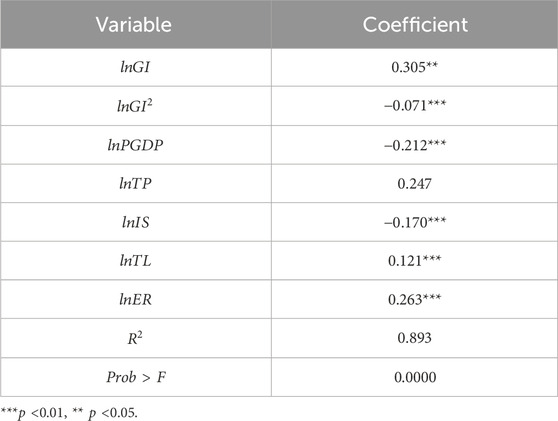
Table 6. Fixed effects regression results.
5.3.2 Discussion
The coefficient of
Further calculations reveal that when the value of GI equals 8.567, the relationship between GI and EQ begins to show a turning point. That is, when GI is greater than 8.567, EQ decreases with the increase of GI. Spatial-temporal difference analysis of 30 provinces in China conducted in this study found that in 2016, the level of GI in Jiangsu Province first exceeded 8.567, followed by Beijing, Shanghai, Zhejiang, and Yunnan provinces. Combining with the development history of GI in China, we found that since the implementation of GI policies, the level of GI in China has continuously increased, growing from 4.42 in 2000 to 9.08 in 2021. In the initial stage, the introduction of GI effectively reduced pollutant emissions, leading to an improvement in regional EQ. However, the blind promotion of GI development has also brought a series of environmental pollution issues, inhibiting the improvement of EQ. Taking Jiangsu as an example. The GI and EQ of Jiangsu Province in 2000 were 4.41 and 0.466, respectively. With the continuous development of GI, EQ continued to rise, reaching the highest value of 0.768 by 2016. Then, Jiangsu Province’s EQ declined continuously with the growth of GI. By 2021, Jiangsu Province’s GI had grown to 9.13, and EQ had reduced to 0.658.
Analyze the impact of each control variable on EQ in detail. (1) The impact coefficient of PGDP on EQ is −0.212, indicating a significant inhibitory effect of PGDP on EQ. Currently, China’s rapid economic growth relies predominantly on high-energy-consuming and pollution-intensive heavy industries and manufacturing. The development of these traditional industries often accompanies substantial energy consumption and environmental pollution emissions, leading to deteriorating EQ. Hence, the improvement of EQ in China exhibits a suppressing effect due to PGDP. Existing research outcomes on the influence of PGDP on Chinese EQ have yielded conflicting results. Some studies suggest a positive effect of PGDP on EQ, while others hold the opposite view. Song et al. found that, influenced by high-energy-consuming and high-emission industries, Chinese EQ declines with the growth of PGDP, consistent with the findings of this study (Song et al., 2020). However, Awan et al. focused on Shanghai and discovered that with economic development, an increase in per capita GDP leads people to be more inclined towards investing in environmental protection and improvement measures, thereby enhancing EQ (Awan and Azam, 2022). (2) The significant negative impact coefficient of IS indicates that for every increase of 1 unit in IS, EQ decreases by 0.17 units, demonstrating a notable inhibitory effect of IS on EQ. China’s secondary industry primarily comprises industries such as manufacturing and heavy manufacturing, which often exhibit high energy consumption and pollution characteristics. With the increasing proportion of the secondary industry, the development of industries such as manufacturing may lead to significant energy consumption and emissions of environmental pollutants, thereby exerting adverse effects on EQ. Yin and Song conducted an empirical analysis on the impact of industrial structure on regional EQ in China. The results consistently indicate a decline in regional EQ with the increase in the proportion of the secondary industry, aligning with the conclusions of this study (Song et al., 2022; Yin et al., 2024). (3) The significant positive impact coefficient of TL indicates that for every increase of 1 unit in TL, EQ increases by 0.121 units, demonstrating a noteworthy promoting effect of TL on EQ. In recent years, China has witnessed rapid development and widespread adoption of renewable and clean energy technologies, reducing reliance on traditional fossil fuels, and consequently lowering carbon emissions and other pollutants, thereby benefiting EQ. Furthermore, China’s advancements in production technology have continuously elevated resource utilization efficiency, reducing wastage and consumption of resources effectively. This has also led to a reduction in pollutant emissions during the production process, thereby alleviating environmental pressures. Villanthenkodath and Chishti respectively studied India and the BRICS economies, empirically analyzing the impact of technological levels on regional EQ. The results consistently demonstrate an improvement in regional EQ with the enhancement of technological levels, aligning with the conclusions of this study (Chishti and Sinha, 2022; Villanthenkodath and Mahalik, 2022). (4) The impact factor of ER is significantly positive. For every one-unit increase in ER, EQ increases by 0.263 units, indicating a significant promoting effect of ER on EQ. Environmental regulations in China enforce emission standards and restrictions on enterprises, compelling them to take measures to reduce pollutant emissions. This fosters enhanced clean production and technological innovation within enterprises and can also elevate public and corporate awareness of environmental protection, thereby driving improvements in EQ. Tang and Feng respectively focus on China and the Yangtze River Economic Belt as their study subjects, empirically analyzing the influence of environmental regulations on regional EQ. The results consistently demonstrate that regional EQ improves with the enhancement of environmental regulations, corroborating the findings of this study (Tang et al., 2020; Feng et al., 2023).
5.4 Results and discussion of the threshold regression model
5.4.1 Results
To further verify the inverted “U” relationship between Chinese GI and EQ, this paper examines the threshold variable
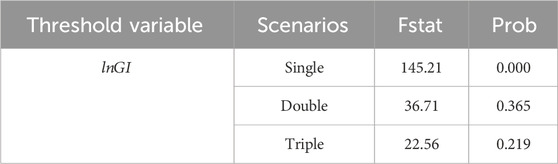
Table 7. Threshold test (bootstrap = 10,000 10,000 10,000).

Table 8. Threshold estimation results (level = 95).
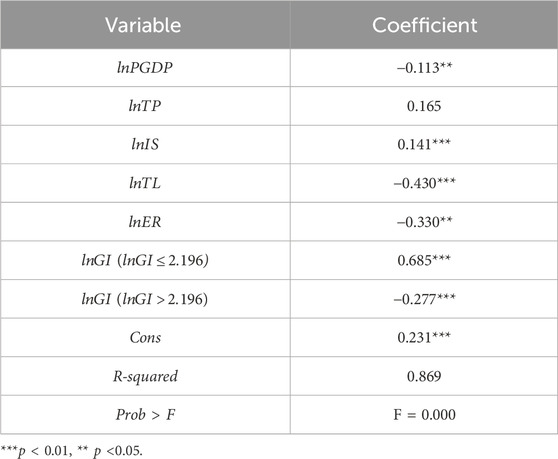
Table 9. Single threshold regression results.
5.4.2 Discussion
The results indicate that the threshold variable
5.5 Regional comparative analysis
The preceding analysis examined the impact of GI on China’s EQ at the aggregate sample level. However, there exist disparities among China’s 30 provinces in terms of EQ, levels of GI, and geographical location. For different types of provinces, the influence of GI on their EQ may vary. Hence, this study conducts a comparative analysis of Chinese provinces from three major perspectives: EQ level, GI level, and geographical location. The present study categorizes the 30 sample provinces of China based on their geographical locations into four regions: Eastern, Central, Western, and Northeastern regions. Additionally, provinces are divided into high and low GI levels and further categorized into high-pollution and low-pollution provinces based on their EQ levels. Empirical analyses are then conducted for each category, with the respective results presented in Tables 10, 11, and 12.
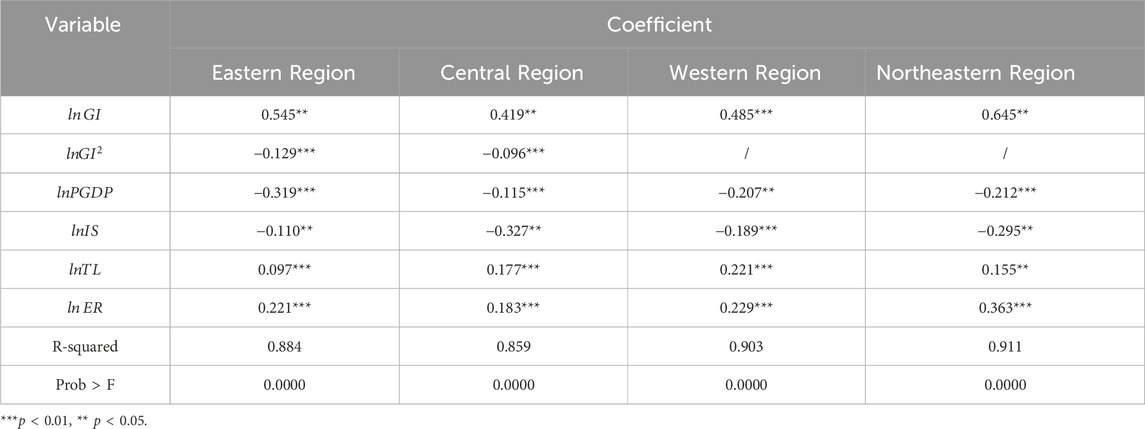
Table 10. Compare the regression results by sample based on geographical location.
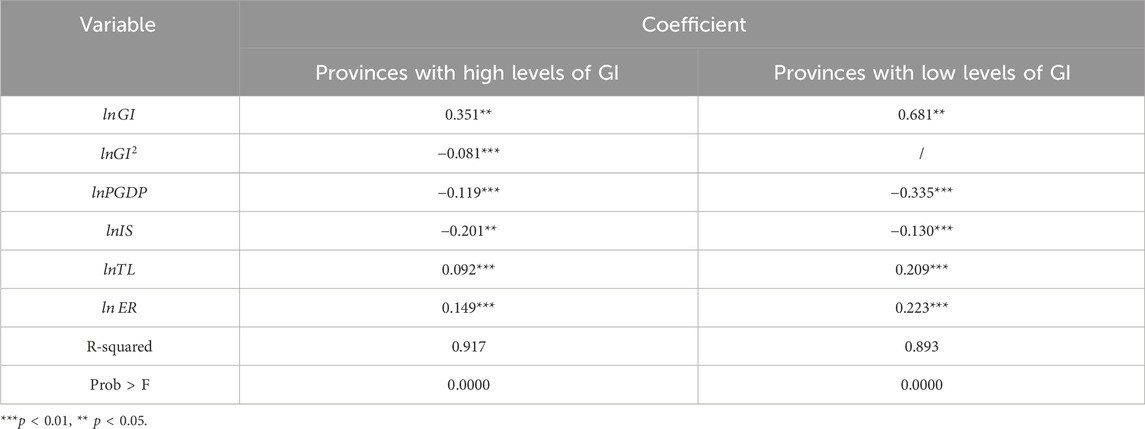
Table 11. Compare the regression results by sample based on levels of GI.
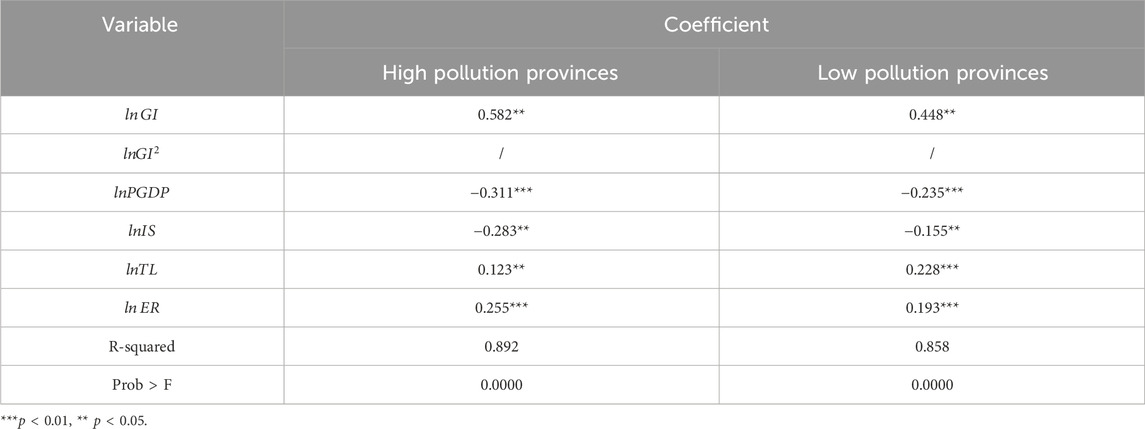
Table 12. Compare the regression results by sample based on levels of EQ.
Regression results for the comparison of samples based on geographical locations are shown in Table 10. GI exhibits significant impacts on the EQ of China’s Eastern, Northeastern, Central, and Western regions. Specifically, there is an inverted U-shaped relationship between GI and EQ in the Eastern and Central regions. Meanwhile, there exists a certain promoting effect on the EQ of the Northeastern and Western regions, with the promoting effect being more pronounced in the Northeastern region. The Eastern and Central regions of China boast developed economies and possess well-established financial systems and insurance markets, laying a solid foundation for the development of GI. Moreover, the rapid economic growth in these regions has brought about prominent environmental issues, compelling both the government and enterprises to prioritize environmental protection and consequently increasing the demand for GI. The market share of GI has undergone stages from initial development to saturation and then to oversupply. Therefore, there exists an inverted U-shaped relationship between GI and the improvement of EQ in the Eastern and Central regions of China. Conversely, the Northeastern and Western regions exhibit relatively weaker economic development, resulting in slow progress in regional GI development, which has yet to reach saturation. Consequently, the roles of GI, such as economic incentives and penalties, environmental responsibility tracking, and risk sharing, are more pronounced, thereby fostering improvements in regional EQ. The Northeastern region, in particular, has undergone industrial transformations, facing severe pollution issues from legacy industrialization. The significant demand from the government to enhance EQ in this region amplifies the promoting effect of GI, making it more pronounced in the Northeastern region.
The regression results for the comparison of samples based on levels of GI are presented in Table 11. GI exhibits an inverted U-shaped relationship with the improvement of EQ in provinces with high levels of GI, while it shows a promoting effect in provinces with low levels of GI. In provinces with high levels of GI, the market share of GI has undergone stages from initial development to saturation and then to oversupply, resulting in an inverted U-shaped impact on EQ improvement. Conversely, in provinces with low levels of GI, where the market share of GI has not yet reached saturation, the positive effects of GI, including economic incentives and penalties, technological upgrades, environmental responsibility tracking, and risk sharing, are significant.
The regression results for the comparison of samples based on EQ levels are depicted in Table 12. GI exhibits only a promoting effect on the improvement of EQ in both high-pollution and low-pollution provinces, without displaying an inverted U-shaped relationship. This can be attributed to several factors. Firstly, although high-pollution provinces demonstrate a strong demand for EQ improvement, some provinces with lower levels of economic development hinder the rapid growth of the GI industry. Consequently, the impact of GI on EQ improvement remains in the promoting stage. Secondly, low-pollution provinces, benefiting from relatively better EQ, do not urgently require the development of the GI industry. This results in sluggish regional development of the GI industry, maintaining its impact on EQ in the promoting stage.
5.6 Robustness test
Robustness tests ensure that model results remain reliable and effective when facing various potential anomalies, thereby enhancing the credibility and interpretability of the research. A review of relevant literature reveals that common methods for conducting robustness tests include: altering sample periods, substituting the dependent variable, introducing additional control variables, and changing the measurement methods of variables (Ferreira et al., 2017).
This study conducts robustness tests by changing the expression indicators of explanatory variables and the calculation methods of the dependent variable. The test results are presented in Table 13. Due to space limitations, the details of control variables are not elaborated in Table 13. A comparison between Table 6 and Table 13 reveals the following: (1) The study measures the level of GI development in various provinces of China using the proportion of regional environmental pollution liability insurance income to total premium income. The regional environmental pollution liability insurance income is used as the dependent variable during validation. After changing the expression indicators of explanatory variables, the coefficients of explanatory variables in Table 13 are largely consistent with those in Table 6. (2) EQ was initially measured using entropy methods in the previous sections, while principal component analysis is employed in this study. Despite this change in the measurement method of EQ, the robustness test results still indicate a quadratic relationship (inverted U-shaped) between GI and EQ. In summary, the robustness test results further confirm the strong reliability of the estimated results of the nonlinear panel regression model constructed in this study.
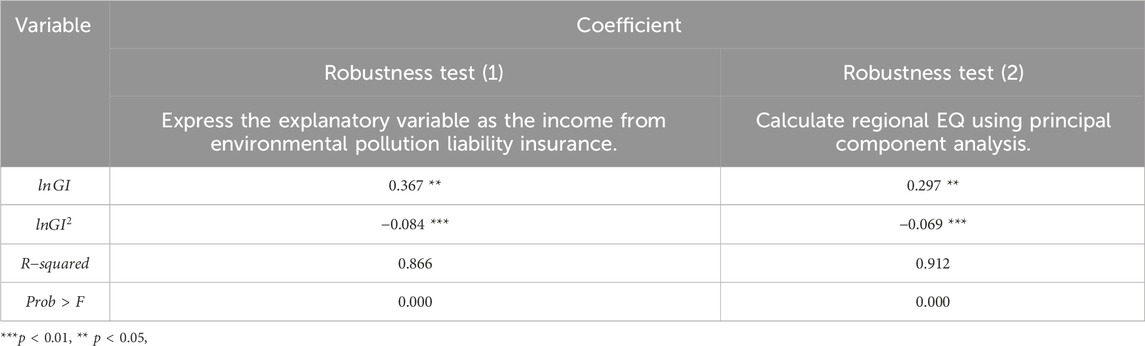
Table 13. Robustness test results.
6 Conclusions and suggestions
6.1 Conclusions
As an innovative product integrating environmental protection and the financial sector, GI provides a new avenue for enhancing EQ. Existing research outcomes predominantly focus on the linear relationship between GI and EQ or simplistic notions of positive and negative impacts. However, this study, through the identification of an inverted U-shaped relationship, broadens the research perspective on the influence of GI. The unveiling of such a nonlinear relationship offers a more profound and comprehensive understanding of GI research, enriching the discourse on the nuanced dynamics of its impact. This paper focuses on China and empirically analyzes the impact of GI on EQ. The results indicate: (1) The fixed-effects regression model demonstrates that the impact of GI on China’s EQ follows an inverted “U”-shaped pattern. (2) The results of the threshold regression model also support the inverted “U”-shaped relationship, with a threshold value of 2.196. (3) Economic level and industrial structure exert a significantly inhibitory effect on improving EQ, while technological level and environmental regulation have a significant promoting effect. Population size does not show a significant impact on improving EQ.
6.2 Policy implications
At present, the government promotes the development of GI through measures such as tax incentives, government procurement, and reward mechanisms, with a singular focus on maximizing the GI market. However, this study reveals that an excessively high level of the GI market exerts a suppressive effect on environmental improvement. Therefore, differentiated policies tailored to the characteristics of different stages of GI development are essential. In the initial stages, the government should prioritize incentivizing, guiding, and supporting the establishment of the market. Various multidimensional measures should be implemented to provide impetus and a foundation for the development of GI institutions, promoting their stable growth in the early market.
Firstly, the government can encourage and guide GI institutions to enter the market by offering economic incentives, tax benefits, special funds, and other incentivizing policies. Secondly, through regular discussions and seminars, the government can actively guide deep cooperation between GI institutions and the environmental protection industry, inspiring these institutions to better adapt to the needs of the environmental protection industry.
In the later stages of GI development, the government should focus on upgrading GI products, fostering collaborations, and managing market risks to ensure a more significant role for GI in the field of environmental protection and achieve a win-win situation between environmental protection and the economy. Firstly, the government should encourage continuous improvement in the technical content and adaptability of GI products. This can be achieved through reward mechanisms for technological innovation, support for intellectual property protection, and the provision of favorable conditions for the research and development of GI products. The government can establish dedicated technology innovation bases or laboratories, providing resources and collaboration platforms for institutions to drive continuous innovation in GI products, environmental monitoring technologies, and assessment methods, enhancing the quality and effectiveness of GI products. Secondly, the government should actively guide GI institutions to collaborate and co-build with environmental organizations, research institutions, and enterprises. Regular discussions and seminars can be employed to strengthen the exchange of professional knowledge. Environmental organizations and research institutions often possess the latest environmental technologies and scientific research results, while enterprises understand actual operational conditions. By leveraging resources from various parties, a forward-looking and innovative project can be created, constructing a closed-loop industry chain from environmental technology research and development to practical application in enterprises, and further to the design and promotion of GI. This comprehensive approach ensures all-encompassing environmental management from the source to the end. Finally, the government needs to strengthen market risk management for GI to ensure its healthy operation. This involves comprehensive monitoring of market monopolies, unfair competition, and the financial conditions of GI institutions. The government can enact and implement relevant regulations, establish regulatory bodies, or enhance the functions of existing regulatory bodies to effectively address potential risks and uncertainties. This is crucial for maintaining the overall safety of the GI market.
On the other hand, this study reveals significant inhibitory effects of economic level and industrial structure on the improvement of EQ in China, while technological level and environmental regulations demonstrate significant promoting effects. Consequently, we propose policy recommendations to promote the enhancement of EQ in China from four dimensions: economic level, industrial structure, technological level, and environmental regulations. (1) Economic Development: Establishing a green product certification system to certify products that meet environmental standards and assign them corresponding green labels would help consumers identify and choose green products, enhancing their confidence in purchasing them. Conducting extensive environmental propaganda and education campaigns through various channels such as media, the internet, and communities would raise awareness among residents about the importance and benefits of green consumption, thereby increasing public understanding and consciousness of green consumption. (2) Industrial Development: The government should formulate and implement targeted industrial policies to clarify development directions and key areas. Measures such as tax incentives, fiscal subsidies, and land policies should be adopted to encourage and support the upgrading of industrial structure. Encouraging the construction of green industrial clusters and parks and increasing investment in infrastructure construction in green industrial parks would facilitate the entry of upstream and downstream enterprises in the industrial chain, thereby forming a complete green industrial chain and value chain. (3) Technological Advancement: The government should establish a green technology innovation fund to increase investment in scientific and technological innovation, supporting R&D and innovation in green industries to enhance technological levels and product quality. Additionally, establishing and supporting green technology incubation platforms to provide services such as technology transfer, professional consultation, and market promotion would assist research institutions and enterprises in translating technological achievements into practical productivity. (4) Environmental Regulations: Enhancing the legal system for environmental laws and regulations and enacting stricter environmental protection laws and regulations are essential to ensure the legal guarantees for the development of green industries and create a fair competitive market environment. Establishing an environmental information disclosure system to promptly release environmental monitoring data and emission information of green industry enterprises to the public would increase public attention and participation in environmental issues.
6.3 Limitations
This study finds that the impact of GI on China’s EQ follows an inverted “U” shape. The control variables in the econometric model constructed in this study are determined based on existing research findings. Control variables were not directly determined without analyzing the factors influencing EQ. Additionally, our team’s research reveals that the impact of GI on EQ varies across countries with different EQ levels. Particularly for developed countries, GI’s impact on EQ may exhibit a dual-threshold effect. That is, GI might initially have a promoting effect on EQ, then transition to a suppressive effect, before ultimately reverting to a promoting effect.
Data availability statement
Publicly available datasets were analyzed in this study. This data can be found here: https://www.stats.gov.cn/sj/ndsj/.
Author contributions
XY: Conceptualization, Methodology, Writing–original draft. JW: Data curation, Formal Analysis, Methodology, Writing–review and editing. ZL: Investigation, Software, Validation, Writing–review and editing.
Funding
The author(s) declare that no financial support was received for the research, authorship, and/or publication of this article.
Conflict of interest
The authors declare that the research was conducted in the absence of any commercial or financial relationships that could be construed as a potential conflict of interest.
Publisher’s note
All claims expressed in this article are solely those of the authors and do not necessarily represent those of their affiliated organizations, or those of the publisher, the editors and the reviewers. Any product that may be evaluated in this article, or claim that may be made by its manufacturer, is not guaranteed or endorsed by the publisher.
References
Ahmed, N., Hamid, Z., Mahboob, F., Rehman, K. U., Ali, M. S. e., Senkus, P., et al. (2022). Causal linkage among agricultural insurance, air pollution, and agricultural green total factor productivity in United States: pairwise granger causality approach. Agriculture 12 (9), 1320. doi:10.3390/agriculture12091320
Awan, A. M., and Azam, M. (2022). Evaluating the impact of GDP per capita on environmental degradation for G-20 economies: does N-shaped environmental Kuznets curve exist? Environ. Dev. Sustain. 24 (9), 11103–11126. doi:10.1007/s10668-021-01899-8
Brogi, M., Cappiello, A., Lagasio, V., and Santoboni, F. (2022). Determinants of insurance companies' environmental, social, and governance awareness. Corp. Soc. Responsib. Environ. Manag. 29 (5), 1357–1369. doi:10.1002/csr.2274
Chen, L., Li, K., Chen, S., Wang, X., and Tang, L. (2021). Industrial activity, energy structure, and environmental pollution in China. Energy Econ. 104, 105633. doi:10.1016/j.eneco.2021.105633
Cheng, X., Zhang, M., Xu, J., and Tang, D. (2023). Research on the impact of sustainable urbanization on urban rural income disparity in China. Sustainability 15 (6), 5274. doi:10.3390/su15065274
Chishti, M. Z., and Sinha, A. (2022). Do the shocks in technological and financial innovation influence the environmental quality? Evidence from BRICS economies. Technol. Soc. 68, 101828. doi:10.1016/j.techsoc.2021.101828
Desalegn, G. (2023). Insuring a greener future: how green insurance drives investment in sustainable projects in developing countries? Green Finance 5 (2), 195–210. doi:10.3934/GF.2023008
Dhondt, S., Beckx, C., Degraeuwe, B., Lefebvre, W., Kochan, B., Bellemans, T., et al. (2012). Integration of population mobility in the evaluation of air quality measures on local and regional scales. Atmos. Environ. 59, 67–74. doi:10.1016/j.atmosenv.2012.04.055
Dimitroulopoulou, S., Dudzińska, M. R., Gunnarsen, L., Hägerhed, L., Maula, H., Singh, R., et al. (2023). Indoor air quality guidelines from across the world: an appraisal considering energy saving, health, productivity, and comfort. Environ. Int. 178, 108127. doi:10.1016/j.envint.2023.108127
Feng, Q., Teo, T. S. H., and Sun, T. (2023). Effects of official and unofficial environmental regulations on environmental quality: evidence from the Yangtze River Economic Belt, China. Environ. Res. 226, 115667. doi:10.1016/j.envres.2023.115667
Ferreira, S. L. C., Caires, A. O., Borges, T. S., Lima, A. M., Silva, L. O., and dos Santos, W. N. (2017). Robustness evaluation in analytical methods optimized using experimental designs. Microchem. J. 131, 163–169. doi:10.1016/j.microc.2016.12.004
Gillingham, K., and Stock, J. H. (2018). The cost of reducing greenhouse gas emissions. J. Econ. Perspect. 32 (4), 53–72. doi:10.1257/jep.32.4.53
Haans, R. F. J., Pieters, C., and He, Z. L. (2016). Thinking about U: theorizing and testing U-and inverted U-shaped relationships in strategy research. Strategic Manag. J. 37 (7), 1177–1195. doi:10.1002/smj.2399
Hou, D., and Wang, X. (2022). Inhibition or promotion? the effect of agricultural insurance on agricultural green development. Front. Public Health 10, 910534. doi:10.3389/fpubh.2022.910534
Hu, Y., Du, S., Wang, Y., and Yang, X. (2023). How does green insurance affect green innovation? Evidence from China. Sustainability 15 (16), 12194. doi:10.3390/su151612194
Lee, W. Y., and Fung, D. W. H. (2023). Current deficiencies and reinforcement of institutional pillars for reform in the green insurance market: a systematic review. Eur. J. Sustain. Dev. Res. 7 (4), em0235. doi:10.29333/ejosdr/13634
Li, J., Li, F., and Li, J. (2022). Does new-type urbanization help reduce haze pollution damage? Evidence from China’s county-level panel data. Environ. Sci. Pollut. Res. 29 (31), 47123–47136. doi:10.1007/s11356-022-19272-1
Li, K., Fang, L., and He, L. (2019). How population and energy price affect China's environmental pollution? Energy policy 129, 386–396. doi:10.1016/j.enpol.2019.02.020
Liang, L., Wang, Z., and Li, J. (2019). The effect of urbanization on environmental pollution in rapidly developing urban agglomerations. J. Clean. Prod. 237, 117649. doi:10.1016/j.jclepro.2019.117649
Lu, N., Wu, J., and Liu, Z. (2022). How does green finance reform affect enterprise green technology innovation? Evidence from China. Sustainability 14 (16), 9865. doi:10.3390/su14169865
Lu, Z. N., Chen, H., Hao, Y., Wang, J., Song, X., and Mok, T. M. (2017). The dynamic relationship between environmental pollution, economic development and public health: evidence from China. J. Clean. Prod. 166, 134–147. doi:10.1016/j.jclepro.2017.08.010
Lv, Z., and Xu, T. (2023). Tourism and environmental performance: new evidence using a threshold regression analysis. Tour. Econ. 29 (1), 194–209. doi:10.1177/13548166211042450
Miao, C., Sun, L., and Yang, L. (2016). The studies of ecological environmental quality assessment in Anhui Province based on ecological footprint. Ecol. Indic. 60, 879–883. doi:10.1016/j.ecolind.2015.08.040
Mills, E. (2003). The insurance and risk management industries: new players in the delivery of energy-efficient and renewable energy products and services. Energy policy 31 (12), 1257–1272. doi:10.1016/S0301-4215(02)00186-6
Mills, E. (2009). A global review of insurance industry responses to climate change. Geneva Pap. Risk Insurance-Issues Pract. 34, 323–359. doi:10.1057/gpp.2009.14
Montag, J. (2015). The simple economics of motor vehicle pollution: a case for fuel tax. Energy Policy 85, 138–149. doi:10.1016/j.enpol.2015.05.020
Mughal, N., Arif, A., Jain, V., Chupradit, S., Shabbir, M. S., Ramos-Meza, C. S., et al. (2022). The role of technological innovation in environmental pollution, energy consumption and sustainable economic growth: evidence from South Asian economies. Energy Strategy Rev. 39, 100745. doi:10.1016/j.esr.2021.100745
Ning, J., Yuan, Z., Shi, F., et al. (2023). Environmental pollution liability insurance and green innovation of enterprises: incentive tools or self-interest means? Front. Environ. Sci. 11, 1077128. doi:10.3389/fenvs.2023.1077128
Rahmatiar, Y. (2018). The role of environmental insurance as the prevention effort of environmental pollution. J. Arts Humanit. 7 (5), 46–53. doi:10.18533/journal.v7i5.1392
Rizwanullah, M., Nasrullah, M., and Liang, L. (2022). On the asymmetric effects of insurance sector development on environmental quality: challenges and policy options for BRICS economies. Environ. Sci. Pollut. Res. 29, 10802–10811. doi:10.1007/s11356-021-16364-2
Shi, B., Jiang, L., Bao, R., Zhang, Z., and Kang, Y. (2023). The impact of insurance on pollution emissions: evidence from China's environmental pollution liability insurance. Econ. Model. 121, 106229. doi:10.1016/j.econmod.2023.106229
Song, M., Tao, W., and Shen, Z. (2022). Improving high-quality development with environmental regulation and industrial structure in China. J. Clean. Prod. 366, 132997. doi:10.1016/j.jclepro.2022.132997
Song, W., Wang, C., Chen, W., Zhang, X., Li, H., and Li, J. (2020). Unlocking the spatial heterogeneous relationship between per capita GDP and nearby air quality using bivariate local indicator of spatial association. Resour. Conservation Recycl. 160, 104880. doi:10.1016/j.resconrec.2020.104880
Tang, L., Li, K., and Jia, P. (2020). Impact of environmental regulations on environmental quality and public health in China: empirical analysis with panel data approach. Sustainability 12 (2), 623. doi:10.3390/su12020623
Villanthenkodath, M. A., and Mahalik, M. K. (2022). Technological innovation and environmental quality nexus in India: does inward remittance matter? J. Public Aff. 22 (1), e2291. doi:10.1002/pa.2291
Wang, J., Guo, Q., Wang, F., Aviso, K. B., Tan, R. R., and Jia, X. (2021). System dynamics simulation for park-wide environmental pollution liability insurance. Resour. Conservation Recycl. 170, 105578. doi:10.1016/j.resconrec.2021.105578
Wang, P., Xing, L. N., and Li, F. (2014). Exploration of the governmental responsibility in environmental pollution liability insurance. Adv. Mater. Res. 962, 2040–2045.
Wang, Q., Ge, Y., and Li, R. (2023a). Does improving economic efficiency reduce ecological footprint? The role of financial development, renewable energy, and industrialization. Energy and Environ., 0958305X231183914. doi:10.1177/0958305X231183914
Wang, Q., Ren, F., and Li, R. Exploring the impact of geopolitics on the environmental Kuznets curve research. Sustain. Dev., 2023b. doi:10.1002/sd.2743
Wang, Q., Sun, T., and Li, R. (2024). Does artificial intelligence promote green innovation? An assessment based on direct, indirect, spillover, and heterogeneity effects. Energy and Environ., 0958305X231220520. doi:10.1177/0958305X231220520
Wang, Q., Wang, L., and Li, R. (2023c). Trade openness helps move towards carbon neutrality—insight from 114 countries. Sustain. Dev. doi:10.1002/sd.2720
Wen, H., Cui, T., Wu, X., and Nie, P. y. (2024). Environmental insurance and green productivity: a firm-level evidence from China. J. Clean. Prod. 435, 140482. doi:10.1016/j.jclepro.2023.140482
Yang, J., Guo, H., Liu, B., Shi, R., Zhang, B., and Ye, W. (2018). Environmental regulation and the pollution haven hypothesis: do environmental regulation measures matter? J. Clean. Prod. 202, 993–1000. doi:10.1016/j.jclepro.2018.08.144
Yang, R., and Zhang, R. (2022). Environmental pollution liability insurance and corporate performance: evidence from China in the perspective of green development. Int. J. Environ. Res. Public Health 19 (19), 12089. doi:10.3390/ijerph191912089
Yi, S., and Xiao, A. (2018). Application of threshold regression analysis to study the impact of regional technological innovation level on sustainable development. Renew. Sustain. Energy Rev. 89, 27–32. doi:10.1016/j.rser.2018.03.005
Yin, K., Miao, Y., and Huang, C. (2024). Environmental regulation, technological innovation, and industrial structure upgrading. Energy and Environ. 35 (1), 207–227. doi:10.1177/0958305X221125645
Keywords: green insurance (GI), environmental quality (EQ), an inverted “U” shape, threshold regression model, China
Citation: You X, Wu J and Li Z (2024) Research on the impact of green insurance on regional environmental quality: evidence from China. Front. Environ. Sci. 12:1364288. doi: 10.3389/fenvs.2024.1364288
Received: 02 January 2024; Accepted: 25 April 2024;
Published: 13 May 2024.
Edited by:
Wei Zhang, China University of Geosciences Wuhan, ChinaCopyright © 2024 You, Wu and Li. This is an open-access article distributed under the terms of the Creative Commons Attribution License (CC BY). The use, distribution or reproduction in other forums is permitted, provided the original author(s) and the copyright owner(s) are credited and that the original publication in this journal is cited, in accordance with accepted academic practice. No use, distribution or reproduction is permitted which does not comply with these terms.
*Correspondence: Jiaxin Wu, OTEyMDIyMTA3N0BudWZlLmVkdS5jbg==