 Yunliang Lei
- Department of Government, London School of Economics and Political Science, London, United Kingdom
Introduction: This research focuses on exploring the impact of Big Data Development (BDD) on Urban Ecological Governance Performance (EGP), with a particular emphasis on environmental dimensions within and among various regions. It aims to understand the complex interplay between technological advancements, urbanization, and environmental management in the context of urban ecological governance.
Methods: Employing the Spatial Durbin Model (SDM), the study rigorously investigates the effects of BDD on EGP. It also examines the mediating role of Industrial Structure Level (ISL) and the moderating effects of both Level of Technological Investment (LTI) and Urbanization Level (URB), to provide a comprehensive analysis of the factors influencing urban ecological governance.
Results: The findings reveal that big data significantly strengthens urban ecological governance, characterized by pronounced spatial spillover effects, indicating interregional interdependence in environmental management. Urbanization level notably amplifies the influence of BDD on EGP, whereas the magnitude of technological investments does not show a similar effect. Moreover, the industrial structure acts as a partial mediator in the relationship between BDD and EGP, with this mediating role demonstrating variability across different regions.
Discussion: The research highlights the critical role of big data in enhancing urban ecological governance, particularly in terms of environmental aspects. It underscores the importance of technological advancements and urbanization in augmenting the effectiveness of ecological governance. The variability of the mediating role of industrial structure across regions suggests the need for tailored strategies in implementing big data initiatives for environmental management.
1 Introduction
The advent of the big data era marks a significant shift in information technology and data analysis. Professionals spanning a diverse range of disciplines, including computer science, physics, economics, mathematics, political science, bioinformatics, sociology, and others, are increasingly seeking access to the vast troves of information generated about people, objects, and their interactions (Boyd and Crawford, 2012) (Burgess, 2020). Recently, the rapid evolution of big data has garnered considerable attention and prompted widespread scholarly discussion, underlining its significance in research. Despite its widespread usage, accurately defining the term ‘big data’ continues to be a challenge (Laney, 2001; Manyika et al., 2011; Franks, 2012). The National Institute of Standards and Technology (NIST) (Executive Office of the President, 2014) in the United States succinctly describes the characteristics of big data using three “V”s: “Volume” (enormous size), “Velocity” (rapid access and analysis), and “Variety” (diversity in data types and sources). In addition to these attributes, certain scholars assert that big data also encompasses an additional characteristic: complexity (Desouza et al., 2017). Hirsch (2013) draws a parallel between the significance of big data and the discovery of oil, envisaging it as an essential catalyst in the evolution of future smart cities (Iqbal et al., 2020). Owing to its vast volume and extensive variety, big data has forged links with an ever-growing array of fields. This is evidenced by its applications in various sectors, such as transportation (Hashem et al., 2016), healthcare (Murdoch and Detsky, 2013), and ecological environmental governance (Bakker and Ritts, 2018; Sarker et al., 2020). Yang et al. (2020) propose that the integration of big data application with regulatory oversight can culminate in effective environmental governance. Etzion and Aragon-Correa (2016) argue that the onset of the digital era has the potential to enhance efficiency and decrease energy consumption, thus amplifying the effectiveness of environmental governance.
Since the latter half of the 20th century, there has been unprecedented urban expansion globally, particularly in developing countries (Cui and Shi, 2012), giving rise to challenges including environmental degradation, congestion, and social and economic exclusion (European Commission, 2010). Furthermore, the pervasive use of fossil fuels post-Industrial Revolution has led to substantial environmental pollution, posing a concern of international proportions (Wu et al., 2022). In response to this challenge, numerous scholars have investigated various factors influencing environmental governance performance from diverse angles. Xu and Lin (2018) argue that variations in research and development personnel, along with funding, significantly affect PM2.5 environmental governance outcomes. Concurrently, a growing consensus acknowledges that the improved resource allocation and efficiency enhancements enabled by big data significantly contribute to sustainable development (Etzion and Aragon-Correa, 2016). Shapiro and Walker (2018) discovered in their study conducted in the United States that enhancements in air quality and environmental governance are attributable to the implementation of pertinent policies and regulations, optimization of industrial structures, and increased production efficiency. Additionally, certain researchers have extensively explored the interplay between directed technological change and the outcomes of environmental governance (Grimaud et al., 2011; Aghion et al., 2016).
A robust ecological environment forms the cornerstone of China’s commitment to sustainable development (Central Committee of the Communist Party of China State Council, 2018), necessitating the collective enhancement of ecological governance performance across various regions to achieve this objective. Scholars have utilized spatial econometric models to investigate the spatial spillover effects of agricultural ecological governance in China (Wu et al., 2022), providing valuable insights. Furthermore, the application of the Spatial Durbin Model has been pivotal in deciphering the intricate relationship between environmental regulation and Green Total Factor Energy Efficiency (GTFEE) (Wu et al., 2020). In the contemporary era of accelerated big data development, this subject maintains its critical relevance in the context of regional development. This rapid development poses a significant challenge for governments: balancing the protection of citizens from potential big data risks while simultaneously enhancing governmental efficiency (Kuziemski and Misuraca, 2020). In this context, an intriguing question arises: To what extent does the level of big data development in a region exert a spatially driven influence on its ecological governance? Specifically, it prompts the inquiry whether the extent of big data development in various regions enhances internal ecological governance performance or induces spillover effects on ecological governance across disparate regions. Moreover, it is crucial to examine how technological investments and the level of urbanization by local governments influence ecological governance outcomes, with a potential for spatial spillover effects.
The organization of this paper is outlined as follows: The second section, the Literature Review, methodically examines the concepts and existing research pertaining to urban ecological governance performance and the level of big data development. The third section constructs a theoretical framework and formulates research hypotheses, grounded in existing theories and empirical studies. The fourth section elaborates on the selection criteria and construction standards for the indicators employed in this study, alongside the development of the spatial econometric model. The fifth section delves into the analysis of the test results obtained from the spatial econometric model, scrutinizing the validity of the formulated hypotheses. The sixth section provides a discussion and comprehensive summary of the research findings. Finally, the seventh section articulates the theoretical and practical contributions of this study, delineating its limitations and proposing avenues for future research.
2 Literature review
Urban Ecological Governance Performance: The latter half of the 20th century has witnessed unprecedented urban growth globally, particularly in developing countries (Cui and Shi, 2012), leading to pressing challenges like environmental degradation, congestion, and social and economic exclusion (European Commission, 2010). Urban development necessitates an approach oriented towards ecological governance (Gao and Sun, 2022), wherein diminishing the reliance on fossil fuels in energy consumption is pivotal in tackling climate change (Greaker and Pade, 2009). The efficacy of urban ecological governance is measured by its ability to yield economic and social benefits through efficient natural resource utilization, effective labor and capital allocation, and the fostering of technological innovation. Within this framework, Shiell and Lyssenko (2014) propose that the adoption of a carbon tax or a tradable permit system could positively impact climate change mitigation by incentivizing energy-related technological research and development. Furthermore, the amalgamation of big data with environmental governance has been instrumental in catalyzing technological transformations in energy consumption and environmental quality (Acemoglu et al., 2012). The field of environmental economics highlights the impact of monopoly periods on environmental patents or technological innovations in the formation of environmental and innovation policies (Greaker and Pade, 2009; Gerlagh et al., 2014). Scholars have delved deeper into understanding how modifications in industrial structures influence the outcomes of environmental governance (Zhao et al., 2022). In efforts to improve urban environmental management, researchers have combined remote sensing and census data to develop biophysical indicators for evaluating environmental conditions across diverse urban communities (Musse et al., 2018). Moreover, China views the maintenance of a robust ecological environment as a foundational necessity for sustainable development (Central Committee of the Communist Party of China State Council, 2018). In this context, spatial econometric models have been utilized to conduct comprehensive studies on the spatial spillover effects of agricultural ecological governance in China (Wu et al., 2022). This emphasizes the inherent complexity and interactivity of ecological governance, contributing to a more holistic understanding of urban ecological governance. Through a thorough examination of seminal studies on big data applications in areas such as urban environmental monitoring, intelligent transportation, disaster management systems, and assisted living, a more comprehensive understanding unfolds of how big data effectively addresses ecological challenges in urban development and significantly contributes to ecological governance (Ang and Seng, 2016).
Big Data Development Level: Despite the widespread usage of the term ‘big data,’ its precise definition continues to be somewhat nebulous and subject to various interpretations (Laney, 2001; Manyika et al., 2011; Franks, 2012). The National Institute of Standards and Technology (NIST) in the United States delineates big data with three defining characteristics: ‘Volume’ (enormous scale), ‘Velocity’ (swift access and analysis), and ‘Variety’ (extensive range of data types and sources) (Executive Office of the President, 2014). The exponential growth of big data technology, expanding nearly tenfold every 5 years (Hendrickson, 2010), has catalyzed its application across a wide spectrum of fields, including environmental governance (Zhang et al., 2017; Zhang et al., 2018), government administration (Stoianov et al., 2015), healthcare systems (Kankanhalli et al., 2016), and retail (Schmarzo, 2013). Furthermore, the burgeoning potential of big data applications has prompted numerous countries to prioritize its development, as evidenced by initiatives like the United States’ $200 million investment in big data research and development in 2012 (NSF, 2012) and Japan’s strategic emphasis on big data technology (Li, 2015). Manyika et al. (2011) contend that big data endows the public sector with a potent suite of strategies and techniques, enhancing productivity, and fostering greater efficiency and effectiveness. Oussous et al. (2018) delineate key applications of big data across various domains, including national power consumption, E-health, the Internet of Things (IoT), public utilities, transportation, logistics, political services, and government monitoring. Overall, the development level of local big data can be gauged by factors including the level of infrastructure construction and the breadth of application. However, the development of big data is accompanied by challenges such as complexities in data management, data cleaning, aggregation, imbalances in system capabilities, issues in categorizing big data sets, and technical hurdles in data analysis (Oussous et al., 2018), all intricately linked to the diversity, speed, and volume of data (Khan et al., 2014). Furthermore, scholars have expressed concerns regarding security and privacy challenges associated with the growth of big data (Greenwald, 2013; Greenwald and MacAskill, 2013), warning that it might intensify existing inequalities, such as racial discrimination (Polonetsky and Tene, 2013). Giest and Samuels (2020) emphasize the detrimental effects of data gaps, noting their impact on the economic opportunities of marginalized groups, social mobility, and levels of democratic participation, potentially giving rise to new forms of inequality. Moreover, the implementation of data-sharing initiatives often encounters obstacles due to policy and legal constraints (Desouza, 2014).
Contemporary academic research on big data and ecological environmental governance is expansive, with numerous scholars emphasizing an urban development model that is intricately guided by ecological governance principles and big data insights. As delineated by the ‘Muddling Through’ theory (Lindblom, 2010), confronting complex environmental pollution challenges, scholars and policymakers frequently adopt incremental strategies over comprehensive, one-off solutions due to the limitations imposed by bounded rationality. Historically, initiatives to mitigate climate change have predominantly focused on curbing the consumption and utilization of fossil fuels. Viewed through the lens of environmental economics, policy instruments like carbon taxes are considered to exert a positive influence on ecological governance. Additionally, the potential role of big data in enhancing ecological environmental governance has been a focal point of scholarly investigation. The academic community acknowledges that big data paves new pathways for formulating environmental and innovation policies, and catalyzing technological breakthroughs. Nonetheless, the existing literature remains relatively sparse in empirical studies that specifically focus on the application of big data in urban ecological governance performance. Research that delves into the reciprocal impacts among regions, especially those incorporating spatial spillover effects, is notably lacking. Consequently, this paper endeavors to integrate spatial spillover effects with an analysis of how the development level of big data influences the efficacy of urban ecological environmental governance. This methodology is designed to offer fresh perspectives and innovative approaches in the realm of urban ecological governance research.
3 Theoretical model and research hypotheses
This study builds on theoretical foundations that clarify the relationships among several key elements: the level of big data development, technological investment, urbanization, industrial structure, and urban ecological governance performance. It introduces a comprehensive theoretical model (see Figure 1) that illustrates the interplay among these elements. Within this model, the application of big data is hypothesized to augment resource allocation efficiency and strengthen environmental monitoring initiatives, thus directly contributing to the enhancement of urban ecological governance performance. Furthermore, big data enables government entities to precisely pinpoint market demands and developmental trends, leveraging a vast spectrum of information resources. This capability fosters shifts in industrial structures, subsequently influencing the outcomes of ecological governance. The progression of big data technology is also perceived to interact with the intensity of technological investment and the level of urbanization, thereby influencing government decision-making in areas such as funding allocations and policy development. These interactions play a crucial role in determining the overall effectiveness of governance strategies.
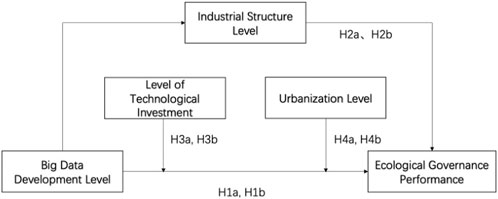
FIGURE 1. Theoretical model of research hypotheses.
3.1 The impact of big data development level on urban ecological governance performance
According to Technological Determinism theory, technological advancements are pivotal in shaping social and economic structures, playing a fundamental role in driving societal evolution (Morley and Robins, 1995). Consistent with this perspective, Yang et al. (2020) assert that the integration of big data applications within regulatory frameworks can significantly enhance environmental governance. Specifically, big data technology can be utilized to develop urban environmental monitoring systems, facilitating the prompt identification of environmental issues and provision of early warnings. Furthermore, the expansion of big data endows urban managers with an enhanced precision in understanding environmental challenges and natural resource utilization, thereby paving the way for the development of more effective ecological governance strategies. In addition, big data facilitates increased public participation in urban ecological governance, thereby enhancing the rationality and scientific underpinning of decision-making processes. The development of big data is anticipated to substantially support urban ecological governance across various sectors, influenced by a myriad of interconnected factors. Considering that scholars have identified spatial spillover effects in the fields of environment (Wu et al., 2020), agriculture (Wu et al., 2022), and healthcare (Song et al., 2019) across various regions, it is reasonable to hypothesize that similar spillover effects could exist between the level of big data development and urban ecological governance performance. Consequently, we propose the following hypothesis:
H1a. The level of big data development in cities significantly impacts the improvement of urban ecological governance performance.
H1b. The level of big data development in cities exerts a significant spatial spillover effect on urban ecological governance performance.
3.2 The mediating mechanism of industrial structure level
Achieving a balance between sustainable economic development and effective environmental protection represents a critical and challenging task (Daly, 1977). Industrial restructuring not only creates market opportunities, fostering economic development (Schumpeter, 1959), but also plays a vital role in reducing pollution levels (Cheng et al., 2018). Within this framework, establishing a sustainable system for resource utilization and environmental conservation that simultaneously balances economic growth is of utmost importance. The widespread application of big data across diverse fields (Oussous et al., 2018) showcases its potential to scientifically guide the adjustment and development of urban industrial structures. The beneficial impacts of big data are evident in sectors including environmental governance (Zhang et al., 2017; Zhang et al., 2018), government administration (Stoianov et al., 2015), healthcare systems (Kankanhalli et al., 2016), and retail (Schmarzo, 2013). Through the analysis of relevant data, governments can pinpoint industries that utilize resources efficiently and identify those that contribute significantly to environmental degradation. This analysis aids in the optimization of industrial structures, consequently reducing ecological and environmental pressures on urban areas and steering them towards an environmentally sustainable development trajectory. This approach supports cities in enhancing ecological governance outcomes while simultaneously fostering economic growth. Therefore, we propose the following hypotheses:
H2a. The level of industrial structure development mediates the relationship between the level of big data development and urban ecological governance performance.
H2b. The level of industrial structure development not only mediates the relationship between the level of big data development and urban ecological governance performance but also encompasses a spatial spillover effect.
3.3 The moderating mechanism of technological investment level and urbanization level
The intensity of technological investment exerts a pivotal moderating influence on the evolution of Urban Ecological Governance Performance, and its impacts can potentially yield negative effects. Recent research has highlighted that, although governmental investment in technology is instrumental in advancing high-quality regional development (Jin and Yang, 2022), driving corporate digital transformation (Feng et al., 2022), and supporting the construction of smart cities (Zeng et al., 2023), it can also result in disparate resource allocation and diminished investment efficiency. Additionally, augmented technological investment by certain regional governments could potentially intensify disparities among localities, consequently expanding the divergence in ecological governance performance across regions. Therefore, we propose the following hypotheses:
H3a. The level of government technology investment can serve as a moderating factor in the relationship between urban big data development and urban ecological governance performance.
H3b. The level of government technology investment not only acts as a moderator in the nexus between urban big data development and urban ecological governance performance but also encompasses spatial spillover effects.
In the developmental trajectory of urban areas, cities often evolve into a series of concentric circles, indicative of dynamic population shifts and urban expansion within these zones (Burgess, 2020). With the escalation of urbanization and intensification of population concentration, there is a concomitant increase in the demand for big data applications in these urban environments. Examples like intelligent transportation systems and environmental monitoring systems highlight the role of big data in facilitating green governance in urban areas, thereby amplifying its importance in ecological governance. Additionally, the progression of urbanization not only boosts the demand for big data applications but also correlates with an increased awareness and willingness among residents to participate in ecological protection initiatives. Fundamentally, the progression of urbanization, along with escalating investments in big data applications and an increasing environmental consciousness among citizens, cultivates a synergistic interplay among these facets. This synergy exerts a positive influence on the outcomes of urban ecological governance, highlighting the intricate interdependencies inherent in these urban dynamics. Therefore, we propose the following hypotheses:
H4a. The level of urbanization development can act as a moderating factor in the relationship between urban big data development and urban ecological governance performance.
H4b. The level of urbanization development not only serves as a moderator in the nexus between urban big data development and urban ecological governance performance but also includes spatial spillover effects.
4 Materials and methods
4.1 Selection and measurement of indicators
(1) Dependent Variable: Urban Ecological Governance Performance (EGP). Urban ecological governance performance can be understood as achieving significant economic and social benefits through rational use of natural resources, effective labor and capital input, and promoting technological innovation. Combining related prior academic research (Dong et al., 2008; Xiao and Xiao, 2022) and the goals of China’s construction of an ecological civilization (Central Committee of the Communist Party of China State Council, 2015), we have developed a measurement system for urban ecological governance performance. For ecological governance input, this paper selects indicators from four aspects: resource consumption, labor, capital, and technology. As for the output of ecological governance, indicators are chosen mainly from three aspects: economic, social, and ecological environmental benefits. Given that per capita urban GDP and fiscal revenue can measure a region’s level of economic development, they are used to represent economic benefits. For social and ecological environmental benefits, considering their inherent ambiguity and difficulty to be depicted by a single indicator, this paper chooses indicators from four aspects: living environment, quality of life, resource utilization, and pollution control capacity. Additionally, natural environmental pollution in the socio-economic development of cities is considered as an undesired output. Specific indicators and their calculation are detailed in Table 1.
(2) Explanatory Variable: Big Data Development Level (BDD). This study adopts the measurement methods of Berner et al. (2014), Yoo and Choi (2015), Zhang et al. (2023), using network readiness (infrastructure construction), information and communication technology application index, and big data application benefit index as the primary indicators to measure the level of big data development. Based on these, each primary indicator is further divided into secondary indicators, including fixed (mobile) telephone penetration rate, number of internet domain names, energy-saving and consumption-reducing index, etc. The calculated indicators are then combined using the entropy weight method to form a comprehensive index of big data development level. Specific details of the indicator calculations are provided in Table 2.
(3) Mediating Variable: Industrial Structure Level (ISL). The level of industrial structure development reflects the rationality of a city’s economic development and production. The ratio of the value of the tertiary industry to the secondary industry can indicate the economic level of a region and its evolutionary trend. Therefore, this study chooses the ratio of these two as the expression of the industrial structure development level.
(4) Moderating Variables: To enhance the explanatory power and predictive accuracy of the model and to more comprehensively consider and explain the complex relationships between the variables, this study selects the Level of Technological Investment (LTI) and Urbanization Level (URB) as moderating variables. The study covers 30 provincial regions in China from 2012 to 2021, providing a large sample size that supports effective modelling of multiple moderating variables. The Level of Technological Investment (LTI) is measured by the ratio of fiscal expenditure on science and technology to total local fiscal expenditure; the Urbanization Level (URB) is measured by the ratio of urban population to total regional population.
(5) Control Variables: This paper selects the Level of Human Capital (LHC), Degree of Openness (OPD), and Foreign Direct Investment Intensity (FDI) as control variables. LHC is measured by the ratio of higher education students to the total regional population; OPD is calculated by multiplying the total value of goods imports and exports by the exchange rate of USD to RMB and then taking the proportion of this value to the region’s Gross Domestic Product (GDP); FDI is measured by the percentage of foreign direct investment in the region’s total production value. The measurement of all variables is reflected in Table 3.
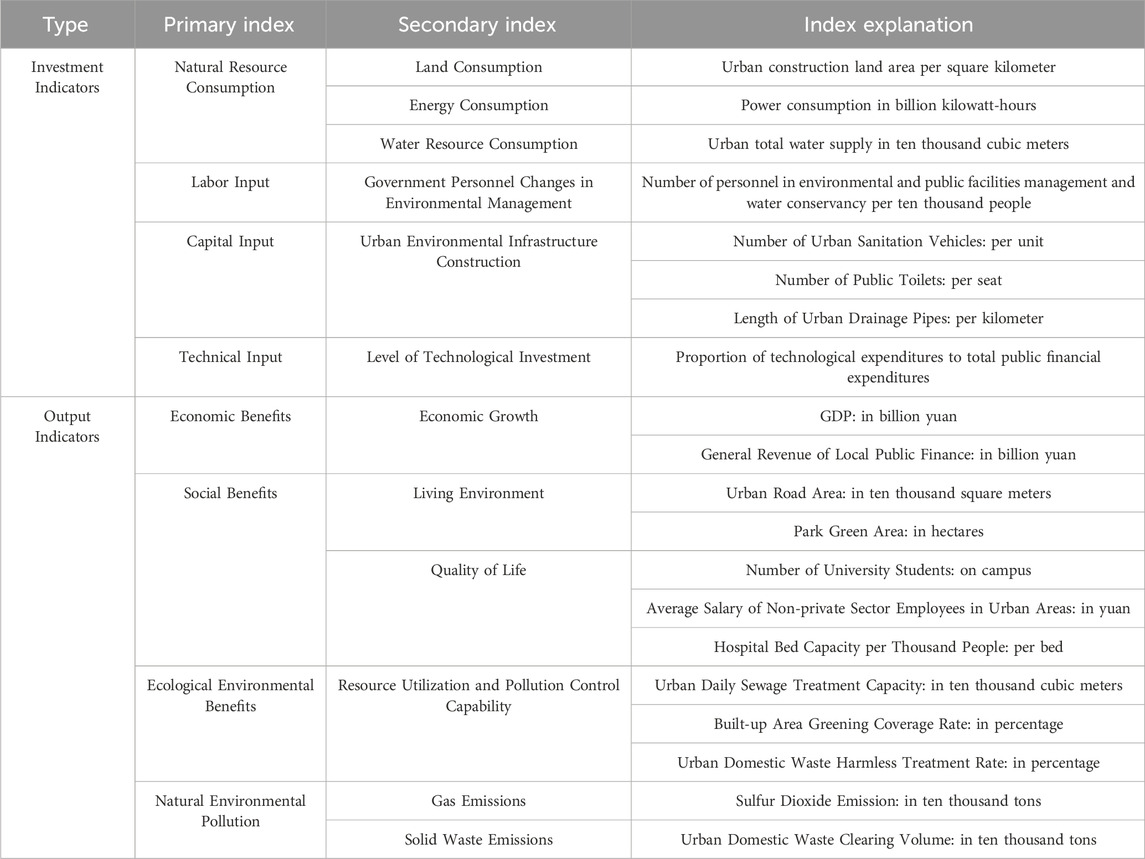
TABLE 1. Urban ecological governance performance indicator system.
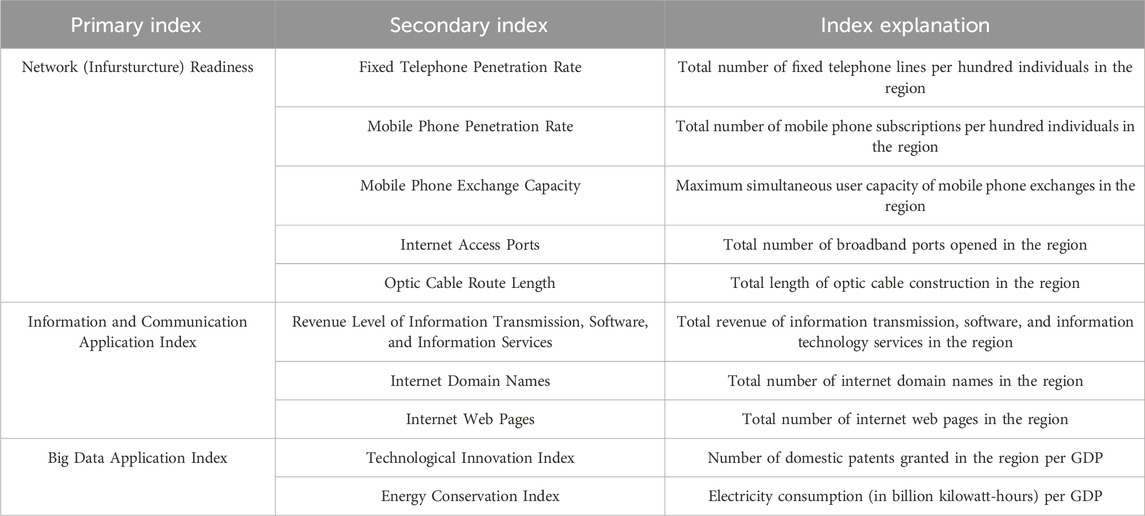
TABLE 2. Big data development level indicator system.
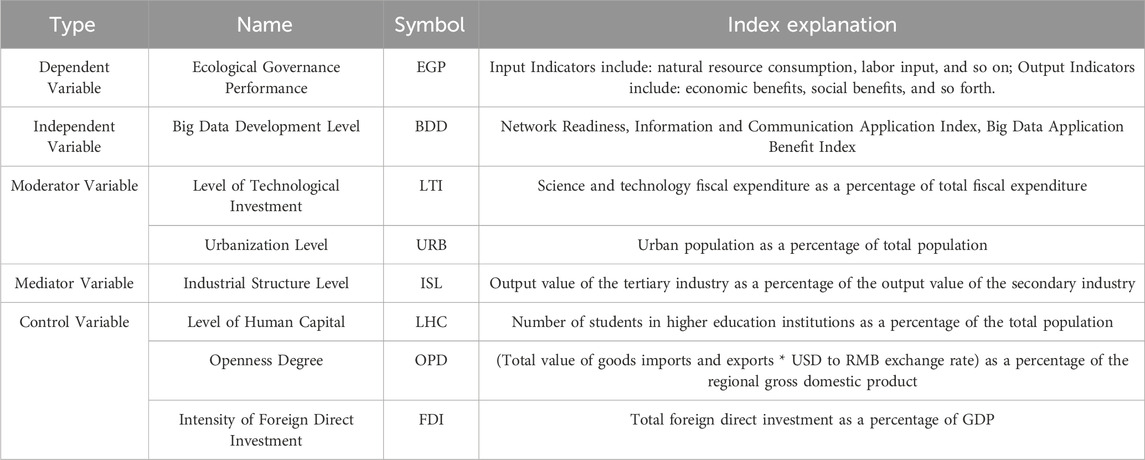
TABLE 3. Explanation of variable selection.
4.2 Data source and description
This study selects data from 2012 to 2021 for 30 provincial regions in China as the research subject. The data are sourced from the “China Statistical Yearbook” and the “China City Statistical Yearbook,” and are standardized for analysis. Missing data are filled in using the mean value method. Due to the significant amount of missing data for Taiwan, Hong Kong, Macau, and Tibet in China, these regions are not included as research subjects. Table 4 displays the characteristic values of variables with consistent data distribution.

TABLE 4. Basic characteristics of variables.
4.3 Model construction and description
4.3.1 Spatial weight matrix
The spatial distance matrix is constructed based on the distances between provinces, which can be either road distances or straight-line distances. To ensure more objective data measurement, this study constructs the matrix using spherical distances calculated based on latitude and longitude. The specific settings are as follows:
Herein,
4.3.2 Spatial autocorrelation model
The spatial autocorrelation model can determine the overall spatial correlation of urban ecological governance performance. Anselin (2019) has pointed out that the Moran’ I is an effective tool for explaining the spatial correlation. This paper uses the global Moran’s I index to assess the overall spatial connection or degree of difference of urban ecological governance performance between regions. The calculation formula is as follows:
In the above formula,
4.3.3 Spatial econometric model
According to the method proposed by Lesage and Pace (2009), this paper constructs a spatial econometric model to test spatial autocorrelation. Considering the results of spatial autocorrelation measurement, we have more appropriately applied the Spatial Durbin Model (SDM) in this research to test the spatial effects among variables. The Spatial Durbin Model (SDM) is a generalization of the Spatial Error Model (SEM) and the Spatial Lag Model (SLM), obtained by reorganizing and expanding the SEM and SLM and adding relevant conditional constraints. The basic expression of the model is as follows:
In the formula, Y represents the dependent variable, X represents the explanatory variables, α is the constant term, W is the spatial weight matrix, β represents the regression coefficients, ρ is the coefficient of the spatial lag term of the dependent variable Y, λ is a parameter vector, and θ represents the random disturbance term, which follows an independent distribution.
In this paper, based on the basic expression of the Spatial Durbin Model (SDM) and the selected influencing variable indicators, a Spatial Durbin Model (SDM) related to the study of factors affecting urban ecological governance performance has been constructed, specifically as follows:
The impact of Big Data Development Level (BDD) on Urban Ecological Governance Performance (EGP).
Equation (1):
The mediating role of Industrial Structure Level (ISL) between Big Data Development Level (BDD) and Urban Ecological Governance Performance (EGP):
Equation (2):
Equation (3):
The moderating role of the Level of Technological Investment (LTI) between Big Data Development Level (BDD) and Urban Ecological Governance Performance (EGP).
Equation (4):
The moderating role of Urbanization Level (URB) between Big Data Development Level (BDD) and Urban Ecological Governance Performance (EGP):
Equation (5):
In the formula,
4.3.4 Spatial spillover effects
The Spatial Durbin Model (SDM) exhibits limitations in elucidating the influence of pertinent variables in adjacent areas. The SDM accounts for the lagged terms of assorted variables, which may not objectively represent the explanatory capacity of the regression coefficient values. Consequently, it is necessary to undertake further decomposition of the effects of the influencing factor variables. Drawing upon the findings of Lesage and Pace (2009), this study utilizes partial differential equations to decompose spatial spillover effects and reformulates the existing spatial models into matrix form, as illustrated below:
In certain situation,
Eq. 6 is a shorthand form of the SDM (Spatial Durbin Model), where
5 Results
5.1 Stationarity test of data
To circumvent the potential problem of spurious regression, this study employed the statistical software Stata 17.0 to carry out stationarity tests on all variables. The study utilized the Levin-Lin-Chu (LLC), augmented Dickey-Fuller (ADF), and Phillips-Perron (PP) methods for unit root testing. Additionally, the difference-difference method was applied to address unit roots in non-stationary time series, as detailed in Table 5. When setting the lag order to 5, the significance level for each variable was found to be 0.000 < 0.01, leading to the rejection of the null hypothesis and thereby indicating that the data for the selected variables are both stationary and reliable. For assessing multicollinearity among the explanatory variables, the Variance Inflation Factor (VIF) was utilized, providing an evaluation of collinearity among these variables as presented in Table 6. The VIFs for the explanatory variables were all found to be within the threshold of 10 and below 5, indicating a lack of dependence among the explanatory variables.

TABLE 5. Results of data stationarity test.
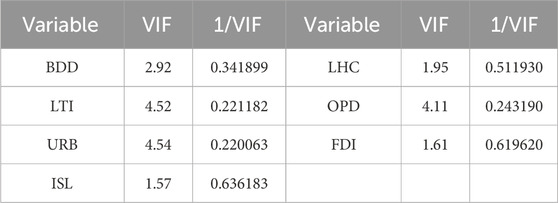
TABLE 6. Results of explanatory variable collinearity detection.
5.2 Spatial autocorrelation test
To ascertain the spatial dependence of Ecological Governance Performance (EGP) among various cities and provinces in China, this study utilized Stata 17.0 to develop a standardized spatial weight matrix and applied the global Moran’s I index to evaluate the EGP across 30 provinces and municipalities in China spanning from 2012 to 2021. The results, as presented in Table 7, reveal that the p-values of the Moran’s I index for EGP are all below 0.01, signifying a strong spatial autocorrelation among the regions. All variables exhibit a positive Moran’s I index, suggesting that there is a mutual enhancement of ecological governance performance across regions. Additionally, from 2012 to 2021, the Moran’s I index overall exhibits a decreasing trend, indicating a gradual reduction in spatial correlation among regions. This finding lends crucial theoretical support to the use of spatial econometric models in such analyses.
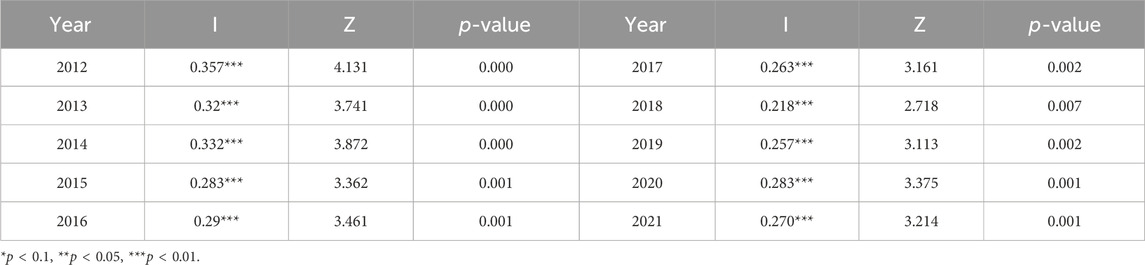
TABLE 7. Results of Moran’s I index test.
5.3 Establishment of spatial econometric models
To confirm the suitability of selecting the Spatial Durbin Model (SDM) for spatial econometric analysis, an LM test was conducted on the model, with results displayed in Table 8. The test statistics from the LM test are all significant at the 1% level, leading to the rejection of the null hypothesis and supporting the selection of the SDM model as the spatial econometric model. Subsequently, a Hausman test was employed to compare the random effects model and the fixed effects model. The results reveal that the test statistics are significant at the 1% level, leading to the rejection of the null hypothesis and a preference for the fixed effects model. Additionally, Wald tests and LR tests were utilized to conclusively validate the spatial econometric model, with results demonstrating significance at the 1% level and eliminating the likelihood of reducing to a Spatial Autoregressive Model (SAR) or Spatial Error Model (SEM). Lastly, the results demonstrate that the time fixed effects model is significant at the 1% level, suggesting the superiority of the time fixed effects model over the individual fixed effects model.
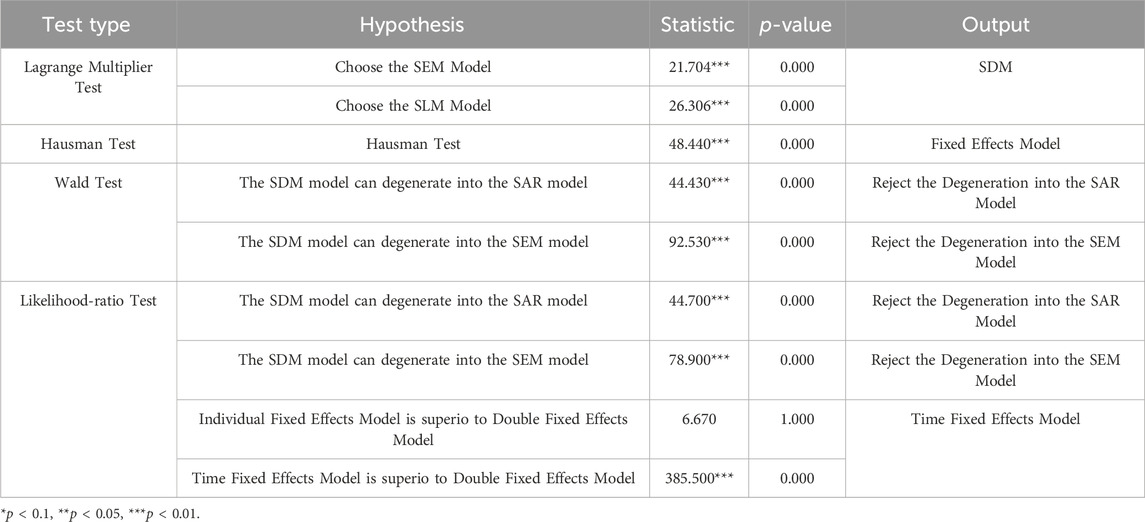
TABLE 8. Basis of establishing the spatial durbin model.
5.4 Regression analysis of the spatial durbin model
a. Empirical Analysis of the Impact of Big Data Development Level (BDD) on Urban Ecological Governance Performance (EGP).
Model (1) focuses on assessing the impact of Big Data Development (BDD) on Urban Ecological Governance Performance (EGP). This model, estimated using the Spatial Durbin Model via maximum likelihood estimation, presents its test results in Table 9.

TABLE 9. Results of spatial durbin model test.
According to the data in Table 9, BDD exerts a significant positive influence on EGP, demonstrating a positive promotional effect (β = 0.349, p < 0.01). This implies that the application of big data technology can furnish decision-makers with more information, thereby facilitating optimized decision-making and improving ecological governance outcomes. Regarding spatial spillover effects, the advancement of BDD in one region has been found to positively influence the EGP in neighboring regions (β = 0.219, p < 0.01). The development of big data facilitates information sharing across regions and offers more advanced governance techniques, thus enabling scientific decision-making to address cross-regional environmental issues.
b. The Mediating Role of Industrial Structure Level (ISL) between Big Data Development Level (BDD) and Urban Ecological Governance Performance (EGP).
Table 10 investigates the mediating role of Industrial Structure Level (ISL) between Big Data Development (BDD) and Urban Ecological Governance Performance (EGP). As depicted in Table 10, the study methodically analyzes the mediating effect of ISL through sequential regression coefficients.

TABLE 10. The mediation analysis in the spatial durbin model.
In Table 10, a significant positive relationship is observed between BDD and the mediating variable ISL, as indicated by a coefficient of 1.356 (p < 0.01). In the model where EGB serves as the dependent variable, the coefficient for BDD stands at 0.510 (p < 0.01), and that for ISL is −0.029 (p < 0.01). It is of significance to observe that in Table 9, the coefficient for BDD registers at a mere 0.349 (p < 0.01). Nonetheless, when the mediating variable ISL is factored in, there is a notable augmentation in the positive impact of BDD on EGP. These results indicate that ISL plays a partial mediating role between BDD and EGB. However, in the spatial model with EGB as the dependent variable, the coefficients for BDD and ISL are 0.048 (p > 0.1) and −0.016 (p > 0.1), indicating the absence of a spatial mediating effect.
c. The Moderating Effects of Level of Technological Investment (LTI) and Urbanization Level (URB) on the Relationship Between BDD and EGP.
The moderating effects of Level of Technological Investment (LTI) and Urbanization Level (URB) on the relationship between Big Data Development (BDD) and Urban Ecological Governance Performance (EGP) were assessed by constructing interaction terms. The test results derived from the Spatial Durbin Model are presented in Table 11.
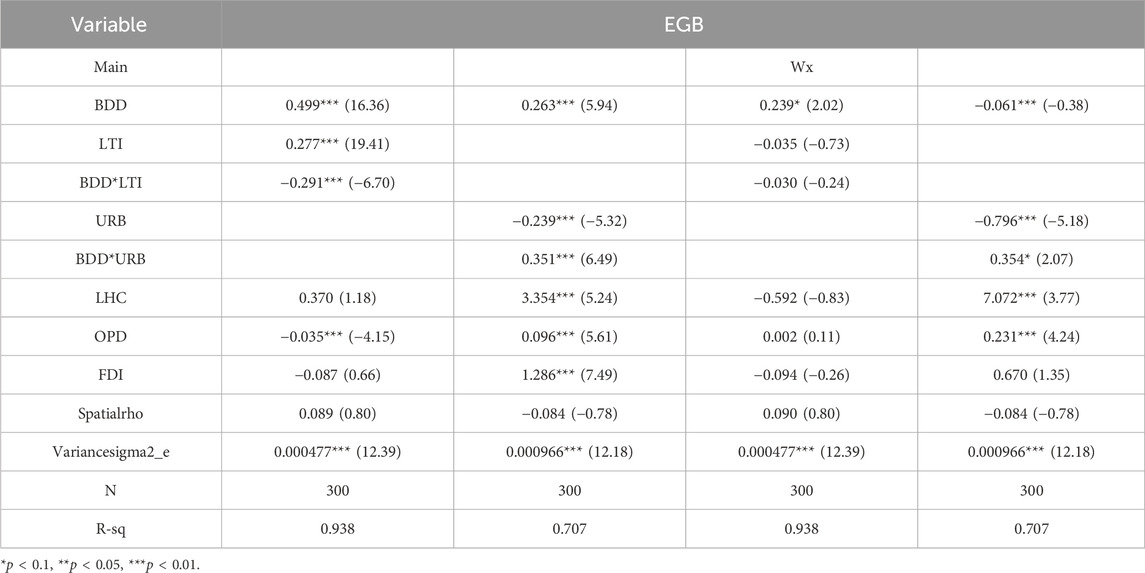
TABLE 11. Results of the moderation analysis in the spatial durbin model.
The data presented in Table 11 indicates that LTI exhibits a significant negative moderating effect on the relationship between BDD and EGP (βBDDLHC = −0.291, p < 0.01). However, within the Spatial Durbin Model framework, this moderating effect of LTI is no longer statistically significant (ρBDDLHC = −0.030, p > 0.1). Regarding URB, it demonstrates a significant positive moderating effect on the relationship between BDD and EGP (βBDDURB = 0.351, p < 0.01), and this positive moderating effect persists as significant in the Spatial Durbin Model (ρBDDURB = 0.354, p < 0.1).
d. Empirical Analysis of Spatial Spillover Effects.
Utilizing the regression outcomes derived from the Spatial Durbin Model (SDM), this study employs a spatial autoregressive matrix to decompose the total effects of the variables in Equation (1). The objective is to elucidate the spatial spillover effects of Big Data Development Level (BDD) on Urban Ecological Governance Performance (EGP), going beyond merely assessing a model that incorporates Industrial Structure Level (ISL) as an intermediary and Technological Investment Level (LTI) and Urbanization Level (URB) as moderating variables, as delineated in Table 12.
1) Direct Effects Analysis:
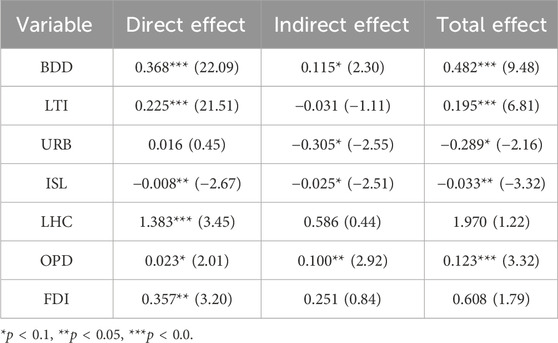
TABLE 12. Decomposition results of spatial spillover effects.
Within the framework of spatial spillover effects, direct effects denote the impact exerted by local explanatory variables on the dependent variable. As illustrated in Table 12, the outcomes of Equation (1), post-bias adjustment, reveal that BDD within a region significantly positively impacts EGP (β = 0.368, p < 0.01), with this influence likely to extend to other regions and produce feedback effects.
2) Indirect Effects Analysis:
Indirect spatial effects quantify the spatial spillover impacts exerted by the explanatory variables of neighboring regions on the dependent variable in a local context. As depicted in Table 12, an increase in local Big Data Development (BDD) positively influences the Urban Ecological Governance Performance (EGP) in neighboring areas (β = 0.115, p < 0.1).
6 Discussion
This study undertakes an empirical analysis of the relationship among Big Data Development (BDD), Technological Investment Level (LTI), Urbanization Level (URB), Industrial Structure Level (ISL), and Urban Ecological Governance Performance (EGP) through the application of spatial econometric models. The results are as follows:
1) The research findings reveal that BDD exerts a significant positive impact on EGP, with notable spatial spillover effects observed between regions, thereby confirming hypotheses H1a and H1b. Technological advancement and its application constitute key drivers of societal development (Morley and Robins, 1995), with the implementation of big data significantly enhancing the level and outcomes of urban ecological governance. Owing to the extensive adoption of big data across diverse domains like energy consumption, transportation and logistics, and government services (Oussous et al., 2018), governments globally are increasingly acknowledging its significance (NSF, 2012; Li, 2015). Local governments can effectively harness big data for enhanced resource allocation and management. This is particularly evident in the optimization of urban transportation, energy utilization, waste management, and more, thereby leading to enhanced overall urban ecological governance outcomes. Furthermore, the swift pace of progress in big data technology, which approximately expands tenfold every 5 years (Hendrickson, 2010), offers a conduit for technology dissemination and advancement (Rogers, 1995), culminating in a rapid escalation in the level of big data across various regions. In this context, it is anticipated that ecological governance performance across regions will also enhance correspondingly.
2) The findings of this study indicate that the Industrial Structure Level (ISL) serves as a partially positive mediator between Big Data Development (BDD) and Urban Ecological Governance Performance (EGP), yet no mediating effect is observed across regions. This result confirms hypothesis H2a but refutes hypothesis H2b. Energy-intensive industrial structures present considerable challenges to urban sustainability (Greaker et al., 2018). Zhao et al. (2022) discovered that the upgrading of industrial structures can positively influence carbon reduction through enhanced energy efficiency. The advancement of big data is poised to encourage businesses to adopt technologies like data analysis and artificial intelligence (Björkdahl, 2020; Li, 2020), facilitating the upgrading of industrial structures. Given the imperative of balancing sustainable development with economic growth (Daly, 1977), these technology-driven industries are likely to prioritize eco-friendliness, environmental protection, and sustainability, thus enhancing the overall ecological orientation of the industrial structure. Additionally, the absence of significant spatial spillover effects across regions could stem from marked disparities in big data development levels and industrial structures among these areas, rendering it challenging for alterations in one region’s industrial structure to influence the ecological governance performance of adjacent regions.
3) The Level of Urbanization (URB) significantly positively moderates the relationship between the Level of Big Data Development (BDD) and Urban Ecological Governance Performance (EGP), while the Level of Technological Investment (LTI) demonstrates a contrasting negative moderating effect. This confirmation upholds hypotheses H3a and H4a. Nevertheless, there are notable differences observed within the Spatial Durbin Model. Specifically, the interaction between Big Data Development Level and Technological Input Level does not demonstrate spatial spillover effects across regions, whereas the interactive effect between big data development level and urbanization level extends to neighboring regions. This validates hypothesis H4b. Within individual regions, government investment in technology likely contributes to high-quality development (Jin and Yang, 2022), the digital transformation of businesses (Feng et al., 2022), and the advancement of smart cities (Zeng et al., 2023). The escalation of urbanization level may intensify the demand for big data applications in urban areas, thereby fostering a greater willingness among the populace to embrace new technologies (Davis et al., 1992). The synergistic effect of these two factors is likely to amplify the positive impact of big data on urban ecological governance. Additionally, the Spatial Durbin Model results suggest that the interaction between Big Data Development Level and Technological Input Level does not manifest spatial spillover effects across regions, possibly attributable to the intricacies of technology diffusion (Rogers, 1995). In contrast, the interactive impact between big data development level and urbanization level demonstrates spatial diffusion effects in neighboring regions, potentially due to urban density fostering communication between adjacent areas (Glaeser, 2013), thereby influencing the relationship between Big Data Development and Urban Ecological Governance Performance.
7 Contributions and limitations
7.1 Theoretical and practical contributions
This study carries multiple theoretical implications. Firstly, preceding research has predominantly concentrated on examining the effects of traditional energy use constraints (Acemoglu et al., 2012), industrial structure (Mi et al., 2015), and technological innovation (Chen et al., 2019) on environmental governance. This study enhances the understanding of the determinants of urban ecological governance performance by emphasizing the level of urban big data development and integrating a technological innovation perspective. This contributes to the development of a more comprehensive and multi-dimensional theoretical framework for understanding the impact on urban ecological governance performance, offering a broader foundation for policy formulation and resource allocation. Secondly, by incorporating industrial structure as a mediating variable, and technological input intensity and urbanization level as moderating factors, this study addresses a research gap concerning the internal mechanisms linking big data development level and urban ecological governance performance. This research further delves into how governments can enhance urban ecological governance performance by leveraging the dimensions of big data development and industrial structure, providing novel insights into the drivers of ecological governance performance from a technological and innovative standpoint. Thirdly, this study expands the methodological approaches for examining factors influencing urban ecological governance performance by utilizing spatial econometric models to underscore the locality-specific characteristics linking urban big data development and urban ecological governance performance. This is because, in many instances, changes in one region can precipitate demonstration, competition, and feedback effects in adjacent regions. Consequently, this study offers a spatial analytical perspective to explore the impact of big data and identify similar patterns across various regions, thereby facilitating potential cross-regional collaboration in big data development.
Additionally, this study possesses significant practical implications for governments and businesses, offering a pragmatic pathway towards constructing smarter and more sustainable urban ecological governance systems. Firstly, the research underscores the criticality of eschewing indiscriminate escalations in technological investments. While the level of Big Data Development possesses the capacity to augment Urban Ecological Governance Performance, an inordinate escalation in technological investment might lead to counterproductive outcomes, not only failing to bolster Big Data Development as expected but also failing to further improve Urban Ecological Governance Performance. Simultaneously, accelerating the urbanization process will endow cities with enhanced infrastructure and services, further bolstering their ecological governance capabilities. These twin strategies can be rapidly transformed into policy actions, offering substantial backing for urban sustainable development. Furthermore, this paper introduces innovative concepts for cross-regional collaboration. Via data sharing and joint implementation of big data technology, governments across different regions can augment each other’s resource strengths, facilitating cross-regional collaboration in the development of big data for ecological governance performance. The collaborative application of big data technology enables regions to collectively explore its potential in enhancing ecological governance. By collaboratively developing and implementing cutting-edge big data analytics tools, regions can share technological advancements and attain more optimal governance outcomes.
7.2 Limitations and future research directions
Despite its contributions, this study is not without limitations. Firstly, the diversity in socio-economic and cultural systems across regions may result in varied outcomes. The data utilized in this study originates from 30 provincial administrative units in China. Future research endeavors could engage in cross-national and cross-cultural comparative analyses. Secondly, this paper delves into the impact of big data development level on urban ecological governance performance. The subsequent step could involve broadening the scope of measurement for independent variables by integrating big data with aspects like technological innovation to formulate composite variables and collectively examine their impact on urban ecological governance performance. Finally, future studies could consider examining the spatial spillover effects of additional mediating variables. Concurrently, by integrating short-term and long-term mediating effects, direct and indirect effects, among other variables, further research can be undertaken from a more comprehensive perspective.
Data availability statement
The original contributions presented in the study are included in the article/supplementary material, further inquiries can be directed to the corresponding author.
Author contributions
YL: Conceptualization, Data curation, Formal Analysis, Investigation, Methodology, Project administration, Resources, Software, Supervision, Validation, Visualization, Writing–original draft, Writing–review and editing.
Funding
The author(s) declare that no financial support was received for the research, authorship, and/or publication of this article.
Conflict of interest
The author declares that the research was conducted in the absence of any commercial or financial relationships that could be construed as a potential conflict of interest.
Publisher’s note
All claims expressed in this article are solely those of the authors and do not necessarily represent those of their affiliated organizations, or those of the publisher, the editors and the reviewers. Any product that may be evaluated in this article, or claim that may be made by its manufacturer, is not guaranteed or endorsed by the publisher.
References
Acemoglu, D., Aghion, P., Bursztyn, L., and Hemous, D. (2012). The environment and directed technical change. Am. Econ. Rev. 102 (1), 131–166. doi:10.1257/aer.102.1.131
Aghion, P., Dechezleprêtre, A., Hemous, D., Martin, R., and Van Reenen, J. (2016). Carbon taxes, path dependency, and directed technical change: evidence from the auto industry. J. Political Econ. 124 (1), 1–51. doi:10.1086/684581
Ang, L. M., and Seng, K. P. (2016). Big sensor data applications in urban environments. Big Data Res. 4, 1–12. doi:10.1016/j.bdr.2015.12.003
Anselin, L. (2019). “The moran scatterplot as an ESDA tool to assess local instability in spatial association,” in Spatial analytical perspectives on GIS (Routledge), London, UK, 111–126.
Bakker, K., and Ritts, M. (2018). Smart earth: a meta-review and implications for environmental governance. Glob. Environ. Change 52, 201–211. doi:10.1016/j.gloenvcha.2018.07.011
Berner, M., Graupner, E., and Maedche, A. (2014). The information panopticon in the big data era. J. Organ. Des. (Aarhus) 3 (1), 14. doi:10.7146/jod.9736
Björkdahl, J. (2020). Strategies for digitalization in manufacturing firms. Calif. Manag. Rev. 62 (4), 17–36. doi:10.1177/0008125620920349
Boyd, D., and Crawford, K. (2012). Critical questions for big data: Provocations for a cultural, technological, and scholarly phenomenon. Inf. Commun. Soc. 15 (5), 622–679. doi:10.1080/1369118X.2012.678878
Burgess, E. W. (2020). The growth of the city: an introduction to a research Project. University of Chicago Press. Chicago, IL, USA,
Central Committee of the Communist Party of China (2015). Opinions of the central committee of the communist party of China and the state Council on accelerating the construction of ecological civilization. https://www.gov.cn/xinwen/2015-05/05/content_2857363.htm.
Central Committee of the Communist Party of China(2018). Opinions on comprehensive strengthening of ecological environment protection and resolutely winning the battle for pollution prevention and control. https://www.gov.cn/zhengce/2018-06/24/content_5300953.htm.
Chen, J., Yuan, H., Tian, X., Zhang, Y., and Shi, F. (2019). What determines the diversity of CO2 emission patterns in the beijing-tianjin-hebei region of China? An analysis focusing on industrial structure change. J. Clean. Prod. 228, 1088–1098. doi:10.1016/j.jclepro.2019.04.267
Cheng, Z., Li, L., and Liu, J. (2018). Industrial structure, technical progress, and carbon intensity in China's provinces. Renew. Sustain. Energy Rev. 81, 2935–2946. doi:10.1016/j.rser.2017.06.103
Cui, L., and Shi, J. (2012). Urbanization and its environmental effects in Shanghai, China. Urban Clim. 2, 1–15. doi:10.1016/j.uclim.2012.10.008
Daly, H. E. (1977). Steady-state economics: the economics of biophysical equilibrium and moral growth. Earthscan. Londan, UK.
Davis, F. D., Bagozzi, R. P., and Warshaw, P. R. (1992). Extrinsic and intrinsic motivation to use computers in the workplace. J. Appl. Soc. Psychol. 22 (14), 1111–1132. doi:10.1111/j.1559-1816.1992.tb00945.x
Desouza, K. (2014). Realizing the promise of big data. IBM Center for the Business of Government. Washington, DC, USA.
Desouza, K. C., and Jacob., B. (2017). Big data in the public sector: lessons for practitioners and scholars. Adm. Soc. 49 (7), 1043–1064. doi:10.1177/0095399714555751
Dong, X., Hu, Y., and Li, W. (2008). International comparison and historical analysis of China's environmental governance efficiency: a study based on the dea model. Sci. Res. 6, 1221–1230. doi:10.16192/j.cnki.1003-2053.2008.06.003
Etzion, D., and Aragon-Correa, J. A. (2016). Big data, management, and sustainability: strategic opportunities ahead. Organ. Environ. 29 (2), 147–155. doi:10.1177/1086026616650437
European Commission (2010). Making our cities attractive and sustainable: how the EU contributes to improving the urban environment. Luxembourg: Publications Office of the European Union.
Executive Office of the President (2014). Big data: seizing opportunities, preserving values. https://bigdatawg.nist.gov/pdf/big_data_privacy_report_may_1_2014.pdf.
Feng, H., Wang, F., Song, G., and Liu, L. (2022). Digital transformation on enterprise green innovation: effect and transmission mechanism. Int. J. Environ. Res. Public Health 19 (17), 10614. doi:10.3390/ijerph191710614
Franks, B. (2012). Taming the big data tidal wave: finding opportunities in huge data streams with advanced analytics. John Wiley and Sons. Hoboken, NJ, USA,
Gao, J., and Sun, Y. (2022). The evolution of ecological and environmental governance attention allocation in J city based on big data analysis. Discrete Dyn. Nat. Soc. 2022, 1–8. doi:10.1155/2022/9128819
Gerlagh, R., Kverndokk, S., and Rosendahl, K. E. (2014). The optimal time path of clean energy R&D policy when patents have finite lifetime. J. Environ. Econ. Manag. 67, 2–19. doi:10.1016/j.jeem.2013.09.005
Giest, S., and Samuels, A. (2020). For good measure: data gaps in a big data world. Policy Sci. 53 (3), 559–569. doi:10.1007/s11077-020-09384-1
Glaeser, E. (2013). Triumph of the city: how our greatest invention makes us richer, smarter, greener, healthier, and happier. New York, NY, USA: Penguin Books.
Greaker, M., Heggedal, T., and Rosendahl, K. E. (2018). Environmental policy and the direction of technical change. Scand. J. Econ. 120 (4), 1100–1138. doi:10.1111/sjoe.12254
Greaker, M., and Pade, L. (2009). Optimal CO2 abatement and technological change: should emission taxes start high in order to spur R&D? Clim. Change 96, 335–355. doi:10.1007/s10584-009-9643-x
Greenwald, G. (2013). NSA collecting phone records of millions of verizon customers daily. http://www.theguardian.com/world/2013/jun/06/nsa-phone-records-verizon-court-order.
Greenwald, G., and MacAskill, E. (2013). NSA prism program taps into user data of apple, google and others. http://www.guardian.co.uk/world/2013/jun/06/us-tech-giants-nsa-data.
Grimaud, A., Lafforgue, G., and Magné, B. (2011). Climate change mitigation options and directed technical change: a decentralized equilibrium analysis. Resour. Energy Econ. 33 (4), 938–962. doi:10.1016/j.reseneeco.2010.11.003
Hashem, I. A. T., Chang, V., Anuar, N. B., Adewole, K., Yaqoob, I., Gani, A., et al. (2016). The role of big data in smart city. Int. J. Inf. Manag. 36 (5), 748–758. doi:10.1016/j.ijinfomgt.2016.05.002
Hendrickson, S. (2010). Getting started with hadoop with amazon’s elastic MapReduce. https://cloudacademy.com/lab/getting-started-amazon-elastic-mapreduce/.
Hirsch, D. D. (2013). The glass house effect: big data, the new oil, and the power of analogy. Maine Law Rev. 66, 373.
Iqbal, R., Doctor, F., More, B., Mahmud, S., and Yousuf, U. (2020). Big data analytics: computational intelligence techniques and application areas. Technol. Forecast. Soc. Change 153, 119253. doi:10.1016/j.techfore.2018.03.024
Jin, H., and Yang, N. (2022). New momentum for data, government investment in technology, and high-quality urban development in the yellow river basin. Front. Environ. Sci. 10. doi:10.3389/fenvs.2022.969454
Kankanhalli, A., Hahn, J., Tan, S., and Gao, G. (2016). Big data and analytics in healthcare: introduction to the special section. Inf. Syst. Front. 18 (2), 233–235. doi:10.1007/s10796-016-9641-2
Khan, N., Yaqoob, I., Hashem, I. A. T., Inayat, Z., Mahmoud Ali, W. K., Alam, M., et al. (2014). Big data: survey, technologies, opportunities, and challenges. TheScientificWorld 2014, 1–18. doi:10.1155/2014/712826
Kuziemski, M., and Misuraca, G. (2020). AI governance in the public sector: three tales from the Frontiers of automated decision-making in democratic settings. Telecommun. Policy 44, 101976. doi:10.1016/j.telpol.2020.101976
Laney, D. (2001). 3D data management: controlling data volume, velocity, and variety. META Group Res. Note 6 (70), 1.
Li, F. (2020). The digital transformation of business models in the creative industries: a holistic framework and emerging trends. Technovation 92, 102012. doi:10.1016/j.technovation.2017.12.004
Li, G. (2015). Big data related technologies, challenges and future prospects. Inf. Technol. Tour. 15 (3), 283–285. doi:10.1007/s40558-015-0027-y
Manyika, J., Chui, M., Brown, B., Bughin, J., Dobbs, R., Roxburgh, C., et al. (2011). Big data: the next frontier for innovation, competition, and productivity. McKinsey. Chennai, India.
Mi, Z.-F., Pan, S.-Y., Yu, H., and Wei, Y.-M. (2015). Potential impacts of industrial structure on energy consumption and CO2 emission: a case study of beijing. J. Clean. Prod. 103, 455–462. doi:10.1016/j.jclepro.2014.06.011
Morley, D., and Robins, K. (1995). Technological determinism in media studies: foundational texts. Cult. Soc. 17 (2), 147–166. doi:10.1177/016344395017002001
Murdoch, T. B., and Detsky, A. S. (2013). The inevitable application of big data to health care. JAMA J. Am. Med. Assoc. 309 (13), 1351–1352. doi:10.1001/jama.2013.393
Musse, M. A., Barona, D. A., and Rodriguez, L. M. S. (2018). Urban environmental quality assessment using remote sensing and census data. Int. J. Appl. Earth Observation Geoinformation 71, 95–108. doi:10.1016/j.jag.2018.05.010
NSF (2012). “Machine learning; NSF announces interagency progress on administration’s big data initiative,” in Defense and aerospace week (Alexandria, VI, USA: NSF), 248–249.
Oussous, A., Benjelloun, F. Z., Ait Lahcen, A., and Belfkih, S. (2018). Big data technologies: a survey. Comput. Inf. Sci. 30 (4), 431–448. doi:10.1016/j.jksuci.2017.06.001
Polonetsky, J., and Tene, O. (2013). Privacy and big data: making ends meet. Stanf. Law Rev. Online 66 (25).
Sarker, M. N. I., Peng, Y., Yiran, C., and Shouse, R. C. (2020). Disaster resilience through big data: way to environmental sustainability. Int. J. Disaster Risk Reduct. 51, 101769. doi:10.1016/j.ijdrr.2020.101769
Schmarzo, B. (2013). Big data: understanding how data powers big business. Hoboken, NJ, USA: John Wiley and Sons.
Shapiro, J. S., and Walker, R. (2018). Why is pollution from US manufacturing declining? The roles of environmental regulation, productivity, and trade. Am. Econ. Rev. 108 (12), 3814–3854. doi:10.1257/aer.20151272
Shiell, L., and Lyssenko, N. (2014). Climate policy and induced R&D: how great is the effect? Energy Econ. 46, 279–294. doi:10.1016/j.eneco.2014.09.017
Song, X., Wei, Y., Deng, W., Zhang, S., Zhou, P., Liu, Y., et al. (2019). Spatio-temporal distribution, spillover effects and influences of China’s two levels of public healthcare resources. Int. J. Environ. Res. Public Health 16 (4), 582. doi:10.3390/ijerph16040582
Stoianov, N., Urueña, M., Niemiec, M., Machnik, P., and Maestro, G. (2015). Integrated security infrastructures for law enforcement agencies. Multimedia Tools Appl. 74 (12), 4453–4468. doi:10.1007/s11042-013-1532-7
Wu, G., Fan, Y., and Riaz, N. (2022). Spatial analysis of agriculture ecological efficiency and its influence on fiscal expenditures. Sustain. Basel, Switz. 14 (16), 9994. doi:10.3390/su14169994
Wu, H., Yu, H., and Ren, S. (2020). How do environmental regulation and environmental decentralization affect green total factor energy efficiency: evidence from China. Energy Econ. 91, 104880. doi:10.1016/j.eneco.2020.104880
Xiao, Q., and Xiao, L. (2022). Spatial and temporal differentiation and response of green innovation efficiency and ecological governance performance: a case study of 108 cities in the yangtze river economic belt. World Geogr. Res. 1, 96–106.
Xu, B., and Lin, B. (2018). What cause large regional differences in PM2.5 pollution in China? Evidence from quantile regression model. J. Clean. Prod. 174, 447–461. doi:10.1016/j.jclepro.2017.11.008
Yang, J., Li, X., and Huang, S. (2020). Impacts on environmental quality and required environmental regulation adjustments: a perspective of directed technical change driven by big data. J. Clean. Prod. 275, 124126. doi:10.1016/j.jclepro.2020.124126
Yoo, S., and Choi, K. (2015). “Research on the development stage of service model in the big data industry,” in Computer science and its applications (Springer), Berlin, Germany, 545–554.
Zeng, Y., Zhang, Z., Ye, Z., and Li, L. (2023). Regional innovation effect of smart city construction in China. PloS One 18 (2), e0281862. doi:10.1371/journal.pone.0281862
Zhang, W., Wang, Y., and Zhang, W. (2023). How double-carbon policies affect green technology innovation capability of enterprise: empirical analysis based on spatial dubin model. IEEE Trans. Eng. Manag., 1–13. doi:10.1109/TEM.2023.3320355
Zhang, Y., Ma, S., Yang, H., Lv, J., and Liu, Y. (2018). A big data driven analytical framework for energy-intensive manufacturing industries. J. Clean. Prod. 197, 57–72. doi:10.1016/j.jclepro.2018.06.170
Zhang, Y., Ren, S., Liu, Y., and Si, S. (2017). A big data analytics architecture for cleaner manufacturing and maintenance processes of complex products. J. Clean. Prod. 142, 626–641. doi:10.1016/j.jclepro.2016.07.123
Keywords: big data, ecological governance performance, environmental management, spatial durbin model, spatial analysis
Citation: Lei Y (2024) Enhancing environmental management through big data: spatial analysis of urban ecological governance and big data development. Front. Environ. Sci. 12:1358296. doi: 10.3389/fenvs.2024.1358296
Received: 19 December 2023; Accepted: 26 February 2024;
Published: 12 March 2024.
Edited by:
Xiaofeng Xu, China University of Petroleum, ChinaReviewed by:
Mingyang Zhang, Sichuan University, ChinaWenyao Zhang, Qilu University of Technology, China
Abdo Hassoun, Sustainable AgriFoodtech Innovation & Research (Safir), France
Copyright © 2024 Lei. This is an open-access article distributed under the terms of the Creative Commons Attribution License (CC BY). The use, distribution or reproduction in other forums is permitted, provided the original author(s) and the copyright owner(s) are credited and that the original publication in this journal is cited, in accordance with accepted academic practice. No use, distribution or reproduction is permitted which does not comply with these terms.
*Correspondence: Yunliang Lei, y.lei14@lse.ac.uk