 Tongping Xie1
 Xuwei Wang2*
- 1School of Economics and Management, Gongqing Institute of Science and Technology, Gongqing, China
- 2Management Science and Engineering Research Center, Jiangxi Normal University, Nanchang, China
In the context of rapid advancement in automation and increasing global warming, understanding the impact of artificial intelligence (AI) on carbon emissions (CES) is a cutting-edge research topic. However, there is limited focus in existing research on the nonlinear carbon reduction effect (CRE) of AI. This paper first theoretically elaborates the dual impact mechanisms of AI on CES and illuminates the nonlinear carbon reduction mechanisms of AI. Then, this study employs panel data encompassing 30 Chinese provinces between 1997 and 2019 to empirically test the net effect of AI on CES and the nonlinear carbon reduction effect of AI through econometric models. The results are as follows: first, although AI can both reduce and increase CES, AI primarily helps decrease CES. This conclusion holds true even after considering robustness, endogeneity, and spatial heterogeneity. Secondly, relative to the central and western regions, AI has significant achievement in reducing carbon intensity and per capita CES in the eastern region. However, there is still room for improvement in terms of reducing the total CES in the eastern region. Thirdly, improving the AI development level (AIDL) can magnify the marginal CRE of AI and lead to a nonlinear CRE of AI. Lastly, even if the AIDL remains constant, improving the level of marketization, human capital, digital infrastructure, economic development, openness, and government intervention can also amplify the marginal CRE of AI and lead to a nonlinear CRE of AI. To fully harness the potential of AI for green development, concerted efforts should be directed towards enhancing the innovation and application of AI technologies with carbon reduction potential.
1 Introduction
Climate change, primarily attributed to carbon emissions (CES) resulting from human activities, has exerted a significant and detrimental impact on human survival and development (Zhang W. et al., 2022; Li et al., 2022; Wang et al., 2023b). The global community has consequently made decarbonization a key priority (Vorozheykina, 2022). Additionally, artificial intelligence (AI) has emerged as one of the most eagerly anticipated technologies. In this context, the impact of AI on CES has become a focal point of scholarly inquiry. Extensive research has highlighted the dual nature of AI’s impact on CES, encompassing both reduction and increase (Chen P. et al., 2022; Kaack et al., 2022; Cowls et al., 2023). Hence, the questions arise: Will the development of AI ultimately result in a carbon reduction effect (CRE)? Does the CRE of AI exhibit a nonlinear characteristic? Resolving these inquiries holds substantial theoretical and practical significance. Regrettably, existing studies have not fully addressed the aforementioned questions.
To address these gaps, firstly, this paper will theoretically analyze the carbon reduction mechanisms and carbon increase mechanisms of AI, and will point out that AI will ultimately reduce CES. Secondly, from a theoretical perspective, the paper will illustrate that the improvement of AI development, marketization, human capital, digital infrastructure, economic development, openness, and government intervention level can magnify the marginal CRE of AI and lead to a nonlinear CRE of AI. Finally, this paper will empirically test the aforementioned theoretical perspectives using provincial panel data from China spanning from 1997 to 2019 and econometric models.
This paper makes significant contributions in three key points. Firstly, this paper will provide a unified framework for understanding of the impact of AI on CES. Existing research has primarily focused on analyzing the carbon reduction mechanisms and CRE of AI. While some studies also consider the carbon increase mechanisms and carbon increase effect of AI, there is limited research that systematically analyzes both the carbon reduction and increase mechanisms within a unified framework. Moreover, there is relatively little discussion in existing research regarding the crucial question of whether the CRE or the carbon increase effect of AI is greater. This paper, at the theoretical level, systematically analyzes both the carbon reduction and increase mechanisms of AI and empirically confirms the viewpoint that the CRE of AI is greater than the carbon increase effect. Secondly, this paper will contribute to a deeper understanding of the CRE of AI. Although existing research indicates that AI can reduce CES, there is limited analysis of the nonlinear characteristic of the CRE of AI. This paper, both theoretically and empirically, confirms that the improvement of AI development, marketization, human capital, digital infrastructure, economic development, openness, and government intervention level can magnify the marginal CRE of AI and lead to a nonlinear CRE of AI. Thirdly, our research employs more refined methodologies to gauge the AI development level (AIDL). Measuring the AIDL represents a contemporary research Frontier. Current research primarily relies on industrial robot data and AI patent data to assess AIDL. However, industrial robot data predominantly reflects the extent of intelligent manufacturing rather than offering a holistic evaluation of AIDL. Although AI patent data can offer a holistic evaluation of AIDL, previous studies have employed a limited set of keywords in their searches for AI patents. In contrast, our paper measures AIDL using a broader array of AI-related keywords.
The rest of our study is outlined as follows: Section 2 provides a systematic literature review. Section 3 introduces the theoretical framework and research hypotheses. Section 4 introduces the empirical models and details the sources of data. Section 5 provides the empirical results and discussion. Section 6 provides the conclusions, implications, and limitations.
2 Literature review
The literature pertinent to our research can be categorized into three key domains: the measurement of carbon emission level (CEL) and the influencing factors of CES, the measurement of AIDL, and the impact of AI on CES.
2.1 The measurement of CEL and the influencing factors of CES
Currently, there are four proxy variables employed to characterize CEL. The initial proxy variable is the total CES (Wang et al., 2023b; Ding et al., 2023; Tang and Yang, 2023). Some scholars have developed carbon emission databases containing total CES data (Shan et al., 2020). Furthermore, a positive correlation exists between satellite light data and total CES, prompting some scholars to derive total CES based on satellite light data (Meng et al., 2023). The second proxy variable pertains to carbon density, quantified as the ratio of total CES to GDP (Chen P. et al., 2022; Li et al., 2022; Tang and Yang, 2023), the ratio of total CES to the value added by the secondary industry (Yi et al., 2022), or the ratio of industry energy-related CES to industry sales value (Liu et al., 2022). The third proxy variable relates to per capita CES, determined by dividing total CES by the year-end population (Wang et al., 2023b; Tang and Yang, 2023). The fourth proxy variable is carbon emission performance, a measure that considers both economic development and total CES. Typically, it is assessed using a Data Envelopment Analysis (DEA) model featuring multiple input and output indicators (Zhang W. et al., 2022).
Existing research indicates that numerous factors can influence CES. For example, economic development, per capita income, population size, technological advancement, green technology innovation, openness, urbanization, industrial concentration, industrial upgrading, energy regulations, energy demand, energy consumption, energy intensity, energy prices, energy structure, energy efficiency, energy innovations, human capital, carbon taxation, financial development, transportation infrastructure, environmental regulation, marketization, green total factor productivity (GTFP), working hours, digital economy, and AI can influence CES (Chen Y. et al., 2022; Zhang X. et al., 2022; Li et al., 2022; Yi et al., 2022; Wang et al., 2023b; Ding et al., 2023; Meng et al., 2023; Tang and Yang, 2023; Yanzhe and Ullah, 2023).
2.2 The measurement of AIDL
Given the rapid development, extensive application, and the challenge of defining precise boundary and composition for AI, an ongoing debate persists regarding the measurement of AIDL (Damioli et al., 2021; Bianchini et al., 2023). Consequently, a consensus on the measurement of AIDL remains elusive. Presently, there are five proxy variables utilized to gauge AIDL. The first proxy variable is the frequency of AI-related terms appearing in the reports of publicly listed companies (Zhang W. et al., 2022) or in the annual government work reports (Tang and Yang, 2023). The second proxy variable is the industrial robot data sourced from the International Federation of Robotics (IFR). This encompasses metrics such as the increment of industrial robots (Li and Tian, 2023), the increment of industrial robots per worker (Chen Y. et al., 2022), the stock of industrial robots (Zhang X. et al., 2022; Liu et al., 2022; Wang et al., 2023b; Li and Tian, 2023), the stock of industrial robots per unit of GDP (Li et al., 2022), the stock of industrial robots per worker (Chen P. et al., 2022; Chen et al., 2022 Y.; Li et al., 2022; Lv et al., 2022; Vorozheykina, 2022; Yang and Shen, 2023), and the adjusted penetration of industrial robots (Acemoglu and Restrepo, 2020; Chen Y. et al., 2022). The third proxy variable relates to the number of AI patents (Damioli et al., 2021; Yang, 2022; Bianchini et al., 2023). The fourth proxy variable involves AI-related research paper counts (Li et al., 2022). The fifth proxy variable employs an AI Index (Ding et al., 2023; Maslej et al., 2023), typically exemplified by Stanford University’s AI Index (Maslej et al., 2023).
2.3 The impact of AI on CES
Extensive research has highlighted the dual nature of AI’s impact on CES, encompassing both reduction and increase (Chen P. et al., 2022; Kaack et al., 2022; Cowls et al., 2023). On the one hand, AI has the potential to reduce CES through various pathways. AI can reduce CES by fostering green technology innovation, improving energy efficiency, and driving industrial upgrading (Elnour et al., 2022b; Himeur et al., 2022; 2023; Ding et al., 2023). The deployment of industrial robots can diminish CES by promoting green technology innovation, optimizing the industry structure, enhancing digital infrastructure, improving GTFP, lowering energy intensity, driving technological innovation, promoting research and development investment, encouraging manual labour substitution, saving work time, and promoting green employment (Chen P. et al., 2022; Chen et al., 2022 Y.; Elnour et al., 2022a; Li et al., 2022; Meng et al., 2022; Wang et al., 2023b; 2024; Li and Tian, 2023).
On the other hand, AI can also contribute to a surge in CES through various channels. First, the operation of computationally intensive industrial robots will consume substantial energy and will generate CES (Wang et al., 2023b). Training and deploying large AI models, such as ChatGPT, can generate substantial CES (An et al., 2023). Second, in addition to being responsible for the CES generated during the operational phase, AI devices should also share responsibility for the embodied emissions resulting from other stages of its life cycle, including the raw material extraction phase, manufacturing phase, transportation phase, and hardware disposal phase (Kaack et al., 2022; Wu et al., 2022; Cowls et al., 2023). Third, the digital infrastructures supporting AI development have significantly contributed to increased CES by increasing energy consumption (Tang and Yang, 2023). Last, AI’s capacity to enhance production and consumption efficiency can result in a rebound effect, leading to increased production and consumption level and consequently, elevated CES (Kaack et al., 2022).
The dual nature of AI’s impact on CES sparks ongoing debate regarding the net effect of AI on CES. Presently, there exist three main perspectives regarding this point. The first perspective contends that the net effect of AI on CES is negative. This perspective has been substantiated by research conducted at various levels, including the city (Chen P. et al., 2022; Zhang W. et al., 2022; Wang et al., 2023b), provincial (Wang et al., 2023a; Ding et al., 2023), manufacturing industry (Liu et al., 2022; Li and Tian, 2023), and national (Chen Y. et al., 2022; Li et al., 2022) levels. Furthermore, the CRE of AI demonstrates spatial heterogeneity (Chen P. et al., 2022; Chen et al., 2022 Y.; Zhang W. et al., 2022; Li et al., 2022; Meng et al., 2022; Wang et al., 2023b; 2024; Ding et al., 2023), time heterogeneity (Liu et al., 2022), industry heterogeneity (Li et al., 2022; Liu et al., 2022; Li and Tian, 2023; Wang et al., 2024), and spatial spillover (Zhang W. et al., 2022; Ding et al., 2023) characteristics. Some scholars have also pointed out that the intensity of the CRE of AI is closely related to the scale of high-skilled labor, digital endowment, and the intensity of environmental regulation (Wang et al., 2024). The second viewpoint holds that the net effect of AI on CES is positive. This perspective has been substantiated by certain studies (Bianchini et al., 2023; Tang and Yang, 2023). For example, some scholars have suggested that the carbon increment effect of AI is weaker in regions with large green technology endowments (Bianchini et al., 2023). The third perspective considers the net effect of AI on CES to be uncertain. Some scholars have proposed that estimating the overall immediate impact of AI on CES is exceedingly challenging due to the absence of data on the deployment rate of AI, the diversity of application areas, and the lack of precise procedures to attribute emissions effect to AI usage (Kaack et al., 2022). Some scholars have proposed that the development of AI does not necessarily lead to an immediate carbon emission effect, and AI can only reduce carbon emissions in the industrial sector when the level of intelligence reaches a certain threshold (Wang et al., 2024). Some scholars have also proposed that the impact of industrial robots on CES exhibits an inverted U-shaped relationship (Liu et al., 2024).
In summary, existing research has not systematically analyzed the impact mechanisms and effects of AI on CES. There is a shortfall in revealing the nonlinear CRE of AI and precisely measuring the AIDL. The main purpose of this paper is to address these gaps by utilizing provincial panel data from China.
3 Theoretical analysis and hypotheses development
3.1 The net effect of AI on CES
AI can both reduce and increase CES. On the one hand, AI can reduce CES. Firstly, AI can play a pivotal role in guiding scientists, governments, and individuals to mitigate CES (Yi et al., 2022; Al-Nefaie and Aldhyani, 2023; Hu and Man, 2023; Nassef et al., 2023; Zadmirzaei et al., 2023; Zhao et al., 2023). Secondly, AI assumes a crucial role in promoting the innovation, dissemination, and adoption of green technologies (Chen P. et al., 2022; Li et al., 2022), thereby reducing CES. Thirdly, AI, which plays a crucial role in accelerating the shift of energy supply structure and energy consumption structure from a high CES scenario to a low CES scenario, is effective in mitigating CES (Chen Y. et al., 2022; Yi et al., 2022). Fourthly, AI contributes to CES reduction by facilitating the industrial structure with high CES transfer to the industrial structure with low CES (Chen P. et al., 2022; Ding et al., 2023). Fifthly, AI can enhance energy efficiency and GTFP (Paryanto et al., 2015), thereby mitigating energy consumption and CES. Sixthly, AI contributes to CES reduction by reducing trade-related costs and enhancing openness, because enhanced openness can attract foreign enterprises with advanced green technologies and management practices. Lastly, AI plays a vital role in carbon reduction by enhancing the efficiency of carbon capture (Priya et al., 2023).
On the other hand, AI can also increase CES. Firstly, AI system, including AI models and AI devices, is carbon-intensive due to its heavy energy reliance, continuous upgrading, and widespread utilization (Strubell et al., 2019; Kaack et al., 2022; Bianchini et al., 2023; Bieser et al., 2023; Cowls et al., 2023; Jean-Quartier et al., 2023). Secondly, AI has the potential to impede the transition to a more sustainable energy structure, consequently contributing to increased CES. For instance, oil companies can utilize AI to extract and sell oil and gas more efficiently, which could hinder the energy structure transformation. Thirdly, AI may lead to a rebound effect in production and consumption, consequently resulting in increased CES (Huang et al., 2022; Kaack et al., 2022). Lastly, AI can potentially contribute to increased CES by enhancing openness and expanding the scale of trade. Drawing upon the above, this paper proposes the following hypothesis:
Hypothesis 1. Although AI can exert both positive and negative impact on CES, but the CRE of AI is greater, and the net effect is a reduction in CES.
3.2 The nonlinear CRE of AI
The nonlinear CRE of AI primarily stems from two aspects. On the one hand, change in the AIDL can affect the marginal CRE of AI, thereby leading to a nonlinear CRE of AI. Data, computational infrastructure, and algorithms constitute the pivotal elements of the AI system. Unlike other inputs, data often yields increasing marginal return, thereby leading to an increasing marginal CRE of AI and a nonlinear CRE of AI. For example, as the scale of data grows, AI models trained on data can become more precise in predicting CES and can offer more possibilities to promote carbon reduction. Some scholars have observed an increasing positive marginal effect of intelligent manufacturing on industrial GTFP (Yang and Shen, 2023). Therefore, this paper proposes the following hypothesis:
Hypothesis 2. The enhancement of AIDL can magnify the marginal CRE of AI and lead to a nonlinear CRE of AI.
On the other hand, variations in other factors that facilitate the innovation and implementation of AI technologies can also impact the marginal CRE of AI, thereby leading to a nonlinear CRE of AI. Firstly, change in the level of marketization can impact the marginal CRE of AI and lead to a nonlinear CRE of AI. Increased marketization can enhance the ability to optimize resource allocation and provide more opportunities in the market to unlock the business potential of technologies (Yi et al., 2022). Consequently, a higher degree of marketization encourages the innovation and application of AI technologies, thereby magnifying the marginal CRE of AI and leading to a nonlinear CRE of AI. Secondly, change in the level of human capital can influence the marginal CRE of AI and lead to a nonlinear CRE of AI. AI comprises a complex technological ecosystem. Undoubtedly, the innovation and application of AI technologies pose substantial challenges. Thus, a higher level of human capital enables a more effective identification, innovation, absorption, and application of AI technologies, drawing upon prior relevant knowledge, thereby magnifying the marginal CRE of AI and leading to a nonlinear CRE of AI. Thirdly, change in the level of digital infrastructures can influence the marginal CRE of AI and lead to a nonlinear CRE of AI. Data is pivotal in both the development and application of AI technologies. A higher level of digital infrastructures can enhance the generation, collection, storage, transmission, and analysis of valuable data. Consequently, improved digital infrastructures foster the advancement and utilization of AI technologies, thereby magnifying the marginal CRE of AI and leading to a nonlinear CRE of AI. Fourthly, change in the level of economic development can influence the marginal CRE of AI and lead to a nonlinear CRE of AI. Greater economic development will amplify the capacity and demand for AI products and services. This, in turn, promotes the innovation and application of AI technologies, further magnifying the marginal CRE of AI and leading to a nonlinear CRE of AI. Fifthly, change in the level of openness can influence the marginal CRE of AI and lead to a nonlinear CRE of AI. A higher level of openness translates to more opportunities for acquiring new knowledge. Consequently, greater openness facilitates the identification, innovation, absorption, and application of AI technologies, thereby magnifying the marginal CRE of AI and leading to a nonlinear CRE of AI. Lastly, change in the level of government intervention can influence the marginal CRE of AI and lead to a nonlinear CRE of AI. AI is recognized as a strategic technology, prompting many countries to implement policies aimed at fostering its innovation and application. Therefore, a higher level of government intervention accelerates the pace of innovation and application of AI technologies, thereby magnifying the marginal CRE of AI and leading to a nonlinear CRE of AI. Drawing upon the above, this paper proposes the following hypothesis:
Hypothesis 3. The improvement of marketization, human capital, digital infrastructures, economic development, openness, and government intervention level can magnify the marginal CRE of AI and lead to a nonlinear CRE of AI.
4 Models and data
4.1 Models
This paper will employ the following model to test whether the net effect of AI on CES is negative (Li et al., 2022):
where,
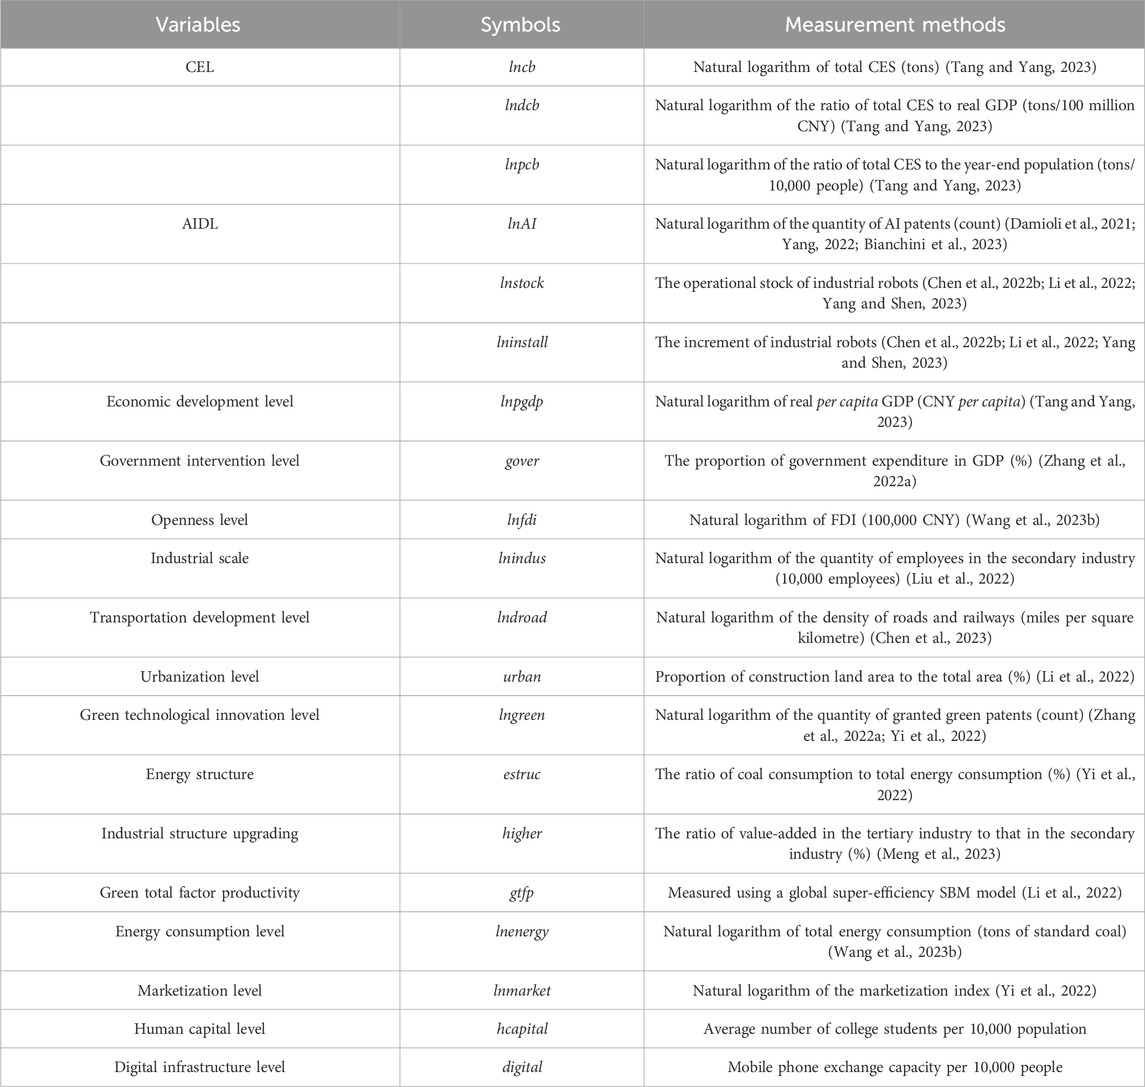
Table 1. The variable symbols and measurement methods.
As depicted in Table 1. To demonstrate the robustness of the empirical results, this article will adopt three methods to measure the CEL in the empirical analysis.
As shown in Table 1. To demonstrate the robustness of the empirical results, this paper will also adopt three methods to measure the AIDL in the empirical analysis. First, this study will use the number of AI patents to characterize the AIDL. Several studies have chosen the quantity of AI patents (lnAI) to characterize the AIDL (Damioli et al., 2021; Yang, 2022; Bianchini et al., 2023). However, identifying AI patents is not a straightforward task, as there is no unified criterion for their identification, unlike green patents. To address this challenge, most studies begin by selecting keywords related to AI and then extract the quantity of AI patents from the patent database using a keyword-matching approach (Damioli et al., 2021; Yang, 2022; Bianchini et al., 2023). In this paper, we will also extract the quantity of AI patents from the patent database based on a keyword-matching approach. Table 2 shows the keywords related to AI, drawing from existing studies and the AI category (Damioli et al., 2021; Yang, 2022; Bianchini et al., 2023). In comparison with previous research, this paper adopts a more extensive list of AI-related keywords and further categorizes them into hardware, software, and application layers.
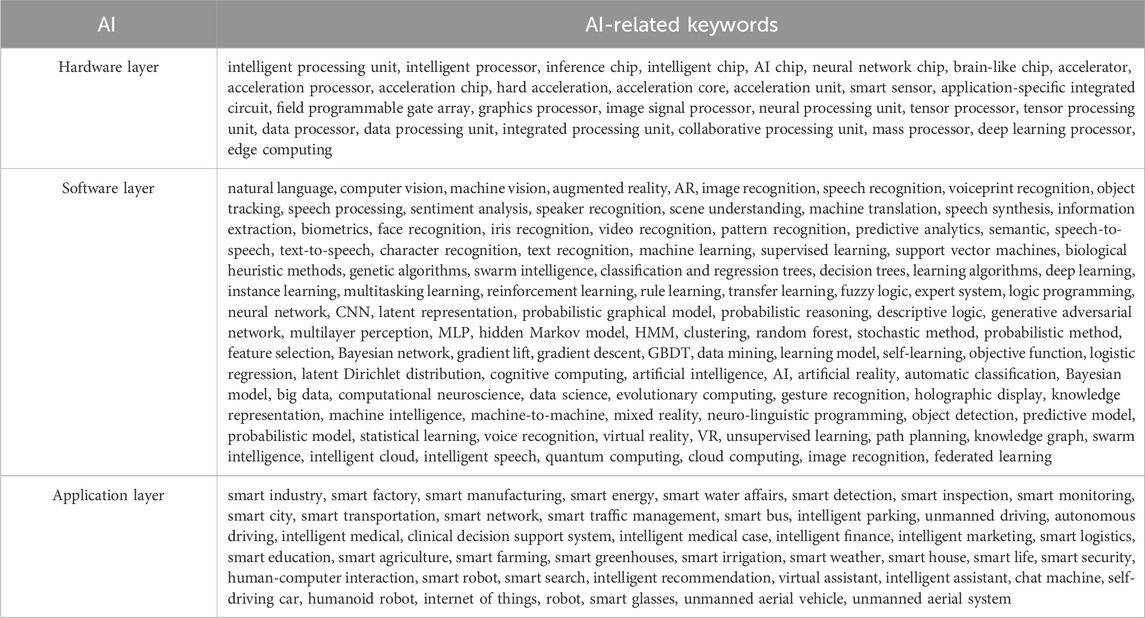
Table 2. AI-related keywords for extracting the number of AI patents.
Second, we will use both the cumulative inventory of operational industrial robots and the growth in the quantity of industrial robots to measure the AIDL. Following the methodology of related studies (Chen Y. et al., 2022; Li et al., 2022; Yang and Shen, 2023), we can obtain the cumulative inventory of operational industrial robots (lnstock) and the growth in the quantity of industrial robots (lninstall) at the provincial level, which can be measured as follows:
where,
This paper will employ the following model to test whether the improvement of AIDL can magnify the marginal CRE of AI and lead to a nonlinear CRE of AI (Li et al., 2022):
where,
This paper will employ the following models to test whether the improvement of marketization, human capital, digital infrastructures, economic development, openness, and government intervention level can magnify the marginal CRE of AI and lead to a nonlinear CRE of AI (Li et al., 2022), respectively:
where,
4.2 Data sources
A balanced panel dataset comprising 30 Chinese provinces for the period spanning 1997–2019 has been used in this study. Tibet, Hong Kong, Macao, and Taiwan are excluded from the analysis because of data unavailability. Missing data has been imputed using the interpolation method. For all currency-measured variables, the influence of inflation has been removed by using the GDP index of each province, with the base period price level set at 1998. The natural logarithm has been applied to some variables to ensure data stability and address heteroscedasticity issues. Table 3 shows the results of descriptive statistics and the data sources of variables.
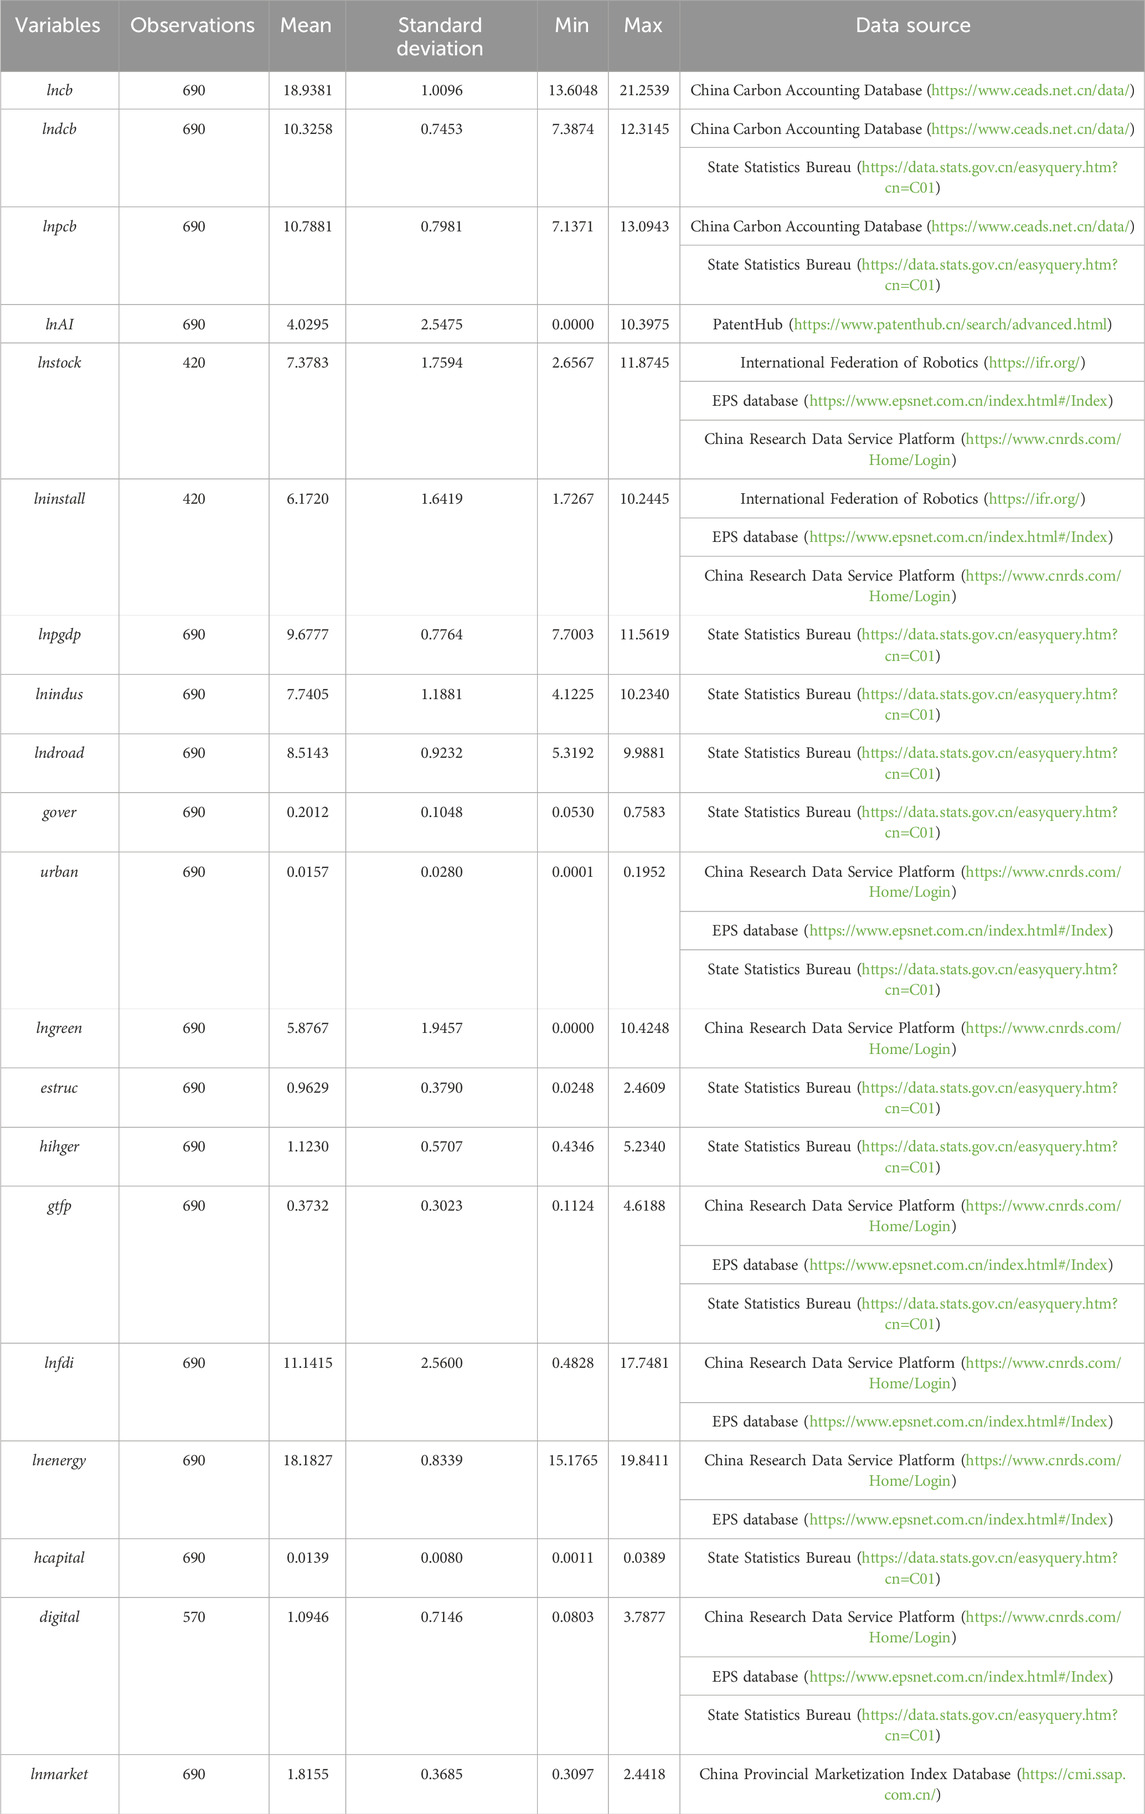
Table 3. The results of descriptive statistics and the data sources of variables.
5 Results and discussion
5.1 The spatial and temporal characteristics of the development of AI in China
Figure 1 demonstrates the chronological evolution of the number of AI patents in China from 1997 to 2019. In Figure 1, we characterize the temporal evolution of AI patent counts in China during the study period using two indicators: the total number of AI patents per year and the average number of AI patents per province per year. Two significant observations can be made from Figure 1. First, both indicators show a growth trend, indicating that the number of AI patents in China has been increasing consistently. Second, the values of both indicators have shown an accelerated growth trend since 2012, especially after 2014, with a significantly faster growth rate. This is attributed to the breakthrough advancements made in AI technologies such as deep learning, image recognition, natural language processing, and intelligent chips during this period. For instance, in 2012, Google’s deep learning algorithm achieved a breakthrough performance in the ImageNet image recognition competition. This demonstrates that the AI patent data used in this study can effectively capture the evolution of AI technology development. It further reinforces the scientific validity of the AI patent data employed in this research.
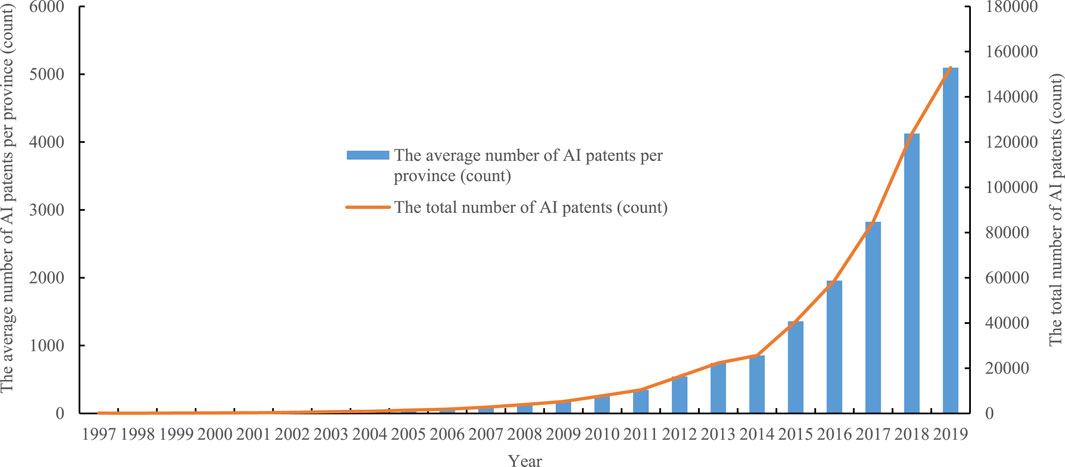
Figure 1. The chronological evolution of the number of AI patents in China from 1997 to 2019.
Table 4 presents the spatial distribution of the number of AI patents across China’s provinces in certain years. From Table 4, it can be observed that the provinces with a high level of economic development and technological innovation capability, such as Beijing, Tianjin, Liaoning, Shanghai, Jiangsu, Zhejiang, Anhui, Fujian, Shandong, Guangdong, Henan, Hubei, Hunan, Shaanxi, Sichuan, and Chongqing, possess a larger number of AI patents. This indicates that AI technological innovation is closely related to the level of economic development and technological innovation capability.
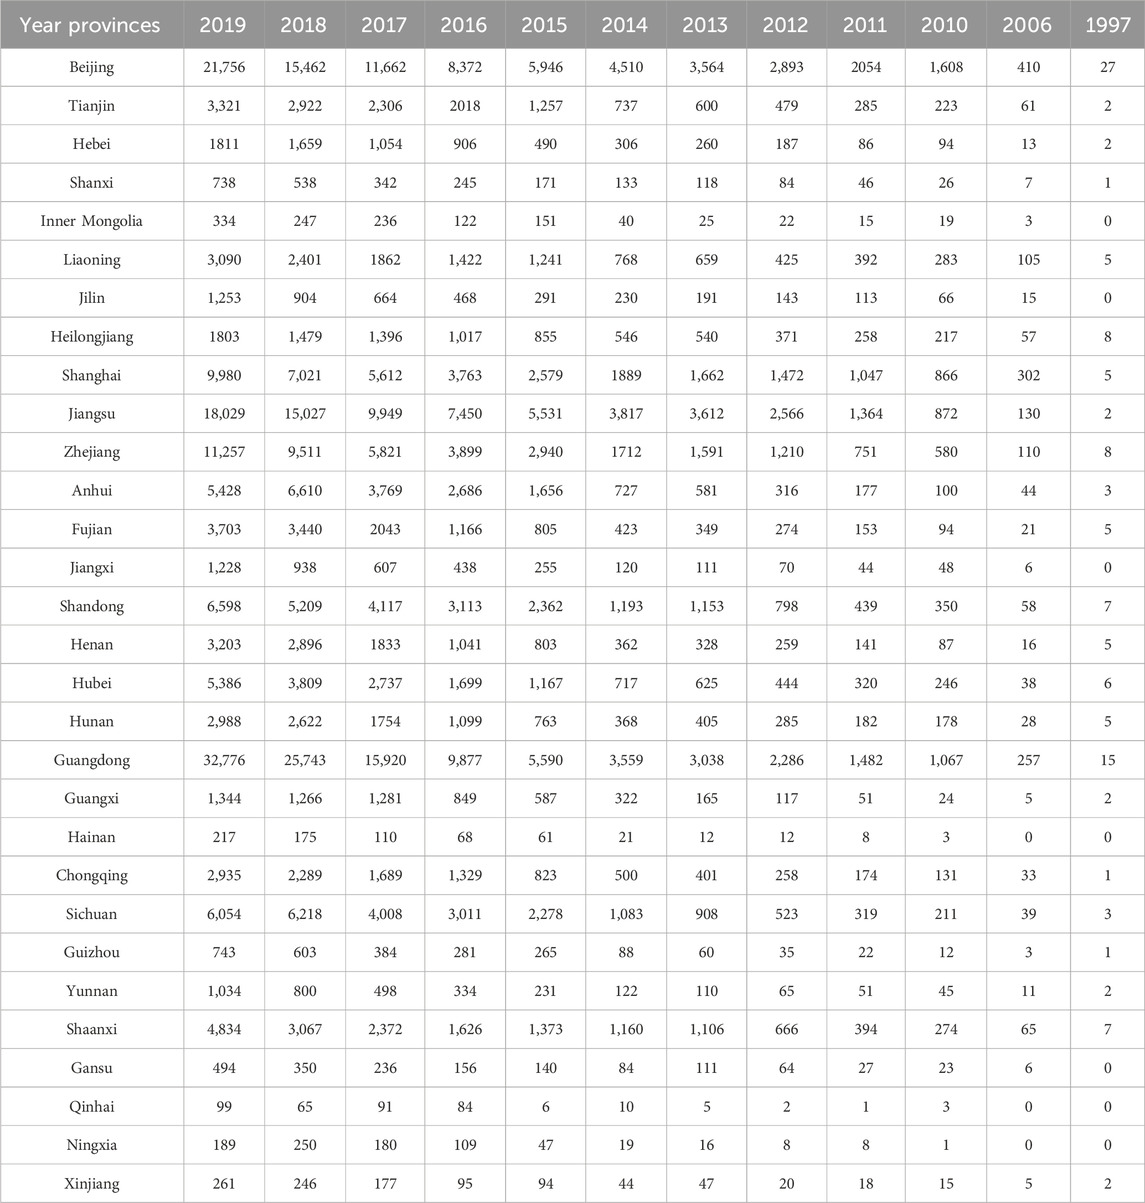
Table 4. The spatial distribution of the number of AI patents in China’s provinces in some years.
5.2 Results of the AI’s CRE test
5.2.1 Results of baseline regression
Table 5 shows the results based on Formula 1. Three findings can be obtained. First, it can be found from the model 5A-5C that when adopting different dependent variables, the AI coefficients are highly significant and exhibit negative values. The results imply that although AI can exert both positive and negative impacts on CES, the CRE of AI is more substantial. In other words, the net effect of AI on CES is negative, and the Hypothesis 1 can be supported. This finding aligns with the conclusion in existing research (Ding et al., 2023). Second, when replacing the core explanatory variable, related coefficients in model 5D-5I also exhibit negative values although some coefficients are insignificant. The results can provide support for Hypothesis 1 again. Third, the CRE of AI in model 5A-5C is greater than that in model 5D-5I. The results indicate that measuring the AIDL based on Formula 2 would underestimate the CRE of AI. Instead, employing the quantity of AI patents to gauge the AIDL can provide a more scientifically accurate measurement of the AI’s CRE. Therefore, in the following sections, we will continue our analysis by using AI patent data.
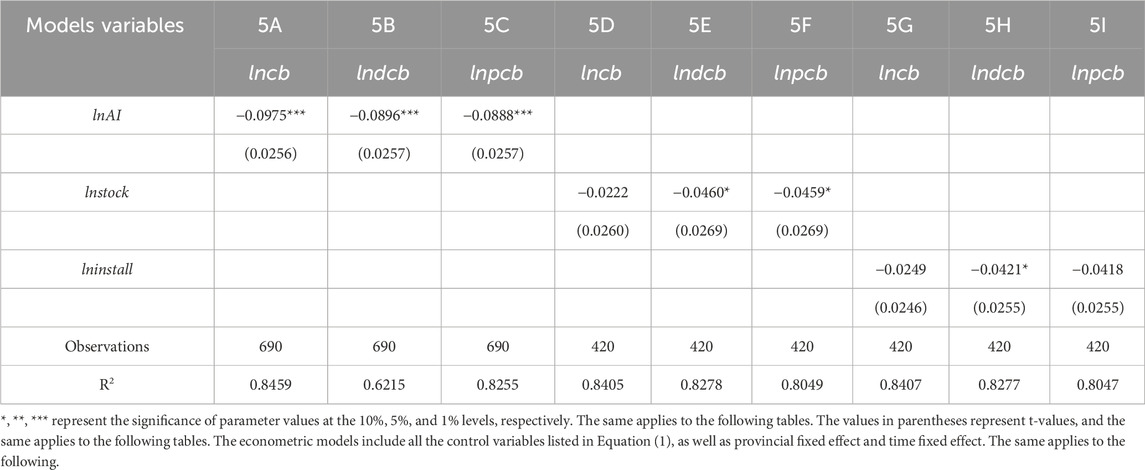
Table 5. The results of baseline regression.
5.2.2 Results of endogenous processing
Endogeneity issue may be present in this study for several reasons. Firstly, there could be a reverse causality relationship between AI and CES. For instance, AI can reduce CES, and regions with higher CES may have a stronger incentive to adopt AI for carbon reduction. Secondly, errors may arise due to missing variables. Although the current model incorporates some control variables, certain factors influencing CES may not have been included. Lastly, measurement errors may exist in the model because some variables used in this study may not have been precisely measured due to data availability. Consequently, this paper aims to address the endogeneity problem using the instrumental variable (IV) method.
The IV chosen must exhibit a strong association with AI while being unrelated to the error term. In this research, we utilize a lagged phase of AI as the IV for endogeneity testing (Liu et al., 2022; Wang et al., 2023b). Table 6 presents the results of the endogeneity treatment. Model 6A details the first-stage empirical outcomes of the 2SLS method, and the second-stage empirical results provided in model 6B. Firstly, the null hypothesis regarding the IV’s identifiability can be rejected because the Anderson canon. corr. LM statistic is significant. The null hypothesis of weak IV can also be rejected since the Cragg-Donald Wald F statistic is significant. Because the model 6A passes the Anderson-Rubin Wald test, the null hypothesis that the sum of endogenous regression coefficients equals zero can be rejected. The above tests indicate that the IV we selected is appropriate. Secondly, in model 6B, the AI coefficient is significantly negative, reaffirming AI’s capacity to decrease CES. This outcome aligns with the results in Table 5. Thirdly, the results in model 6C and 6D are similar to the results in model 6B. The results imply that when adopting different dependent variables, the results of the endogeneity treatment are robust.
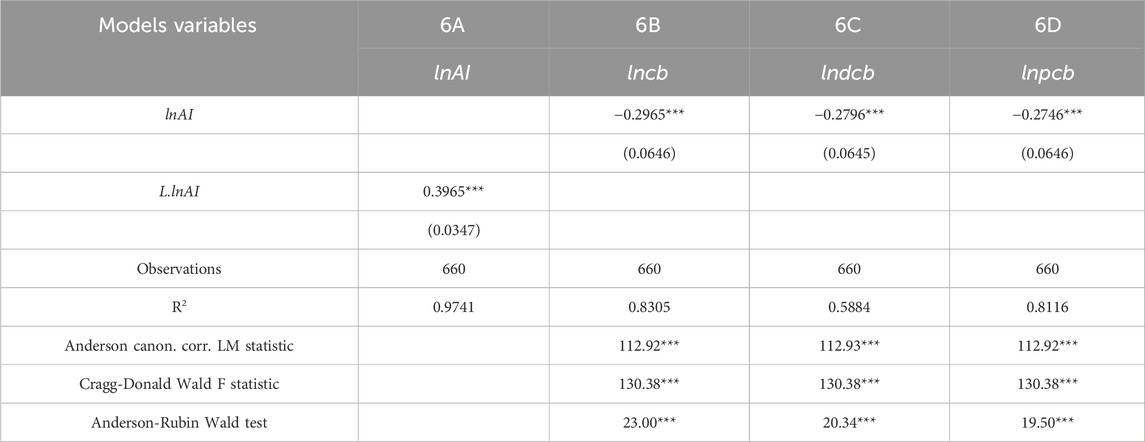
Table 6. The results of endogenous processing.
5.2.3 Results of spatial heterogeneity analysis
Variations in AIDL and CEL exist among different regions in China due to disparities in resource endowments, developmental phases, and national policies (Ding et al., 2023). To investigate whether there is spatial heterogeneity in the CRE of AI, this research classifies the 30 provinces into eastern, central, and western regions. Table 7 shows related results. Two findings can be obtained. Firstly, it is evident that when adopting different dependent variables, most of the coefficients of AI are highly significant and exhibit negative values although some of the coefficients of AI in the western region are insignificant. The results imply that the net effect of AI on CES is negative in three regions, reaffirming the validity of Hypothesis 1. This finding aligns with the conclusion of existing research (Ding et al., 2023). Secondly, the absolute value of the AI coefficient in model 7A is less than that in model 7B and 7C, the absolute value of the AI coefficient in model 7D is greater than that in model 7E and 7F, and the absolute value of the AI coefficient in model 7G is greater than that in model 7H, and 7I. The results indicate that, relative to the central and western regions, AI has significant achievement in reducing carbon intensity and per capita CES in the eastern region. However, there is still room for improvement in terms of reducing the total CES in the eastern region. The eastern region has been the most active in technological innovation in China, with a significant advantage in the innovation and application of AI technologies. Therefore, AI can effectively reduce carbon intensity and per capita CES in the eastern region. The eastern region has also experienced the fastest economic and population growth in China, leading to continuous growth in CES. Thus, AI has limited impact on reducing the total CES in the eastern region.
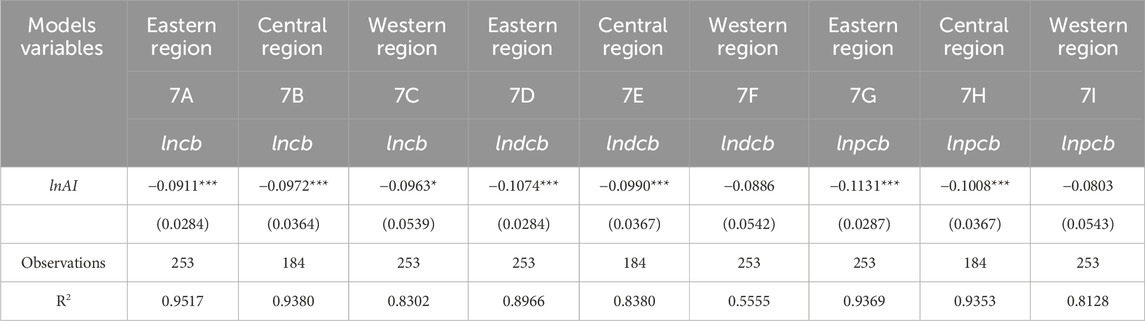
Table 7. The results of spatial heterogeneity analysis.
5.2.4 Results of time heterogeneity analysis
Figure 1 indicates that China has experienced rapid growth in AI patent counts since 2012. Given this, we hypothesize that there may be temporal heterogeneity in the impact of AI on CES in China. Therefore, we will use 2012 as a temporal dividing point to investigate the temporal heterogeneity of AI’s influence on CES. Table 8 presents the results of our model estimations. Two key findings emerge from Table 8. First, the coefficients for AI in models 8A-8F are all negative, indicating the consistent existence of a CRE attributed to AI development. Second, compared to the AI coefficients in models 8B, 8D, and 8F, the coefficients in models 8A, 8C, and 8E are not only highly significant but also have absolute values much larger than those in models 8B, 8D, and 8F. This suggests that the CRE of AI was greater during the period from 1997 to 2011 than during the period from 2012 to 2019. We can interpret this phenomenon from two perspectives. First, while AI development does lead to a CRE, this effect may require a longer period to be observable. Second, the rapid growth of AI may lead to carbon emission increases through increased electricity consumption, consumer rebound effect, and other channels, thereby reducing the CRE attributed to AI development.
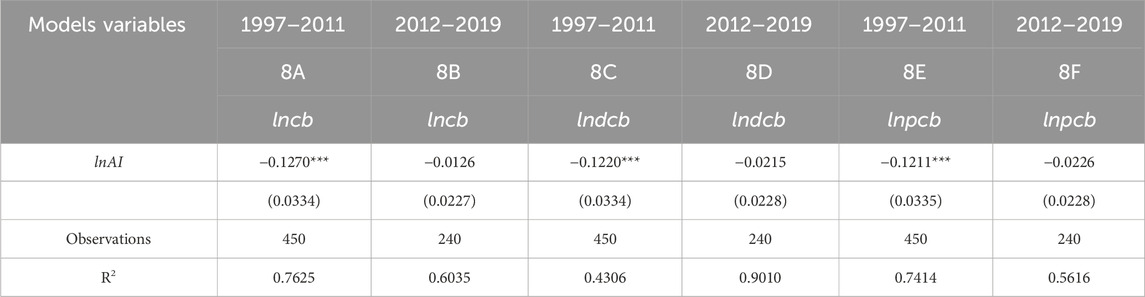
Table 8. The results of time heterogeneity analysis.
5.3 Results of the nonlinear CRE test of AI
5.3.1 The nonlinear CRE of AI development
We can analyze the nonlinear impact of AI on CES based on the marginal effect of AI on CES, and the marginal effect of AI on CES can be estimated through the econometric model. Figure 2 shows related results based on Formula 3. Two findings can be obtained. Firstly, As illustrated in Figure 2, the marginal effect of AI on CES consistently remains below zero and passes the significance test in each subplot. The results mean that the net effect of AI on CES is negative, and Hypothesis 1 can be supported again. Secondly, it can also be observed that with increasing AIDL, the absolute value of the marginal effect in each subplot grows. The results mean that the CRE of AI follows a nonlinear trend, and a higher AIDL correspond to a more significant CRE. In other words, improving the AIDL can magnify the marginal CRE of AI and lead to a nonlinear CRE of AI. Thus, Hypothesis 2 can be supported.
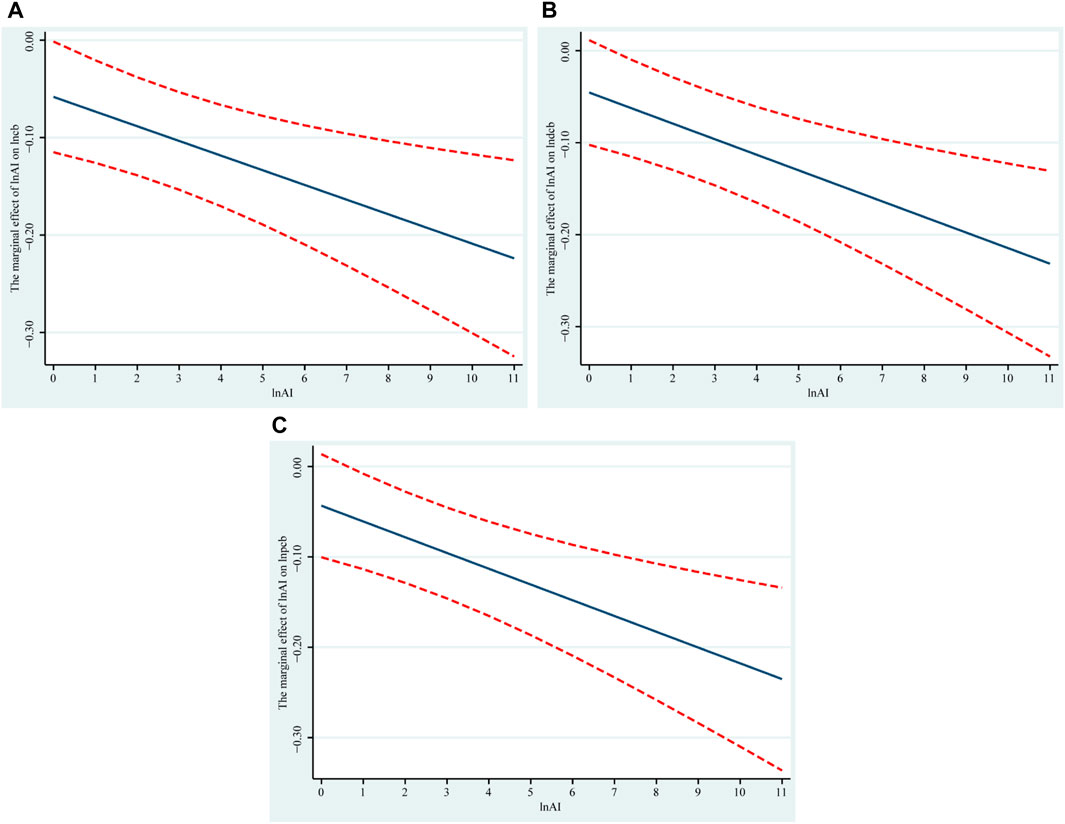
Figure 2. (A–C) respectively show the marginal effect of AI on the total CES, carbon intensity, and per capita CES. The blue line in each picture describes the trend of the marginal effect of AI on CES, and the red curve in each picture represents a 95% confidence interval.
5.3.2 The nonlinear CRE of AI due to changes in other factors
Even if the AIDL remains constant, improving the level of marketization, human capital, digital infrastructure, economic development, openness, and government intervention can also amplify the marginal CRE of AI and lead to a nonlinear CRE of AI. Figure 3 presents related results based on Formula 4–9. Three valuable discoveries can be gleaned. Firstly, as illustrated in Figure 3, within the range of distributions for other factors, the marginal effect of AI on CES is significantly negative in each subplot. The results mean that the net effect of AI on CES is negative, and Hypothesis 1 can be supported again. Secondly, it can also be observed from Figure 3 that with the improvement in the level of these factors, the absolute values of the marginal effect of AI on CES demonstrate a rising pattern. The results imply that these factors can magnify the marginal CRE of AI and lead to a nonlinear CRE of AI. Thus, Hypothesis 3 can be supported. Thirdly, it is important to highlight that the absolute values of the marginal effect of AI on CES in Figures 3B, C escalate more rapidly in comparison to Figure 3A, D–F. The outcomes imply that, among these factors under examination, human capital and digital infrastructure exert a more pronounced influence on magnifying the marginal CRE of AI. One possible reason is that innovation capability and data can play crucial roles in the innovation and application of AI technologies. Compared to other factors, human capital serves as a significant support for technological innovation, and digital infrastructure is a critical foundation for data collection and processing.
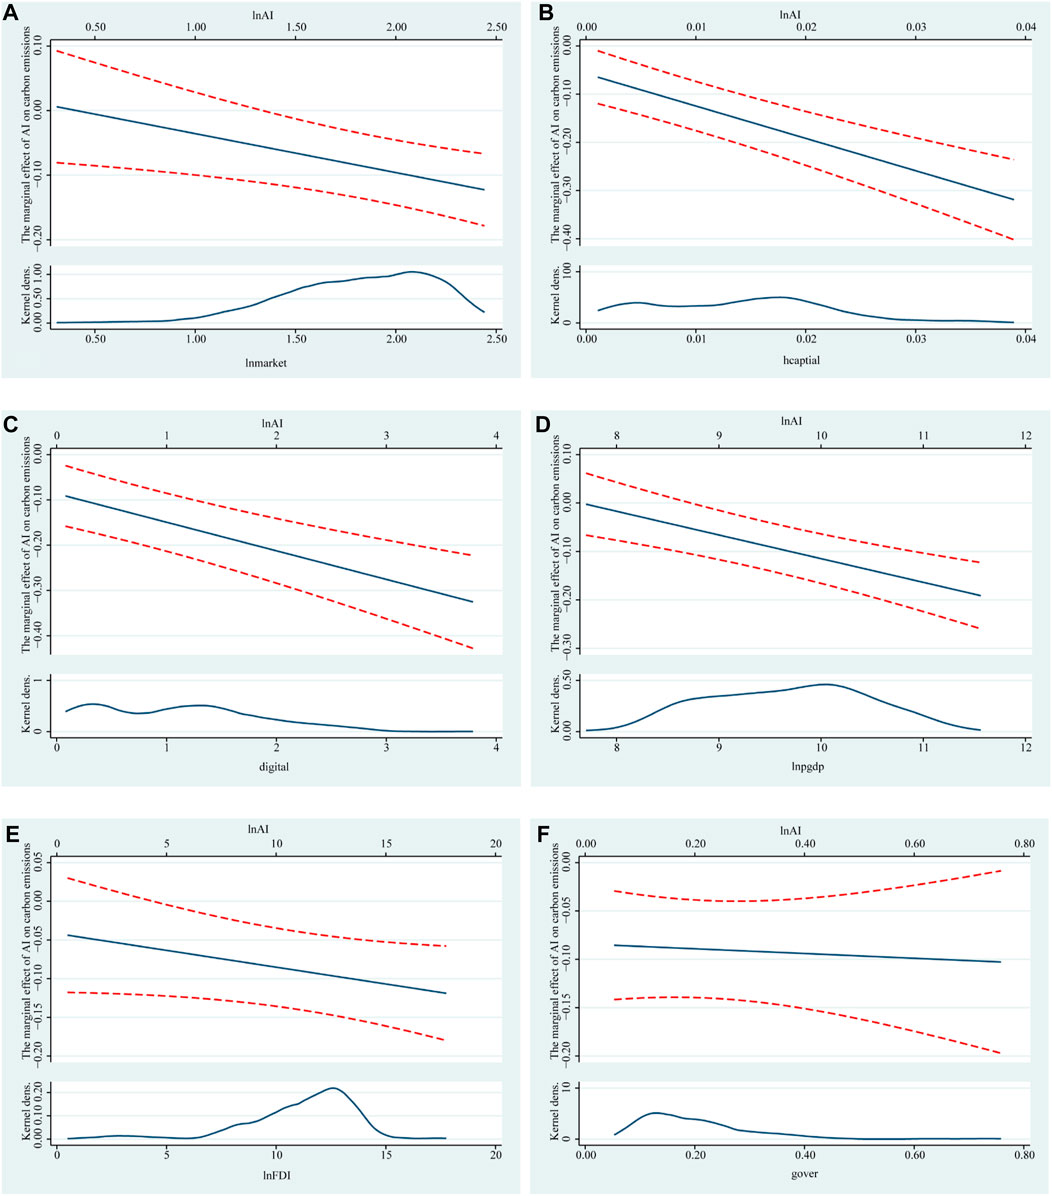
Figure 3. (A–F) respectively show the marginal effect of AI on carbon intensity when improving the level of marketization, human capital, digital infrastructure, economic development, openness, and government intervention. The blue line in each picture describes the trend of the marginal effect of AI on CES, and the red curve in each picture represents a 95% confidence interval. The bell-shaped curve in each picture depicts the distribution density of each variable.
5.4 Discussion
The above results can be discussed from two perspectives. The first perspective is the CRE of AI. The findings in this study indicate that AI can reduce CES, further confirming existing research viewpoints (Li et al., 2022). However, in contrast to existing research, this study also reveals that using the quantity of industrial robots to measure AIDL might underestimate the CRE of AI. The second perspective is the nonlinear CRE of AI. There has been limited focus in existing research on the nonlinear CRE of AI, whereas this paper places particular emphasis on this aspect. The results in this study suggest that increasing AIDL can amplify the marginal CRE of AI and lead to a nonlinear CRE of AI. However, some scholars have proposed that the impact of industrial robots on CES exhibits an inverted U-shaped relationship (Liu et al., 2024). This result indicates that increasing AIDL will first raise the CES before eventually reducing CES. This result differs somewhat from the findings of this paper. The discrepancy may be due to the different methods used to measure AIDL in the two studies. Additionally, the results in this study suggest that even if the AIDL remains constant, changes in other factors can also amplify the marginal CRE of AI and lead to a nonlinear CRE of AI. While existing research has indicated that enhancing technological absorption capacity can strengthen the CRE of AI (Li et al., 2022), this study suggests that there are additional factors, including marketization, human capital, digital infrastructure, economic development, openness, and government intervention, can amplify the marginal CRE of AI and lead to a nonlinear CRE of AI. Another novel finding relative to existing research is human capital and digital infrastructure can play the most significant role in amplifying the CRE of AI.
6 Conclusion and implications
6.1 Conclusion
The principal findings are as follows. Firstly, during the study period, the number of AI patents in China has shown a continuous growth trend. Since 2012, the growth of AI patents in China has accelerated, especially after 2014, when the number of AI patents in China entered a stage of rapid growth. Secondly, the provinces with a high level of economic development and technological innovation capability, such as Beijing, Tianjin, Liaoning, Shanghai, Jiangsu, Zhejiang, Anhui, Fujian, Shandong, Guangdong, Henan, Hubei, Hunan, Shaanxi, Sichuan, and Chongqing, possess a larger number of AI patents. Thirdly, although AI can exert both positive and negative impacts on CES, the CRE of AI is more substantial. This conclusion holds true even after considering robustness, endogeneity, and spatial heterogeneity. It is worth noting that employing the quantity of AI patents to gauge the AIDL can provide a more scientifically accurate measurement of the AI’s CRE. Fourthly, relative to the central and western regions, AI has significant achievement in reducing carbon intensity and per capita CES in the eastern region. However, there is still room for improvement in terms of reducing the total CES in the eastern region. Fifthly, the CRE of AI was greater during the period from 1997 to 2011 than during the period from 2012 to 2019. Sixthly, improving the AIDL can magnify the marginal CRE of AI and lead to a nonlinear CRE of AI. Lastly, even if the AIDL remains constant, changes in other factors such as marketization, human capital, digital infrastructure, economic development, openness, and government intervention can also amplify the marginal CRE of AI and lead to a nonlinear CRE of AI.
6.2 Implications
Based on the aforementioned conclusions, the following policy recommendations can be formulated. Firstly, facilitating AI technology innovation and leveraging AI for carbon reduction. AI can reduce CES, and improving the AIDL can magnify the marginal CRE of AI. Thus, the government should prioritize the development and utilization of AI. The enterprises should expedite the application of AI in various activities, including green energy production, the production of environmentally friendly products and services, carbon emission monitoring, carbon market trading, carbon sink management, and carbon capture technology innovation. Secondly, when assessing the CRE of AI, it is essential to utilize AI patent data and take into account the nonlinear CRE of AI. Employing the quantity of AI patents to gauge the AIDL can provide a more scientifically accurate measurement of the AI’s CRE, and the CRE of AI exhibits a nonlinear characteristic. Thus, government and research institutions should take these influences into account when assessing the CRE of AI. Lastly, optimizing the economic and social environment is crucial to fully unleash the carbon reduction potential of AI. Even if the AIDL remains constant, changes in other factors such as marketization, human capital, digital infrastructure, economic development, openness, and government intervention can also amplify the CRE of AI. Thus, the government, in the process of utilizing AI for carbon reduction, should not confine its focus solely to the development of AI but also consider the impact of other factors. For example, the government and other relevant stakeholders should refine the marketization, human capital, digital infrastructure, economic development, openness, and government intervention to amplify the CRE of AI.
The main potential challenges and practical considerations in implementing the recommended policies are follows: first, promoting AI development requires ensuring data security. However, managing and protecting data securely is a challenge. The government can introduce strict data privacy and security laws to ensure the protection of data. Second, as AI technology becomes more advanced, ethical and moral questions arise, such as the use of AI in decision-making processes that affect human lives. The government should establish ethical frameworks and guidelines for AI use. This can ensure that AI is used responsibly and does not harm human interests.
6.3 Limitations
The limitations in this study are as follows. Firstly, the research conclusions are drawn based on Chinese data, and the processes of CES and AI development in China may differ from other countries. Therefore, some research findings may not be applicable in other nations. Secondly, this paper only considers the roles of some factors, including marketization, human capital, digital infrastructure, economic development, openness, and government intervention, in amplifying the CRE of AI. There may be additional factors that can amplify the CRE of AI. Lastly, this article analyzes the impact of AI on CES using traditional panel econometric models. However, the impact of AI on CES may exhibit a spatial spillover effect, which suggests that the models used in this article still requires further improvement. In the future, a spatial panel econometric model will be employed to analyze the spatial spillover effect of AI on CES.
Data availability statement
The original contributions presented in the study are included in the article/supplementary material, further inquiries can be directed to the corresponding author.
Author contributions
XW: Conceptualization, Data curation, Investigation, Methodology, Software, Supervision, Validation, Visualization, Writing–original draft, Writing–review and editing. TX: Data curation, Investigation, Software, Supervision, Validation, Visualization, Writing–original draft.
Funding
The author(s) declare that financial support was received for the research, authorship, and/or publication of this article. This research was supported by the Major Project of the National Social Science Foundation of China (Grant No. 20&ZD068), the Jiangxi Province Graduate Innovation Fund Project (Grant No. YC2022-B078), the Science and Technology Research Project of Jiangxi Provincial Department of Education (Grant No. GJJ2209006), and the Theoretical Research and Innovation of Young Marxists in Jiangxi Province Project Fund Project (Grant No. 23ZXQM101).
Conflict of interest
The authors declare that the research was conducted in the absence of any commercial or financial relationships that could be construed as a potential conflict of interest.
Publisher’s note
All claims expressed in this article are solely those of the authors and do not necessarily represent those of their affiliated organizations, or those of the publisher, the editors and the reviewers. Any product that may be evaluated in this article, or claim that may be made by its manufacturer, is not guaranteed or endorsed by the publisher.
References
Acemoglu, D., and Restrepo, P. (2020). Robots and jobs: evidence from US labor markets. J. Polit. Econ. 128, 2188–2244. doi:10.1086/705716
Al-Nefaie, A. H. H., and Aldhyani, T. H. H. (2023). Predicting CO2 emissions from traffic vehicles for sustainable and smart environment using a deep learning model. Sustainability 15, 7615. doi:10.3390/su15097615
An, J., Ding, W., and Lin, C. (2023). ChatGPT: tackle the growing carbon footprint of generative AI. Nature 615, 586. doi:10.1038/d41586-023-00843-2
Bianchini, S., Damioli, G., and Ghisetti, C. (2023). The environmental effects of the “twin” green and digital transition in European regions. Environ. Resour. Econ. 84, 877–918. doi:10.1007/s10640-022-00741-7
Bieser, J. C. T., Hintemann, R., Hilty, L. M., and Beucker, S. (2023). A review of assessments of the greenhouse gas footprint and abatement potential of information and communication technology. Environ. Impact Assess. Rev. 99, 107033. doi:10.1016/j.eiar.2022.107033
Chen, P., Gao, J., Ji, Z., Liang, H., and Peng, Y. (2022a). Do artificial intelligence applications affect carbon emission performance? evidence from panel data analysis of Chinese cities. Energies 15, 5730. doi:10.3390/en15155730
Chen, S., Zhang, S., Zeng, Q., Ao, J., Chen, X., and Zhang, S. (2023). Can artificial intelligence achieve carbon neutrality? Evidence from a quasi-natural experiment. Front. Ecol. Evol. 11, 1151017. doi:10.3389/fevo.2023.1151017
Chen, Y., Cheng, L., and Lee, C.-C. (2022b). How does the use of industrial robots affect the ecological footprint? International evidence. Ecol. Econ. 198, 107483. doi:10.1016/j.ecolecon.2022.107483
Cowls, J., Tsamados, A., Taddeo, M., and Floridi, L. (2023). The AI gambit: leveraging artificial intelligence to combat climate change-opportunities, challenges, and recommendations. Ai Soc. 38, 283–307. doi:10.1007/s00146-021-01294-x
Damioli, G., Van Roy, V., and Vertesy, D. (2021). The impact of artificial intelligence on labor productivity. Eurasian Bus. Rev. 11, 1–25. doi:10.1007/s40821-020-00172-8
Ding, T., Li, J., Shi, X., Li, X., and Chen, Y. (2023). Is artificial intelligence associated with carbon emissions reduction? Case of China. Resour. Policy 85, 103892. doi:10.1016/j.resourpol.2023.103892
Elnour, M., Fadli, F., Himeur, Y., Petri, I., Rezgui, Y., Meskin, N., et al. (2022a). Performance and energy optimization of building automation and management systems: towards smart sustainable carbon-neutral sports facilities. Renew. Sustain. Energy Rev. 162, 112401. doi:10.1016/j.rser.2022.112401
Elnour, M., Himeur, Y., Fadli, F., Mohammedsherif, H., Meskin, N., Ahmad, A. M., et al. (2022b). Neural network-based model predictive control system for optimizing building automation and management systems of sports facilities. Appl. Energy 318, 119153. doi:10.1016/j.apenergy.2022.119153
Himeur, Y., Elnour, M., Fadli, F., Meskin, N., Petri, I., Rezgui, Y., et al. (2022). Next-generation energy systems for sustainable smart cities: roles of transfer learning. Sustain. Cities Soc. 85, 104059. doi:10.1016/j.scs.2022.104059
Himeur, Y., Elnour, M., Fadli, F., Meskin, N., Petri, I., Rezgui, Y., et al. (2023). AI-big data analytics for building automation and management systems: a survey, actual challenges and future perspectives. Artif. Intell. Rev. 56, 4929–5021. doi:10.1007/s10462-022-10286-2
Hu, Y., and Man, Y. (2023). Energy consumption and carbon emissions forecasting for industrial processes: status, challenges and perspectives. Renew. Sustain. ENERGY Rev. 182, 113405. doi:10.1016/j.rser.2023.113405
Huang, G., He, L.-Y., and Lin, X. (2022). Robot adoption and energy performance: evidence from Chinese industrial firms. Energy Econ. 107, 105837. doi:10.1016/j.eneco.2022.105837
Jean-Quartier, C., Bein, K., Hejny, L., Hofer, E., Holzinger, A., and Jeanquartier, F. (2023). The cost of understanding-XAI algorithms towards sustainable ML in the view of computational cost. COMPUTATION 11, 92. doi:10.3390/computation11050092
Kaack, L. H., Donti, P. L., Strubell, E., Kamiya, G., Creutzig, F., and Rolnick, D. (2022). Aligning artificial intelligence with climate change mitigation. Nat. Clim. Change 12, 518–527. doi:10.1038/s41558-022-01377-7
Li, X., and Tian, Q. (2023). How does usage of robot affect corporate carbon emissions? evidence from China’s manufacturing sector. Sustainability 15, 1198. doi:10.3390/su15021198
Li, Y., Zhang, Y., Pan, A., Han, M., and Veglianti, E. (2022). Carbon emission reduction effects of industrial robot applications: heterogeneity characteristics and influencing mechanisms. Technol. Soc. 70, 102034. doi:10.1016/j.techsoc.2022.102034
Liu, B., Yang, X., and Zhang, J. (2024). Nonlinear effect of industrial robot applications on carbon emissions: evidence from China. Environ. Impact Assess. Rev. 104, 107297. doi:10.1016/j.eiar.2023.107297
Liu, J., Liu, L., Qian, Y., and Song, S. (2022). The effect of artificial intelligence on carbon intensity: evidence from China’s industrial sector. Socioecon. Plann. Sci. 83, 101002. doi:10.1016/j.seps.2020.101002
Lv, H., Shi, B., Li, N., and Kang, R. (2022). Intelligent manufacturing and carbon emissions reduction: evidence from the use of industrial robots in China. Int. J. Environ. Res. Public. Health 19, 15538. doi:10.3390/ijerph192315538
Maslej, N., Fattorini, L., Brynjolfsson, E., Etchemendy, J., Ligett, K., Lyons, T., et al. (2023) The AI index 2023 annual report.
Meng, X., Xu, S., and Zhang, J. (2022). How does industrial intelligence affect carbon intensity in China? Empirical analysis based on Chinese provincial panel data. J. Clean. Prod. 376, 134273. doi:10.1016/j.jclepro.2022.134273
Meng, Z., Li, W.-B., Chen, C., and Guan, C. (2023). Carbon emission reduction effects of the digital economy: mechanisms and evidence from 282 cities in China. Land 12, 773. doi:10.3390/land12040773
Nassef, A. M., Olabi, A. G., Rezk, H., and Abdelkareem, M. A. (2023). Application of artificial intelligence to predict CO2 emissions: critical step towards sustainable environment. SUSTAINABILITY 15, 7648. doi:10.3390/su15097648
Paryanto, , Brossog, M., Bornschlegl, M., and Franke, J. (2015). Reducing the energy consumption of industrial robots in manufacturing systems. Int. J. Adv. Manuf. Technol. 78, 1315–1328. doi:10.1007/s00170-014-6737-z
Priya, A. K., Devarajan, B., Alagumalai, A., and Song, H. (2023). Artificial intelligence enabled carbon capture: a review. Sci. Total Environ. 886, 163913. doi:10.1016/j.scitotenv.2023.163913
Shan, Y., Huang, Q., Guan, D., and Hubacek, K. (2020). China CO2 emission accounts 2016-2017. Sci. DATA 7, 54. doi:10.1038/s41597-020-0393-y
Strubell, E., Ganesh, A., and Mccallum, A. (2019). Energy and policy considerations for deep learning in NLP. Assoc. Comput. Linguist., 3645–3650. doi:10.18653/v1/P19-1355
Tang, K., and Yang, G. (2023). Does digital infrastructure cut carbon emissions in Chinese cities? Sustain. Prod. Consum. 35, 431–443. doi:10.1016/j.spc.2022.11.022
Vorozheykina, T. M. (2022). Challenges and prospects of decarbonization of the economy in the age of AI. Front. Environ. Sci. 10, 952821. doi:10.3389/fenvs.2022.952821
Wang, J., Liu, Y., Wang, W., and Wu, H. (2023a). The effects of ?machine replacing human? on carbon emissions in the context of population aging-Evidence from China. URBAN Clim. 49, 101519. doi:10.1016/j.uclim.2023.101519
Wang, J., Wang, W., Liu, Y., and Wu, H. (2023b). Can industrial robots reduce carbon emissions? Based on the perspective of energy rebound effect and labor factor flow in China. Technol. Soc. 72, 102208. doi:10.1016/j.techsoc.2023.102208
Wang, L., Chen, Q., Dong, Z., and Cheng, L. (2024). The role of industrial intelligence in peaking carbon emissions in China. Technol. Forecast. Soc. Change 199, 123005. doi:10.1016/j.techfore.2023.123005
Wu, C.-J., Raghavendra, R., Gupta, U., Acun, B., Ardalani, N., Maeng, K., et al. (2022). Sustainable AI: environmental implications, challenges and opportunities. Proc. Mach. Learn. Syst. 4, 795–813.
Yang, C.-H. (2022). How artificial intelligence technology affects productivity and employment: firm-level evidence from taiwan. Res. Policy 51, 104536. doi:10.1016/j.respol.2022.104536
Yang, Z., and Shen, Y. (2023). The impact of intelligent manufacturing on industrial green total factor productivity and its multiple mechanisms. Front. Environ. Sci. 10, 1058664. doi:10.3389/fenvs.2022.1058664
Yanzhe, F., and Ullah, S. (2023). Energy regulation, energy innovation, and carbon intensity nexus in China: a nonlinear perspective. Energy Environ., 0958305X231188745. doi:10.1177/0958305X231188745
Yi, M., Liu, Y., Sheng, M. S., and Wen, L. (2022). Effects of digital economy on carbon emission reduction: new evidence from China. Energy Policy 171, 113271. doi:10.1016/j.enpol.2022.113271
Zadmirzaei, M., Hasanzadeh, F., Susaeta, A., and Gutierrez, E. (2023). A novel integrated fuzzy DEA-artificial intelligence approach for assessing environmental efficiency and predicting CO2 emissions. SOFT Comput. 28, 565–591. doi:10.1007/s00500-023-08300-y
Zhang, W., Liu, X., Wang, D., and Zhou, J. (2022a). Digital economy and carbon emission performance: evidence at China’s city level. Energy Policy 165, 112927. doi:10.1016/j.enpol.2022.112927
Zhang, X., Liu, P., and Zhu, H. (2022b). The impact of industrial intelligence on energy intensity: evidence from China. Sustainability 14, 7219. doi:10.3390/su14127219
Keywords: artificial intelligence, carbon emissions, carbon reduction effect, nonlinear characteristic, China
Citation: Xie T and Wang X (2024) Investigating the nonlinear carbon reduction effect of AI: empirical insights from China’s provincial level. Front. Environ. Sci. 12:1353294. doi: 10.3389/fenvs.2024.1353294
Received: 10 December 2023; Accepted: 03 May 2024;
Published: 27 May 2024.
Edited by:
Xunpeng Shi, University of Technology Sydney, AustraliaReviewed by:
Licheng Liu, University of Minnesota Twin Cities, United StatesYassine Himeur, University of Dubai, United Arab Emirates
Copyright © 2024 Xie and Wang. This is an open-access article distributed under the terms of the Creative Commons Attribution License (CC BY). The use, distribution or reproduction in other forums is permitted, provided the original author(s) and the copyright owner(s) are credited and that the original publication in this journal is cited, in accordance with accepted academic practice. No use, distribution or reproduction is permitted which does not comply with these terms.
*Correspondence: Xuwei Wang, eHd3YW5nZWR1QG91dGxvb2suY29t