- 1School of Public Administration and Policy, Dalian University of Technology, Dalian, China
- 2School of Marxism, Dalian University of Technology, Dalian, China
Introduction: By constructing a computable general equilibrium model of "carbon trading" and "carbon trade-carbon tax", this study aims to deeply explore the combined impact of these two policies on China's economic development and carbon emission reduction, so as to provide scientific decision support for policy makers.
Methods: In order to accurately simulate the economic effects of carbon trading policies, the carbon trading module was introduced in detail in the "carbon trading" model, and the carbon trading cost was incorporated into the elastic substitution function production module. At the same time, in order to comprehensively evaluate the effect of the combination policy of "carbon trade-carbon tax", the cost of carbon tax is included in the constant elastic substitution function of production in the model.
Results and Discussion: Through in-depth data analysis and model calculation, it is found that although a single carbon trading policy can effectively promote the reduction of carbon emissions, its impact on the economy is relatively moderate, especially in promoting the technological upgrading of the power industry. The "carbon trade-carbon tax" combination policy has further strengthened the emission reduction action, in a number of industrial sectors, such as coal, power, heavy industry and light industry, by significantly increasing the cost of carbon emissions to promote emission reduction. The above results show that carbon tax policies play an important role in balancing carbon emission reduction and economic development. Compared with the single carbon trading policy, the introduction of carbon tax makes the emission reduction efforts of various departments more comprehensive, and also contributes to the stable development of the economy.
1 Introduction
With the increasingly serious global climate change, reducing greenhouse gas emissions and promoting environmental protection have become the consensus of the international community (Harker-Schuch et al., 2021; Ramsey et al., 2022). Carbon trading and carbon tax policies have received widespread attention as the main economic means to address this challenge (Zhang and Ma, 2022). However, how to minimize the impact on the economy and society while ensuring the realization of emission reduction targets is a major problem for policymakers (Wang TS. et al., 2020; Heydari and Mirzajani, 2021). Although the current research has discussed the individual effects of carbon trading and carbon tax policies, the research on the impact and optimal combination of the two is still insufficient (Hardadi et al., 2020; Du et al., 2022). In particular, when macroeconomic indicators such as economic growth, unemployment rate and carbon emission reduction effect are taken into account, the existing literature lacks systematic analysis and empirical support (Long et al., 2021; Yadav et al., 2021). In order to fill this knowledge gap, this study explores the impact of different policy combinations on macro-economy and carbon emission reduction by constructing a “carbon trade-carbon tax” policy simulation framework based on a computable general equilibrium (CGE) model. As a mature economic analysis tool, CGE model can comprehensively simulate the complex interaction of economic system and evaluate the chain reaction brought by policy changes (Wang C. et al., 2020; Gu et al., 2022). It is expected that by utilizing the unique advantages of CGE model, this study can more accurately predict and compare the economic costs and emission reduction effects under different policy combinations, so as to provide scientific basis and decision support for policymakers. The first section of the paper focuses on the CGE-based “C-Trade-C-Tax” policy simulation model, the second section analyses the impacts of a single “C-Trade” policy on Macro-E and Carbon emission reduction (CER), and the third section analyses the impacts of a single “C-Trade” policy on Macro-E and CER. Section 2 analyses the impact of a single “C-Trade” policy on Macro-E and CER, while Section 3 analyses the combined impact of a “C-Trade-C-Tax” policy combination on Macro-E and CER; and Section 4 concludes.
2 Literature review
With the increasing importance of sustainable development, many scholars have done a lot of research on it. To explore the role of information and communication technologies (ICTs) in environmental sustainability, Shobande and Ogbeifun conducted panel data analysis for 24 OECD countries using standard fixed effects and dynamic panel methods. It is found that ICT plays an important role in promoting environmental sustainability and influences the environment through various mechanisms such as education and transportation (Shobande and Ogbeifun, 2022a). In addition, to explore the impact of financial development and energy consumption on environmental sustainability in OECD countries, Shobande and Ogbeifun used the standard fixed effects and Arellano-Bover/Bundell Bond dynamic panel approach. The results show that the financial development index and energy efficiency are crucial to reducing carbon emissions and promoting sustainability in OECD countries, and it is recommended to prioritize the development of finance and investment in energy efficiency to promote environmental sustainability (Shobande and Ogbeifun, 2022b). Addressing the complexity of the climate change challenge, Shobande and Asongu explore the role of education and ICT in promoting environmental sustainability in East and South Africa. Using the third-generation panel unit root and co-integration test, combined with Granger causality analysis, the results show that education and clean technology investment can complement each other to reduce carbon emissions and promote environmental sustainability (Shobande OA. and Asongu SA., 2022). In addition, Shobande and Shodipe explored the impact of energy policies on curbing carbon emissions in the United States, China, and Nigeria, using a dynamic stochastic general equilibrium (DSGE) model (Shobande and Shodipe, 2019). The results show that properly guided carbon-free environmental policies have a positive impact on carbon reduction, pollution is highly correlated with macroeconomic fluctuations, and environmental policies can only be effective by considering both variables under the DSGE framework. Shobande discusses the role of monetary policy with a time series approach to climate change in the East African Community. The results show that monetary policy can help smooth the transition to a low-carbon economy through credit and interest rate channels, but also bring financial uncertainty (Shobande, 2022). In response to the natural resource curse in Nigeria and Ghana, Shobande and Enemona explored the importance of sustainable finance through the Bayer and Hanck joint cointegration test and the vector autoregressive/vector error-corrected Granger causality test. The results show that sustainable finance is crucial to natural resource management, and the phenomenon of financial resource curse exists in both countries, in which the human development index is the medium through which sustainable finance affects the curse of natural resources (Shobande and Enemona, 2021). Shobande’s team examined the role of information technology infrastructure (ITI) in promoting climate resilience and environmental quality in OECD countries, using advanced econometric methods for empirical analysis. The results show that ITI and renewable energy significantly reduce carbon emissions and contribute to achieving net zero emissions targets, while economic growth and non-renewable energy use are harmful to the environment. It is recommended that policymakers use ITI to drive innovation and the energy transition to improve the environment (Shobande et al., 2024).
Shobande and Asongu used six advanced panel technologies to analyze the financial, human development and climate change issues facing eastern and southern Africa. The results show that the development of financial and human capital is critical to reducing CO2 emissions and promoting environmental sustainability (Shobande and Asongu, 2021). In order to reduce carbon emissions in 24 countries of the Organization for Economic Cooperation and Development, Shobande and Ogbeifun et al. used the generalized moment dynamic panel method to analyze carbon emissions in 24 countries. The results show that green innovation and economic growth increase carbon emissions, while renewable energy and social inclusion help reduce carbon emissions (Shobande et al., 2023). Aiming at the impact of information and communication technology on environmental sustainability, Shobande and Asongu combined STIRPAT framework and time series method of VAR/VEC Granger causality for analysis. Results show that ICTs contribute positively to environmental sustainability in South Africa (Shobande and Asongu, 2023). To test the energy-carbon Kuznets curve hypothesis, Shobande and Asongu used second-generation panel analysis to explore whether energy consumption, natural resources, and governance could explain the CKC proposition. The results show that these mechanisms play a key role in reducing carbon emissions in Africa, suggesting that the CKC hypothesis that does not take these factors into account is incomplete (Shobande O. and Asongu S., 2022). Aiming at the role of technological innovation in economic development and carbon emission, Shobande and Ogbeifun adopted standard panel fixed effect, Arellano-Bover/Blundell-Bond dynamic panel analysis and Hausman-Taylor method for empirical analysis. The results show that technological innovation has a significant impact on reducing carbon emissions, which can not only predict and identify carbon emissions, but also be used to monitor and mitigate their impact (Shobande and Ogbeifun, 2023).
According to the above related literature, it can be found that although the above research has deeply discussed the influencing factors and coping strategies of environmental sustainability in many aspects, there are still some shortcomings. First, most of these studies focus on the impact of a single policy or factor on the environment, lacking consideration of different policy combinations. Secondly, the existing research on the impact of policies on the environment and economy often ignores the internal connection and dynamic feedback mechanism between the two. Therefore, it is particularly important to construct a simulation framework that can comprehensively consider a variety of policies and their interactions, and deeply explore the combined impact of different policy combinations on macroeconomic and carbon emission reduction. This study aims to make up for this deficiency by constructing a “carbon trade-carbon tax” policy simulation framework based on CGE model, systematically analyzing the dynamic relationship between economy and environment under different policy combinations, and providing more comprehensive and scientific decision-making basis for policymakers.
3 CGE-based “C-Trade-C-Tax” policy simulation model construction
CGE is an economic analysis tool whose model was initially invented and developed to simulate market behaviour and assess policy effects (Veitia, 2021). With the passage of time, CGE models have been improved and refined, and their scope of application has been expanded, gradually becoming an important economics tool (Descartes et al., 2021). A “C-Trade-C-Tax” policy model based on CGE is suggested in the study in order to examine the impact of various external factors on China’s CER task under the “C-Trade” and “C-Trade-Carbon Tax” policy systems. C-Trade-C-Tax policy simulation model based on CGE, which is constructed with Math CAD 15 and Excel 2007.
3.1 CGE theory and its development
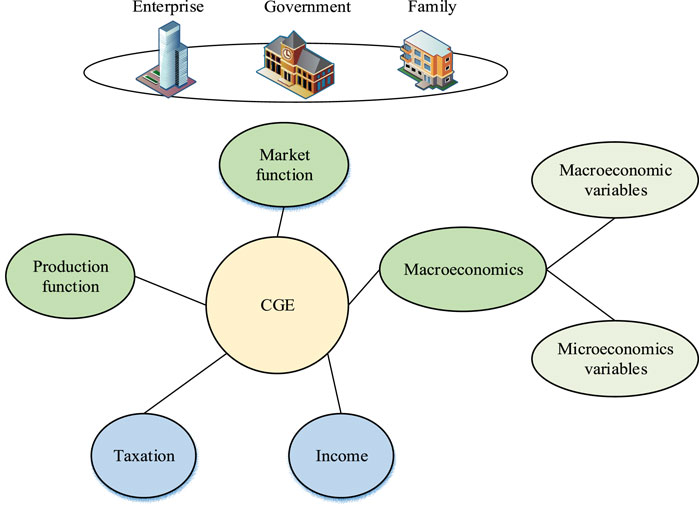
CGE model is an economic model based on the general equilibrium theory, which simulates the operation of the economic system by establishing specific mathematical equations and databases, and can reflect the changes in the quantity and price of commodities and factors in the economic system to achieve the balance of supply and demand (Ghesh et al., 2021). CGE model is characterized by its comprehensiveness and computability. It considers the equilibrium state of the entire economic system, not just the equilibrium of local markets or specific industries (Xavier et al., 2021). This allows CGE models to more accurately simulate the combined effects of economic policies on the entire economic system, including trade policies, tax policies, environmental policies, etc. The basic structure of the CGE model is shown in Figure 1.
As shown in Figure 1, CGE is mainly composed of market function, production function, Macro-economics, taxation and income distribution. Among them, the market function is the most basic part of the CGE model, which can connect the economic subjects on the market behaviour and economic structure on this basis. Macro-economics is the most complex part of the CGE model, which simulates the impacts of Macro-economics behaviour on the Macro-economics structure while linking the Macro-economics variables with the Micro-economic variables. structure and trend changes (Eyries et al., 2021; Kaygusuz et al., 2021). Taxation and income distribution is the most important part of the CGE model, which links government taxation and other income distribution methods and simulates the impact of different policies on, among other things, the structure of income distribution (Berkman et al., 2021; Liang et al., 2021). Under the background of macroeconomics, CGE theory integrates the basic principles of macroeconomics and the idea of general equilibrium, and simulates and analyzes the operation of the entire economic system by constructing mathematical models (An et al., 2023). In the context of macroeconomics, CGE theory emphasizes the overall equilibrium of the economic system and the interdependence between various sectors. It assumes that there are complex interactions between the various sectors of the economy, and that changes in one sector will have an impact on other sectors and ultimately affect the equilibrium state of the entire economic system (Connolly, 2020). CGE theory establishes a model involving multiple economic sectors to describe the supply and demand relationship among these sectors, the price formation mechanism, and the allocation of resources. The model usually includes production function, consumption function, trade function, etc., to reflect all aspects of economic activities (Fomin et al., 2020). By solving this set of equations, we can get the equilibrium relationship and change trend of each economic variable. In macroeconomic policy analysis, CGE theory has significant advantages. It can be used to assess the full impact of various economic policies on the economic system (Zhou et al., 2022). Through the simulation of the economic equilibrium state after the implementation of the policy, it can provide a scientific basis for policymakers to make decisions, and help to achieve stable economic growth and sustainable social development (Jha et al., 2020).
3.2 Material and method
Social Accounting Matrix (SAM) is the most important basic database for building the CGE, SAM multiplier analysis model. SAM includes the System of National Accounts (SNA) and the Input-Output (IO) tables, including accounts, taxes, expenditures, savings and investments. CGE model through the general equilibrium theory, the construction of the project relationship between the joint non-linear system of equations. For the CGE model, SAM can offer a complete and balanced data collection, as well as the sequence of compilation for the macro and micro SAM tables.Generally speaking, the IO table represents the value of China’s output volume for each sector of the composite for a given year. China’s Bureau of Statistics compiles IO tables every 5 years, and the study uses the 2022 IO table. The macro SAM table used for the study is shown in Table 1.
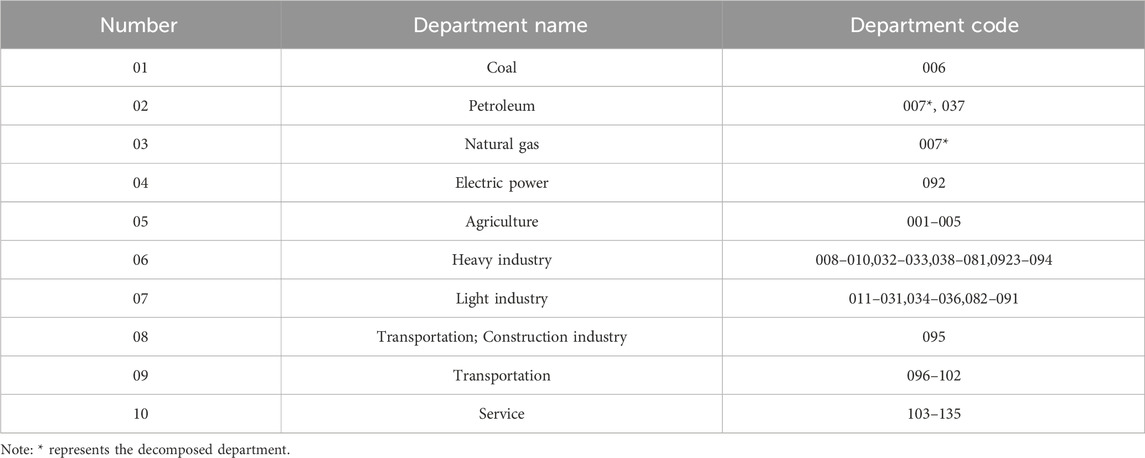
The sectors of our IO table for 2022 are divided or merged to finally get the IO table based on 10 sectors.The correspondence of the sectors in our IO table for 2022 is shown in Table 2.
In a CGE model, variables are quantities that can vary in an economic system and represent different aspects of economic activity. These variables can be divided into endogenous variables and exogenous variables. Endogenous variables are determined inside the model, and their changes are affected by the economic mechanism and equilibrium conditions inside the model. Exogenous variables are externally given, and their changes are not affected by the internal mechanisms of the model, but have an impact on the results of the model. In the combination of the SAM table and the CGE model, some of the key variables include the prices of goods and services, the supply and demand of factors of production, taxes and government spending, and international trade. These variables are represented in the SAM table and are correlated and calculated by the equations in the CGE model. The endogenous parameters required by CGE are obtained by combining the 2022 SAM table with the CGE model equation. Firstly, the coal price needs to be standardised and then the relative price relationship is calculated based on the actual price relationship, and the price relationship between coal price and other energy sources is shown in Table 3.
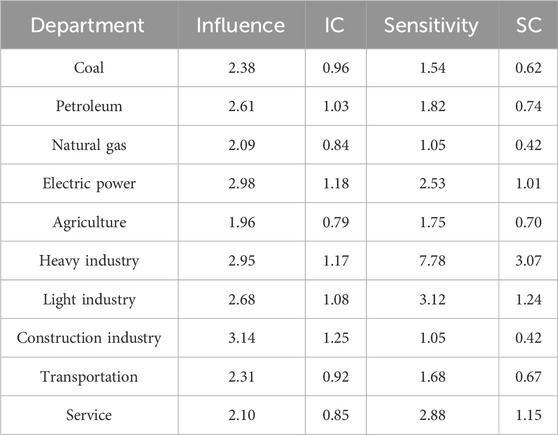
To reveal the influence and induction of each industry in the national economy focus, the study quantitatively analyses each industry through the influence coefficient, which is calculated as shown in Eq. 1.
In Eq. 1,
In Eq. 2,
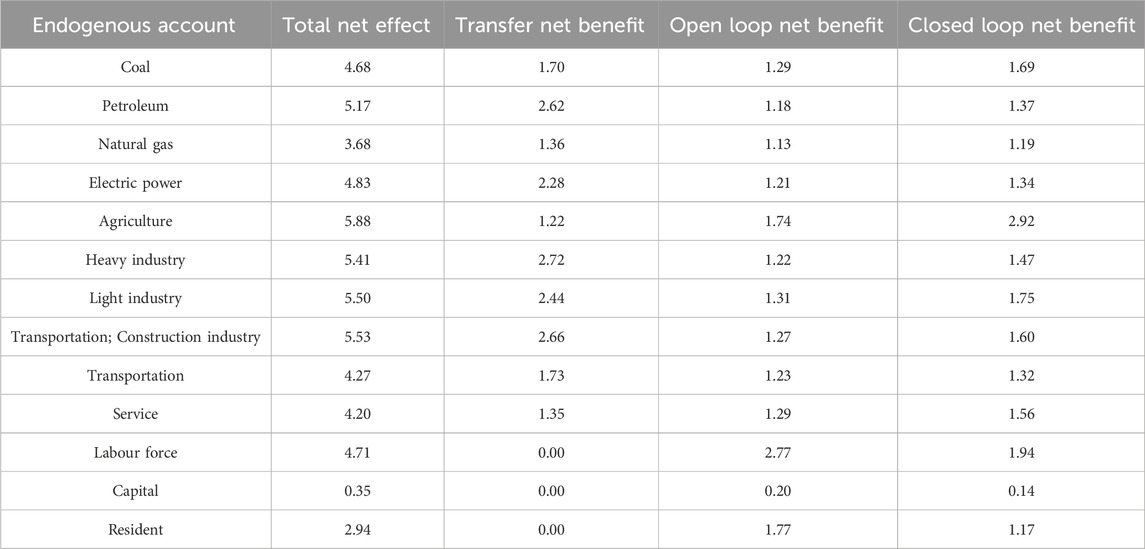
An efficient way to gauge the effects of changes in economic indicators is using the multiplier analysis method. The study decomposed the account multipliers into three categories of net effects by extracting the initial inputs, namely, transfer multiplier matrix, open-loop multiplier matrix and closed-loop multiplier matrix. The results of the three types of net effects are shown in Table 5.
The certification of the data used in this study is mainly reflected in the authority of its source, the scientific nature of data preparation, the rigor of data processing and the calibration of model parameters. First of all, the data source is China’s SAM, which includes the system of national accounts and the IO table. These data are compiled by the National Bureau of Statistics once every 5 years and are official and authoritative, ensuring the accuracy and reliability of the data (Timilsina et al., 2024). Second, SAM tables provide a comprehensive and balanced data set for CGE models, and the compilation process strictly follows the order of macro to micro. At the same time, the IO table is calculated by value, reflecting the synthesis of the output of various departments in China in 1 year, which further enhances the scientific and practical data (Tanaka et al., 2022). Then, before applying the data to the CGE model, operations such as the division or consolidation of sectors and price standardization are carried out, all of which are based on rigorous economic theory and statistical methods aimed at ensuring the consistency and availability of the data. Finally, the endogenous parameters required for the CGE model were obtained by combining the 2022 SAM table with the CGE model equations for calibration, a process that also ensures the model parameters match and are consistent with the underlying data.
The CGE model can describe the relationship between different variables in an economic system through a series of nonlinear equations. These equations are based on general equilibrium theory and take into account various aspects of economic activity such as market supply and demand balance, price formation, production structure, income distribution and consumption (Atanassov, 2022; Guo and Qin, 2023). In the model, different economic agents achieve their goals by optimizing their own behavior, which in turn is influenced by market prices, policies, and other economic factors. Therefore, this study can analyze the impact of macro-economy and carbon emission reduction through CGE model. The construction of CGE model includes production function, utility function, market equilibrium condition and so on. The production function describes how an enterprise combines production factors to produce goods and services, and the substitution relationship between production factors. The utility function describes how residents choose to consume different goods and services according to their preferences and income levels. The market equilibrium condition ensures that the supply and demand of goods and services are balanced in the market. When constructing CGE model, it is necessary to select appropriate function forms and parameters to describe the characteristics of economic system. These parameters can be obtained by calibrating the SAM table and the CGE model equations to ensure that the model reflects the operation of the real economy. The availability of data, the complexity of the model and the rationality of the simulation results should be considered in the calibration process.
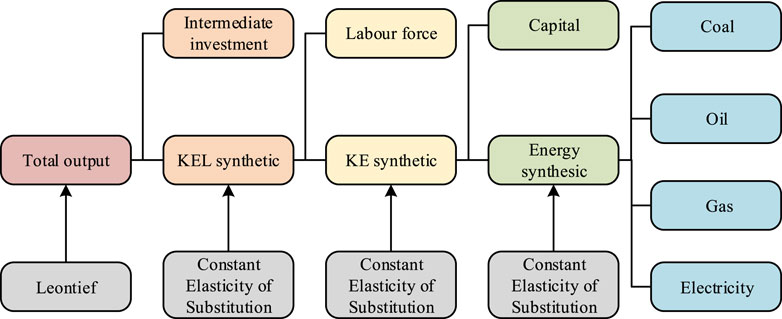
By combining general equilibrium theory and CGE to construct a “C-Trade-C-Tax” policy simulation model, the study classifies each industry into Electric Sector (ES), Coal sector (CS), Petroleum sector (PS), Natural gas sector (NGS), Light Industry Department (LID), Heavy Industry Department (HID), Agriculture sector (AS), Building Sector (BS), Transportation Sector (TS), and Service Sector, (SS), and each sector is assumed to correspond to only one good or service. The production module, the environment module, and the C-Trade module make up the “C-Trade-C-Tax” policy simulation model. The structure of the production module of the “C-Trade-C-Tax” policy simulation model is shown in Figure 2.
As can be seen in Figure 2, in the “C-Trade-C-Tax” policy simulation model proposed in the study, each industry sector uses energy, capital, labour and intermediate inputs for production. Capital is defined as
In Eq. 3,
In Eq. 4,
In Eq. 5,
In Eq. 6, the conversion efficiency of labour in
In Eq. 7,
In Eq. 8,
In Eq. 9,
In Eq. 10,
3.3 Model portrayal of C-Trade and C-Tax
The difference between the “C-Trade” and “C-Trade-C-Tax” models lies in level 4 of the production function. The sectoral cost of energy consumption in the “C-Trade” model covers the cost of energy procurement as well as the cost of carbon emissions. The equation for calculating the cost of energy use is shown in Eq. 11.
In Eq. 11,
In Eq. 12,
In Eq. 13,
In Eq. 14,
In Eq. 15,
4 Analysis of the impact of a single “C-Trade” policy on Macro-E and CERs
C-Trade policy is an important policy instrument aimed at limiting GHG emissions through market mechanisms. However, the impact of a single C-Trade policy on Macro-E and CER remains controversial. The study will explore the effects of a single C-Trade policy on Macro-E and CER from several aspects.
4.1 Scenario settings for different C-Trade
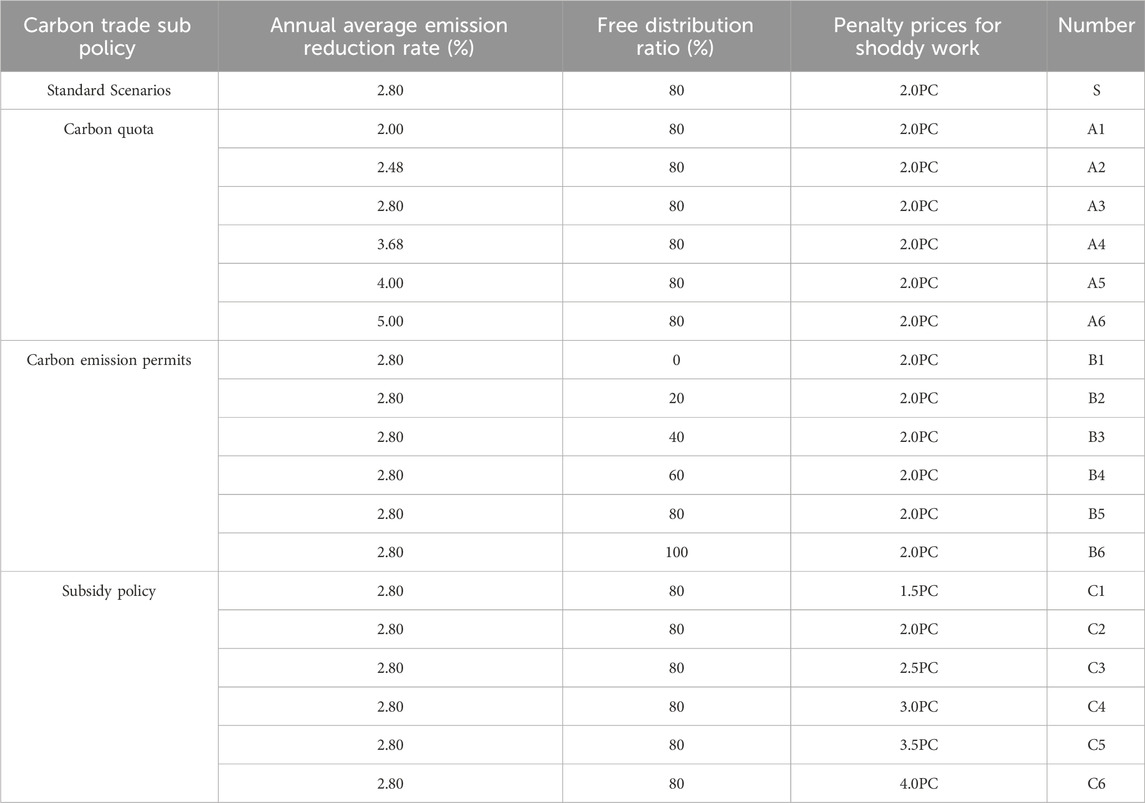
The study is conducted to better analyse the actual impact of C-Trade policies on Macro-E and CERs. The study sets up three C-Trade sub-policies, namely, total carbon emissions, subsidy policy and carbon emission permit, for different scenarios. The main determinant of the total amount of carbon emissions is the average yearly emission reduction rate, followed by the subsidy rate in the subsidy policy and the free allocation ratio in the carbon emission permit. Based on the main variables of the three C-Trade sub-policies, the study proposes a typical C-Trade scenario in which the average annual emission reduction rate is 2.8%, the penalty price is 2.0 PC and the free allocation ratio is 80%. Based on the typical C-Trade scenario, the study varies the values of the main variables of the three C-Trade sub-policies, which are used to compare and analyse the actual effects of each C-Trade sub-policy on Macro-E and CER. The specifics of the different C-Trade scenarios are shown in Table 6.
4.2 C-trade market core variables analysis
Changes in the volume of C-Trade between sectors and in real GDP and its growth rate are the core variables of C-Trade market research. In order to better analyse changes in the C-Trade market, the study simulates the changes in the volume of C-Trade between sectors and in real GDP and its growth rate in typical C-Trade scenarios as an indicator to analyse the actual effects of C-Trade policies. Trade policy in practice. The linear relationship between the C-Trade volume between sectors in 2022 and the trade volume and carbon intensity of each sector under the typical C-Trade scenario is shown in Figure 3.
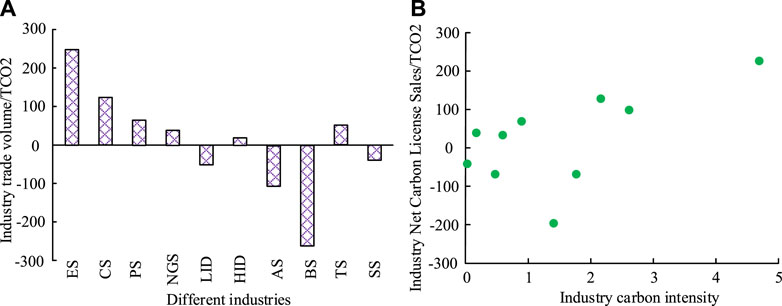
Figure 3. Carbon trade volume between different departments and the linear relationship between trade volume and carbon intensity in various industries. (A) Trade volume of major industries in the carbon market under carbon trading policies, (B) The linear relationship between industry trade volume and carbon intensity.
Figure 3A shows the C-Trade volume data between sectors in 2022 under the typical scenario. From the simulation results in Figure 3A, different sectors have different C-Trade volumes. The main C-Trade buyers are the power sector, coal sector, and oil sector. The C-Trade volumes of these industries are 40.5%, 23.33%, and 15.26%, respectively. And the C-Trade sellers are construction industry, agriculture, light industry. The C-Trade volume of these industries is 41.23%, 14.56%, 5.37% respectively. Figure 3B shows the scatter plot between industry trade volume and industry carbon intensity for carbon permits. The association between industrial carbon intensity and industry trade volume in the C-Trade market is positive, as seen in Figure 3B. Additionally, Figure 3B demonstrates that C-Trade sellers like the construction, agricultural, and light industries have low carbon intensity whereas C-Trade purchasers like the electricity, coal, and oil industries have high carbon intensity. Figure 4 displays the changes in the simulated real GDP and its growth rate from 2018 to 2022 as well as the impact of the C-Trade mechanism on the real GDP, overall carbon emissions, and carbon intensity.
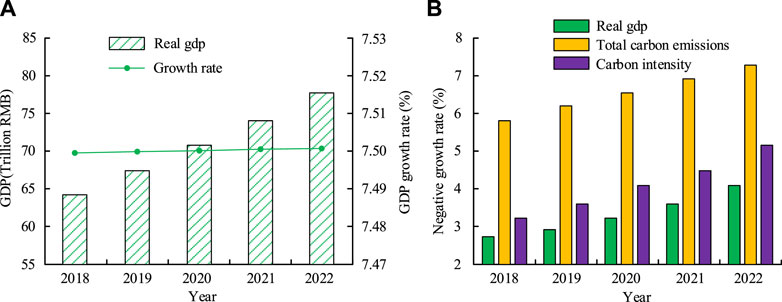
Figure 4. The impact of Carbon trade mechanism on actual GDP, GDP growth rate, carbon intensity, and total carbon emissions under typical scenarios. (A) Real GDP and its growth rate under typical scenarios, (B) Real GDP, total carbon emissions, and changes in carbon intensity.
Figure 4A shows the changes of real GDP and its growth rate in a typical scenario. From Figure 4A, China’s real GDP value grows with time during 2018–2022, and its average annual growth rate is 7.50%. Figure 4B shows the impact of C-Trade policy on real GDP, carbon intensity, and carbon emissions in a typical scenario. As can be observed from Figure 4B, the C-Trade policy’s implementation will hurt the Chinese economy in terms of its economic effects. As an illustration, in the average scenario, real GDP drops by 3.52 percent and 3.99 percent, respectively, in 2021 and 2022 compared to the base period, but is still on the rise overall. Additionally, when it comes to the benefits of emission reduction, it has been discovered that the C-Trade policy’s implementation can dramatically lower both total and carbon intensity emissions. For instance, in 2022, the overall amount of carbon emissions and the intensity of those emissions both declined by 7.32% and 4.86%, respectively. In summary, the C-Trade policy may reduce carbon dioxide emissions effectively, and the degree of influence on the economy is minimal.
4.3 Impact of a single “C-Trade” policy on sectors of the economy
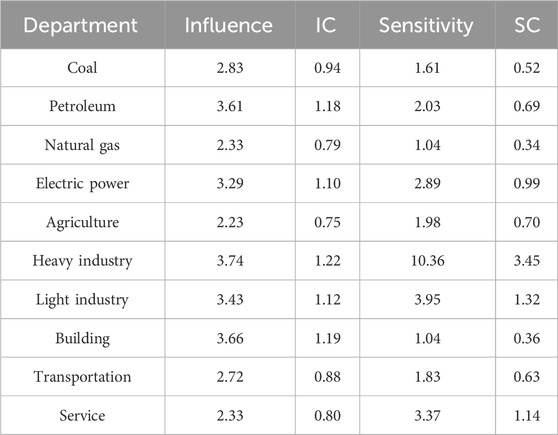
The study offers a thorough analysis of the findings of the sectoral industry linkage analysis and the SAM multiplier analysis to investigate the effects of a single “C-Trade” policy on the sectoral economy. The sectoral industrial links under a typical scenario are shown in Table 7.
The influence and inductance of all industrial sectors grew after the C-Trade policy was put in place, according to a comparison of the data in Table 7 with the data in Table 4. The oil sector shows the largest increase in influence, from 2.61 to 3.61, and the heavy industry sector shows the largest increase in inductance, from 7.78 to 10.36. The comparison also reveals that the coefficients of inductance increase only in the light and heavy industry sectors, while decreasing in the other sectors, and that the coefficients of influence increase only in the oil sector, the light and heavy industry sectors. For the usual scenario, Table 8 shows the findings of the gross effects of the accounts as well as the net effects of the three decomposition multipliers.
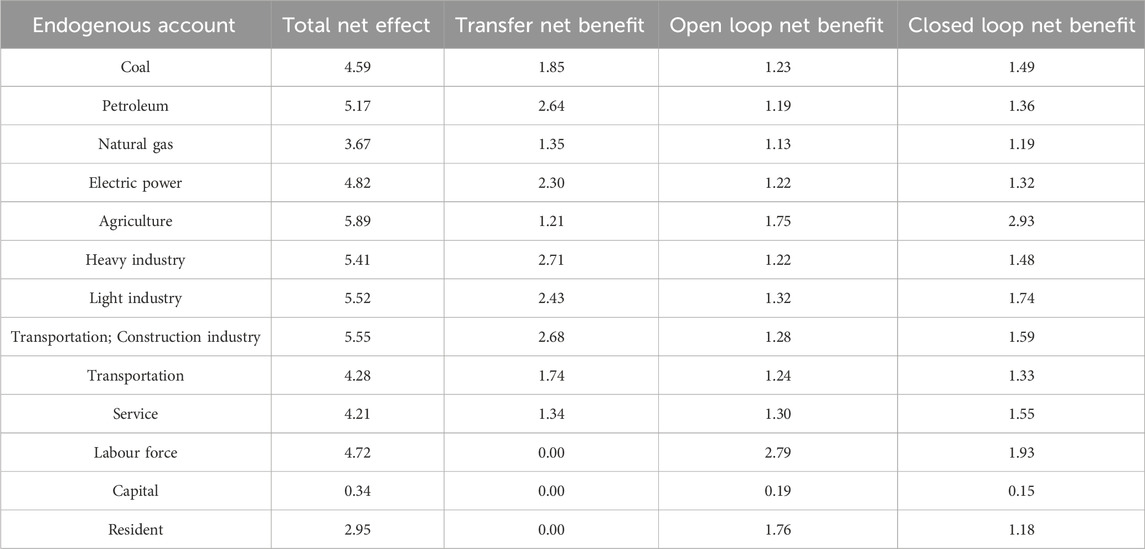
Table 8. Total effect of accounts and net effect of three decomposition multipliers under typical scenarios.
When the C-Trade policy was put into action, the coal sector experienced the highest shift in the overall SAM multiplier impact, changing from 4.68 to 4.59, according to a comparison of the data in Tables 5, 8. In addition, it is also found that the transfer effect of the coal sector rises from 1.70 to 1.85, whereas the open-loop net effect and closed-loop path effect fall from 1.29 to 1.23 and from 1.69 to 1.49, respectively. 1.23 and from 1.69 to 1.49 respectively.This result suggests that the implementation of the C-Trade policy induces an increase in the technological level of the coal sector and transfers labour to other sectors. The comparison of Tables 5, 8 also reveals that, while there has been no discernible change in the oil and gas sectors, the gross account effect and net effect of the three decomposition multipliers in the electricity sector have generally changed in a direction that is similar to that of the coal sector, albeit to a lesser extent. This result suggests that the implementation of the C-Trade policy also promotes technological upgrading and turnover in the electricity sector, but at a lower magnitude, and that its effect on the oil and gas sectors is lower.
4.4 Analysis of the sub-policies of the C-Trade facility
To examine the effects of each C-Trade mechanism sub-policy on overall carbon emissions and real GDP. In Table 6, where the numerical findings of overall carbon emissions and real GDP under scenarios A1–A6 are displayed, the study simulates the values of overall carbon emissions and real GDP under several scenarios.
As can be seen from Table 9, both the real GDP decline rate and the total carbon emissions decline rate are the lowest under the A1 scenario in both 2021 and 2022, with a real GDP decline rate of −6.62 per cent and a total carbon emissions decline rate of −3.32 per cent in 2022. The real GDP fall rate and total carbon emissions drop rate both grow as the annual abatement rate rises, with the A6 scenario having the highest real GDP decline rate and total carbon emissions decrease rate in each year. Among them, the real GDP decline rate in 2022 is −9.69% and the total carbon emissions decline rate is −4.87%. The above results show that the C-Trade policy causes some economic losses but has a good emission reduction effect as the annual emission reduction rate rises. Table 10 displays the data for real GDP and overall carbon emissions for scenarios B1 through B6.
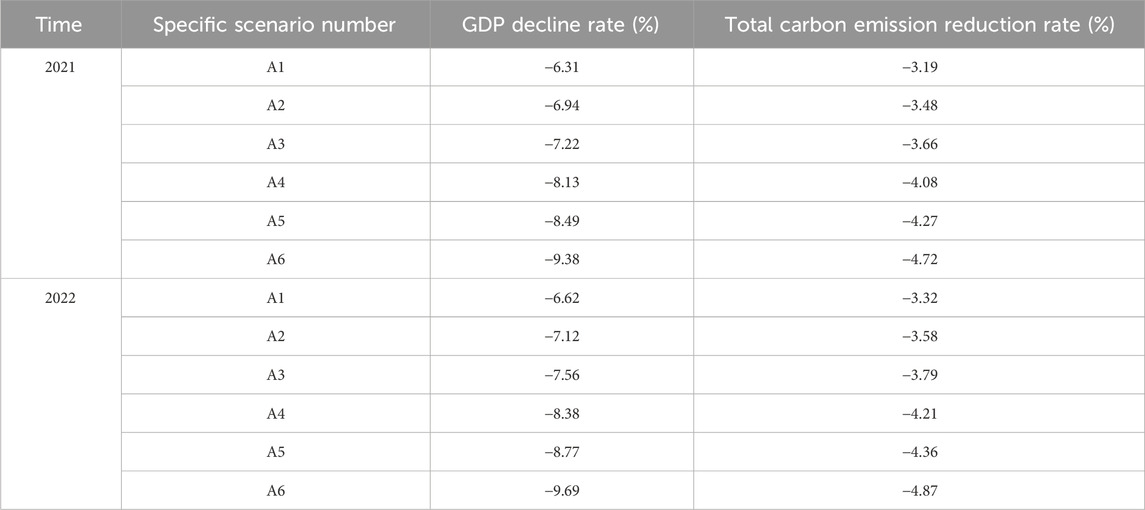
Table 9. Changes in total carbon emissions and actual GDP under different total carbon quota settings.
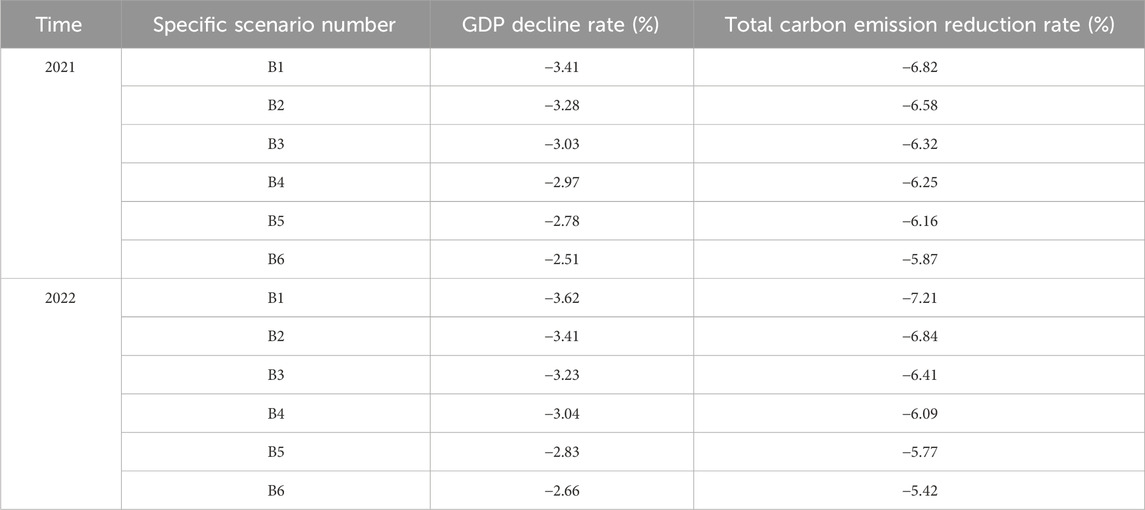
Table 10. Simulation results of actual GDP and total carbon emissions under different free allocation ratios.
As can be seen in Table 10, the rate of decline in real GDP and the rate of decline in total carbon emissions are both highest under scenario B1 in all years, with a rate of decline in real GDP of −3.41 per cent and a rate of decline in total carbon emissions of −6.41 per cent in 2022. As the free allocation ratio rises, the real GDP decline rate and total carbon emissions decline rate decrease in each year, with the lowest real GDP decline rate and total carbon emissions decline rate under the A6 scenario in both 2021 and 2022. The real GDP decline rate in 2022 is −2.66% and the total carbon emissions decline rate is −5.42%. According to the aforementioned findings, China’s real GDP drop rate and overall carbon emissions would gradually slow down as the free allocation ratio rises. Table 11 displays the data for real GDP and overall carbon emissions in the C1–C6 scenarios.
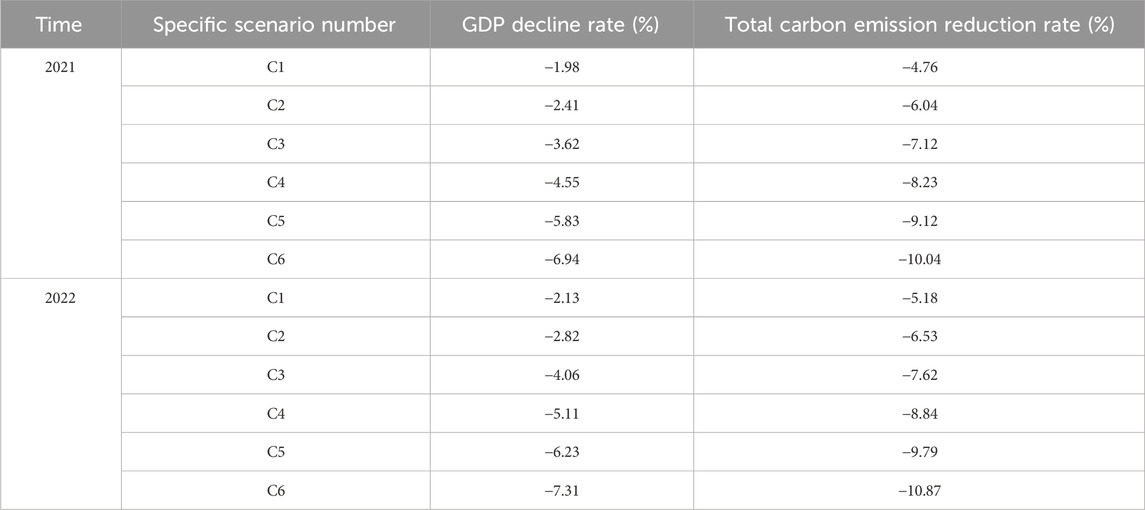
Table 11. Simulation results of actual GDP and total carbon emissions under different penalty prices.
As can be seen from Table 11, the real GDP decline rate and the total carbon emissions decline rate are the lowest under scenario C1 in each year, with a real GDP decline rate of −2.13 per cent and a total carbon emissions decline rate of −5.18 per cent in 2022. As the annual abatement rate rises, the real GDP decline rate and total carbon emissions decline rate increase for each scenario, with the A6 scenario having the highest real GDP decline rate and total carbon emissions decline rate in each year. The real GDP decline rate in 2022 is −7.31% and the total carbon emissions decline rate is −10.87%. The above results show that the C-Trade policy also causes some economic losses but has a good emission reduction effect as the penalty price increases. To sum up, a lower penalty price and annual emission reduction rate as well as a higher free allocation ratio can be set at the initial stage of the implementation of the C-Trade policy, so as to reduce the impact on the economy, and at the later stage of the implementation of the policy, the penalty price and annual emission reduction rate can be increased as well as the free allocation ratio can be lowered to achieve better emission reduction effects.
5 Analysis of the impact of the “C-Trade-C-Tax” policy package on Macro-E and CERs
In order to analyse the combined impact of the “C-Trade-C-Tax” policy mix on China’s Macro-E and CERs, the study examines the imposition of a C-Tax on a typical C-Trade scenario, which is assumed to be levied at a rate of 10¥/tc and 30¥/tc, with a uniform rate of 10¥/tc and 30¥/tc. It keeps the tax rate uniform. Scenario 1 is the typical C-Trade scenario + C-Tax of 10¥/tc; Scenario 2 is the typical C-Trade scenario + C-Tax of 30¥/tc.
5.1 Analysis of the impact of the “C-Trade-C-Tax” policy on Macro-E
Figure 5 displays the changes in real GDP and its growth rate under Scenarios 1 and 2 as well as the changes in real GDP, overall carbon emissions, and carbon intensity under various scenarios.
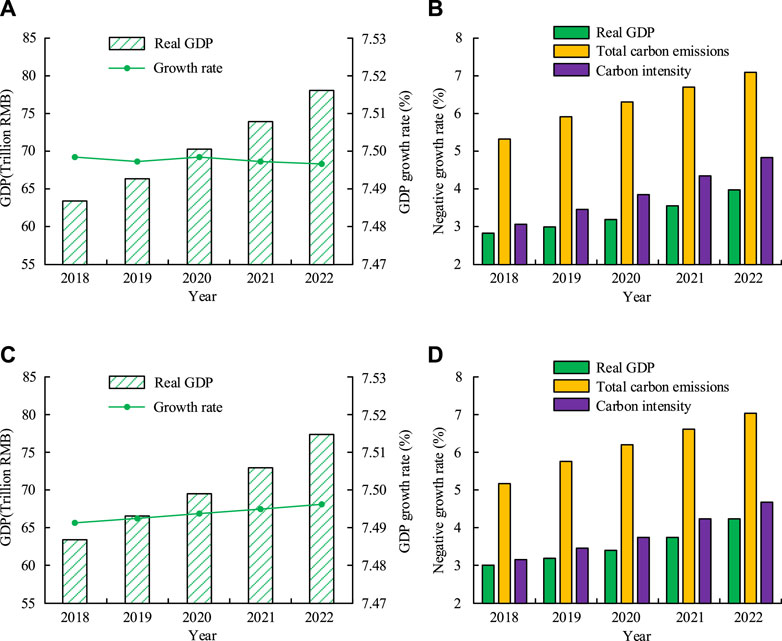
Figure 5. Changes in Real GDP and Its Growth Rate, as well as Changes in Real GDP, Total Carbon Emissions, and Carbon Intensity under Different Scenarios. (A) Real GDP and its growth rate under scenario 1, (B) Real GDP, total carbon emissions, and changes in carbon intensity under scenario 1, (C) Real GDP and its growth rate under scenario 2, (D) Real GDP, total carbon emissions, and changes in carbon intensity under scenario 2.
Figures 5A,C show the changes in real GDP and its growth rate under scenarios 1 and 2, respectively. Comparing Figures 5A,C with Figure 4A, it can be seen that the real GDP and its growth rate under the combination policy of “C-Trade-C-Tax” are lower than that under the single C-Trade policy, and the real GDP and its growth rate are the lowest when the C-Tax is 30 ¥/tc, which is 63.8 trillion RMB and 7.491%, respectively. 63.8 trillion yuan and 7.491 per cent, respectively. Figures 5B,D show the impacts of the “C-Trade-C-Tax” combination policy on total carbon emissions, real GDP and carbon intensity under scenarios 1 and 2, respectively. In contrast to the single C-Trade policy, the “C-Trade-C-Tax” combination policy has a stronger negative impact on the economy and a lesser negative impact on the overall amount of carbon emissions and the carbon intensity. This can be seen by comparing Figures 5B,D with Figure 4B. With a C-Tax of 30¥/tc, total carbon emissions, real GDP and carbon intensity in 2022 decrease by 3.99%, 6.97%, and 4.38% respectively. In conclusion, the combination of “C-Trade-C-Tax” policy has better emission reduction efficiency than single C-Tax policy, and its negative impact on the economy increases to a lower degree. The cost of energy will alter in each sector with the introduction of the “C-Trade-C-Tax” combination policy, with the key changes being the price of synthetic energy, the cost of the C-Tax, and the cost of the C-Trade. Therefore, the study also analyses the impact of the “C-Trade-C-Tax” policy on Macro-E by comparing the effect of price changes in sectoral synthetic energy itself, the direct contribution of C-Trade costs and the direct contribution of C-Tax costs in each industrial sector. Table 12 presents the outcomes.
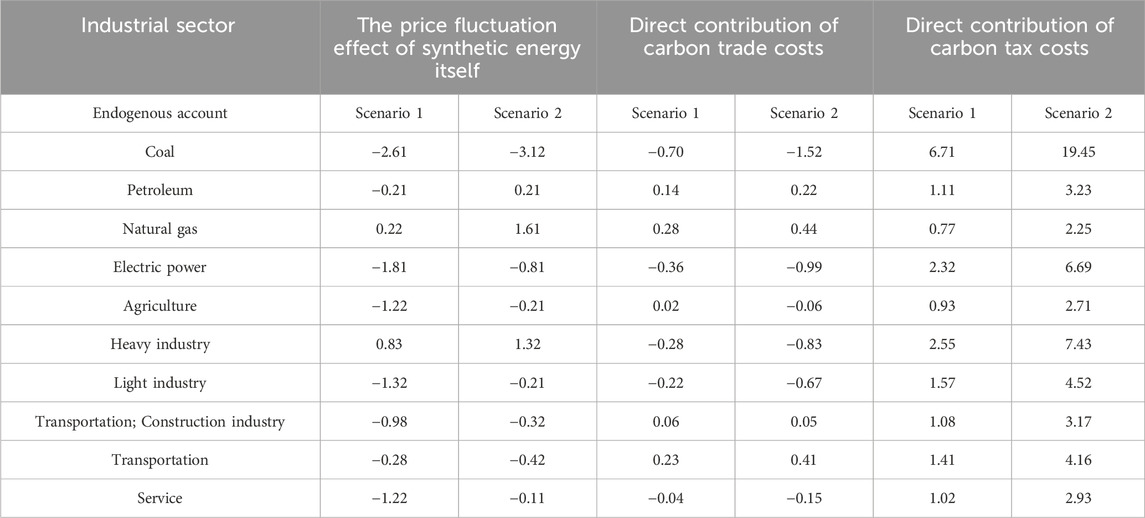
Table 12. Changes in the Price Change Effect of Sectoral Synthetic Energy, Direct Contribution of Carbon trade Costs, and Direct Contribution of Carbon Tax Costs(%).
Gas, transportation, oil, construction, and agriculture are the sectors with a positive direct contribution to C-Trade costs in Scenario 1, as shown in Table 12. These sectors’ direct contributions to C-Trade costs are 0.28 percent, 0.23 percent, 0.14 percent, 0.06 percent, and 0.02 percent, respectively. The natural gas, transportation, oil, and construction sectors in Scenario 2 all have positive direct C-Trade cost contributions, which translate to direct C-Trade cost contributions of 0.44 percent, 0.41 percent, 0.22 percent, and 0.05 percent, respectively. The coal and electricity sectors have the lowest C-Trade costs in both scenarios. The above results show that the natural gas, transport, oil and construction sectors sell carbon allowances under the “C-Trade-C-Tax” combination policy, and that the coal and electricity sectors have low marginal abatement costs and huge abatement potential. In addition, in terms of the direct contribution of C-Tax costs, the top four sectors in the two scenarios are coal, heavy industry, electricity, and light industry, which is consistent with the ranking of the carbon emissions of the sectors, and this result indicates that increasing the carbon emission costs of the sectors with high carbon emissions in the process of levying C-Tax can effectively reduce their carbon emissions. By comparing the price change effect of synthetic energy itself in each sector in Table 12, it is found that the contribution of the price change effect of energy itself is small in all cases. According to the results above, the “C-Trade-C-Tax” strategy can enhance the CER effect in the majority of industries.
5.2 Analysis of the impact of the “C-Trade-C-Tax” policy on various sectors of industry
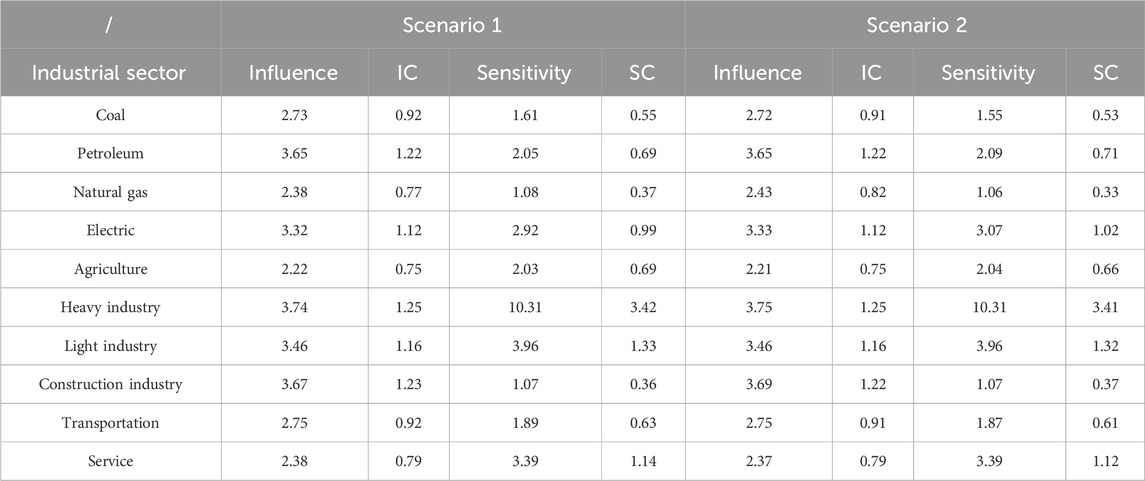
The study thoroughly examines the findings of the sectoral industry linkage analysis and the SAM multiplier analysis for scenarios 1 and 2 in order to investigate how the “C-Trade-C-Tax” policy will affect the economies of different industrial sectors. Table 13 shows the sectoral industrial linkages under the two “C-Trade-C-Tax” scenarios.
Table 13 shows the industry linkages by sector under scenarios 1 and 2. By comparing Tables 4, 7, 13, it can be seen that the changes in the influence and coefficients of influence of the sectors after the implementation of the “C-Trade-C-Tax” combination policy follow the same trend as in the case of the implementation of the C-Trade policy only. It is still the oil sector that shows the most significant increase in influence and influence coefficients after the implementation of the “C-Trade-C-Tax” combination policy, with 2.73 and 2.72 under Scenario 1 and Scenario 2. Additionally, it has been discovered that the majority of the sectors’ impact, influence coefficient, induction, and induction coefficient have all increased since the C-Tax policy was put into place. Sensibility and prudence Less of a rise in coefficient values is observed. The aforementioned findings imply that the application of the “C-Trade-C-Tax” policy combination can boost each industrial sector’s output and so enhance the CER effect. Table 14 shows the industry linkages by sector under the two “C-Trade-C-Tax” scenarios. The results of the gross effects of the accounts and the net effects of the three decomposition multipliers under scenarios 1 and 2 are shown in Table 14.
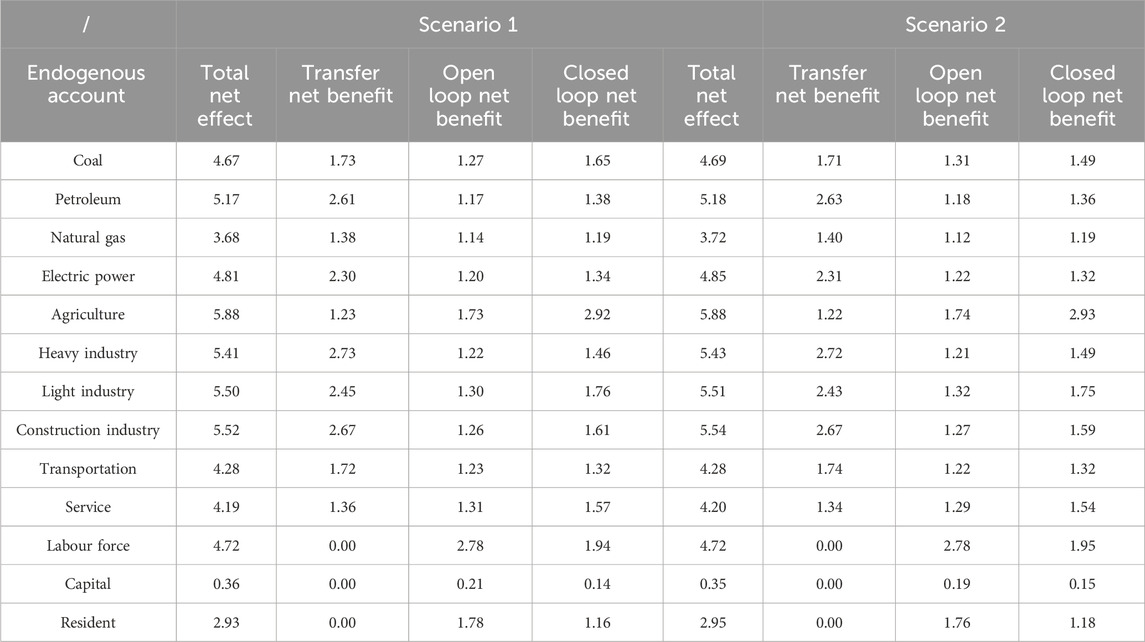
Table 14. Total account effects and net effects of three decomposition multipliers under Scenario 1 and Scenario 2.
Table 14 presents the results of the gross effects of the accounts and the net effects of the three decomposition multipliers under scenarios 1 and 2. A comparison of Tables 8, 14 shows that the implementation of the “C-Trade-C-Tax” combination policy increases the total net effect of the coal sector compared to the implementation of the C-Trade policy alone, mainly due to an increase in both the open- and closed-loop path effects and a decrease in the net transfer effect of the coal sector. This result suggests that the “C-Trade-C-Tax” policy mix results in a relatively strong overall driving force of the coal sector on other industrial sectors, but with a relatively limited increase in the level of technology. It is also found that the effect of the C-Trade-C-Tax policy on the oil sector is not significant. In conclusion, the implementation of the “C-Trade-C-Tax” policy can promote the ability of the coal sector to lead other industrial sectors, thus improving the CER effect in China.
6 Conclusion
In order to promote the development of China’s carbon emission reduction, based on the CGE model, the impact of single carbon trading policy and “carbon trade-carbon tax” combination policy on China’s economy and various industrial sectors is deeply analyzed.
At the same time, this study also discussed the carbon emission reduction effect of each sub-policy of carbon trading policy in detail, and reached the following three conclusions. First, although the single “carbon trading” policy has a certain negative impact on economic growth, it can effectively reduce carbon dioxide emissions, showing that the policy has a positive role in environmental protection. Through the introduction of market mechanisms, carbon trading policies encourage high-carbon emission industries to bear their emissions costs, thus incentivizing them to reduce carbon emissions. Second, there are significant differences in the impact of carbon trading policies on different industries. For example, the coal sector has improved its technological level and transferred its labor force to other sectors after the implementation of the carbon trading policy, showing the far-reaching impact of the policy on the industry structure and labor market. Third, the synergies of the “carbon trade-carbon tax” policy combination: compared with a single policy, the “carbon trade-carbon tax” policy combination shows a stronger effect in reducing carbon emissions. This policy combination promotes the reduction of carbon emissions by various industries through multiple channels and angles, and achieves better environmental benefits. In order to reduce the impact on the economy and achieve better emission reduction effect, it is suggested to set a lower penalty price and annual emission reduction rate and a higher proportion of free distribution at the initial stage of the implementation of carbon trading policy. With the gradual advancement of the policy and the adaptation of the market, the penalty price and the annual emission reduction rate can be gradually increased, and the proportion of free distribution can be reduced. Although this research has achieved satisfactory results, there are still many problems. Based on this research, the future expansion can be further discussed from the following three aspects. The first aspect is regional differences. This study mainly focuses on the impact of carbon trading and carbon tax policies nationwide. However, China has a vast territory, and there are significant differences in the level of economic development, industrial structure and resource endowment among different regions. Future studies can further explore the implementation effects of these policies in different regions, with a view to providing more refined policy recommendations for local governments. The second aspect is the dynamic adjustment mechanism of policies. Current research is mainly based on static policy Settings. In fact, with the development of economy and society and the change of environmental protection needs, carbon trading and carbon tax policies may need to be dynamically adjusted. Future research could explore how to construct a flexible and efficient policy adjustment mechanism to adapt to the changing environment and economic situation. The third aspect is the quantity of environmental factors. This study mainly focuses on carbon emission reduction, but environmental issues are not limited to carbon emissions. Future studies may consider including other environmental factors (such as air pollution, water use, etc.) in the analytical framework to fully assess the combined environmental impacts of carbon trading and carbon tax policies.
Data availability statement
The original contributions presented in the study are included in the article/Supplementary Material, further inquiries can be directed to the corresponding author.
Author contributions
YF: Supervision, Writing–review and editing. CJ: Conceptualization, Investigation, Writing–original draft.
Funding
The author(s) declare that financial support was received for the research, authorship, and/or publication of this article. This work was supported by National Social Science Funds of China “Research on the practical dilemma and response mechanism of legal resource allocation in the process of rule of law in rural of China” (20bfx015).
Conflict of interest
The authors declare that the research was conducted in the absence of any commercial or financial relationships that could be construed as a potential conflict of interest.
Publisher’s note
All claims expressed in this article are solely those of the authors and do not necessarily represent those of their affiliated organizations, or those of the publisher, the editors and the reviewers. Any product that may be evaluated in this article, or claim that may be made by its manufacturer, is not guaranteed or endorsed by the publisher.
References
An, K., Wang, C., and Cai, W. (2023). Low-carbon technology diffusion and economic growth of China: an evolutionary general equilibrium framework. Struct. Change Econ. Dyn. 65 (5), 253–263. doi:10.1016/j.strueco.2023.03.001
Atanassov, K. T. (2022). New topological operator over intuitionistic fuzzy sets. J. Comput. Cognitive Eng. 1 (3), 94–102. doi:10.47852/bonviewJCCE2202197
Berkman, A. M., Hildebrandt, M., and Landstrom, A. P. (2021). The genetic underpinnings of anthracycline-induced cardiomyopathy predisposition. Clin. Genet. 2 (100), 132–143. doi:10.1111/cge.13968
Connolly, K. (2020). The regional economic impacts of offshore wind energy developments in Scotland. Renew. Energy 160 (2), 148–159. doi:10.1016/j.renene.2020.06.065
Descartes, M., Melenevsky, Y. V., Rudy, N., Smith, K., Callaway, K., and Parker, J. S. (2021). Keratoconus in a patient with B3GALT6-related disorder. Clin. Genet. 6 (99), 849–850. doi:10.1111/cge.13940
Du, M., Liu, Q., Macdonald, G. K., Liu, Y., Lin, J., Cui, Q., et al. (2022). Examining the sensitivity of global CO2 emissions to trade restrictions over multiple years. Environ. Sci. Technol. Lett. 9 (4), 293–298. doi:10.1021/acs.estlett.2c00127
Eyries, M., Girerd, B., Savale, L., Soubrier, F., and Montani, D. (2021). A CELSR1 variant in a patient with pulmonary arterial hypertension. Clin. Genet. 100 (6), 771–772. doi:10.1111/cge.14046
Fomin, M. A., Seikowski, J., Belov, V. N., and Hell, S. W. (2020). Supporting information for negatively charged red-emitting acridine dyes for facile reductive amination, separation, and fluorescent detection of glycans. Anal. Chem. 7 (92), 5329–5336. doi:10.1021/acs.analchem.9b05863
Ghesh, L., Devisme, L., Stichelbout, M., Boutaud, L., Elkhartoufi, N., Beneteau, C., et al. (2021). The first two non-Finnish <i>HYLS1</i> variants: expanding the phenotypic spectrum of hydrolethalus syndrome. Clin. Genet. 100 (4), 462–467. doi:10.1111/cge.14021
Gu, N., Wang, H., Zhang, J., and Wu, C. (2022). Bridging chance-constrained and robust optimization in an emission-aware economic dispatch with energy storage. IEEE Trans. Power Syst. 37 (2), 1078–1090. doi:10.1109/TPWRS.2021.3102412
Guo, Y., and Qin, Z. (2023). Impact of carbon tax on energy sector segmentation under different closures: a case study of China via CGE model. Energy Rep. 9 (3), 500–510. doi:10.1016/j.egyr.2023.04.206
Hardadi, G., Buchholz, A., and Pauliuk, S. (2020). Implications of the distribution of German household environmental footprints across income groups for integrating environmental and social policy design. J. Industrial Ecol. 25 (1), 95–113. doi:10.1111/jiec.13045
Harker-Schuch, I., Lade, S., Mills, F., and Colvin, R. (2021). Opinions of 12 to 13-year-olds in Austria and Australia on the concern, cause and imminence of climate change. Ambio 50 (3), 644–660. doi:10.1007/s13280-020-01356-2
Heydari, J., and Mirzajani, Z. (2021). Supply chain coordination under nonlinear cap and trade carbon emission function and demand uncertainty. Kybernetes Int. J. Syst. Cybern. 50 (2), 284–308. doi:10.1108/K-06-2019-0408
Jha, V., Narayanan, B. G., Wadhwa, D., and Tesche, J. (2020). Economic and environmental effects of reduction in smoking prevalence in Tanzania. Tob. control 29 (1), 24–28. doi:10.1136/tobaccocontrol-2018-054635
Kaygusuz, E., Khayyat, A., Abdullah, U., Budde, B. S., Hussain, M. S., Ahmed, I., et al. (2021). A 24-generation-old founder mutation impairs splicing of <i>RBBP8</i> in Pakistani families affected with Jawad syndrome. Clin. Genet. 100 (4), 486–488. doi:10.1111/cge.14028
Liang, Y., Wang, Y., Wang, W., Zhao, J., Xu, M., and Zheng, M. (2021). <i>SMPD3</i>-<i>ALK</i>: a novel <i>ALK</i> fusion gene in lung adenocarcinoma. Clin. Genet. 99 (3), 488–489. doi:10.1111/cge.13891
Long, Q., Tao, X., Shi, Y., and Zhang, S. (2021). Evolutionary game analysis among three green-sensitive parties in green supply chains. IEEE Trans. Evol. Comput. 25 (3), 508–523. doi:10.1109/TEVC.2021.3052173
Ramsey, K. W., Tomlinson, J. L., and Mattheus, C. R. (2022). A radiocarbon chronology of Holocene climate change and sea-level rise at the Delmarva Peninsula, US Mid-Atlantic Coast. holocene 32 (1/2), 3–16. doi:10.1177/09596836211048282
Shobande, O., and Asongu, S. (2022a). The rise and fall of the energy-carbon Kuznets curve: evidence from Africa. Manag. Environ. Qual. Int. J. 33 (2), 390–405. doi:10.1108/MEQ-08-2021-0185
Shobande, O. A. (2022). Is climate change a monetary phenomenon? Evidence from time series analysis. Int. J. Sustain. Dev. World Ecol. 29 (2), 99–111. doi:10.1080/13504509.2021.1920064
Shobande, O. A., and Asongu, S. A. (2021). Financial development, human capital development and climate change in East and Southern Africa. Environ. Sci. Pollut. Res. 28 (46), 65655–65675. doi:10.1007/s11356-021-15129-1
Shobande, O. A., and Asongu, S. A. (2022b). The critical role of education and ICT in promoting environmental sustainability in Eastern and Southern Africa: a panel VAR approach. Technol. Forecast. Soc. Change 176, 121480. doi:10.1016/j.techfore.2022.121480
Shobande, O. A., and Asongu, S. A. (2023). Searching for sustainable footprints: does ICT increase CO2 emissions? Environ. Model. Assess. 28 (1), 133–143. doi:10.1007/s10666-022-09859-w
Shobande, O. A., and Enemona, J. O. (2021). A multivariate VAR model for evaluating sustainable finance and natural resource curse in West Africa: evidence from Nigeria and Ghana. Sustainability 13 (5), 2847. doi:10.3390/su13052847
Shobande, O. A., and Ogbeifun, L. (2022a). Has information and communication technology improved environmental quality in the OECD? a dynamic panel analysis. Int. J. Sustain. Dev. World Ecol. 29 (1), 39–49. doi:10.1080/13504509.2021.1909172
Shobande, O. A., and Ogbeifun, L. (2022b). The criticality of financial development and energy consumption for environmental sustainability in OECD countries: evidence from dynamic panel analysis. Int. J. Sustain. Dev. World Ecol. 29 (2), 153–163. doi:10.1080/13504509.2021.1934179
Shobande, O. A., and Ogbeifun, L. (2023). Pooling cross-sectional and time series data for estimating causality between technological innovation, affluence and carbon dynamics: a comparative evidence from developed and developing countries. Technol. Forecast. Soc. Change 187, 122192. doi:10.1016/j.techfore.2022.122192
Shobande, O. A., Ogbeifun, L., and Tiwari, A. K. (2023). Re-evaluating the impacts of green innovations and renewable energy on carbon neutrality: does social inclusiveness really matters? J. Environ. Manag. 336, 117670. doi:10.1016/j.jenvman.2023.117670
Shobande, O. A., Ogbeifun, L., and Tiwari, A. K. (2024). Unlocking information technology infrastructure for promoting climate resilience and environmental quality. Technol. Forecast. Soc. Change 198, 122949. doi:10.1016/j.techfore.2023.122949
Shobande, O. A., and Shodipe, O. T. (2019). Carbon policy for the United States, China and Nigeria: an estimated dynamic stochastic general equilibrium model. Sci. Total Environ. 697, 134130. doi:10.1016/j.scitotenv.2019.134130
Tanaka, T., Guo, J., Hiyama, N., and Arapinar, B. (2022). Optimality between time of estimation and reliability of model results in the Monte Carlo method: a case for a CGE model. Comput. Econ. 59 (1), 151–176. doi:10.1007/s10614-020-10080-8
Timilsina, G. R., Dissou, Y., Toman, M., and Heine, D. (2024). How can a carbon tax benefit developing economies with informality? A CGE analysis for Côte d’Ivoire. Clim. Policy 24 (1), 71–86. doi:10.1080/14693062.2023.2223530
Veitia, R. A. (2021). Clinical Genetics paving the way to the future. Clin. Genet. 99 (2), 217–218. doi:10.1111/cge.13899
Wang, C., Peng, Q., and Xu, L. (2020b). Decision and coordination of a low-carbon supply chain considering environmental tax policy on consumers. Kybernetes 8 (50), 2318–2346. doi:10.1108/K-05-2020-0318
Wang, T. S., Du, Y. Q., Fang, D. B., and Li, Z. C. (2020a). Berth allocation and quay crane assignment for the trade-off between service efficiency and operating cost considering carbon emission taxation. Transp. Sci. 5 (54), 1307–1331. doi:10.1287/trsc.2019.0946
Xavier, A., Scott, R. J., and Talseth-Palmer, B. (2021). Exome sequencing of familial adenomatous polyposis-like individuals identifies both known and novel causative genes. Clin. Genet. 100 (4), 478–483. doi:10.1111/cge.14029
Yadav, D., Mekhilef, S., Singh, B., and Rawa, M. (2021). Carbon trading analysis and impacts on economy in market-to-market coordination with higher PV penetration. IEEE Trans. Industry Appl. 57 (6), 5582–5592. doi:10.1109/TIA.2021.3105495
Zhang, X., and Ma, X. (2022). Feasible carbon-trade model for low-carbon density ecosystem. J. Appl. Ecol. 59 (4), 1086–1097. doi:10.1111/1365-2664.14119
Keywords: carbon trade, carbon tax, policy, economy, carbon emission reduction, CBE modelling, combined impacts
Citation: Fei Y and Jia C (2024) Impact of the “carbon trade—carbon tax” policy package on China’s macroeconomics and carbon emission reduction. Front. Environ. Sci. 12:1346166. doi: 10.3389/fenvs.2024.1346166
Received: 29 November 2023; Accepted: 07 June 2024;
Published: 15 August 2024.
Edited by:
Martin Siegert, University of Exeter, United KingdomReviewed by:
Izzet Ari, Social Sciences University of Ankara, TürkiyeBiswajit Sarkar, Yonsei University, Republic of Korea
Copyright © 2024 Fei and Jia. This is an open-access article distributed under the terms of the Creative Commons Attribution License (CC BY). The use, distribution or reproduction in other forums is permitted, provided the original author(s) and the copyright owner(s) are credited and that the original publication in this journal is cited, in accordance with accepted academic practice. No use, distribution or reproduction is permitted which does not comply with these terms.
*Correspondence: Cao Jia, Y2FvamlhMDgxOUAxMjYuY29t
 Yanying Fei1
 Cao Jia