 Zhihui Luo1
 Yu Liu
- 1School of Foreign Language and International Business, Guangdong Mechanical and Electrical Polytechnic, Guangzhou, China
- 2Key Laboratory of Ecosystem Network Observation and Modeling, Institute of Geographic Sciences and Natural Resources Research, Chinese Academy of Sciences, Beijing, China
- 3College of Resource and Environment, University of Chinese Academy of Sciences, Beijing, China
- 4School of Environmental and Chemical Engineering, Foshan University, Foshan, China
As a result of adaptation to the environment, the great environmental spatial heterogeneity leads to the high spatial heterogeneity of vegetation status. This coupling may be more apparent in water-limited drylands, where topography is the main determinant of small-scale variation in water availability and energy. Metrics describing this coupling may contribute to the detection of the extension of vegetation reshaped by human intervention and other driven forces. In this study, the heterogeneity index of coupling (HIC) was developed to indicate the coupling between spatial heterogeneity of vegetation status (Hv) and the spatial heterogeneity of topography (HT) in the Loess Plateau in northern China. The 16-day composed MODIS normalized vegetation index (NDVI) with a resolution of 250 m and SRTM DEM were employed to quantify the heterogeneity of vegetation status and the topographical heterogeneity. The results show that HIC varies among geomorphic zones, land cover types, and land cover change categories. Among all land cover types, HIC of sandy areas was the largest, followed by the HIC of the forest, shrub, farmland, and grassland. Among geomorphic zones, the highest HIC value appeared in plains with dense residential areas, followed by sandy land that is frequently reshaped by wind, rocky mountainous areas, hilly and gully loess plateaus, and loess tableland. It was revealed that the alternation of vegetation by human activities and natural disturbances shaped greater HIC. Results of this study approved the effectiveness of the HIC in reflecting the coupling of the vegetation status with topography at regional scale.
1 Introduction
The heterogeneous topography is of great importance to the spatial heterogeneity of vegetation growth status (Gale, 2000; Mata-González et al., 2002; Freitas Moreira et al., 2015; Jucker et al., 2018). In the long-term succession, feedbacks between vegetation and topography drive the coevolution of topography, vegetation composition, and growth status (Brocard et al., 2023). Vegetation adaptation to the heterogeneous local settings led to the spatial heterogeneity of morphological and physiological traits of vegetation (Jobbágy et al., 1996; Ivanov et al., 2008; Bisigato et al., 2016; Jucker et al., 2018). At global and regional scales, the spatial heterogeneity of water and radiation is the determinant of the spatial variation in vegetation status (Bailey, 2009). At the spatial scale of several kilometers to hundred kilometers, topography variation strongly differentiates the vegetation status (Wu and Archer, 2005; Ivanov et al., 2008) by shaping the spatial heterogeneity of water availability, radiation, and soil properties (Kumari et al., 2020). The semiarid environment is water-limited. Water availability constraints the colonization and growth of vegetation (Xia and Shao, 2008). Since variation in topography shapes heterogeneous water availability, particularly in hilly and gully areas (Bi et al., 2008; Zhu and Shao, 2008; Zhang et al., 2009; Wang et al., 2010), there may be great spatial heterogeneity in vegetation status as a response to the topographical heterogeneity. In natural succession, the pattern of spatial heterogeneity of vegetation growth status tends to be consistent with the topographical heterogeneity. Spatial heterogeneity and the temporal dynamic of vegetation cover are strongly mitigated by environmental factors and anthropogenic interventions (Bailey, 2009; Pound and Salzmann, 2017). Interventions by humans, such as vast revegetation, particularly afforestation and deforestation, may change the coupling between the heterogeneity of the vegetation status and the topography variation (Fu et al., 2017). The metric describing this coupling may contribute to detect the extension and hotspots of vegetation reshaping by human intervention, as well as other driven forces such as fire, wind, and geological events, beyond avenues such as land cover mapping (Song et al., 2018).
Vegetation indices derived from multispectral satellite imageries (Pettorelli et al., 2005; Zhang et al., 2006; Abel et al., 2019) effectively reflect the impacts of environmental factors and human interventions on the vegetation cover (Scanlon et al., 2002; Weiss et al., 2004) and thus were widely employed to reveal the vegetation change at the local, regional, and global scales (Walker et al., 2012; Streher et al., 2017; Engel et al., 2023). Among these indices, the normalized vegetation index (NDVI) is widely used due to its relevance to the photosynthesis activity of vegetation, which is greatly varied along the gradient of water availability and temperature (Chen et al., 2014; Wang et al., 2016). In the semiarid environment, the heterogeneity of topography significantly contributes to the spatial variation in NDVI (Zhan et al., 2012; Xiong and Wang, 2022). Reports have revealed an apparent correlation between topographical attributes and NDVI (Xiong et al., 2021) at all scales (Wu et al., 2009). The variation in the leaf area index (LAI), which correlates with NDVI, was also proved to be dependent on topography (Spadavecchia et al., 2008). Therefore, NDVI can be a suitable candidate to develop indicators describing the coupling between the spatial heterogeneity of vegetation status and spatial variation of topography.
Coupling between vegetation and topography is a hot topic in the Loess Plateau region in northern China due to the water-limited climate and the gully and hilly topography areas. The topography is a critical factor determining the spatial variation of solar radiation and water availability in this region (Yu et al., 2018; Xia et al., 2022), particularly in the hilly and gully areas with great variation in topography (Fu et al., 2017). Due to the vast area of land degradation and severe soil erosion with widely internal and external environment impacts (Zheng, 2005; Chen et al., 2007), it is a hotspot region targeted by the well-known Grain-for-Green Project launched in 1999 (Fu et al., 2017) featured with large-area afforestation in the beginning of 2000s (Feng et al., 2016a). The human intervention significantly changed the vegetation cover by afforestation and grazing control (Feng et al., 2016b; Fu et al., 2017; Wang et al., 2017). In this water-limited arid and semiarid environment, the coupling between the planted vegetation and topography differed from that of the naturally evolved vegetation, which has a spatial heterogeneity pattern coincide with the topographical pattern. Therefore, it is an ideal test region for the indices indicating the coupling between the spatial heterogeneity of vegetation status and spatial heterogeneity of topography.
The objective of this study is to develop a metric quantifying the coupling between the spatial heterogeneity of vegetation status and the topography variation. First, the heterogeneity index of coupling (HIC) delineating the coupling between the spatial heterogeneity of vegetation growth status and topography spatial variation was developed. Second, as a test case, the HIC of the Loess Plateau in northern China was mapped to reveal the impact of human intervention and geomorphic attributes.
2 Methodology
2.1 Description of the study area
The Loess Plateau (LP) region is in the middle part of the Yellow River Basin (Figure 1). It is adjacent to the Qin Mountains in the south, the Yinshan Mountains in the north, the Taihang Mountains in the east, and the Wuqiaoling and Riyueshan mountains in the west. This topographically complex region covers 287 counties across Shaanxi, Shanxi, Inner Mongolia, Ningxia, Qinghai, Gansu, and Henan. Its territory comprises 620,000 km2. The climate is arid in the northwest and semiarid in the southeast. The annual precipitation in this region ranges from 50 mm in the arid area to 700 mm in the semiarid area (Figure 1). Most rainfall occurred during June and September (Chen et al., 2007; Fu et al., 2017). The Loess Plateau is covered by thick loess and is well-known as the largest region with loess deposition, which is suitable for agriculture (Li et al., 2015). Gullies developed well in this topographically fragmented plateau (Cai, 2001; Li et al., 2003). In addition, the soil has a weak structure and is highly erodible, which makes the Loess Plateau a global hotspot of soil and water loss (He et al., 2004; Boardman, 2006). Revegetation was a dominant countermeasure adopted to prevent severe soil erosion on the Loess Plateau. Since the 1990s, driven by the national ecological restoration actions, the fast-growing economy, and the change in industrial composition, the Loess Plateau, particularly the gully and hilly areas, has entered an era of extensive and rapid revegetation through afforestation and grazing management (Fu et al., 2017; Wang et al., 2017).
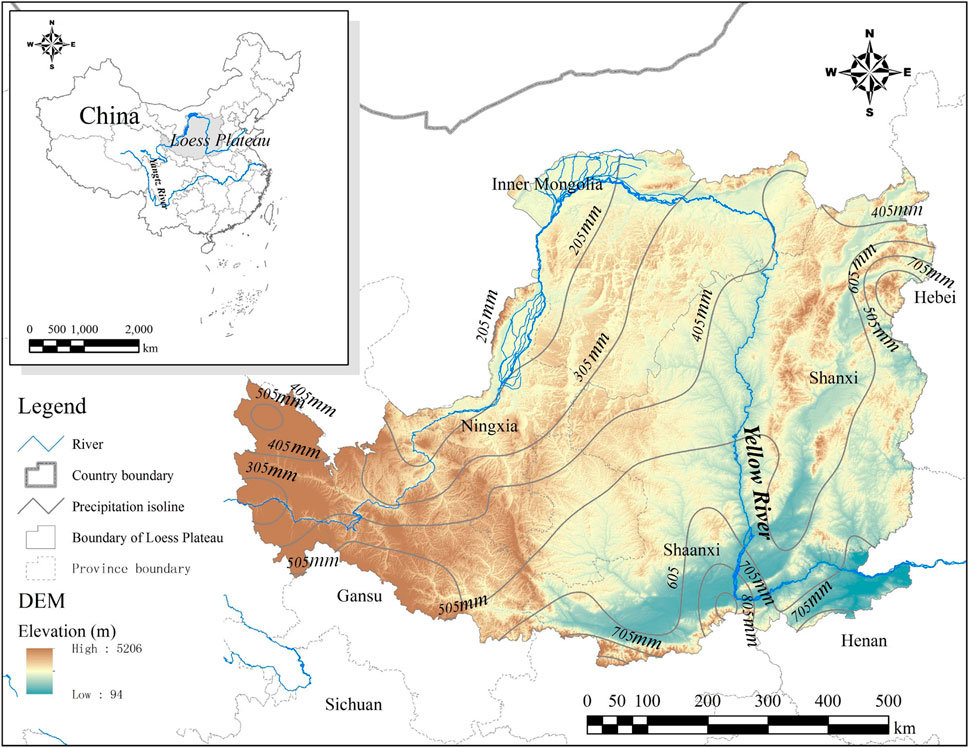
FIGURE 1. Location, topography, and precipitation of the Loess Plateau.
2.2 The heterogeneity index of coupling
The heterogeneity index of coupling (HIC) is proposed based on the reality of vegetation adaptation to environmental conditions adjusted by topographical variation. Under natural succession, topography with a great spatial heterogeneity shapes heterogeneous local settings, such as soil properties, available water, and solar radiation (Aguilar et al., 2010; Hoylman et al., 2019; Chen et al., 2024), for plant colonization and growth. While topography with low variation shapes homogeneous local settings and thus uniform vegetation cover. Consequently, the spatial heterogeneity of vegetation (Hv) tends to coincide with the spatial heterogeneity of topography (HT). However, human interventions, such as afforestation in mountainous areas and diversity land use in plains, and natural disturbances such as fire and wind scouring may change this relationship and lead to the decoupling of Hv and HT.
In arid and semiarid environments, the vegetation is water-limited (Wang et al., 2011; Wang et al., 2013), and topography plays a critical role in shaping the heterogeneity of soil water at the local scale, which leads to the variation in vegetation status among aspects and slope positions (Liu and Fu, 2013). Without anthropogenic intervention, the heterogeneity of vegetation growth status (
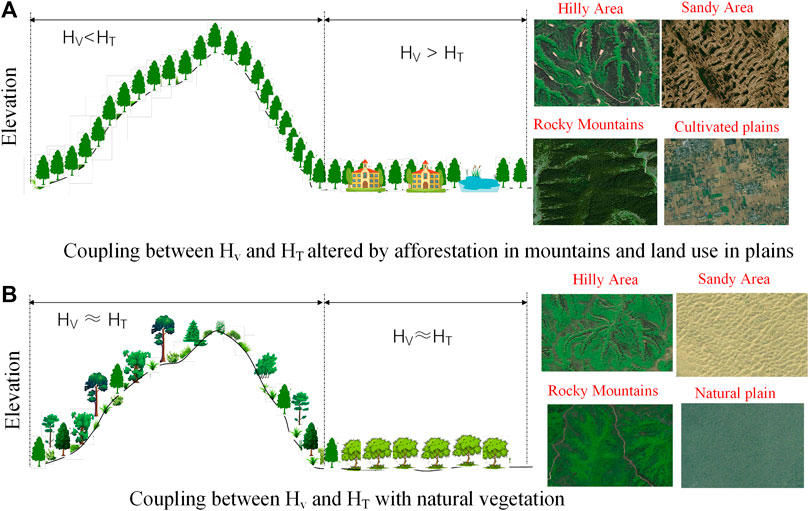
FIGURE 2. Illustration of the coupling between vegetation heterogeneity and topographical heterogeneity in landscape with the vegetation cover altered (A) and with natural vegetation (B).
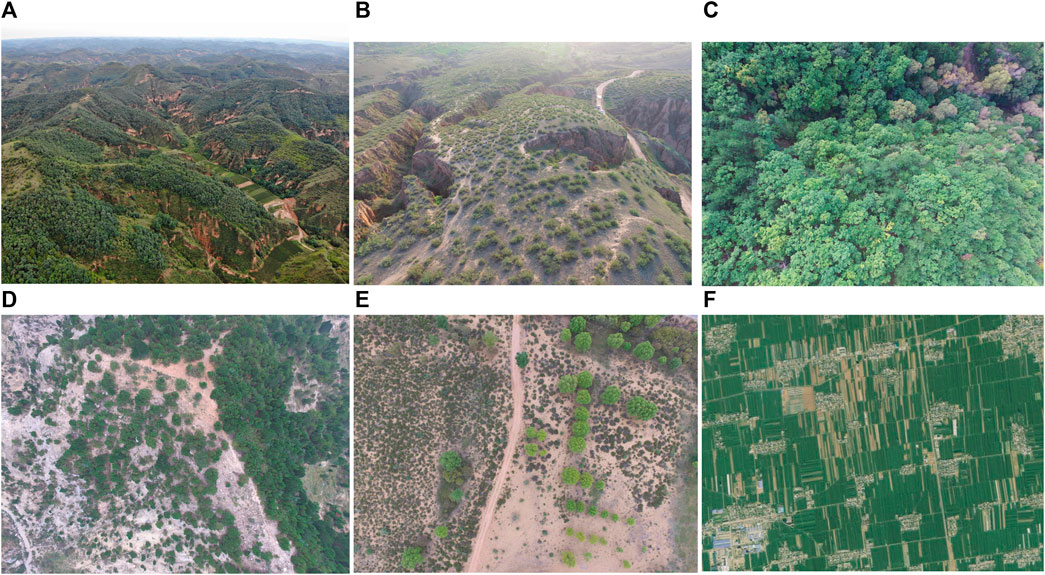
FIGURE 3. Typical landscapes in the Loess Plateau region: (A) planted forest in the hilly and gully area; (B) planted shrubs in the hill and gully area; (C) natural forests in the hilly and gully area; (D) planted forest in the rocky mountainous area; (E) planted shrubs and trees in sandy area; (F) mosaic landscape in plain.
In this study, the HIC was developed to quantify the coupling between the spatial heterogeneity of the vegetation index and spatial variation in topography. The coupling and decoupling between the spatial heterogeneity of topography and that of vegetation growth status can be observed by the coincidence and deviation between Hv and HT. HT and Hv is indicated by the spatial variation in elevation and the vegetation index, respectively. HIC is quantified as the difference between
HIC > 0 implies the greater spatial heterogeneity of the vegetation index than that of elevation. While HIC < 0 indicates a lower spatial heterogeneity of the vegetation index than that of elevation. HIC equals 0 means a total coupling between the spatial heterogeneity of vegetation index and the spatial heterogeneity of elevation.
The Block Statistics tool of ArcGIS 10.3 (Environmental Systems Research Institute Inc., California, United States) was applied to calculate HIC. The Block Statistics tool performs a neighborhood operation that calculates a statistic for input grid cells within a fixed set of non-overlapping windows. The statistic (e.g., standard deviation, maximum, average, or sum) is calculated for all input cells contained within each window. The resulting value for an individual block is assigned to all cells located in the minimum bounding rectangle window. Since the windows do not overlap, any cell is included in the calculations for one block only. The shape of a window was rectangle in this study. Possible statistics that can be calculated within a window are mean, majority, maximum, median, minimum, minority, range, standard deviation, sum, and variety. In this study, the MODIS NDVI with a spatial resolution of 250 m and the grid DEM with a cell size of 90 m were used to calculate the HIC of rectangle windows with a size of 2.5 km × 2.5 km. Therefore, each window covers 100 grid cells of NDVI and approximately 771 grid cells of DEM.
where
The Loess Plateau is an ideal region to test the effectiveness of HIC for several reasons. First, the topography in this area varied from south to north and from west to east (Figure 1). Second, the Loess Plateau covered areas experienced rapid revegetation after 1999 (Fu et al., 2017) and areas covered by forest experienced long-term succession (Zheng, 2006; Liu et al., 2020). Third, this region included high plains, thick loess-covered gully and hilly mountains, sandy areas, rocky mountainous areas, and basins with large plains. In addition, the remote area with low population density and spot residential areas and the areas with high population density and sprawl built-up areas concurred in this region. So the Loess Plateau provided an ideal test scenario for HIC.
2.3 Data sources and processing
The 16-day composited MODIS NDVI dataset (MOD13Q1) with a resolution of 250 m during 2000–2015 was downloaded from the website of NASA (https://earthdata.nasa.gov/). This NDVI dataset was produced based on a surface reflectance algorithm applying a set of filters based on quality, cloud, and viewing geometry (Didan, 2021). The production flow of this dataset also included minimizing the BRDF (bidirectional reflectance distribution function) effects, the impact of cloud/smoke contamination, and the impact of aerosols. The annual sums of the 16-day composited NDVI were calculated for the Block Statistics in ArcGIS 10.3 (Environmental Systems Research Institute Inc., California, United States). The annual maximum NDVI was calculated based on the 16-day composited MODIS NDVI data. Geomorphological zonation data were downloaded from the Resource and Environment Data Cloud Platform (http://www.resdc.cn/). The land cover data on the Loess Plateau in 2000 and 2015 were produced by using the Landsat imageries (Zhang et al., 2014; Zhu et al., 2017). Specifically, the Landsat TM imageries were adopted to produce the land cover in 2000. For producing the land cover of 2015, Landsat 8 OLI imageries were used. The object-based classification (Zhang et al., 2014) was used to extract land covers, including forest land, shrubland, grassland, farmland, built-up area, water bodies, and bare area. The 90-m SRTM DEM was downloaded from the geospatial data cloud (http://www.gscloud.cn). The zonal statistics tool in ArcGIS 10.3 (Environmental Systems Research Institute Inc., California, United States) was used to summarize the HIC for geomorphological zones, land cover categories, and land cover change types. The consistence of HIC was evaluated by comparing HIC calculated by using NDVI, and EVI. The impact of spatial resolution was analyzed by adopting 250-m MODIS NDVI data and 10-m Sentinel-2A NDVI data in a sampled area in the central area of the Loess Plateau. Excel 2010 was employed in statistical analysis.
3 Results
3.1 Land cover change
The land cover in the Loess Plateau region changed in large magnitude and with great spatial heterogeneity from 2000 to 2015. In this period, land cover change featured with expanded vegetated area and built-up area (Figures 4A, C, D), shrunk farmland and declined bare area (Figure 4B, C, D). Several urban agglomerations formed in the northern high plain and plains in the southern and eastern parts. In the gully and hilly areas that extend from the northeastern to southwestern part of the Loess Plateau, farmland shrank dramatically, accompanied by the vast expansion of grassland, shrubland and forest land (Figure 4). The bare area (mostly sandy area and desert) also retreated obviously in the northwest of the Loess Plateau. Forest cover expanded rapidly in the hilly and gully regions in the central area and rock mountains in the eastern part (Figures 4A, B), which was driven by extensive afforestation (Lü et al., 2012; Fu et al., 2017).
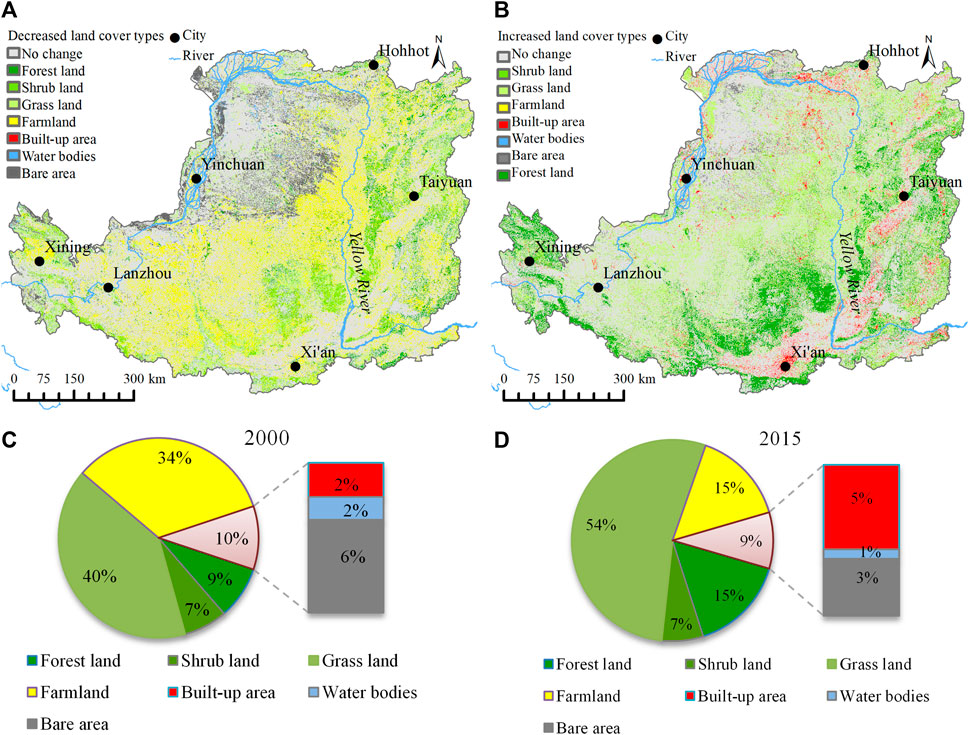
FIGURE 4. Land cover shrinking (A) and expansion (B) from 2000 to 2015 and land cover composition in 2000 (C) and 2015 (D) on the Loess Plateau.
3.2 Dependence of HIC on data resolution
The spatial pattern of the HIC is consistent among datasets with different spatial resolutions. The heterogeneity of vegetation measured (
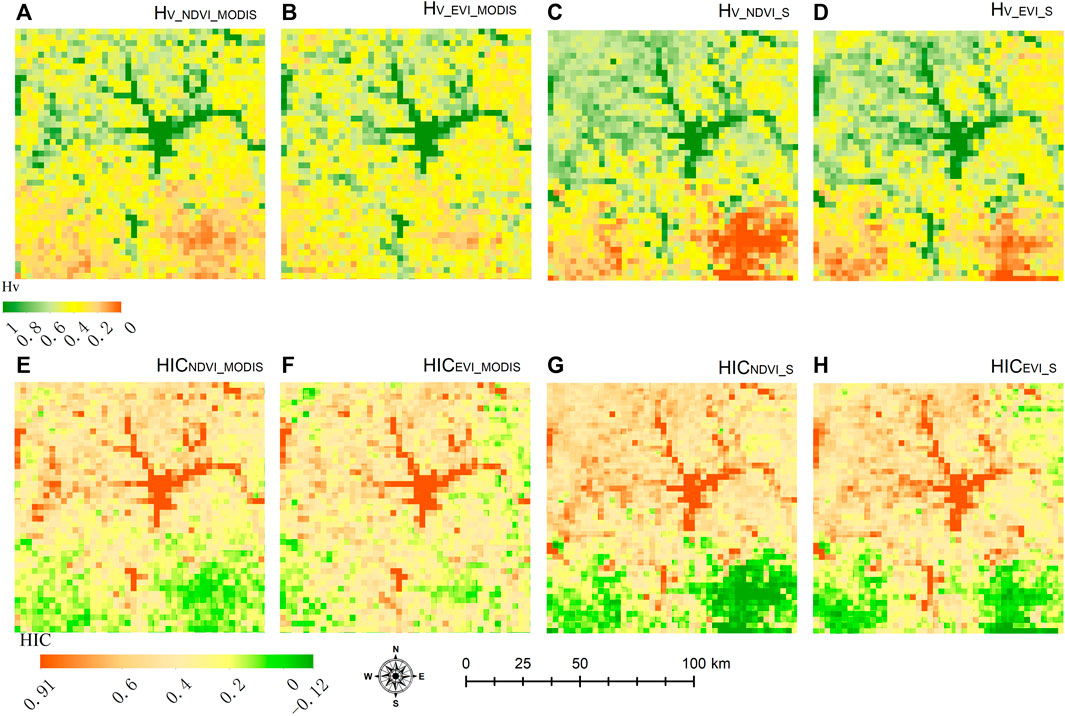
FIGURE 5. Spatial patterns of Hv and HIC calculated using MODIS and Sentinel-2 data: (A) Hv derived from MODIS NDVI (Hv_NDVI_MODIS); (B) Hv derived from MODIS EVI (Hv_EVI_MODIS); (C) Hv derived from Sentinel-2 NDVI (Hv_NDVI_S); (D) Hv derived from Sentinel-2 EVI (Hv_EVI_S and HICNDVI_MODIS), EVI (Hv_EVI_MODIS and HICEVI_MODIS), and Sentinel-2 NDVI (Hv_NDVI_IS and HICNDVI_S) and EVI (Hv_EVI_S and HICEVI_S).
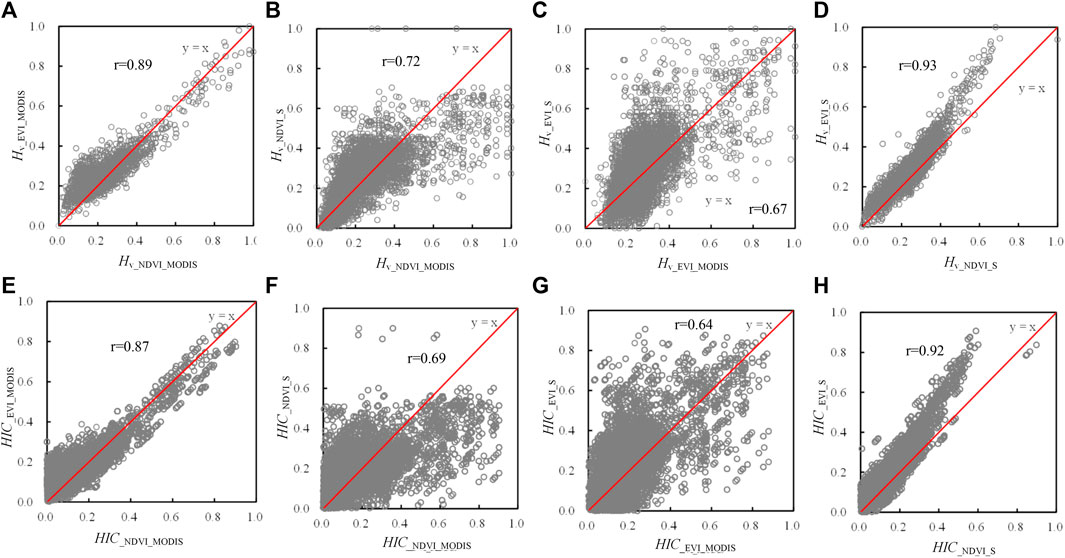
FIGURE 6. Comparison of
3.3 Vegetation–topography coupling of land use change categories
The HIC varies among land cover categories (Figure 7A). In 2000, the value of HIC ordered as bare area > forestland > shrubland > farmland > grassland. In 2015, the order changed into bare area > farmland > shrubland > grassland > forest land. In 2000, the HIC of all land cover types was greater than zero (Figure 7A). However, in 2015, the HIC of forest land, shrubland, and grassland was in minus, which implied that the spatial heterogeneity of NDVI was lower than that of topography. The HIC of farmland and bare area was greater than zero both in 2000 and 2015, which implied that the spatial heterogeneity of the NDVI was greater than the spatial variation of topography. The HIC of forest land, shrubland, grassland, and bare area in 2000 was greater than that in 2015. This indicates that the vegetation growth status in forest land, shrubland, grassland, and bare area became more homogeneous. However, the HIC of farmland has increased from 2000 to 2015, which may be attributed to the more diverse utilization of farmland.
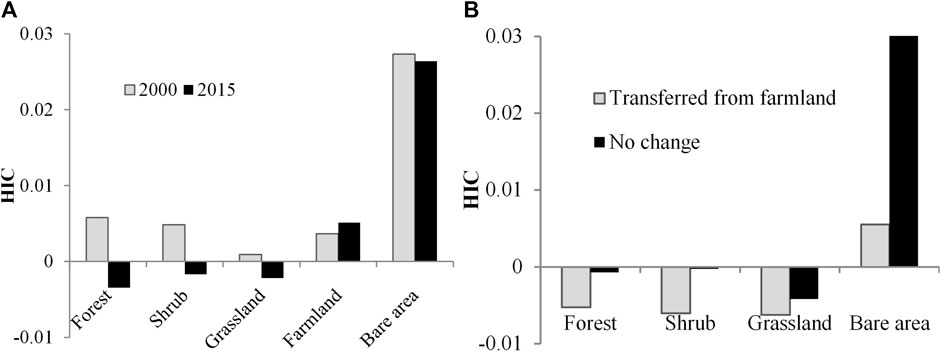
FIGURE 7. Variation in HIC among land cover types and land use changes: (A) mean HIC of land cover types in 2000 and 2015 and (B) HIC of land cover types transformed from farmland and unchanged.
Land cover change included shifts among the land cover categories and changes in properties such as configuration and coverage while maintaining the same land cover category. Both changes reshaped the coupling of spatial heterogeneity between vegetation indices and topography. As shown in Figure 7B, HIC decreased and deviated more from zero in the areas with the land cover shifting from farmland to forest, shrub, and grassland compared with areas with unchanged land cover types. However, the HIC of bare areas transferred from farmland was lower than that of unchanged bare areas, which can be attributed to the great spatial heterogeneity of vegetation in sandy bare land in the northwest part of this region.
The temporal dynamic of HIC in areas with unchanged land cover types varied among land cover types (Figure 8A). Generally, the HIC of bare areas showed apparently different temporal trajectory compared with other land cover types. It was above zero all the time and increased from 2001 to 2012, and then declined. HIC in forest land and shrubland generally declined and was gradually close to zero in this period. HIC in grassland was the lowest among land cover types in the studied period and close to zero. Farmland HIC was greater than zero all the time and declined before 2004, and then gradually moved into a steady stage (Figure 8A).
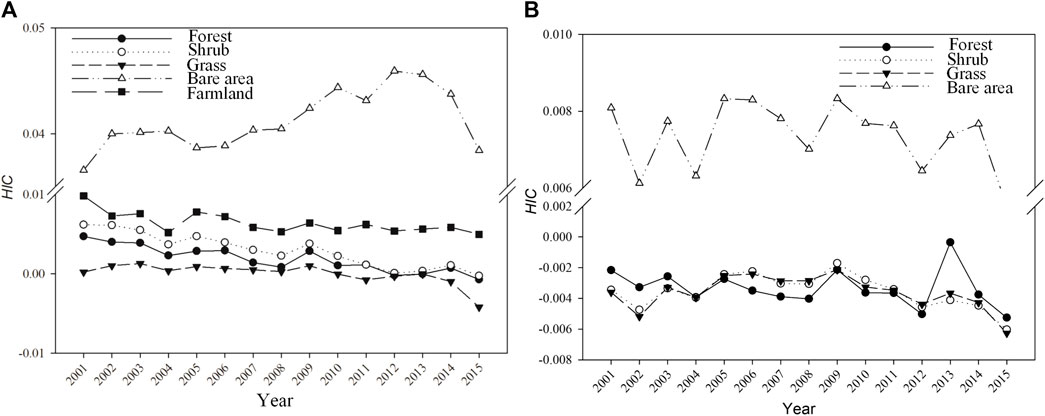
FIGURE 8. Temporal evolution of HIC of unchanged land use types (A) and HIC of land covers converted from farmland (B).
The temporal dynamics of HIC from 2001 to 2015 differed between land use change modes. Retiring farmland for revegetation and desertification of farmland are two avenues of farmland shrinking in the Loess Plateau. It led to a distinguished trajectory of HIC evolution (Figure 8B). In areas where farmland shifted into bare areas, HIC fluctuated greatly and was greater than zero during 2000–2015. However, in the areas where farmlands were retired for revegetation, HIC remained below zero and in a fluctuating pattern with a smaller magnitude than those areas transformed into bare areas (Figure 8B). After 2009, it declined (Figure 8B).
3.4 Vegetation–topography coupling in geomorphological zones
The spatial heterogeneity of topography and the vegetation index showed inconsistent patterns in the Loess Plateau region. In the northwestern and the southeastern parts of this region, the plain is dominant (Figure 9A). In the gully and hilly zones extended from southwest to northeast part of this region, the topography has great spatial variation (Figure 9A). The spatial heterogeneity of mean NDVI during 2001–2015 was great in the rocky mountainous area in the eastern part of this plateau (Figure 9B). However, in the gully and hilly zones, the spatial heterogeneity of NDVI was low (Figure 9B) and inconsistent with the highly heterogeneous topography. Consequently, the HIC was low in the hilly and gully areas. In areas covered by forests in the gully and hilly regions that experienced revegetation over 60 years (Zheng, 2006), HIC was apparently greater than in other areas with similar topographical patterns (Figure 9C). In plains such as those around Xi’an and Taiyuan, where farmland and residential landscapes dominated, the HIC also was rather high (Figure 9C).
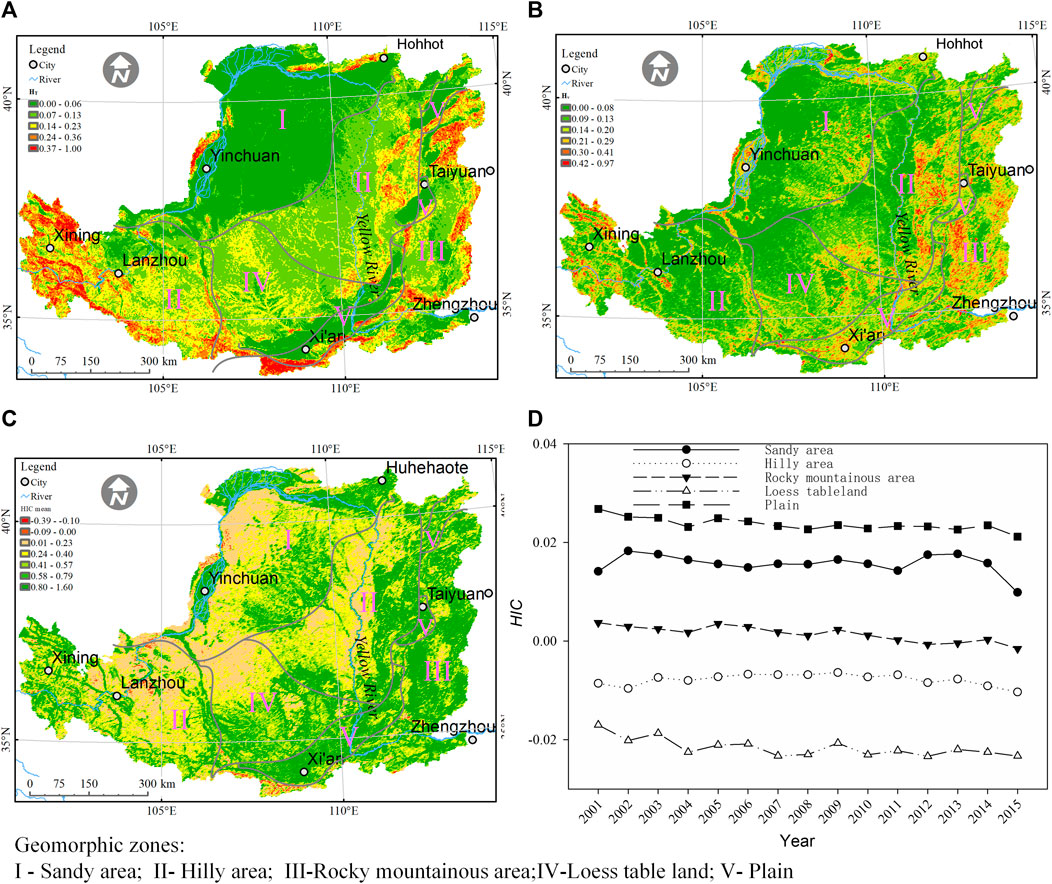
FIGURE 9. Spatial pattern and temporal trajectory of vegetation–topography coupling among geomorphological zones: the heterogeneity of topography (A), mean Hv (B), and (C) mean HIC during 2001–2015 and (D) temporal trajectory of HIC in geomorphic zones.
As shown by the HIC, the temporal dynamic of the coupling between
4 Discussions
4.1 Effectiveness of HIC
The HIC measuring the coupling between the spatial heterogeneity of vegetation status and the spatial variation in topography is an effective indicator to detect the human intervention of landscape in large extension. The spatial pattern of HIC was consistent with the regional pattern of revegetation. As revealed in this study, afforestation led to a lower NDVI spatial heterogeneity than the topographical heterogeneity (Figures 8, 9). There were afforestation in the abandoned farmlands in the hilly and gully areas and the sandy areas (Figures 3A, B, D, E, F), nursing the natural vegetation (Figure 3C) and rapid land use change in the past decades (Feng et al., 2016a; Fu et al., 2017). As shown in this study, during 2001–2015, the HIC of land use types consistently declined except of sandy areas. This implied a continuous declined spatial heterogeneity of NDVI caused by the extensive farmland retirement for revegetation. The declined HIC in areas with farmland abandonment for revegetation revealed that the revegetation of the farmlands reduced the spatial heterogeneity of vegetation. The Loess tableland area, hilly area, and rocky mountainous area were prior areas to implement the revegetation projects by planting trees (Figures 3A, B, D, E, F) (Cao et al., 2009; Chen et al., 2015; Zhou et al., 2019). The vegetation status was rather homogeneous, as revealed by the NDVI. Consequently, the HIC was relatively low, even though the topography was of great spatial heterogeneity. In the plains in the southern and northern parts, the land use types are diverse (Figure 4). Since most of the areas in plains are agricultural lands and residential areas (Figure 4), the land use intensity was high. Consequently, the spatial variation in vegetation was greater than that of terrain and was greatest among all the geomorphological zones. Due to the long history of cultivation, the HIC of plains was high and rather stable during the study period. In the plains, the sprawl of urban areas and built-up areas, and the diversification of the agricultural plots promoted the spatial heterogeneity of the vegetation status (Yan et al., 2009; Kou et al., 2021) and led to the greater NDVI heterogeneity than topographical variation (Figures 8, 9). Consequently, HIC was very high in these areas.
4.2 Regime of coupling between the spatial heterogeneity of vegetation and topography
Resistance to disturbances sourced from physical processes or anthropogenic activities and intensity of disturbances are of critical importance for the coupling between the spatial heterogeneity of vegetation status and spatial variation of topography. As revealed by the spatial and temporal patterns of HIC among geomorphological zones, in the area where vegetation is vulnerable to natural disturbances or intensively altered by human interventions, the heterogeneity of vegetation status was greater than the topographical heterogeneity (Figure 9). The vegetation in the sandy area has a great inter-annual variation and spatial heterogeneity due to the intensive disturbance of sand movement (Richards et al., 2022). Therefore, the HIC of the bare area was the greatest among land cover types during the studied period (Figure 9).
As the ecosystem succession progresses, the homogeneous status of planted vegetation will change into heterogeneous patterns (Liu et al., 2020) due to the spatial variation in available water, radiation, and soil nutrients, as well the interaction of plants and various disturbances. The human intervention-shaped homogeneous land will change into the heterogeneous land due to adaptation to the local environment. Therefore, the decoupling between the heterogeneity of vegetation status and the topographical variation in revegetated areas will be replaced by the coupling as the ecosystem succession progresses (Figure 3C). The age of vegetation established by revegetation in most areas of the Loess Plateau was shorter than 30 years. From the perspective of ecosystem succession, the climate climaxes of species composition and coupling of vegetation cover to topography have not been reached. Therefore, during the mapped period, there was a lower heterogeneity of NDVI than the heterogeneity of topography in these areas.
4.3 Data scale issues in quantifying vegetation–topography coupling
Vegetation–topography coupling is an issue at various spatial scales (Yousefi Lalimi et al., 2017; Xiong and Wang, 2022; Brocard et al., 2023). As reported by various literatures (Radeloff et al., 2019; Shen et al., 2020; Shahzaman et al., 2021), different vegetation indices reflect different aspects of vegetation status. Therefore, the spatial heterogeneity of vegetation growth status may differ because of using different vegetation indices. As shown in Figure 5, the spatial patterns of Hv and HIC estimated by using the enhanced vegetation index (EVI) are well-consistent with those estimated by using the NDVI. The statistical comparative analysis of Hv (r = 0.89 for MODIS data and r = 0.93 for Sentinel-2 data) and HIC (r = 0.87 for MODIS data and r = 0.92 for Sentinel-2 data) also showed a good correlation between NDVI and EVI. However, the pattern of HIC may apparently be different when using the vegetation index with a different resolution (Figures 5, 6B). For Hv calculated by using NDVI and EVI, the correlation coefficient between MODIS data and Sentinel-2 data was 0.72 and 0.67, respectively. For HIC, they were 0.69 and 0.64, respectively. Generally, the consistency of HIC between the two data sources is better when using NDVI rather than using EVI. Since this study was conducted at regional scale, the resolution of the analysis is coarse. The further classification of forests was not adopted. However, the spatial pattern of land cover categories should be included in studies at the local scale because the high resolution is needed. For instance, more detailed forest classifications (Ivanova et al., 2022) related to specific local settings (Pfister and Arno, 1980) should be adopted.
5 Conclusion
This study developed the HIC to quantify the coupling between the spatial heterogeneity of vegetation growth status (
Data availability statement
The original contributions presented in the study are included in the article/Supplementary Material; further inquiries can be directed to the corresponding author.
Author contributions
ZL: investigation, visualization, and writing–original draft. YL: investigation, visualization, conceptualization, funding acquisition, methodology, supervision, and writing–review and editing. HZ: conceptualization, and writing–review and editing.
Funding
The author(s) declare that financial support was received for the research, authorship, and/or publication of this article. The National Key Research and Development Program of China (grant nos 2018YFE0106000 and 2022YFB3903304), the National Natural Science Foundation of China (grant no. 42071239) and the 2022 Guangzhou City “14th Five-Year” Philosophy and Social Science Program (2022GZGJ71) funded this work.
Conflict of interest
The authors declare that the research was conducted in the absence of any commercial or financial relationships that could be construed as a potential conflict of interest.
Publisher’s note
All claims expressed in this article are solely those of the authors and do not necessarily represent those of their affiliated organizations, or those of the publisher, the editors, and the reviewers. Any product that may be evaluated in this article, or claim that may be made by its manufacturer, is not guaranteed or endorsed by the publisher.
References
Abel, C., Horion, S., Tagesson, T., Brandt, M., and Fensholt, R. (2019). Towards improved remote sensing based monitoring of dryland ecosystem functioning using sequential linear regression slopes (SeRGS). Remote Sens. Environ. 224, 317–332. doi:10.1016/j.rse.2019.02.010
Aguilar, C., Herrero, J., and Polo, M. J. (2010). Topographic effects on solar radiation distribution in mountainous watersheds and their influence on reference evapotranspiration estimates at watershed scale. Hydrol. Earth Syst. Sci. 14, 2479–2494. doi:10.5194/hess-14-2479-2010
Bailey, R. G. (2009). Ecosystem geography: from ecoregions to sites. Singapore: Springer Science and Business Media.
Bi, H. X., Zhang, J. J., Zhu, J. Z., Lin, L. L., Guo, C. Y., Ren, Y., et al. (2008). Spatial dynamics of soil moisture in a complex terrain in the semi-arid Loess Plateau region, China. J. Am. Water Resour. Assoc. 44, 1121–1131. doi:10.1111/j.1752-1688.2008.00236.x
Bisigato, A. J., Hardtke, L. A., Del Valle, H. F., Bouza, P. J., and Palacio, R. G. (2016). Regional-scale vegetation heterogeneity in northeastern Patagonia: environmental and spatial components. Community Ecol. 17, 8–16. doi:10.1556/168.2016.17.1.2
Boardman, J. (2006). Soil erosion science: reflections on the limitations of current approaches. Catena 68, 73–86. doi:10.1016/j.catena.2006.03.007
Brocard, G., Willebring, J. K., and Scatena, F. N. (2023). Shaping of topography by topographically-controlled vegetation in tropical montane rainforest. PLOS ONE 18, e0281835. doi:10.1371/journal.pone.0281835
Cai, Q.-G. (2001). Soil erosion and management on the Loess Plateau. J. Geogr. Sci. 11, 53–70. doi:10.1007/bf02837376
Cao, S. X., Chen, L., and Yu, X. X. (2009). Impact of China's Grain for Green Project on the landscape of vulnerable arid and semi-arid agricultural regions: a case study in northern Shaanxi Province. J. Appl. Ecol. 46, 536–543. doi:10.1111/j.1365-2664.2008.01605.x
Chen, L. D., Wei, W., Fu, B. J., and Lu, Y. H. (2007). Soil and water conservation on the Loess Plateau in China: review and perspective. Prog. Phys. Geogr. 31, 389–403. doi:10.1177/0309133307081290
Chen, M., Yang, X., Zhang, X., Bai, Y., Shao, M. A., Wei, X., et al. (2024). Response of soil water to long-term revegetation, topography, and precipitation on the Chinese Loess Plateau. CATENA 236, 107711. doi:10.1016/j.catena.2023.107711
Chen, T., De Jeu, R. a.M., Liu, Y. Y., Van Der Werf, G. R., and Dolman, A. J. (2014). Using satellite based soil moisture to quantify the water driven variability in NDVI: a case study over mainland Australia. Remote Sens. Environ. 140, 330–338. doi:10.1016/j.rse.2013.08.022
Chen, Y., Wang, K., Lin, Y., Shi, W., Song, Y., and He, X. (2015). Balancing green and grain trade. Nat. Geosci. 8, 739–741. doi:10.1038/ngeo2544
Engel, T., Bruelheide, H., Hoss, D., Sabatini, F. M., Altman, J., Arfin-Khan, M. a.S., et al. (2023). Traits of dominant plant species drive normalized difference vegetation index in grasslands globally. Glob. Ecol. Biogeogr. 32, 695–706. doi:10.1111/geb.13644
Feng, X., Fu, B., Piao, S., Wang, S., Ciais, P., Zeng, Z., et al. (2016b). Revegetation in China’s Loess Plateau is approaching sustainable water resource limits. Nat. Clim. Change 6, 1019–1022. doi:10.1038/nclimate3092
Feng, X., Fu, B.-J., Piao, S., Wang, S., Ciais, P., Zeng, Z., et al. (2016a). Revegetation in China's Loess Plateau is approaching sustainable water resource limits. Nat. Clim. Change 6, 1019–1022. doi:10.1038/nclimate3092
Freitas Moreira, E., Boscolo, D., and Viana, B. (2015). Spatial heterogeneity regulates plant-pollinator networks across multiple landscape scales. PLoS ONE 10, e0123628. doi:10.1371/journal.pone.0123628
Fu, B., Wang, S., Liu, Y., Liu, J., Liang, W., and Miao, C. (2017). Hydrogeomorphic ecosystem responses to natural and anthropogenic changes in the Loess Plateau of China. Annu. Rev. Earth Planet. Sci. 45, 223–243. doi:10.1146/annurev-earth-063016-020552
Gale, N. (2000). The relationship between canopy gaps and topography in a western ecuadorian rain forest. Biotropica 32, 653–661. doi:10.1111/j.1744-7429.2000.tb00512.x
He, X. B., Tang, K. L., and Zhang, X. B. (2004). Soil erosion dynamics on the Chinese Loess Plateau in the last 10,000 years. Mt. Res. Dev. 24, 342–347. doi:10.1659/0276-4741(2004)024[0342:sedotc]2.0.co;2
Hoylman, Z. H., Jencso, K. G., Hu, J., Holden, Z. A., Martin, J. T., and Gardner, W. P. (2019). The climatic water balance and topography control spatial patterns of atmospheric demand, soil moisture, and shallow subsurface flow. Water Resour. Res. 55, 2370–2389. doi:10.1029/2018wr023302
Ivanov, V. Y., Bras, R. L., and Vivoni, E. R. (2008). Vegetation-hydrology dynamics in complex terrain of semiarid areas: 1. A mechanistic approach to modeling dynamic feedbacks. Energy-water controls Veg. spatiotemporal Dyn. Topogr. niches Favor. 44, W03430. doi:10.1029/2006wr005588
Ivanova, N., Fomin, V., and Kusbach, A. (2022). Experience of forest ecological classification in assessment of vegetation dynamics. Sustainability 14, 3384. doi:10.3390/su14063384
Jobbágy, E. G., Paruelo, J. M., and León, R. J. C. (1996). Vegetation heterogeneity and diversity in flat and mountain landscapes of Patagonia (Argentina). J. Veg. Sci. 7, 599–608. doi:10.2307/3236310
Jucker, T., Bongalov, B., Burslem, D. F. R. P., Nilus, R., Dalponte, M., Lewis, S. L., et al. (2018). Topography shapes the structure, composition and function of tropical forest landscapes. Ecol. Lett. 21, 989–1000. doi:10.1111/ele.12964
Kou, P., Xu, Q., Jin, Z., Yunus, A. P., Luo, X., and Liu, M. (2021). Complex anthropogenic interaction on vegetation greening in the Chinese Loess Plateau. Sci. Total Environ. 778, 146065. doi:10.1016/j.scitotenv.2021.146065
Kumari, N., Saco, P. M., Rodriguez, J. F., Johnstone, S. A., Srivastava, A., Chun, K. P., et al. (2020). The grass is not always greener on the other side: seasonal reversal of vegetation greenness in aspect-driven semiarid ecosystems. Geophys. Res. Lett. 47, e2020GL088918. doi:10.1029/2020gl088918
Li, X., Jin, Z., Zhang, X., Zhou, W., and Liu, T. (2015). Immunohistochemical expression of cytokeratins in human salivary gland acinic cell carcinomas. J. Earth Environmen 6, 248–257. (in Chinese with english abstract). doi:10.1016/j.oooo.2015.04.014
Li, Y., Poesen, J., Yang, J. C., Fu, B., and Zhang, J. H. (2003). Evaluating gully erosion using 137Cs and 210Pb/137Cs ratio in a reservoir catchment. Soil and Tillage Res. 69, 107–115. doi:10.1016/s0167-1987(02)00132-0
Liu, Y., and Fu, B. (2013). Topographical variation of vegetation cover evolution and the impact of land use/cover change in the Loess Plateau. Arid. Land Geogr. 36, 1097–1102. doi:10.13826/j.cnki.cn65-1103/x.2013.06.004 (in Chinese with english abstract)
Liu, Y., Zhu, G., Hai, X., Li, J., Shangguan, Z., Peng, C., et al. (2020). Long-term forest succession improves plant diversity and soil quality but not significantly increase soil microbial diversity: evidence from the Loess Plateau. Ecol. Eng. 142, 105631. doi:10.1016/j.ecoleng.2019.105631
Lü, Y., Fu, B., Feng, X., Zeng, Y., Liu, Y., Chang, R., et al. (2012). A policy-driven large scale ecological restoration: quantifying ecosystem services changes in the Loess Plateau of China. PLoS ONE 7, e31782. doi:10.1371/journal.pone.0031782
Mata-González, R., Pieper, R. D., and Cárdenas, M. M. (2002). Vegetation patterns as affected by aspect and elevation in small desert mountains. Southwest. Nat. 47, 440–448. doi:10.2307/3672501
Pettorelli, N., Vik, J. O., Mysterud, A., Gaillard, J. M., Tucker, C. J., and Stenseth, N. C. (2005). Using the satellite-derived NDVI to assess ecological responses to environmental change. Trends Ecol. Evol. 20, 503–510. doi:10.1016/j.tree.2005.05.011
Pfister, R. D., and Arno, S. F. (1980). Classifying forest habitat types based on potential climax vegetation. For. Sci. 26, 52–70. doi:10.1093/FORESTSCIENCE/26.1.52
Pound, M. J., and Salzmann, U. (2017). Heterogeneity in global vegetation and terrestrial climate change during the late Eocene to early Oligocene transition. Sci. Rep. 7, 43386. doi:10.1038/srep43386
Radeloff, V. C., Dubinin, M., Coops, N. C., Allen, A. M., Brooks, T. M., Clayton, M. K., et al. (2019). The dynamic habitat indices (DHIs) from MODIS and global biodiversity. Remote Sens. Environ. 222, 204–214. doi:10.1016/j.rse.2018.12.009
Richards, J. H., Smesrud, J. K., Williams, D. L., Schmid, B. M., Dickey, J. B., and Schreuder, M. D. (2022). Vegetation, hydrology, and sand movement interactions on the slate canyon alluvial fan-keeler dunes complex, owens valley, California. Aeolian Res. 54, 100773. doi:10.1016/j.aeolia.2022.100773
Scanlon, T. M., Albertson, J. D., Caylor, K. K., and Williams, C. A. (2002). Determining land surface fractional cover from NDVI and rainfall time series for a savanna ecosystem. Remote Sens. Environ. 82, 376–388. doi:10.1016/s0034-4257(02)00054-8
Shahzaman, M., Zhu, W., Bilal, M., Habtemicheal, B. A., Mustafa, F., Arshad, M., et al. (2021). Remote sensing indices for spatial monitoring of agricultural drought in south asian countries. Remote Sens. 13, 2059. doi:10.3390/rs13112059
Shen, X., Cao, L., Coops, N. C., Fan, H., Wu, X., Liu, H., et al. (2020). Quantifying vertical profiles of biochemical traits for forest plantation species using advanced remote sensing approaches. Remote Sens. Environ. 250, 112041. doi:10.1016/j.rse.2020.112041
Song, X.-P., Hansen, M. C., Stehman, S. V., Potapov, P. V., Tyukavina, A., Vermote, E. F., et al. (2018). Global land change from 1982 to 2016. Nature 560, 639–643. doi:10.1038/s41586-018-0411-9
Spadavecchia, L., Williams, M., Bell, R., Stoy, P. C., Huntley, B., and Van Wijk, M. T. (2008). Topographic controls on the leaf area index and plant functional type of a tundra ecosystem. J. Ecol. 96, 1238–1251. doi:10.1111/j.1365-2745.2008.01424.x
Streher, A. S., Sobreiro, J. F. F., Morellato, L. P. C., and Silva, T. S. F. (2017). Land surface phenology in the tropics: the role of climate and topography in a snow-free mountain. Ecosystems 20, 1436–1453. doi:10.1007/s10021-017-0123-2
Walker, J. J., De Beurs, K. M., Wynne, R. H., and Gao, F. (2012). Evaluation of Landsat and MODIS data fusion products for analysis of dryland forest phenology. Remote Sens. Environ. 117, 381–393. doi:10.1016/j.rse.2011.10.014
Wang, S., Fu, B., Gao, G., Liu, Y., and Zhou, J. (2013). Responses of soil moisture in different land cover types to rainfall events in a re-vegetation catchment area of the Loess Plateau, China. CATENA 101, 122–128. doi:10.1016/j.catena.2012.10.006
Wang, S., Fu, B., Liang, W., Liu, Y., and Wang, Y. (2017). Driving forces of changes in the water and sediment relationship in the Yellow River. Sci. Total Environ. 576, 453–461. doi:10.1016/j.scitotenv.2016.10.124
Wang, X., Yi, S., Wu, Q., Yang, K., and Ding, Y. (2016). The role of permafrost and soil water in distribution of alpine grassland and its NDVI dynamics on the Qinghai-Tibetan Plateau. Glob. Planet. Change 147, 40–53. doi:10.1016/j.gloplacha.2016.10.014
Wang, Y., Shao, M. A., Zhu, Y., and Liu, Z. (2011). Impacts of land use and plant characteristics on dried soil layers in different climatic regions on the Loess Plateau of China. Agric. For. Meteorology 151, 437–448. doi:10.1016/j.agrformet.2010.11.016
Wang, Y. Q., Shao, M. A., and Liu, Z. P. (2010). Large-scale spatial variability of dried soil layers and related factors across the entire Loess Plateau of China. Geoderma 159, 99–108. doi:10.1016/j.geoderma.2010.07.001
Weiss, J. L., Gutzler, D. S., Coonrod, J. E. A., and Dahm, C. N. (2004). Long-term vegetation monitoring with NDVI in a diverse semi-arid setting, central New Mexico, USA. J. Arid Environ. 58, 249–272. doi:10.1016/j.jaridenv.2003.07.001
Wu, D., Liu, J., Wang, W., Ding, W., and Wang, R.-Q. (2009). Mutiscale analysis of vegetation index and topographic variables in the Yellow River delta of China. Chin. J. Plant Ecol. 33, 237–245. doi:10.3773/j.issn.1005-264x.2009.02.001 (In Chinese with english abstract)
Wu, X. B., and Archer, S. R. (2005). Scale-dependent influence of topography-based hydrologic features on patterns of woody plant encroachment in savannalandscapes. Landsc. Ecol. 20, 733–742. doi:10.1007/s10980-005-0996-x
Xia, L., Bi, R.-T., Song, X.-Y., Hu, W., Lyu, C.-J., Xi, X., et al. (2022). Soil moisture response to land use and topography across a semi-arid watershed: implications for vegetation restoration on the Chinese Loess Plateau. J. Mt. Sci. 19, 103–120. doi:10.1007/s11629-021-6830-3
Xia, Y. Q., and Shao, M. A. (2008). Soil water carrying capacity for vegetation: a hydrologic and biogeochemical process model solution. Ecol. Model. 214, 112–124. doi:10.1016/j.ecolmodel.2008.01.024
Xiao, J. (2014). Satellite evidence for significant biophysical consequences of the “grain for green” Program on the Loess Plateau in China. J. Geophys. Res. Biogeosciences 119, 2261–2275. doi:10.1002/2014jg002820
Xiong, Y., Li, Y., Xiong, S., Wu, G., and Deng, O. (2021). Multi-scale spatial correlation between vegetation index and terrain attributes in a small watershed of the upper Minjiang River. Ecol. Indic. 126, 107610. doi:10.1016/j.ecolind.2021.107610
Xiong, Y., and Wang, H. (2022). Spatial relationships between NDVI and topographic factors at multiple scales in a watershed of the Minjiang River, China. Ecol. Inf. 69, 101617. doi:10.1016/j.ecoinf.2022.101617
Yan, H., Liu, J., Huang, H. Q., Tao, B., and Cao, M. (2009). Assessing the consequence of land use change on agricultural productivity in China. Glob. Planet. Change 67, 13–19. doi:10.1016/j.gloplacha.2008.12.012
Yousefi Lalimi, F., Silvestri, S., Moore, L. J., and Marani, M. (2017). Coupled topographic and vegetation patterns in coastal dunes: remote sensing observations and ecomorphodynamic implications. J. Geophys. Res. Biogeosciences 122, 119–130. doi:10.1002/2016jg003540
Yu, B., Liu, G., Liu, Q., Wang, X., Feng, J., and Huang, C. (2018). Soil moisture variations at different topographic domains and land use types in the semi-arid Loess Plateau, China. CATENA 165, 125–132. doi:10.1016/j.catena.2018.01.020
Zhan, Z.-Z., Liu, H.-B., Li, H.-M., Wu, W., and Zhong, B. (2012). The relationship between NDVI and terrain factors --A case study of chongqing. Procedia Environ. Sci. 12, 765–771. doi:10.1016/j.proenv.2012.01.347
Zhang, L., Li, X., Yuan, Q., and Liu, Y. (2014). Object-based approach to national land cover mapping using HJ satellite imagery. J. Appl. Remote Sens. 8, 083686. doi:10.1117/1.jrs.8.083686
Zhang, T. T., Wen, J., Su, Z. B., Van Der Velde, R., Timmermans, J., Liu, R., et al. (2009). Soil moisture mapping over the Chinese Loess Plateau using ENVISAT/ASAR data. Adv. Space Res. 43, 1111–1117. doi:10.1016/j.asr.2008.10.030
Zhang, X., Friedl, M. A., and Schaaf, C. B. (2006). Global vegetation phenology from Moderate Resolution Imaging Spectroradiometer (MODIS): evaluation of global patterns and comparison with in situ measurements. J. Geophys. Res. Biogeosciences 111, G04017. doi:10.1029/2006jg000217
Zheng, F. L. (2005). Effects of accelerated soil erosion on soil nutrient loss after deforestation on the Loess Plateau. Pedosphere 15, 707–715.
Zheng, F. L. (2006). Effect of vegetation changes on soil erosion on the Loess Plateau. Pedosphere 16, 420–427. doi:10.1016/s1002-0160(06)60071-4
Zhou, H., Xu, F., Dong, J., Yang, Z., Zhao, G., Zhai, J., et al. (2019). Tracking reforestation in the Loess Plateau, China after the “grain for green” project through integrating PALSAR and Landsat imagery. Remote Sens. 11, 2685. doi:10.3390/rs11222685
Zhu, Y., Liu, Y., and Zhao, L. (2017). Grid data on land use and land cover of the Loess Plateau region. China Sci. Data 2. doi:10.11922/csdata.11170.12017.10137
Keywords: vegetation–topography coupling, heterogeneity index of coupling, NDVI, remote sensing, loess plateau
Citation: Luo Z, Liu Y and Zhou H (2024) The vegetation–topography heterogeneity coupling in the Loess Plateau, China. Front. Environ. Sci. 12:1343215. doi: 10.3389/fenvs.2024.1343215
Received: 23 November 2023; Accepted: 26 February 2024;
Published: 14 March 2024.
Edited by:
Changchun Huang, Nanjing Normal University, ChinaReviewed by:
Taisheng Chen, Suzhou University of Science and Technology, ChinaFayuan Li, Nanjing Normal University, China
Copyright © 2024 Luo, Liu and Zhou. This is an open-access article distributed under the terms of the Creative Commons Attribution License (CC BY). The use, distribution or reproduction in other forums is permitted, provided the original author(s) and the copyright owner(s) are credited and that the original publication in this journal is cited, in accordance with accepted academic practice. No use, distribution or reproduction is permitted which does not comply with these terms.
*Correspondence: Yu Liu, bGl1eXVAaWdzbnJyLmFjLmNu