 Zan Xu
 Shanghong Zhang
 Xujian Hu
- School of Water Resources and Hydropower Engineering, North China Electric Power University, Beijing, China
Introduction: Soil loss is a worldwide environmental problem, and sediment transport is one of its important components. In recent years, a hillslope sediment delivery ratio (SDR) model based on an index of connectivity has been widely used to describe the variation in sediment transport characteristics. However, the hillslope SDR model only considers the structural characteristics of the watershed and ignores the dynamic mechanism of sediment transport, which leads to poor dynamic applicability over short timescales and makes it difficult to reflect changes of sediment yield.
Methods: Therefore, we here propose a monthly dynamic SDR model that integrates the hillslope structural connectivity and sediment transport threshold of rainfall event based on the main influencing factors of sediment delivery. We then combine the dynamic SDR model with an empirical erosion model to simulate the hillslope sediment yield in the Mahuyu watershed, and verify the applicability of the coupled model using the Heimutouchuan watershed.
Results: The results show that the coupled model can effectively simulate the hillslope sediment yields of the Mahuyu and Heimutouchuan watersheds. The contribution of the rainfall transport threshold factor to sediment delivery and yield is essentially in dynamic stability at the multi-year timescale, but increases the heterogeneity of both inter-month distributions and the spatial distribution of hillslope sediment yield.
Discussion: The dynamic SDR model, which considers the rainfall thresholds of transport and re-transport, can effectively improve the simulation accuracy of low and high sediment yield values on hillslopes. Our results can provide a reference for understanding sediment transport processes on hillslopes and optimizing soil and water conservation measures in watersheds.
1 Introduction
Soil loss is a major and widespread environmental problem that threatens terrestrial ecosystems (Lal, 2003; Van Oost et al., 2007; Borrelli et al., 2017). Sediment transport on hillslopes is a very important part of soil loss, which becomes more complex under the influence of climate change and human activities (Zhang S. et al., 2019; Borrelli et al., 2020; Jin et al., 2021). Clarifying the variation in the hillslope sediment transport and yield is of great significance for the optimization of soil and water conservation measures in watersheds.
The interaction of soil erosion and sediment transport processes with the hydrological and geomorphological processes includes sediment generation, detachment, transport, and deposition (Turnbull and Wainwright, 2019). The sediment delivery ratio (SDR) is the ratio of the sediment yield to the total amount of erosion in a region and an important tool for generalizing the sediment transport (Walling, 1983; Lu et al., 2006). SDR is considered to be a link between the amount of soil erosion and the resulting sediment yield; hence, it plays a key role in sediment yield prediction. In turn, the calculation methods for SDR have attracted the attention of many researchers. Initially, SDR algorithms were mainly based on the definition or empirical formulas of influencing factors (Xie and Li, 2012). Many scholars have proposed empirical single-factor and multi-factor SDR algorithms on the basis of static structural features, such as the watershed area and gully density, or hydrological dynamic indicators, such as rainfall and runoff, for specific watersheds (Xie and Li, 2012; Tao and Chen, 2015; Wu et al., 2018a). Furthermore, Wu et al. (2018b) proposed a segmented dynamic SDR algorithm suitable for most watersheds, achieving improved results in the simulation of the sediment yield at the annual scale. However, the above SDR algorithms still lack a description of spatial distribution and transport processes.
In recent years, sediment connectivity, a newly proposed concept in the study of sediment transport characteristics, has become a research hotspot, owing to its clear spatial variability (Keesstra et al., 2018, Wohl et al., 2019). There is still no consensus on how to quantify and compare connectivity at different spatial and temporal scales and among distinct landscape properties (Hooke et al., 2021; Najafi et al., 2021; Niguse et al., 2023). Many calculation methods of sediment connectivity have been proposed (Lenhart et al., 2005; Borselli et al., 2008; Diodato and Grauso, 2009; Hooke et al., 2021); among these, the index of connectivity (IC) proposed by Borselli et al. (2008) is one of the most widely used. IC, based on structural characteristics, is used to describe sediment transport from hillslopes to the stream network and is also often compared and associated with the SDR. A sigmoidal relationship between the SDR and IC has been identified and applied to sediment yield model construction (Borselli et al., 2008; Vigiak et al., 2012; Jamshidi et al., 2014). Then, various studies applied the Revised Universal Soil Loss Equation (RUSLE)-IC-SDR approach to determine the sediment yield (Michalek et al., 2021). For example, Zhao et al. (2020) used this type of model to explore the effects of land-use change and soil and water conservation measures on the sediment yield. However, the SDR based on the IC has been considered a stationary property assessed for average landscape conditions, which ignores the dynamic mechanism of sediment transport (Vigiak et al., 2016; Najafi et al., 2021; Zhang, 2021). Zhang Y. et al. (2019) pointed out that the SDR algorithm based on the IC characterizes the potential sediment transport capacity on a hillslope but does not reflect the actual variation in sediment transport over time. In many regions, the structural characteristics of a watershed tend not to change in the short term, but sediment transport is mainly caused by several heavy rainfall events during the flood season (Rustomji et al., 2008; Gao et al., 2016). Therefore, the SDR and sediment yield are usually dynamic and depend on both rainfall variation and landscape properties (Liu, 2016). Although the SDR model based on the structural connectivity of sediment has achieved good performance in simulations over long timescales, the dynamic applicability of the model at the monthly scale is poor, owing to the omittance of the influence of the transport threshold. Hence, it is difficult to reflect the changing hillslope sediment yield at a monthly time scale.
Here, we took the Mahuyu watershed on the Loess Plateau (China) as our study area. The objectives of this study are as follows: (i) to propose an SDR model for hillslopes that integrates both structural characteristics and the dynamic sediment transport threshold of rainfall events and verify the applicability of the model and (ii) to analyze spatiotemporal variations in the hillslope sediment yield and explore the response to the rainfall change. The results of this study could provide a reference for understanding sediment transport processes and guidance for optimizing soil and water conservation measures on hillslopes.
2 Materials and methods
2.1 Study area
The Mahuyu watershed is located in the hinterland of the Loess Plateau, a hilly‒gully region covered by loess. The area of the watershed is 372 km2, and its elevation ranges from 864 to 1,316 m, with an average of 1,102 m (Figures 1A, C). The Mahuyu River is the first tributary of the middle reaches of the Wuding River, which belongs to the arid and semi-arid climate zone. Affected by monsoons, the annual and inter-annual distribution of rainfall and runoff in the watershed is uneven (Jiao et al., 2017). According to the measured rainfall data, the multi-year average rainfall from 2006 to 2018 was 456.7 mm, with rainfall mainly concentrated in the period from June to September. The Heimutouchuan watershed is also located on the right bank of the middle reaches of the Wuding River, close to the Mahuyu watershed. The Heimutouchuan watershed has a similar underlying surface to that of the Mahuyu watershed; hence, it was selected as the validation area for this study. The spatial location and overview of the Heimutouchuan watershed are shown in Figures 1B, D, respectively.
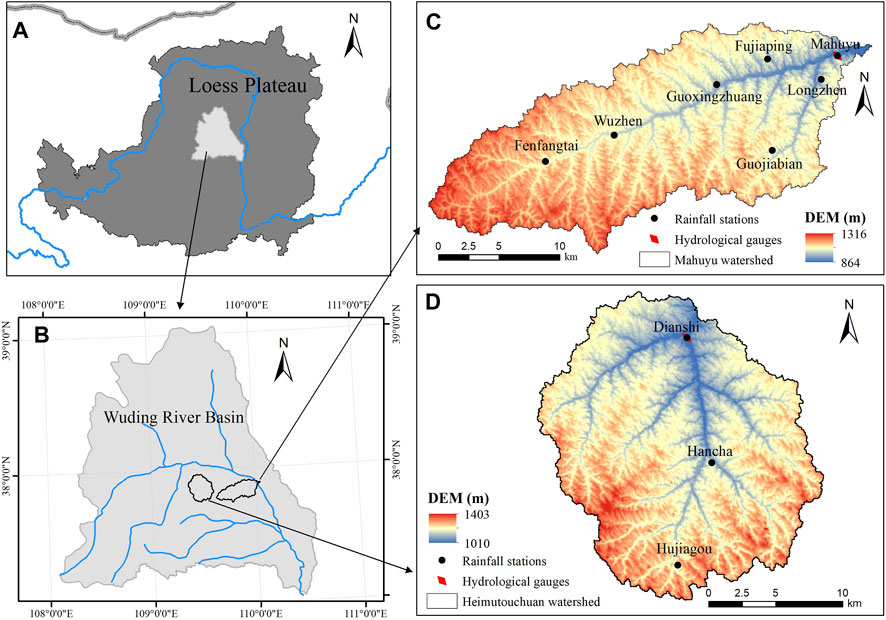
FIGURE 1. Overview of the study area. (A, B) Locations of the Mahuyu and Heimutouchuan watersheds, respectively. (C, D) Overviews of the Mahuyu and Heimutouchuan watersheds, respectively.
2.2 Data use
Information on the sources of the spatial and attribute data, and details regarding the spatial and temporal resolutions of the data, are provided in Table 1. For spatial data, the raster was unified to 30-m resolution after projection and mosaic processing using ArcGIS software. We obtained meteorological data from seven rainfall stations in the Mahuyu watershed (Fenfangtai, Wuzhen, Guoxingzhuang, Fujiaping, Guojiabian, Longzhen, and Mahuyu stations; Figure 1C) and three rainfall stations in the Heimutouchuan watershed (Hujiagou, Hancha, and Dianshi stations; Figure 1D). Hydrological data were obtained from the Mahuyu and Dianshi hydrological stations, which have watershed areas of 371 and 327 km2, respectively.
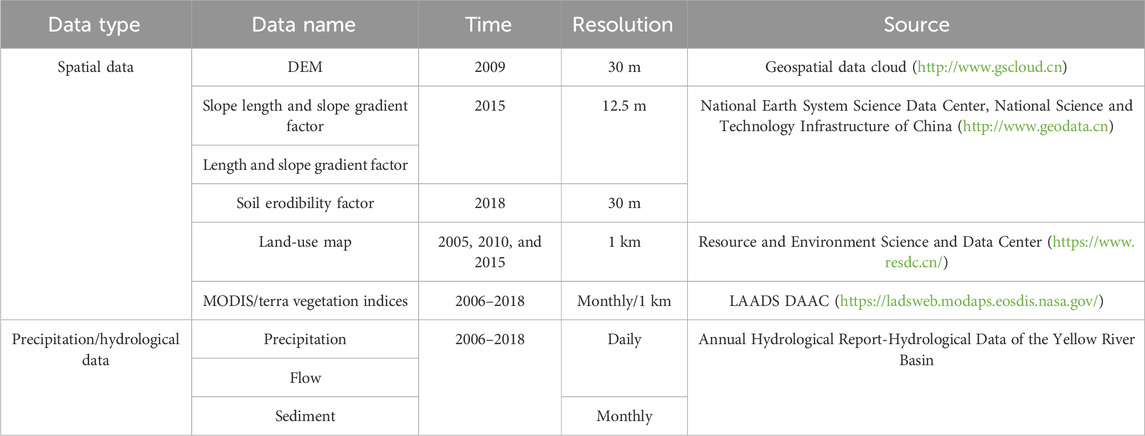
TABLE 1. Information on the timeframe, resolution, and sources of our research data.
2.3 Methods
2.3.1 Total erosion (TE) amount
In this study, the soil loss driven by rill and inter-rill erosion was estimated using the Revised Universal Soil Loss Equation (RUSLE) model, which enables the spatial pattern of soil erosion to be estimated (Renard et al., 1991, 1997). This model has been widely used in watersheds throughout the world (Thomas et al., 2018; Batista et al., 2019). Liu et al. (1994) adapted the model to be more applicable to the Loess Plateau region by considering erosion on a steep slope. Researchers have also improved the accuracy of the model under extreme rainfall events by introducing precipitation concentration degree (Xu et al., 2022). To summarize, the total erosion of hillslopes mainly comprises rill, inter-rill, and gully erosion, and the erosion rate can be calculated using the following equation:
where TE is the total erosion amount per unit area in a given timestep (t·ha−1); m is the calculation month; RIm is the rainfall erosivity factor introducing the rainfall concentration (MJ·mm·ha−1 h−1); K is the soil erodibility factor (t·h·MJ−1 mm−1); LS is the slope length and gradient factor (dimensionless); and
2.3.2 Structural SDR (HSDR)
Borselli et al. (2008) proposed an index of connectivity (IC) describing the hydrological linkage between sediment sources and sinks. The IC consists of the following two components: an upslope component (
The range of the IC is [−∞, +∞], and a higher value indicates a higher degree of connectivity;
The structural SDR (HSDR) is calculated using the IC (in Eq. 2) with the following function, which is now included in the InVEST model (Borselli et al., 2008; Vigiak et al., 2012; Cavalli et al., 2013):
where
2.3.3 Transport threshold factor (Er)
In the main sediment yield area of the Yellow River basin, where soil and water conservation measures have been implemented, soil erosion occurred but cannot transport the eroded sediment to the channels. Zhang (2017) pointed out that the eroded sediment can enter the channels when the daily rainfall reaches 25 mm/day; otherwise, it is trapped in the hillslope system. In addition, the benefits of soil and water conservation measures may be reduced and the deposited sediment be transported again when daily rainfall reaches 50 mm/day (Zhang, 2017). Consequently, we developed a transport threshold factor (Er) according to the rainfall thresholds of 25 and 50 mm/day. The definition formulae are as follows:
where
2.3.4 Dynamic SDR (
The movement of sediment from the erosion source to channels is influenced by structural factors, such as topography and soil conservation measures, and dynamic factors, such as rainfall (Zhang, 2017). Therefore, we propose a dynamic SDR (
where HSDR is the structural sediment delivery ratio, reflecting the potential transport capacity of hillslope sediment into the channel system; and Er (in Eq. 4) is the transport threshold factor, reflecting the transport power of rainfall events on eroded soil.
2.3.5 Simulation of sediment yield
The watershed can be divided into hillslopes and channels. In this study, the hillslope sediment yield (
where i is the calculated raster and N is the total number of the raster.
2.3.6 Calibration and validation
Calibration of hillslope sediment yield models remains a challenge, owing to a lack of long-term measured hillslope data (Wen and Deng, 2020). The measured sediment yield of a watershed (
As for the sediment-carrying capacity of the channel, many scholars have pointed out that a linear relationship exists between the flow and sediment concentration for saturated flows in hilly loess areas (Zhang et al., 2018; Zheng, 2018). In this study, the observed monthly maximum daily flow (Q) and monthly
The hillslope sediment yield model based on the
3 Results
3.1 Variations in structural and dynamic SDRs
The spatial distributions of the HSDR and Er in a typical month (July 2006) are shown in Figures 2A, B. In the Mahuyu watershed, HSDR ranged from 0 to 0.784; values were higher in areas close to the river, indicating that closer to the river there is a greater possibility of the eroded sediment entering the channel system. Er showed notable spatial variability across the Mahuyu watershed, with values ranging from 0 to 1.725, reflecting the spatial heterogeneity of rainfall in this month.
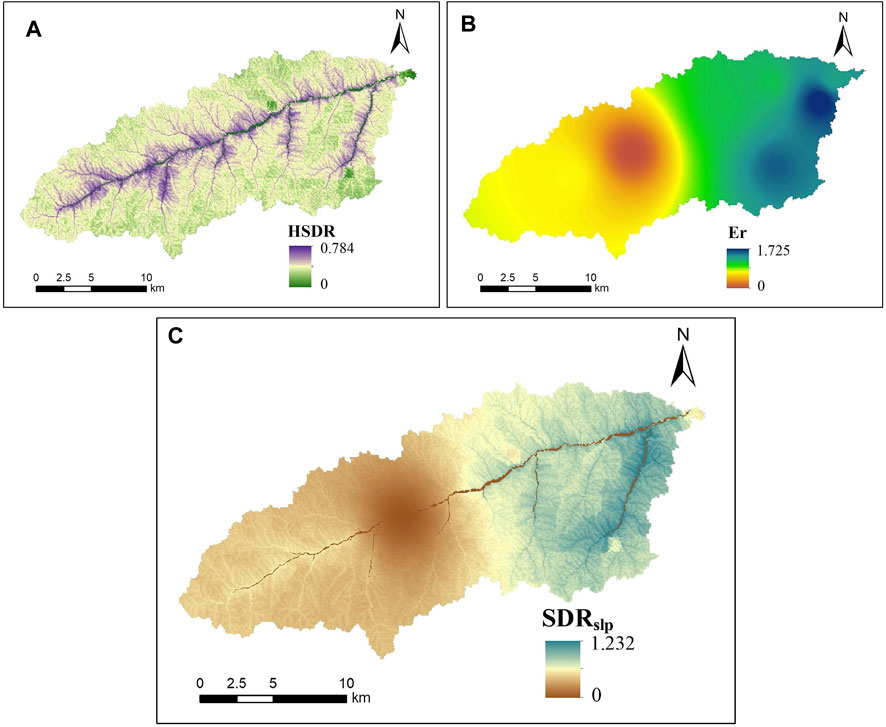
FIGURE 2. Spatial distributions of sediment delivery characteristics of the Mahuyu watershed in July 2006. (A) Structural sediment delivery ratio. (B) Transport threshold factor. (C) Dynamic sediment delivery ratio on the hillslope.
3.2 Model performance
3.2.1 Sediment-carrying capacity
The relationship between the monthly maximum daily flow and sediment-carrying capacity of the channel was evaluated by three-time curve fitting. The fitting process and results are shown in Figures 3A‒C.
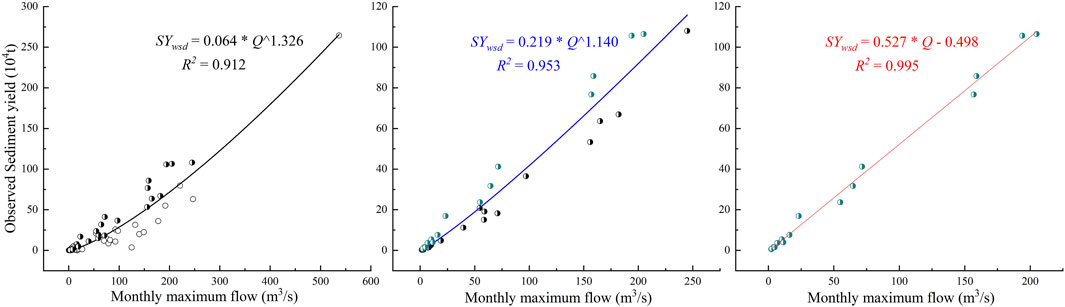
FIGURE 3. Fitting curves of the relationship between monthly maximum flow (Q) and sediment yield of the watershed (
The power relationship between the flow and sediment yield in unsaturated flows is shown in Figures 3A, B, while the linear relationship between the flow and sediment yield in saturated flows is shown in Figure 3C. It can be seen from Figure 3C that 16 points were selected, which is seen as the saturated flow status, and there was a linear relationship between the monthly maximum daily flow and monthly sediment yield of the watershed. The equation was
3.2.2 Performance evaluation
The months with the sediment-carrying capacity greater than simulated
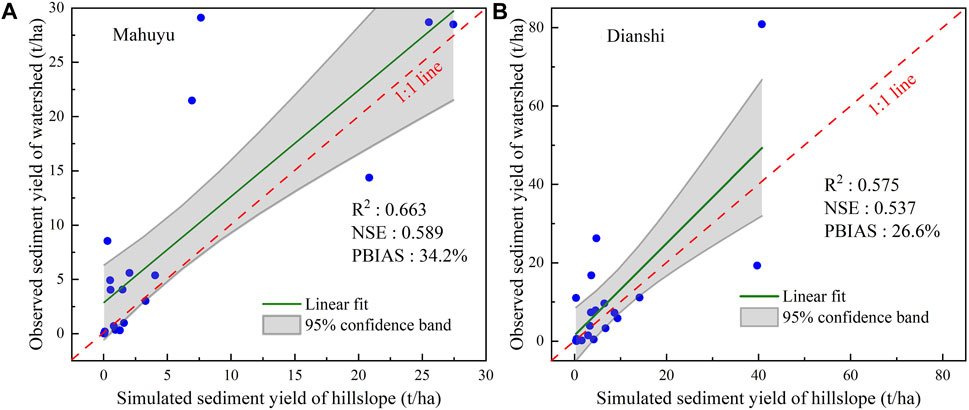
FIGURE 4. Calibration and validation of the hillslope sediment yield model. (A) Calibration in the Mahuyu watershed. (B) Validation in the Heimutouchuan watershed.
It can be seen from Figure 4A that simulated
3.3 Spatiotemporal variations in the sediment yield
3.3.1 Temporal variations in
The watershed average TE,
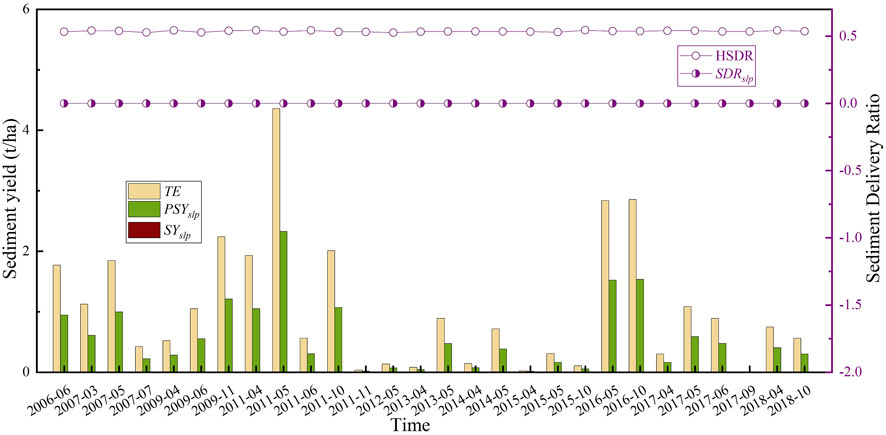
FIGURE 5. Variations in the sediment yield and delivery ratio in months with erosive rainfall but no transport rainfall events.
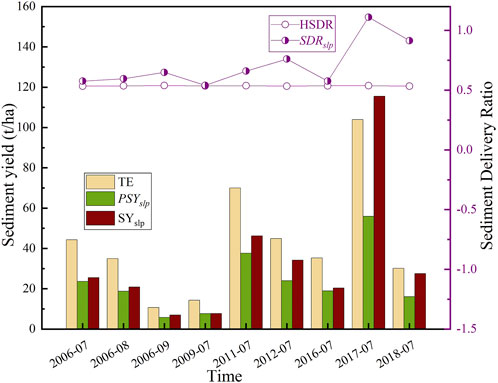
FIGURE 6. Variations in the sediment yield and delivery ratio in months with monthly average rainfall >50 mm.
As shown in Figure 5, the average HSDR of the watershed was 0.535, and this essentially remained unchanged.
As shown in Figure 6, the variation in
On the basis of the monthly output raster results, the annual TE,
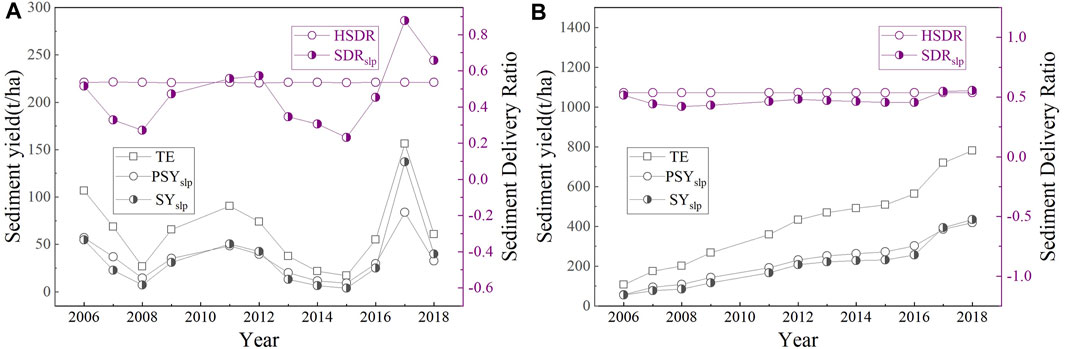
FIGURE 7. Variations in the sediment yield and sediment delivery ratio. (A) Annual variation from 2006 to 2018. (B) Variation in cumulative values.
3.3.2 Spatial distribution of
To analyze the influence of the Er factor on the spatial variation in sediment delivery characteristics, we chose July 2006 as the representative month due to its uneven spatial distribution of rainfall. The spatial distributions of TE,
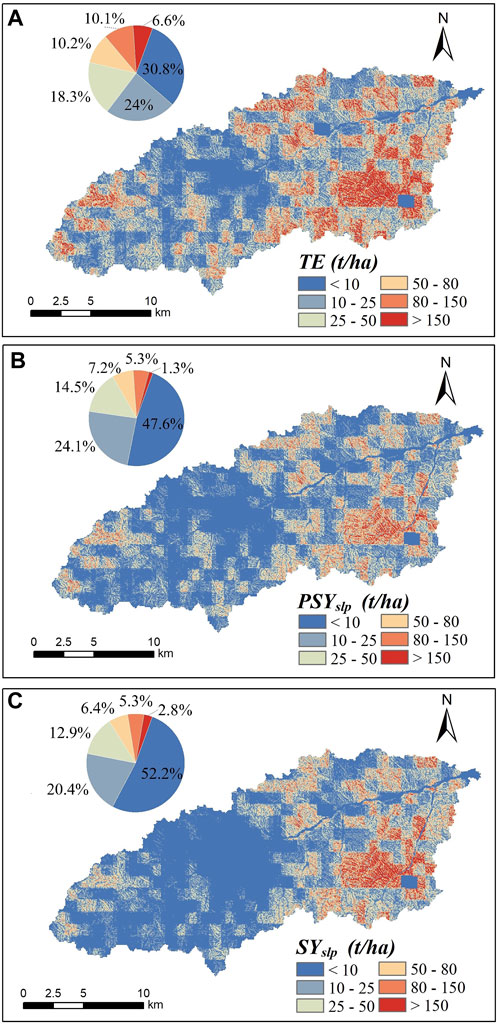
FIGURE 8. Mahuyu watershed (A) total erosion amount, (B) potential sediment yield, and (C) hillslope sediment yield in July 2006.
4 Discussion
In this study, we established a monthly dynamic SDR model by integrating the transport threshold factor and connectivity characteristics of sediment. Hillslope runoff caused by rainfall is a direct driver of sediment delivery. In the context of climate warming, rainfall is unevenly distributed on both spatial and temporal scales (Long et al., 2021). The HSDR can reflect the change in sediment delivery in space; it cannot reflect the change in sediment delivery with time (Borselli et al., 2008). The proposed dynamic SDR can reflect the influence of rainfall variation in both time and space by considering whether rainfall can form sediment-carrying runoff conditions and enter the channels (Figures 2, 8). Perhaps, the thresholds in the Er factor (Eq. 4) need to be appropriately adjusted when applied to watersheds with different underlying surface conditions. However, the annual and monthly variations in
Sediment delivery on hillslopes is a wide-ranging and dynamic process. The characteristics of sediment delivery become more complicated under heavy rainfall events. Although the rationality of the SDR and simulation accuracy of the hillslope sediment yield are improved by considering the transport threshold factor based on the empirical rainfall thresholds, the mechanisms of sediment delivery and the relationship between the threshold and the underlying surface conditions under heavy rainfall require further research. In addition, it is an effective supplement to explore the method to obtain long-term measured sediment yield and investigate the variation in the underlying surface under rainfall in the future.
5 Conclusion
In this study, we have proposed a monthly dynamic SDR model that integrates the structural characteristics of hillslopes and the sediment transport threshold of rainfall events. We calculated the hillslope sediment yield using a coupled model of SDR and soil erosion. We then obtained the relationship between the spatiotemporal variation in sediment delivery and the transport threshold factor. Our conclusions are as follows:
1) The dynamic SDR, which integrates the structural characteristics of a hillslope and the sediment transport threshold of rainfall events, is more reasonable with temporal and spatial variations than the structural SDR. In the application of the dynamic SDR model to the simulation of the hillslope sediment yield in the Mahuyu and Heimutouchuan watersheds, the evaluation indices R2 > 0.575, the PBIAS <34.2%, and NSE >0.537. Hence, the results can be used as an effective reference for understanding hillslope sediment transport processes.
2) The dynamic SDR, which considers the transport threshold factor, increases the heterogeneity of monthly and spatial distributions of hillslope sediment yields and effectively improves the simulation accuracy of low and high values of the hillslope sediment yield. The effect of the transport threshold factor on the hillslope sediment yield is essentially in dynamic stability on a multi-year timescale. The dynamic SDR can be used to identify the key regions and rainfall events of sediment delivery.
Data availability statement
The original contributions presented in the study are included in the article/Supplementary Material; further inquiries can be directed to the corresponding author.
Author contributions
ZX: methodology, writing–original draft, and writing–review and editing. SZ: funding acquisition, methodology, project administration, resources, and writing–review and editing. XH: conceptualization, formal analysis, methodology, visualization, and writing–review and editing. YZ: data curation, methodology, validation, and writing–original draft.
Funding
The author(s) declare financial support was received for the research, authorship, and/or publication of this article. This study was supported by the National Key R&D Program of China (grant no. 2022YFC3202004) and the National Natural Science Foundation of China (grant no. U2340204).
Acknowledgments
The authors thank David Wacey, PhD, from Liwen Bianji (Edanz) (www.liwenbianji.cn) for editing the English text of a draft of this manuscript.
Conflict of interest
The authors declare that the research was conducted in the absence of any commercial or financial relationships that could be construed as a potential conflict of interest.
Publisher’s note
All claims expressed in this article are solely those of the authors and do not necessarily represent those of their affiliated organizations, or those of the publisher, the editors, and the reviewers. Any product that may be evaluated in this article, or claim that may be made by its manufacturer, is not guaranteed or endorsed by the publisher.
References
Bai, L., Wang, N., Jiao, J., Chen, Y., Tang, B., Wang, H., et al. (2020). Soil erosion and sediment interception by check dams in a watershed for an extreme rainstorm on the Loess Plateau, China. Int. J. Sediment Res. 35, 408–416. doi:10.1016/j.ijsrc.2020.03.005
Batista, P. V. G., Davies, J., Silva, M. L. N., and Quinton, J. N. (2019). On the evaluation of soil erosion models: are we doing enough? Earth-Science Rev. 197, 102898. doi:10.1016/j.earscirev.2019.102898
Borrelli, P., Robinson, D. A., Fleischer, L. R., Lugato, E., Ballabio, C., Alewell, C., et al. (2017). An assessment of the global impact of 21st century land use change on soil erosion. Nat. Commun. 8, 2013–13. doi:10.1038/s41467-017-02142-7
Borrelli, P., Robinson, D. A., Panagos, P., Lugato, E., Yang, J. E., Alewell, C., et al. (2020). Land use and climate change impacts on global soil erosion by water (2015-2070). Proc. Natl. Acad. Sci. 117, 21994–22001. doi:10.1073/pnas.2001403117
Borselli, L., Cassi, P., and Torri, D. (2008). Prolegomena to sediment and flow connectivity in the landscape: a GIS and field numerical assessment. CATENA 75, 268–277. doi:10.1016/j.catena.2008.07.006
Cai, J., Zhou, Z., Liu, J., Wang, H., and Jia, Y. (2020). A distributed soil erosion model based on the three-process of runoff and sediment transport. J. Hydraulic Eng. 51, 140–151. (in Chinese with English Abstract). doi:10.13243/j.cnki.slxb.20190432
Cavalli, M., Trevisani, S., Comiti, F., and Marchi, L. (2013). Geomorphometric assessment of spatial sediment connectivity in small Alpine catchments. Geomorphol. Sediment sources, source-to-sink fluxes Sediment. budgets 188, 31–41. doi:10.1016/j.geomorph.2012.05.007
De Vente, J., Poesen, J., Verstraeten, G., Van Rompaey, A., and Govers, G. (2008). Spatially distributed modelling of soil erosion and sediment yield at regional scales in Spain. Glob. Planet. Change 60, 393–415. doi:10.1016/j.gloplacha.2007.05.002
Diodato, N., and Grauso, S. (2009). An improved correlation model for sediment delivery ratio assessment. Environ. Earth Sci. 59, 223–231. doi:10.1007/s12665-009-0020-x
Gao, G., Ma, Y., and Fu, B. (2016). Multi-temporal scale changes of streamflow and sediment load in a loess hilly watershed of China. Hydrol. Process. 30, 365–382. doi:10.1002/hyp.10585
Gao, H., Li, Z., Li, P., Ren, Z., Yang, Y., and Wang, J. (2018). Paths and prevention of sediment during storm-runoff on the loess plateau: based on the rainstorm of 2017-07-26 in Wuding river. Sci. Soil Water Conservation 16, 66–72. (in Chinese with English Abstract). doi:10.16843/j.sswc.2018.04.009
Gupta, H., Sorooshian, S., and Yapo, P. (1999). Status of automatic calibration for hydrologic models: comparison with multilevel expert calibration. J. Hydrologic Eng. - J HYDROL ENG 4, 135–143. doi:10.1061/(ASCE)1084-0699(1999)4:2(135)
Hooke, J., Souza, M., and Marchamalo, M. (2021). Evaluation of connectivity indices applied to a Mediterranean agricultural catchment. Catena 207, 105713. doi:10.1016/j.catena.2021.105713
Jamshidi, R., Dragovich, D., and Webb, A. A. (2014). Distributed empirical algorithms to estimate catchment scale sediment connectivity and yield in a subtropical region. Hydrol. Process. 28, 2671–2684. doi:10.1002/hyp.9805
Jiao, Y., Lei, H., Yang, D., Huang, M., Liu, D., and Yuan, X. (2017). Impact of vegetation dynamics on hydrological processes in a semi-arid basin by using a land surface-hydrology coupled model. J. Hydrology, Investigation Coast. Aquifers 551, 116–131. doi:10.1016/j.jhydrol.2017.05.060
Jin, F., Yang, W., Fu, J., and Li, Z. (2021). Effects of vegetation and climate on the changes of soil erosion in the Loess Plateau of China. Sci. Total Environ. 773, 145514. doi:10.1016/j.scitotenv.2021.145514
Jing, K. (2002). Sediment delivery ratio in the upper yangtze river. J. Sediment Res. 1, 53–59. doi:10.16239/j.cnki.0468-155x.2002.01.008
Keesstra, S., Nunes, J., Saco, P., Parsons, T., Poeppl, R., Masselink, R., et al. (2018). The way forward: can connectivity be useful to design better measuring and modelling schemes for water and sediment dynamics? Sci. Total Environ. 644, 1557–1572. doi:10.1016/j.scitotenv.2018.06.342
Lal, R. (2003). Soil erosion and the global carbon budget. Environ. Int. 29, 437–450. doi:10.1016/S0160-4120(02)00192-7
Lenhart, T., Van Rompaey, A., Steegen, A., Fohrer, N., Frede, H.-G., and Govers, G. (2005). Considering spatial distribution and deposition of sediment in lumped and semi-distributed models. Hydrol. Process. 19, 785–794. doi:10.1002/hyp.5616
Li, X., and Li, T., 2011. Study of relationship between sediment delivery ratio and watershed scale of Yellow River Basin. (2): 33–38.
Liu, B. Y., Nearing, M. A., and Risse, L. M. (1994). Slope gradient effects on soil loss for steep slopes. Trans. ASAE 37, 1835–1840. doi:10.13031/2013.28273
Liu, Y. (2016). Landscape connectivity in soil erosion research: concepts, implication and quantification. Geogr. Res. 35, 195–202. (in Chinese with English Abstract).
Long, K., Wang, D., Wang, G., Zhu, J., Wang, S., and Xie, S. (2021). Higher temperature enhances spatiotemporal concentration of rainfall. J. Hydrometeorol. 22, 3159–3169. doi:10.1175/JHM-D-21-0034.1
Lu, H., Moran, C. J., and Prosser, I. P. (2006). Modelling sediment delivery ratio over the murray darling basin. Environ. Model. Softw. 21, 1297–1308. doi:10.1016/j.envsoft.2005.04.021
Michalek, A., Zarnaghsh, A., and Husic, A. (2021). Modeling linkages between erosion and connectivity in an urbanizing landscape. Sci. Total Environ. 764, 144255. doi:10.1016/j.scitotenv.2020.144255
Mishra, K., Sinha, R., Jain, V., Nepal, S., and Uddin, K. (2019). Towards the assessment of sediment connectivity in a large Himalayan river basin. Sci. Total Environ. 661, 251–265. doi:10.1016/j.scitotenv.2019.01.118
Najafi, S., Dragovich, D., Heckmann, T., and Sadeghi, S. H. (2021). Sediment connectivity concepts and approaches. CATENA 196, 104880. doi:10.1016/j.catena.2020.104880
Nash, J. E., and Sutcliffe, J. V. (1970). River flow forecasting through conceptual models part I — a discussion of principles. J. Hydrology 10, 282–290. doi:10.1016/0022-1694(70)90255-6
Niguse, A., Eekhout, J., Vermeulen, B., Boix-Fayos, C., Vente, J., Grum, B., et al. (2023). The potential and challenges of the ‘RUSLE-IC-SDR’ approach to identify sediment dynamics in a Mediterranean catchment. Catena 233, 107480. doi:10.1016/j.catena.2023.107480
Renard, K. G., Foster, G. R., Weesies, G. A., and Porter, J. P. (1991). RUSLE: Revised universal soil loss equation. J. Soil Water Conservation 46, 30–33.
Rustomji, P., Zhang, X. P., Hairsine, P. B., Zhang, L., and Zhao, J. (2008). River sediment load and concentration responses to changes in hydrology and catchment management in the Loess Plateau region of China. Water Resour. Res. 44. doi:10.1029/2007WR006656
Tao, M., and Chen, X. (2015). Afforestation influence on soil moisture dynamics and runoff on the Loess Plateau. Yellow River 37 (3), 96–99. (in Chinese with English Abstract).
Thomas, J., Joseph, S., and Thrivikramji, K. P. (2018). Assessment of soil erosion in a tropical mountain river basin of the southern Western Ghats, India using RUSLE and GIS. Geosci. Front. 9, 893–906. doi:10.1016/j.gsf.2017.05.011
Turnbull, L., and Wainwright, J. (2019). From structure to function: understanding shrub encroachment in drylands using hydrological and sediment connectivity. Ecol. Indic. 98, 608–618. doi:10.1016/j.ecolind.2018.11.039
Van Oost, K., Quine, T. A., Govers, G., De Gryze, S., Six, J., Harden, J. W., et al. (2007). The impact of agricultural soil erosion on the global carbon cycle. Science 318, 626–629. doi:10.1126/science.1145724
Vigiak, O., Beverly, C., Roberts, A., Thayalakumaran, T., Dickson, M., McInnes, J., et al. (2016). Detecting changes in sediment sources in drought periods: the Latrobe River case study. Environ. Model. Softw. 85, 42–55. doi:10.1016/j.envsoft.2016.08.011
Vigiak, O., Borselli, L., Newham, L. T. H., McInnes, J., and Roberts, A. M. (2012). Comparison of conceptual landscape metrics to define hillslope-scale sediment delivery ratio. Geomorphology 138, 74–88. doi:10.1016/j.geomorph.2011.08.026
Walling, D. E. (1983). The sediment delivery problem. J. Hydrology, Scale Problems Hydrology 65, 209–237. doi:10.1016/0022-1694(83)90217-2
Wen, X., and Deng, X. (2020). Current soil erosion assessment in the Loess Plateau of China: a mini-review. J. Clean. Prod. 276, 123091. doi:10.1016/j.jclepro.2020.123091
Wu, L., Liu, X., and Ma, X. (2018a). Research progress on the watershed sediment delivery ratio. Int. J. Environ. Stud. 75, 565–579. doi:10.1080/00207233.2017.1392771
Wu, L., Yao, W., and Ma, X. (2018b). Using the comprehensive governance degree to calibrate a piecewise sediment delivery ratio algorithm for dynamic sediment predictions: a case study in an ecological restoration watershed of northwest China. J. Hydrology 564, 888–899. doi:10.1016/j.jhydrol.2018.07.072
Xie, W., and Li, T. (2012). Research comment on watershed sediment delivery ratio. Acta Sci. Nat. Univ. Pekin. 48 (4), 676–685. (in Chinese with English Abstract). doi:10.13209/j.0479-8023.2012.089
Xu, Z., Zhang, S., Zhou, Y., Hou, X., and Yang, X. (2022). Characteristics of watershed dynamic sediment delivery based on improved RUSLE model. CATENA 219, 106602. doi:10.1016/j.catena.2022.106602
Yesuf, H. M., Assen, M., Alamirew, T., and Melesse, A. M. (2015). Modeling of sediment yield in Maybar gauged watershed using SWAT, northeast Ethiopia. CATENA 127, 191–205. doi:10.1016/j.catena.2014.12.032
Zhang, G. (2021). Understanding sediment connectivity from soil erosion perspective. Adv. water Sci. 32, 295–308. (in Chinese with English Abstract). doi:10.14042/j.cnki.32.1309.2021.02.015
Zhang, J. (2017). Discussion on Mechanism and process of sediment moving into the yellow river. Yellow River 39, 8–12+17. (in Chinese with English Abstract).
Zhang, S., Chen, D., Li, F., He, L., Yan, M., and Yan, Y. (2018). Evaluating spatial variation of suspended sediment rating curves in the middle Yellow River basin, China. Hydrol. Process. 32, 1616–1624. doi:10.1002/hyp.11514
Zhang, S., Li, Z., Hou, X., and Yi, Y. (2019a). Impacts on watershed-scale runoff and sediment yield resulting from synergetic changes in climate and vegetation. Catena 179, 129–138. doi:10.1016/j.catena.2019.04.007
Zhang, Y., Jiao, J., Tang, B., Chen, Y., Wang, N., Bai, L., et al. (2019b). Channel sediment connectivity and influence factors in small watersheds under extremely rainstorm—a case study at Zizhou county, shaanxi province. Bull. soil water conservation 39, 302–309. (in Chinese with English Abstract). doi:10.13961/j.cnki.stbctb.2019.01.047
Zhao, G., Gao, P., Tian, P., Sun, W., Hu, J., and Mu, X. (2020). Assessing sediment connectivity and soil erosion by water in a representative catchment on the Loess Plateau, China. CATENA 185, 104284. doi:10.1016/j.catena.2019.104284
Keywords: soil erosion, sediment delivery ratio, sediment connectivity, hillslope sediment yield, rainfall threshold
Citation: Xu Z, Zhang S, Hu X and Zhou Y (2024) Construction of a monthly dynamic sediment delivery ratio model at the hillslope scale: a case study from a hilly loess region. Front. Environ. Sci. 12:1341868. doi: 10.3389/fenvs.2024.1341868
Received: 21 November 2023; Accepted: 17 January 2024;
Published: 01 February 2024.
Edited by:
Jing Zhang, North China University of Water Conservancy and Electric Power, ChinaReviewed by:
Hurem Dutal, Kahramanmaras Sütçü Imam University, TürkiyeZang Chao, Zhengzhou University, China
Copyright © 2024 Xu, Zhang, Hu and Zhou. This is an open-access article distributed under the terms of the Creative Commons Attribution License (CC BY). The use, distribution or reproduction in other forums is permitted, provided the original author(s) and the copyright owner(s) are credited and that the original publication in this journal is cited, in accordance with accepted academic practice. No use, distribution or reproduction is permitted which does not comply with these terms.
*Correspondence: Shanghong Zhang, emhhbmdzaDkyOEAxMjYuY29t