 Baichi Zhou1,2
 Hezhen Lou1,2Shengtian Yang1,2*Chaojun Li1,2Zihao Pan1,2Yujia Zhang1,2Hao Li1,2Yin Yi3Jiyi Gong1,3
- 1College of Water Sciences, Beijing Normal University, Beijing, China
- 2Beijing Key Laboratory of Urban Hydrological Cycle and Sponge City Technology, Beijing, China
- 3School of Life Sciences, Guizhou Normal University, Guiyang, Guizhou, China
Ecological connectivity in landscapes is crucial for plant diversity conservation. The barrier risk to ecological connectivity represents the risk to ecological connectivity loss or weakening, resulting from the barrier to biological information exchange among habitats. Therefore, clarifying the barrier risk to the ecological connectivity of plant diversity in space can reveal the spatial impacts of reduced ecological connectivity on plant diversity. This study analyzed effects of karst peak, river network, arable land, and impervious surface on plant diversity in karst natural, countryside, urban, and island landscapes in Guizhou Province with fragile environment. Then, we calculated the barrier distance of ecological connectivity to reveal the barrier risk to the ecological connectivity of plant diversity in space. The results showed that karst peak was the source of high plant diversity, and plant diversity could diffuse about 400 m around karst peaks. River network and arable land enhanced the connectivity among karst peaks to maintain plant diversity, and the effect on enhancing the connectivity was about 300 m and 450 m, respectively, while the weakening effect of impervious surface on connectivity was about 350 m. Based on the distance for plant diversity diffusing around karst peaks, the barrier distance of ecological connectivity was determined by the combination type of river network, arable land and impervious surface in landscapes. From low to high, the barrier risk to the ecological connectivity of plant diversity was about 1,110 m in the combination of river network and arable land, about 790 m in the combination of river network, arable land and impervious surface, about 520 min the combination of arable land and impervious surface, about 400 m in the combination of river network and impervious surface. Our findings clarify the barrier risk to the ecological connectivity of plant diversity in space, and provide a scientific basis for plant diversity conservation from the perspective of ecological connectivity.
1 Introduction
As an important component of biodiversity, plant diversity contributes to ensuring human survival and ecosystem stability (Shen et al., 2022). Plant diversity is threatened by habitat decrease and ecological connectivity loss driven by the increasing economic development and urbanization (Bergès et al., 2020; Damiens et al., 2021; Perrin et al., 2022). Habitat loss and fragmentation reduce structural and functional connectivity, leading to plant population density decrease (Herrerías-Diego et al., 2008) and barrier to biological information exchange (Dong et al., 2020). Weakened ecological connectivity among habitats reduces ecological corridors in landscapes (Huang et al., 2022), and undermines the integrity of ecosystem in a region (Kietzka et al., 2021), which increases barriers between habitats creating islands that increase extinction probability (Tian et al., 2022). The barrier risk to ecological connectivity represents the risk of ecological connectivity loss or weakening, which is a threat to plant diversity. Therefore, evaluating the barrier risk to ecological connectivity is important for plant diversity conservation (Li et al., 2022c).
Changes in habitat patterns not only limit the migration ability of animals and plants (Balbi et al., 2019; Liccari et al., 2022), but also reduce the ecological connectivity within landscapes (Uroy et al., 2019), leading to a high barrier risk to the ecological connectivity of plant diversity. Many studies have revealed the mechanism of the barrier risk to the ecological connectivity of plant diversity in terms of landscape pattern and spatial response (Huang, 2011). For example, plant diversity gradually becomes rich with decreases in human interference along the urban‒rural gradient due to reduction of the barrier risk to ecological connectivity (Jha et al., 2019). It is easier to form rich plant diversity in areas with a low barrier risk to ecological connectivity compared with urban areas with severe habitat fragmentation, such as the countryside with good habitat integrity (Yang et al., 2021). Rivers, wetlands and mountains are important corridor that can weaken the barrier risk to ecological connectivity even in urban landscapes (Zhang et al., 2022b; Wang et al., 2022). In contrast, impervious surface in human dominated landscapes threaten ecological connectivity from the perspective of landscape pattern and biological information exchange (Cui et al., 2020; Dai et al., 2021), explaining, to some extent, observed differences in plant diversity between urban and rural areas. However, current research on the barrier risk to the ecological connectivity of plant diversity mainly focus on the spatial response of plant diversity to its influencing factors (Li et al., 2022a). How far the distance that causes barrier risk to ecological connectivity remains unknown because of the limitation in plant dispersal among habitats. Analyzing the barrier distance of ecological connectivity is of great significance for revealing the barrier risk to ecological connectivity in landscapes, and plant diversity conservation in areas with rapid socioeconomic development.
As one of the 32 biodiversity landmarks in the world (Myers et al., 2000), about 10,255 species have been discovered in karst regions in Guizhou Province, China, and over 38% of Chinese endemic species inhabit these regions (Liu et al., 2018a). The rich plant diversity is sensitive to external influences, making the Guizhou karst regions a hot spot for research on plant diversity (Chen et al., 2022). Since 2012, poverty alleviation and rural revitalization have been implemented in succession. Rapid social development has exacerbated problems such as rocky desertification and rural to urban land conversion in Guizhou Province (Zhao and Hou, 2019; Han and Song, 2020), leading to increasingly negative impacts of the barrier risk to ecological connectivity. Meanwhile, the South China Karst is the largest distribution region of karst landforms in the world (Zhang et al., 2021). The staggered distribution of karst peaks and depressions causes significant spatial heterogeneity in human interference and underlying surface (Wang et al., 2019), resulting in spatial differences in ecological connectivity. Therefore, it is appropriate to analyze the barrier risk to the ecological connectivity of plant diversity in Guizhou Province, with rich biodiversity, rapid society development and strong topography heterogeneity.
To spatially reveal the barrier risk to the ecological connectivity of plant diversity in karst regions, this study selected karst natural, countryside, urban, and island landscapes in Guizhou Province as the study areas, and used ground sampling data, unmanned aerial vehicle (UAV) and satellite remote sensing images. The objectives of this study are: (1) Obtain the differences in plant diversity among the four karst landscapes with different ecological connectivity; (2) Identify the factors affecting plant diversity in karst regions, and analyze the their effects on ecological connectivity; (3) Determine the influence distance of these factors on plant diversity from the perspective of ecological connectivity; (4) Calculate the barrier distance of ecological connectivity, and reveal the barrier risk to the ecological connectivity of plant diversity in karst landscapes.
2 Methods and materials
2.1 Study area
Guizhou Province is located in the core area of Southwest China, a region with largest continuous karst landform in the world (Chen et al., 2021), covering an area of about 160,000 km2 (Figure 1). This region is one of the most rapidly urbanized in China, growing to 38 million people in the last 20 years (Yang et al., 2022a). The climate is subtropical monsoon (Xue et al., 2023). The suitable hydrothermal environment enriches the plant resources in Guizhou Province, and make a wide distribution of evergreen-deciduous broad-leaved mixed forest. Among them, the evergreen plants mainly include the Quercus, Neolitsea, Sloanea, and the deciduous plants are mostly the Cornus, Cerasus, Carpinuspubescens, and Platycarya (Li et al., 2022b).
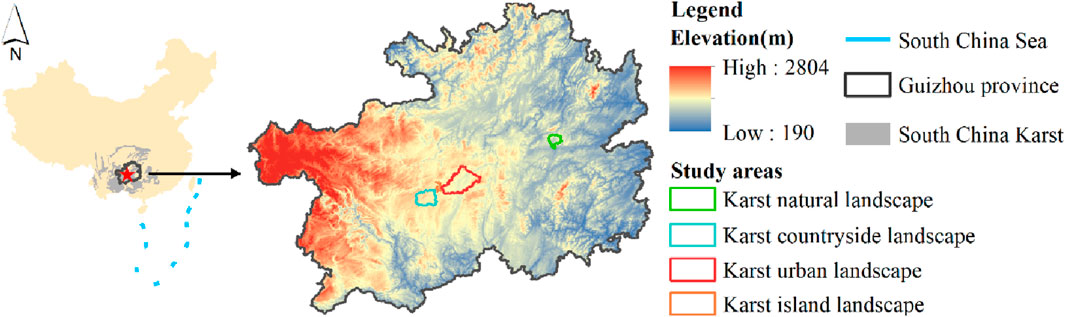
Figure 1. Geographical location of the study areas in karst regions in Guizhou Province, China.
The Shamu River Basin, Yangchang River Basin, Nanming River Basin and Hongfeng Lake in Guizhou Province are taken as the study areas of karst natural, countryside, urban and island landscapes (Figure 2). Among them, the Shanmu River Basin is located in the Shibing Nature Reserve, and is a typical karst natural landscape, with forest coverage over 90% and rich biodiversity (Tang et al., 2017). The Yangchang River Basin is located in the rural transitional zone between Guiyang city and Anshun city, with an area of 605.61 km2. Vegetation is dominated by crops and shrubs due to agricultural cultivation-led human activities, while forests are concentrated in karst peaks (Pan et al., 2023). The Nanming River Basin is located in Guiyang city and its surrounding areas, with an area of 1131.26 km2. Human disturbance in the Nanming River Basin is strong. Construction land and arable land occupy most of dissolved depressions, causing the vegetation mostly grass and shrubs (Li et al., 2022b). Hongfeng Lake is an artificial plateau lake constructed in 1958s and is located between the Yangchang River Basin and Nanming River Basin. Islands in the lake are formed by karst peaks emerging from the lake surface. Vegetation on islands is mainly shrubs and a small amount of forest (Lou et al., 2021).
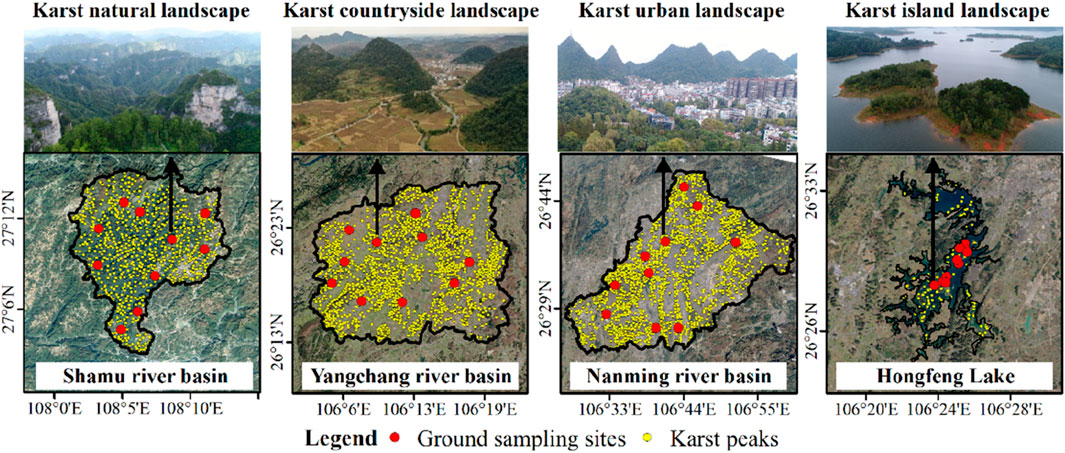
Figure 2. Ground sampling sites, karst peaks and landscape boundaries of the study areas which represented the karst natural, countryside, urban and island landscapes in Guizhou Province, China.
A total of 40 ground sampling sites were established to obtain the plant diversity data in karst natural, countryside, urban and island landscapes with socioeconomic development from low to high (Table 1).
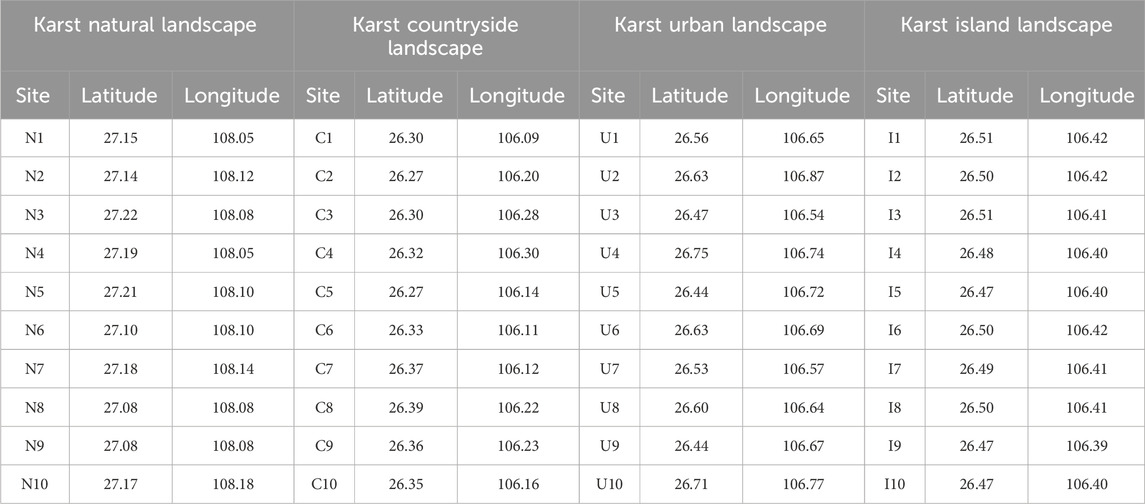
Table 1. Location of the ground sampling sites in karst natural, countryside, urban and island landscapes in Guizhou Province, China.
2.2 Plant diversity and remote sensing data
Plant diversity of each ground sampling site was obtained through the aerial photography of UAV due to the steep terrain of karst peaks. In each of the sampling sites, UAV was used to take low-flying aerial photos, and a total of 10,174 UAV images were obtained. UAV images were processed by Pix4D software to generate the digital orthophoto map with a spatial resolution of about 3 cm. Then, plant species and individuals in the canopy was counted by visual interpretation. According to investigation results, the species accumulation curve of tall plant species tended to converge in the four karst landscapes (Figure 3), showing the sampling for tall plant species could represent the richness of tall plant in landscapes. The evergreen trees, such as Cryptomeria fortune, Juniperus formosana, Juniperus chinensis, Taxus chinensis, Cephalotaxus sinensis, Cunninghamia lanceolata, and the deciduous trees, such as Salix wilsonii, Juglans regia, Platycarya longipes, Castanea mollissima, Broussonetia papyifera, were relatively common in the sampling sites. In addition, the shrubs mainly include Cotinus, Viburnum, Rubus, Rosa, and Chimonanthus.
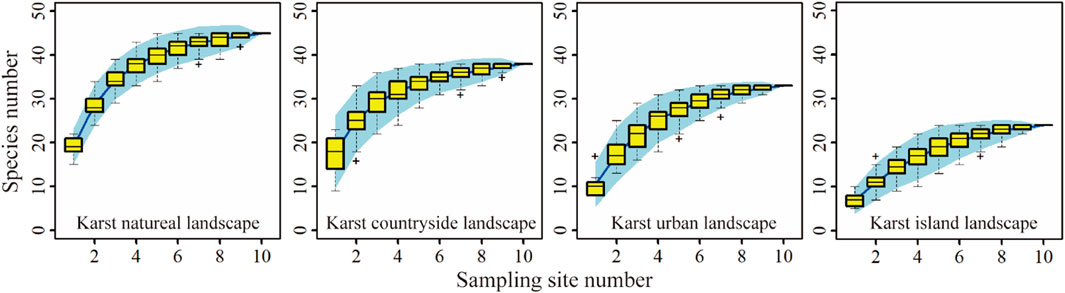
Figure 3. The species accumulation curves of tall plant species in karst natural, countryside, urban and island landscapes.
In the field survey, three 400 m2 plots were set at the edge of karst peak in each sampling site to validate the identification accuracy for plant species by UAV. The number of tree and shrub species was identified and recorded in plots, and the number of trees and shrubs individuals was counted with a diameter at breast height greater than 2.5 cm.
Landsat 8 images could provide surface reflectance information from visible light to near-infrared band with a spatial resolution of 30 m. Fractional vegetation coverage (FVC) was calculated by the Landsat 8 images that was the same period as field survey. Landsat 8 images could be downloaded from the United States Geological Survey (USGS) (https://earthexplorer.usgs.gov).
Land cover data were from the China Land Cover Dataset (CLCD) (Yang and Huang, 2021) and could be derived from the Google Earth Engine (https://developers.google.cn/earth-engine). The temporal and spatial resolutions of CLCD were 1 year and 30 m respectively. CLCD divided the land use into 9 types, including arable land, forest, shrub, grassland, water, snow or ice, barren, impervious surface and wetland. Three-phase CLCD images (1990, 2005, 2020) were used to detect the changes in land use and calculate the density of arable land and impervious surface.
The Shuttle Radar Topography Mission (SRTM) DEM data were widely used due to high precision (Bhang and Schwartz, 2008). With a spatial resolution of 30 m, SRTM1 V3.0 DEM data were for two uses in this study. The first was to determine the subbasin in karst landscapes using the Hydrology Tools in ArcGIS 10.6 software. The second was to identify the karst peaks by combining them with Landsat 8 images. SRTM1 V3.0 DEM data were derived from the USGS.
Details of the dataset used in this study was in Table 2.
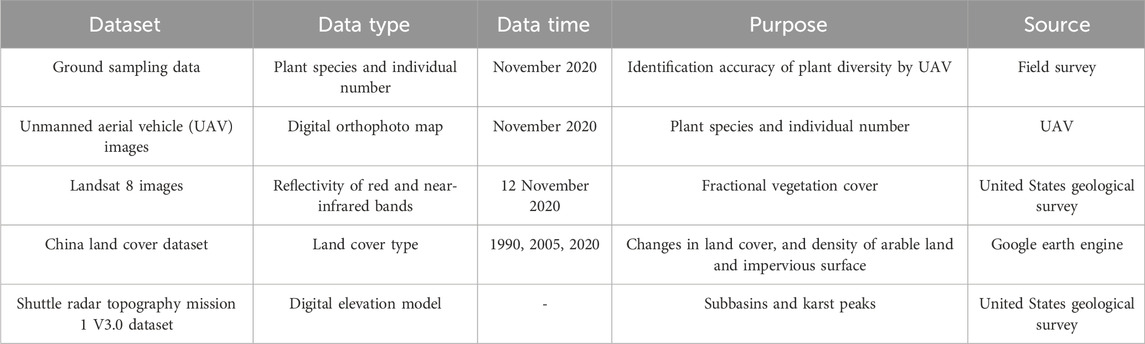
Table 2. Descriptions of the datasets in this study.
2.3 Methods
2.3.1 Plant diversity calculation
Alpha and beta diversity were used to measure the plant diversity of sampling sites. Alpha diversity reflected the species richness and evenness within a certain spatial range (Tuomisto, 2010). Hill number index was the index that considered the number of species and the evenness between species and individuals by different q values (Chao et al., 2014). Formula of the Hill number index was presented by Eq. 1.
Where pi represented the proportion of plant species i and S was the total number of plant species in a sampling site. When q tends to 1, the limit of Hill number index was the Shannon’s entropy exponent, and the Shannon diversity index (SHDI) could be obtained by Eq. 2. For q = 2, the Hill number index was equal to the Simpson reciprocal index (de Bello et al., 2014). The 1H, 2H and 3H was used for plant alpha diversity evaluation, because the sensitivity of Hill number index was from rare species to dominant species with q increased (Tan et al., 2022).
The larger the SHDI was, the higher the species richness of the sampling site and the more uniform the number of individuals. SHDI was also used for spatial pattern evaluation of plant alpha diversity (Li et al., 2022b).
Beta diversity represented the differences in species composition between habitats or sampling sites (Fortin et al., 2020). Sørensen’s index of dissimilarity was used to characterize the beta diversity and indicate the degree of biological information exchange between sampling sites. The calculation of Sørensen’s index of dissimilarity was presented as Eq. 3 (Sperandii et al., 2019).
where
2.3.2 Spatial pattern estimation of plant diversity
Spatial pattern of plant diversity could be estimated based on the strong correlation between plant diversity and FVC (Li et al., 2022a). The normalized difference vegetation index (NDVI) was calculated by Eq. 4 and the reflectance of near-infrared and red bands from Landsat 8 images.
where NIR and R represented the surface reflectance of the near-infrared and red bands, respectively. Then, the pixels were decomposed into vegetation and non-vegetation parts by the pixel dichotomy model. The percentage of vegetation part in pixel was estimated to be the FVC by Eq. 5 (Liu et al., 2018b).
where NDVIsoil and NDVIvegetation were the NDVI of pure bare soil and vegetation pixels, respectively. Finally, spatial pattern of plant diversity could be obtained by establishing the statistical relationship between FVC and SHDI.
2.3.3 Quantifying the barrier risk to the ecological connectivity of plant diversity in spatial distance
Determining the barrier distance of ecological connectivity included identifying the influencing factors of plant diversity and calculating their influence distance on plant diversity. To identify the influencing factors, karst peaks were determined by human‒machine interactive interpretation through Landsat 8 images and DEM data. Karst landscapes were divided into several subbasins based on DEM data, and the calculation of river network density was shown as Eq. 6.
where L was the length of river in subbasin (km), and A was the area of subbasin (km2). Taking the subbasin as basic unit, density of arable land and impervious surface could be calculated by Eq. 7.
where A was the area of arable land or impervious surface in the subbasin (km2), As was the area of subbasin (km2), and Ap was the area of karst peaks (km2).
To determine the spatial influence of karst peak, river network, arable land and impervious surface on plant diversity, buffer zones was established in increments of 100 m around karst peaks and river networks to obtain the changes in SHDI. The distance where changes in SHDI tended to 0 was determined as the spatial limit for karst peak and river network influencing plant diversity. Similarly, the spatial influence of arable land on ecological connectivity were obtained by changes in SHDI with the distance among karst peaks, while that of impervious surface were obtained by changes in SHDI with the nearest distance between karst peaks and impervious surfaces. Then, the barrier distance of ecological connectivity could be determined by the combination type of karst peak, river network, arable land and impervious surface in landscapes.
2.3.4 Statistical analysis for data cluster and coefficient estimation
The natural breaks method was a data cluster-based grouping method (Wei et al., 2020), and could group data by making smallest difference within group and largest difference between groups (Bai et al., 2022). The natural breaks method was used to divide the density of river network, arable land and impervious surface into three levels to explore their influence on plant diversity; The local Moran’s index reflected the spatial aggregation type of data by homogeneity, heterogeneity, and autocorrelation (Song and Song, 2022). The spatial aggregation of karst peaks could be obtained by the local Moran’s index in terms of plant diversity; Information entropy was a measure of information disorder degree. The smaller the information entropy was, the greater the amount of information and the greater the coefficient (Zou et al., 2006). Thus, the entropy method was used to calculate the coefficients when river network, arable land and impervious surface were combined to form the barrier distance of the ecological connectivity of plant diversity.
3 Results
3.1 Characteristics of plant diversity and its spatial pattern in karst landscapes
Plant alpha diversity showed a gradual decrease among karst natural, countryside, urban and island landscapes according to UAV survey (Figure 4A). Plant alpha diversity was the highest in karst natural landscape, due to the Hill number index (1H, 2H and 3H) obviously higher than that of the other karst landscapes. Although plant alpha diversity in karst countryside landscape was slightly lower than that of karst natural landscape, plant diversity was still maintained at relative high level, and the average 1H, 2H and 3H could reach a value of 11.3, 9.7 and 8.7, respectively. In contrast, plant alpha diversity decreased significantly in urban and island landscapes due to the lower component of vegetation in sampling sites.
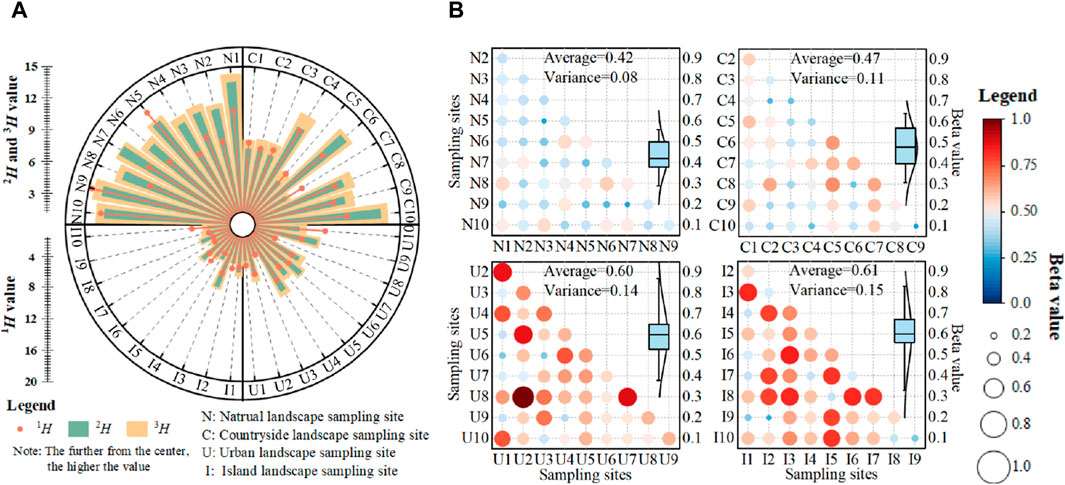
Figure 4. Plant diversity characteristics in karst natural, countryside, urban and island landscapes in Guizhou Province, China. (A) Plant alpha diversity, (B) plant beta diversity.
In addition, karst natural and countryside landscapes maintained a good similarity of plant species compositions and biological information exchange, while differences in species composition was obvious in karst urban and island landscape (Figure 4B). The average beta value increased from 0.42 to 0.47 in karst natural and countryside landscapes to 0.60 in karst urban landscape, and reached the maximum value of 0.61 in karst island landscape.
The strong correlation between FVC and SHDI was found (Figure 5A). The coefficient of determination (R2) reached 0.85, showing FVC could well describe the variations in SHDI. p-value was lower than 0.01, indicating the significant positive linear correlation between FVC and SHDI due to passing the 99% significance test. Then, the spatial pattern of SHDI could be estimated by FVC (Figure 5B). Although the proportion of area with high plant diversity in karst countryside landscape was lower than that of karst natural landscape, the spatial fragmentation remained low. In contrast, the areas with high plant diversity were serious spatially fragmented in karst urban landscape, leading to overall decreases in plant diversity. In karst island landscape, vegetation was only scattered on the island. Therefore, the integrity of karst natural and countryside landscape was better than that of karst urban and island landscape in terms of the spatial pattern of areas with high plant diversity.
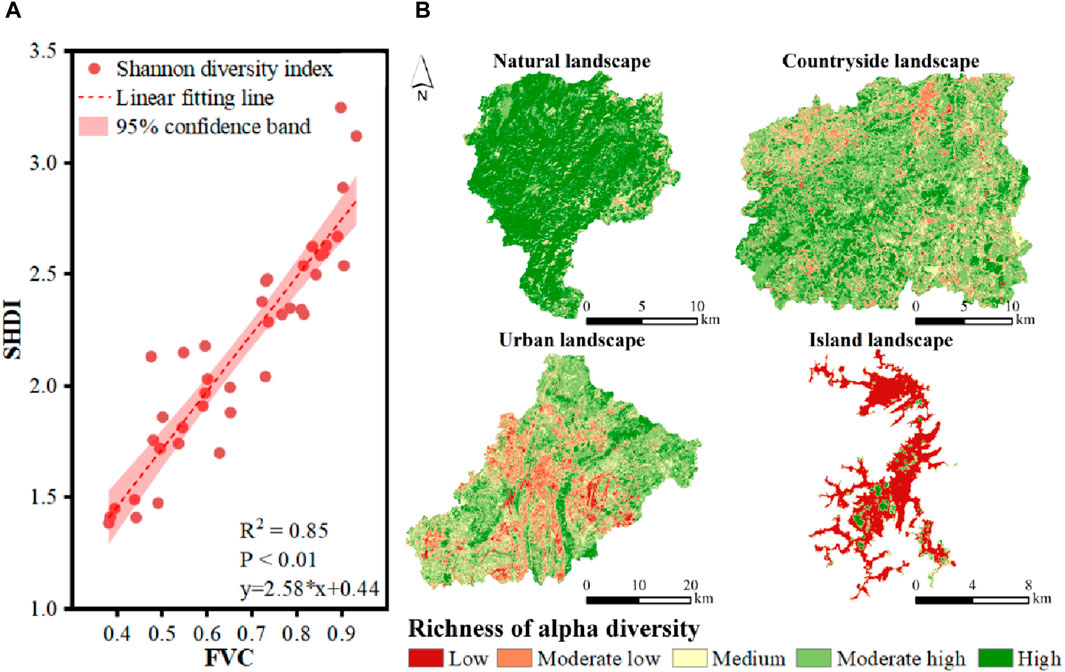
Figure 5. The spatial distribution of SHDI estimated by FVC. (A) The strong correlation between FVC and SHDI, (B) the spatial pattern of SHDI in karst natural, countryside, urban and island landscapes in Guizhou Province, China.
3.2 Effects of underlying surface factors on plant diversity in karst landscapes
Arable land had positive impact on plant diversity, while impervious surface had negative impact, according to the conversion relationship of land use in karst natural, countryside, urban and island landscapes (Figure 6). During the last 30 years, plant diversity maintained rich in spite of a small amount of forest converting to arable land in karst natural landscape. Although arable land was dominant, plant diversity still remained relative rich in karst countryside landscape. Plant diversity was low in karst urban landscape, because a large amount of arable land was converted into impervious surfaces.
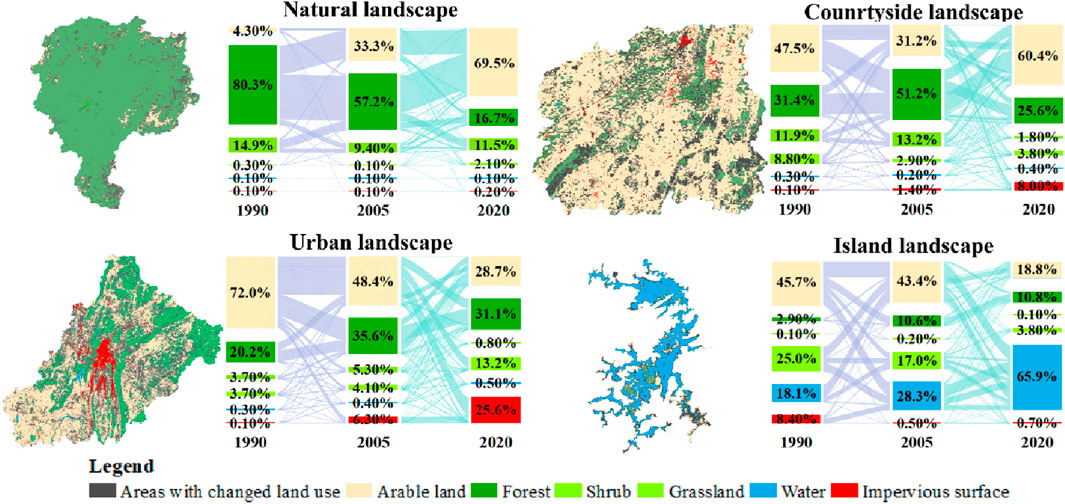
Figure 6. Spatial distribution and area transfer matrix of the areas with land use change in karst natural, countryside, urban and island landscapes in 1990, 2005 and 2020 in Guizhou Province, China.
In addition, karst peaks and river networks had positive impacts on plant diversity according to Table 3. Karst peak density and river network density both decreased from karst natural, countryside to urban landscapes, which was consistent with the decreases in plant diversity among karst natural, countryside and urban landscapes.
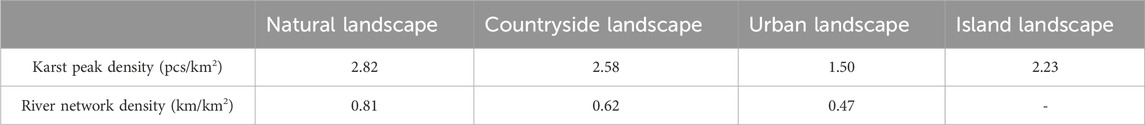
Table 3. Differences in karst peak density and river network density in karst natural, countryside, urban and island landscapes in Guizhou Province, China.
3.2.1 Karst peak as the source of plant diversity diffusion
Karst peak was the source of high plant diversity, and plant diversity could diffuse around karst peak. A total of 701, 1,564, 1,701, and 113 karst peaks were identified in karst natural, countryside, urban and island landscapes, respectively (Figure 7A), and the SHDI of all karst peaks were obtained (Figure 7B). Firstly, the average SHDI of karst peaks decreased among karst natural, countryside, urban and island landscapes, which was consistent with the differences in SHDI among the four karst landscapes. Secondly, the proportion of karst peaks with high plant diversity could also reach 66.3% and 46.9% even in karst urban and island landscapes, respectively. Third, gradient decreases in plant diversity were consistent with the decreasing trend in karst peak density among karst natural, countryside, urban and island landscapes. The above three factors together indicated that karst peak was the region with high plant diversity in karst landscapes.
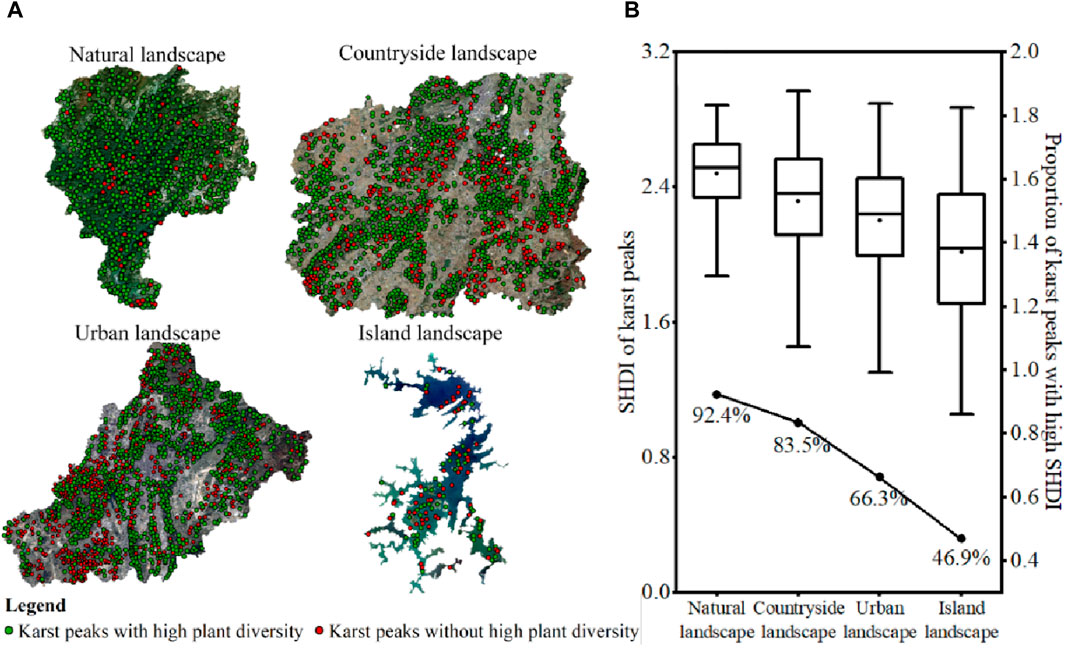
Figure 7. Spatial distribution of karst peaks (A) and the proportion of karst peaks with high plant diversity (B) in karst natural, countryside, urban and island landscapes in Guizhou Province, China.
3.2.2 Effects of river networks, arable land and impervious surfaces on connectivity
River networks could promote the formation of high plant diversity through enhancing the ecological connectivity among karst peaks (Figure 8). The proportion of subbasins with high river network density (0.95–3.36 km/km2) decreased among karst natural, countryside and urban landscapes, consistent with the decreases in SHDI from karst natural, countryside to urban landscape (Figure 8A). Furthermore, the SHDI of karst peaks all experienced an increasing trend to different degrees with increases in river network density in subbasins in the same landscape (Figure 8B).
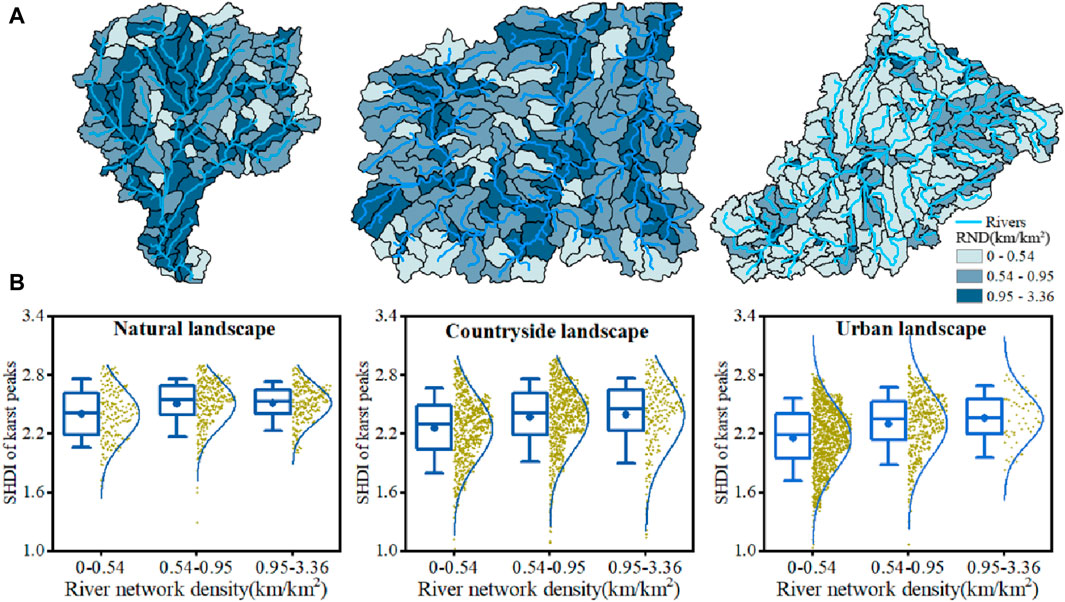
Figure 8. Spatial distribution of subbasins with different river network density (RND) (A), and the SHDI of karst peaks in the subbasins with different RND (B) in karst natural, countryside and urban landscapes.
Arable land enhanced the ecological connectivity among karst peaks, while impervious surface could weaken the ecological connectivity (Table 4). In subbasins with the same grade of river network density, the SHDI of karst peaks showed an increasing trend with the increases in arable land density, indicating a positive correlation between the SHDI of karst peaks and arable land. It could be inferred that arable land positively influence the SHDI of karst peaks by enhancing the ecological connectivity among karst peaks, since the depressions where arable land mainly distributed were the transition zones among karst peaks. In contrast, impacts of impervious surface was opposite to that of arable land, which could cause the barrier to ecological connectivity among karst peaks.
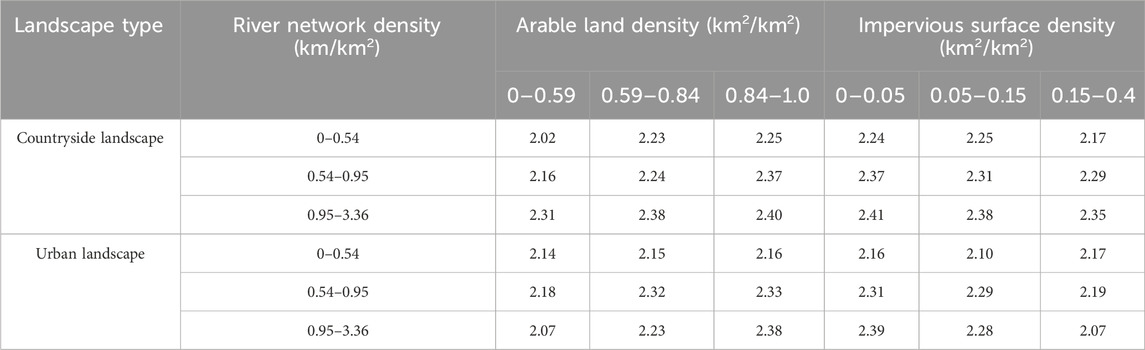
Table 4. Relationship between SHDI and arable land and impervious surface in subbasin with the same grade of river network density.
3.3 Determining the spatial influence on plant diversity
The spatial distance for plant diversity diffusing around karst peaks was about 400 m (Figure 9A). The average SHDI showed a significant decreasing trend with the increasing distance from karst peaks. Distance for plant diversity diffusing around karst peaks reached the limit between 300 m and 400 m in karst countryside landscape, and between 400 m and 500 m in karst urban landscape. Changes in SHDI were no longer obvious with the increasing distance after exceeding the limit.
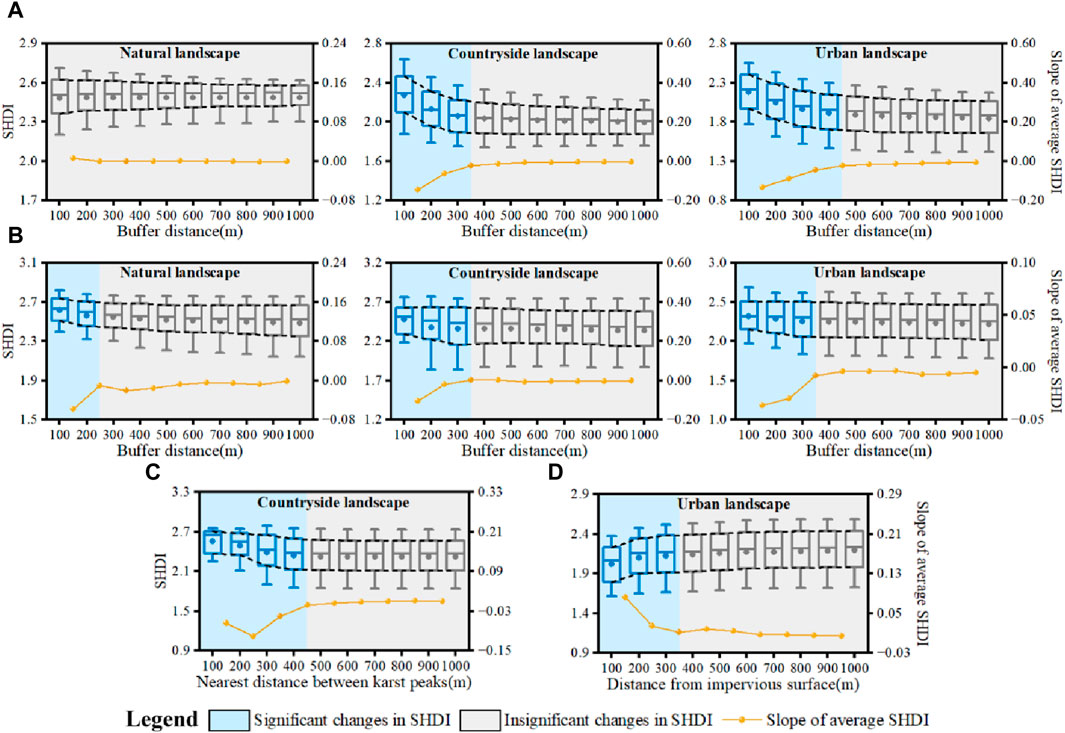
Figure 9. Spatial influencing distance of karst peaks (A), river networks (B), arable land (C) and impervious surfaces (D) on plant diversity.
According to the slope of changes in SHDI of karst peaks in different river network buffer zones (Figure 9B), river network could enhance the ecological connectivity among karst peaks until reaching the distance of 200–300 m, 300–400 m and 300–400 m in karst natural, countryside and urban landscapes, respectively. Therefore, the effect of river network on enhancing the ecological connectivity was about 300 m.
Similarly, there was also a distance limit about 450 m that arable land could influence the ecological connectivity among karst peaks. Because decrease in SHDI of karst peaks tended to 0 when the distance reached about 400–500 m (Figure 9C). For impervious surface, the SHDI of karst peaks gradually increased with the increasing distance from impervious surface, showing a weaker effect of impervious surfaces on ecological connectivity (Figure 9D). When the distance from karst peak to impervious surface reached about 350 m, changes in SHDI of karst peaks were no longer significant.
3.4 Evaluation of the barrier risk to the ecological connectivity of plant diversity
Plant diversity could diffuse around karst peak. The impacts of river network, arable land, and impervious surface on plant diversity were reflected by changing the ecological connectivity among karst peaks. All these factors influenced the ecological connectivity with a spatial distance limit. Therefore, the barrier distance of ecological connectivity was formed according to karst peak and the combination of river network, arable land, and impervious surface in landscapes, and thus revealed the barrier risk to the ecological connectivity of plant diversity.
The barrier distance of ecological connectivity was calculated in Table 5. The combination of arable land and river networks could influence plant diversity by enhancing ecological connectivity among karst peaks within about 710 m, which was significantly higher than the other combinations with impervious surface, such as the combination of impervious surfaces and river networks (0 m), the combination of impervious surfaces and arable land (120 m) and the combination of impervious surfaces, river networks and arable land (390 m) (Figure 10A).
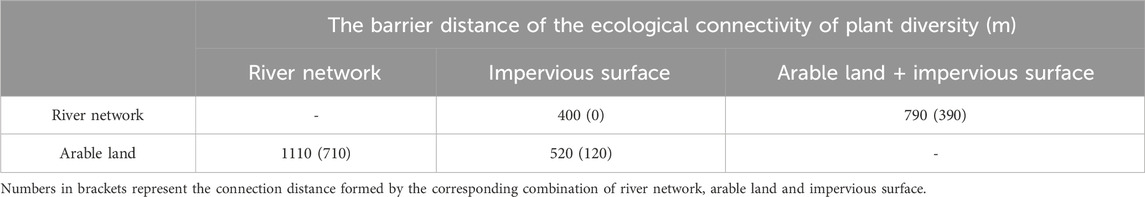
Table 5. The barrier distance of the ecological connectivity of plant diversity formed by four combinations of karst peak, river network, arable land and impervious surface.
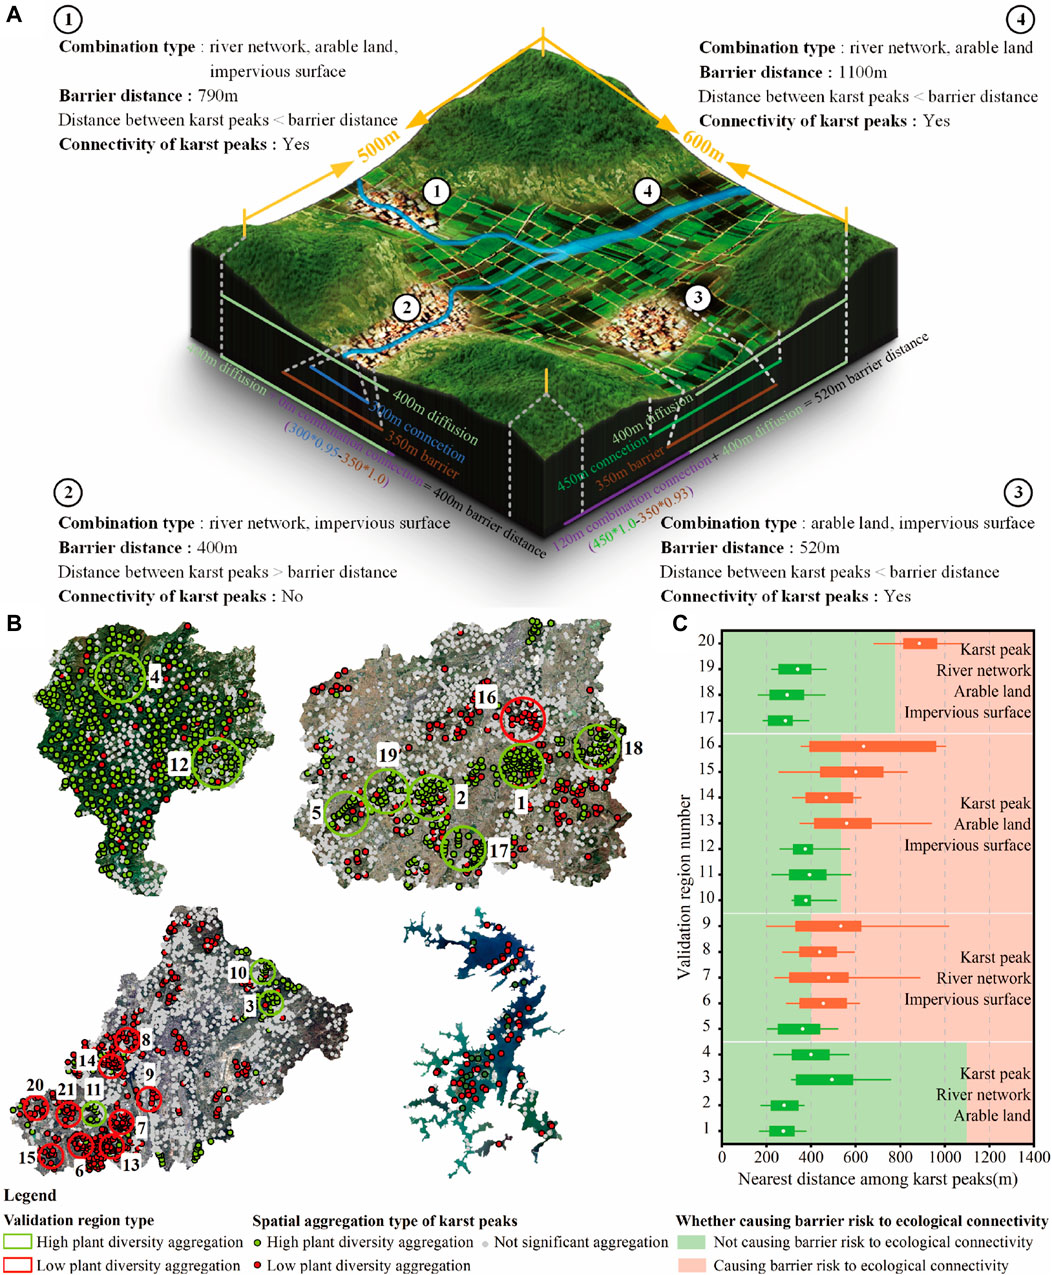
Figure 10. Diagrammatic sketch (A), validation regions (B) and validation results (C) of the barrier risk to the ecological connectivity of plant diversity.
20 plant diversity aggregation regions were determined as the validation regions by the local Moran’s I index (Figure 10B). The combination type of river networks, arable land and impervious surfaces in each validation region was identified (Figure 10C). In karst natural and countryside landscapes, high plant diversity aggregation was dominant, while low plant diversity aggregation of karst peaks was dominant in karst urban and island landscapes.
When the distance among karst peaks was lower than the barrier distance of ecological connectivity, ecological connectivity among karst peaks maintained well, and formed high plant diversity in landscapes. Otherwise, plant diversity tended to be low (Figure 10C). In validation regions with high plant diversity aggregation, the distance among karst peaks was generally lower than the barrier distance of ecological connectivity, indicating a well ecological connectivity among karst peaks. In contrast, karst peaks tended to be isolated in validation regions with low plant diversity aggregation due to the overall distance among karst peaks higher than the barrier distance of ecological connectivity, thus resulting in the low plant diversity of karst peaks.
4 Discussion
4.1 Mechanisms of underlying surface factors influencing plant diversity
Karst peaks could affect plant diversity because terrain heterogeneity was highly correlated with plant diversity (Stein et al., 2014). The topographic relief of karst peaks caused spatial heterogeneity in soil physical and chemical properties, such as soil water content, pH value and soil calcium (Zhang et al., 2014). Differences in spatial distribution of soil physical and chemical properties affected the growth suitability of plants, leading to the spatial heterogeneity of plant species and richness (Zhang et al., 2013), and thus the increase in plant diversity. In addition, human disturbance was an important driver for plant diversity decrease (Li et al., 2022b). The steep slope prevented the human disturbance on karst peaks to some extent. Meanwhile, karst peaks were generally considered one of the regions with the richest plant diversity in karst landscapes (Yang et al., 2021). The above factors indicated karst peaks maintained the rich plant diversity in karst landscapes.
Rivers could affect the ecological connectivity to influence plant diversity by environmental suitability and riparian vegetation zone. On the one hand, a suitable hydrothermal environment was necessary for plant life activities (Yao et al., 2021). Hydrological conditions could change the direction and grade of plant succession by the available water for plant (Zou et al., 2022). Rivers not only controlled the surface water supply to plants but were also the main migration carriers of necessary nutrients for plants (Li et al., 2022a). On the other hand, the impact of rivers on riparian vegetation was significant, because plant diversity along rivers was generally higher than that in areas far from rivers (Zhang et al., 2022a). In addition, rivers were also a positive factor for constructing the resistance surface to derive ecological corridors (Cui et al., 2020). This showed a positive influence of rivers on ecological connectivity and plant diversity.
Arable land and impervious surfaces had the opposite impacts on plant diversity due to the differences in spatial pattern and vegetation composition. First, strong human interference in impervious surfaces made plant species and richness subject to human control. In contrast, the mosaic structure of fallow land, hedges, and shrubs in arable land increased the heterogeneity of the landscapes (Chen and Zhang, 2021), and contributed to maintaining rich plant species diversity (Turtureanu et al., 2014). Second, impervious surfaces were generally distributed in a spatial aggregation pattern (Yang et al., 2022b). Large impervious surface patches cut off the ecological connectivity between habitats (Crouzeilles et al., 2021). Arable land was distributed mainly in the transition zones among karst peaks or between karst peaks and impervious surfaces. It helped to weaken the negative impacts of impervious surfaces, and enhance ecological connectivity among karst peaks (Yang et al., 2021). Thus, arable land had a positive impact on plant diversity by influencing ecological connectivity among karst peaks, while the impacts of impervious surface were opposite.
4.2 Reliability analysis for the barrier risk to the ecological connectivity of plant diversity
Plant dispersal among habitats was of great significance for plant diversity formation and maintenance (Liccari et al., 2022). According to current research, the dispersal distance of acorn species ranged from 3 m to 550 m in the eastern Iberian Peninsula, Spain (Pons and Pausas, 2007). 15 tree and shrub species were evaluated in Saipan, and their dispersal distance maintained at about 500 m (Rehm et al., 2019). In addition, the dispersal distance of more than 200 plant species was within 1 km investigated by Thomson et al. (2011). Even in tropical regions where seeds spread farther away, the farthest dispersal distance of tree species was mostly at the level of hundreds meters (Chen et al., 2019). As shown in Table 5, the barrier distance of ecological connectivity also remained at the level of hundreds of meters, which was close to the dispersal distance of most plants. Therefore, it was feasible to use the barrier risk to ecological connectivity to indicate the ecological connectivity of plant diversity among habitats.
Plant dispersal ability was limited in space (Morgan and Venn, 2017). However, the dispersal distance of plants could be influenced by environment factors, such as karst peak, river network, arable land and impervious surface, leading to differences in the barrier risk to the ecological connectivity of plant diversity. In countryside landscape in Guizhou Province, the average distance was about 400 m among karst peaks with rich plant diversity (Yang et al., 2021), within the barrier distance of the four different combination types in Table 5. In the same regions, areas with high plant diversity rarely occurred within about 500 m from towns (Yang et al., 2021), consistent with the 400 m and 520 m barrier distance that included impervious surface in Table 5. For river networks, the gradient difference in plant diversity was greater than the distance of 100 m in riparian zones (Zhang et al., 2022a), within the 300 m ecological connectivity enhancement distance among karst peaks. In summary, karst peaks tended to form high plant diversity when the distance among karst peaks was lower than the barrier distance of ecological connectivity, and vice versa.
Although the main limitation of this study was the difficulty to sample short plants by UAV due to the difficulties in plot investigation at karst peaks and the occlusion of tall plant canopy, the dispersal distance of tall plants was generally longer than that of short plants (Thomson et al., 2017). The barrier distance of tall plants could cover the influence distance by karst peak, river network, arable land, and impervious surface on short plants. It showed the maximum spatial response distance of plant diversity to the barrier risk to ecological connectivity. Therefore, it was reliable to evaluate the barrier risk to the ecological connectivity of plant diversity by the tall plants which could be sampled by UAV.
5 Conclusion
Analyzing the barrier risk to the ecological connectivity of plant diversity was crucial for balancing plant diversity conservation and socioeconomic development in karst regions. This study revealed spatial impacts of the barrier risk to ecological connectivity on plant diversity in karst regions, and the main conclusions were as follows:
1. Karst peak, river network and arable land had maintenance effects on plant diversity. Karst peak was the source of plant diversity diffusion. River network and arable land enhanced connectivity among karst peaks, while impervious surface had the barrier effect on connectivity.
2. In space, plant diversity could diffuse about 400 m around karst peaks. River network and arable land could enhance the connectivity among karst peaks by a distance about 300 m and 450 m, respectively, while the barrier effect of impervious surface on connectivity was about 350 m.
3. Combination of river network, arable land and impervious surface determined the barrier risk to the ecological connectivity of plant diversity. From low to high, the barrier distance was about 1,110 m in the combination of river network and arable land, about 790 m in the combination of river network, arable land and impervious surface, about 520 m in the combination of arable land and impervious surface, about 400 m in the combination of river network and impervious surface.
Our findings concretized the barrier risk to the ecological connectivity of plant diversity, which could provide a planning basis for plant diversity protection in the karst regions with rapid socioeconomic development and large population. For the global karst regions whose development and population were not as fast and large as Guizhou Province, much attention should be paid to the barrier risk to ecological connectivity to protect plant diversity when society develops fast in future.
Data availability statement
The original contributions presented in the study are included in the article/Supplementary Material, further inquiries can be directed to the corresponding author.
Author contributions
BZ: Conceptualization, Formal Analysis, Investigation, Methodology, Visualization, Writing–original draft. HL: Conceptualization, Investigation, Supervision, Writing–review and editing. SY: Conceptualization, Data curation, Funding acquisition, Investigation, Supervision, Validation, Writing–review and editing. CL: Data curation, Investigation, Methodology, Validation, Visualization, Writing–review and editing. ZP: Investigation, Validation, Visualization, Writing–review and editing. YZ: Investigation, Software, Visualization, Writing–review and editing. HaL: Investigation, Visualization, Writing–review and editing. YY: Supervision, Writing–review and editing. JG: Investigation, Writing–review and editing.
Funding
The author(s) declare that financial support was received for the research, authorship, and/or publication of this article. This work was funded by the National Natural Science Foundation of China (grant number U1812401), Major Scientific and Technological Project of Guizhou Province (qiankehechengguo [2022] zhongdian 010), Beijing Natural Science Foundation (8234071), National Key Research and Development Project (2022YFF130201), and Third Comprehensive Scientific Investigation in Xinjiang: Water Resources Investigation and Bearing Capacity Assessment in Turpan Hami Basin (grant number SQ2021xkk02400).
Conflict of interest
The authors declare that the research was conducted in the absence of any commercial or financial relationships that could be construed as a potential conflict of interest.
Publisher’s note
All claims expressed in this article are solely those of the authors and do not necessarily represent those of their affiliated organizations, or those of the publisher, the editors and the reviewers. Any product that may be evaluated in this article, or claim that may be made by its manufacturer, is not guaranteed or endorsed by the publisher.
References
Bai, Z., Han, L., Jiang, X., Liu, M., Li, L., Liu, H., et al. (2022). Spatiotemporal evolution of desertification based on integrated remote sensing indices in Duolun County, Inner Mongolia. Ecol. Inf. 70, 101750. doi:10.1016/j.ecoinf.2022.101750
Balbi, M., Petit, E. J., Croci, S., Nabucet, J., Georges, R., Madec, L., et al. (2019). Title: ecological relevance of least cost path analysis: an easy implementation method for landscape urban planning. J. Environ. Manage. 244, 61–68. doi:10.1016/j.jenvman.2019.04.124
Bergès, L., Avon, C., Bezombes, L., Clauzel, C., Duflot, R., Foltête, J.-C., et al. (2020). Environmental mitigation hierarchy and biodiversity offsets revisited through habitat connectivity modelling. J. Environ. Manage. 256, 109950. doi:10.1016/j.jenvman.2019.109950
Bhang, K. J., and Schwartz, F. (2008). Limitations in the hydrologic applications of C-band SRTM DEMs in low-relief settings. IEEE Geosci. Remote Sens. Lett. 5, 497–501. doi:10.1109/LGRS.2008.920712
Chao, A., Chiu, C.-H., and Jost, L. (2014). Unifying species diversity, phylogenetic diversity, functional diversity, and related similarity and differentiation measures through Hill numbers. Annu. Rev. Ecol. Evol. Syst. 45, 297–324. doi:10.1146/annurev-ecolsys-120213-091540
Chen, Q., Lu, S., Xiong, K., and Zhao, R. (2021). Coupling analysis on ecological environment fragility and poverty in South China Karst. Environ. Res. 201, 111650. doi:10.1016/j.envres.2021.111650
Chen, S., Milne, R., Zhou, R., Meng, K., Yin, Q., Guo, W., et al. (2022). When tropical and subtropical congeners met: multiple ancient hybridization events within Eriobotrya in the Yunnan-Guizhou Plateau, a tropical-subtropical transition area in China. Mol. Ecol. 31, 1543–1561. doi:10.1111/mec.16325
Chen, S., and Zhang, Y. (2021). Research progress on biodiversity in the rural landscape. Biodivers. Sci. 29, 1411–1424. doi:10.17520/biods.2021135
Chen, S.-C., Tamme, R., Thomson, F., and Moles, A. (2019). Seeds tend to disperse further in the tropics. Ecol. Lett. 22, 954–961. doi:10.1111/ele.13255
Crouzeilles, R., Maurenza, D., Prieto, P. V., Barros, F. S. M., Jakovac, C., Ferreira, M. S., et al. (2021). Associations between socio-environmental factors and landscape-scale biodiversity recovery in naturally regenerating tropical and subtropical forests. Conserv. Lett. 14, e12768. doi:10.1111/conl.12768
Cui, L., Wang, J., Sun, L., and Lv, C. (2020). Construction and optimization of green space ecological networks in urban fringe areas: a case study with the urban fringe area of Tongzhou district in Beijing. J. Clean. Prod. 276, 124266. doi:10.1016/j.jclepro.2020.124266
Dai, L., Liu, Y., and Luo, X. (2021). Integrating the MCR and DOI models to construct an ecological security network for the urban agglomeration around Poyang Lake, China. Sci. Total Environ. 754, 141868. doi:10.1016/j.scitotenv.2020.141868
Damiens, F. L. P., Backstrom, A., and Gordon, A. (2021). Governing for “no net loss” of biodiversity over the long term: challenges and pathways forward. One Earth 4, 60–74. doi:10.1016/j.oneear.2020.12.012
de Bello, F., Chiu, C.-H., and Chao, A. (2014). Distance-based functional diversity measures and their decomposition: a framework based on Hill numbers. PLoS One 9, e100014. doi:10.1371/journal.pone.0100014
Dong, J., Peng, J., Liu, Y., Qiu, S., and Han, Y. (2020). Integrating spatial continuous wavelet transform and kernel density estimation to identify ecological corridors in megacities. Landsc. Urban Plan. 199, 103815. doi:10.1016/j.landurbplan.2020.103815
Fortin, M., Kondratyeva, A., Van Couwenberghe, R., and Leprieur, F. (2020). Improved β-diversity estimators based on multiple-site dissimilarity: distinguishing the sample from the population. Glob. Ecol. Biogeogr. 29, 1073–1084. doi:10.1111/geb.13080
Han, M., and Song, M. (2020). Quantifying ecological well-being loss under rural–urban land conversion: a study from choice experiments in China. Sustainability 12, 3378. doi:10.3390/su12083378
Herrerías-Diego, Y., Quesada, M., Stoner, K. E., Lobo, J. A., Hernández-Flores, Y., and Sanchez Montoya, G. (2008). Effect of forest fragmentation on fruit and seed predation of the tropical dry forest tree Ceiba aesculifolia. Biol. Conserv. 141, 241–248. doi:10.1016/j.biocon.2007.09.017
Huang, H. (2011). Plant diversity and conservation in China: planning a strategic bioresource for a sustainable future. Bot. J. Linn. Soc. 166, 282–300. doi:10.1111/j.1095-8339.2011.01157.x
Huang, K., Peng, L., Wang, X., and Chen, T. (2022). Integrating landscape connectivity and natural-anthropogenic interaction to understand karst vegetation restoration: a case study of Guizhou Province, China. Front. Ecol. Evol. 10, 844437. doi:10.3389/fevo.2022.844437
Jha, R. K., Nölke, N., Diwakara, B. N., Tewari, V. P., and Kleinn, C. (2019). Differences in tree species diversity along the rural-urban gradient in Bengaluru, India. Urban For. Urban Green. 46, 126464. doi:10.1016/j.ufug.2019.126464
Kietzka, G. J., Pryke, J. S., Gaigher, R., and Samways, M. J. (2021). Webs of well-designed conservation corridors maintain river ecosystem integrity and biodiversity in plantation mosaics. Biol. Conserv. 254, 108965. doi:10.1016/j.biocon.2021.108965
Li, C., Lou, H., Yang, S., Li, X., Zhang, J., Pan, Z., et al. (2022a). Effect of human disturbances and hydrologic elements on the distribution of plant diversity within the Shamu watershed, Mt. Yuntai Nature Reserve, China. J. Environ. Manage. 311, 114833. doi:10.1016/j.jenvman.2022.114833
Li, C., Lou, H., Yang, S., Pan, Z., Zhang, Y., Zhang, J., et al. (2022b). The response of plant diversity to human dominance in the meta-watershed ecosystem of Southwest China. Ecol. Indic. 143, 109389. doi:10.1016/j.ecolind.2022.109389
Li, H., Guo, W., Liu, Y., Zhang, Q., Xu, Q., Wang, S., et al. (2022c). The delineation and ecological connectivity of the three parallel rivers natural world heritage site. Biology 12, 3. doi:10.3390/biology12010003
Liccari, F., Boscutti, F., Bacaro, G., and Sigura, M. (2022). Connectivity, landscape structure, and plant diversity across agricultural landscapes: novel insight into effective ecological network planning. J. Environ. Manage. 317, 115358. doi:10.1016/j.jenvman.2022.115358
Liu, B., Zhang, M., Bussmann, W. R., Liu, H., Liu, Y., Peng, Y., et al. (2018a). Species richness and conservation gap analysis of karst areas: a case study of vascular plants from Guizhou, China. Glob. Ecol. Conserv. 16, e00460. doi:10.1016/j.gecco.2018.e00460
Liu, Q., Zhang, T., Li, Y., Li, Y., Bu, C., and Zhang, Q. (2018b). Comparative analysis of fractional vegetation cover estimation based on multi-sensor data in a semi-arid sandy area. Chin. Geogr. Sci. 29, 166–180. doi:10.1007/s11769-018-1010-2
Lou, H., Scovronick, N., Yang, S., Ren, X., Shi, L., Fu, Y., et al. (2021). A balance exists between vegetation recovery and human development over the past 30 years in the Guizhou Plateau, China. Ecol. Indic. 133, 108357. doi:10.1016/j.ecolind.2021.108357
Morgan, J. W., and Venn, S. E. (2017). Alpine plant species have limited capacity for long-distance seed dispersal. Plant Ecol. 218, 813–819. doi:10.1007/s11258-017-0731-0
Myers, N., Mittermeier, R. A., Mittermeier, C. G., da Fonseca, G. A. B., and Kent, J. (2000). Biodiversity hotspots for conservation priorities. Nature 403, 853–858. doi:10.1038/35002501
Pan, Z., Yang, S., Lou, H., Li, C., Zhang, J., Zhang, Y., et al. (2023). Perspectives of human–water co-evolution of blue–green water resources in subtropical areas. Hydrol. Process. 37, e14818. doi:10.1002/hyp.14818
Perrin, M., Bertrand, N., and Vanpeene, S. (2022). Ecological connectivity in spatial planning: from the EU framework to its territorial implementation in the French context. Environ. Sci. Policy. 129, 118–125. doi:10.1016/j.envsci.2021.12.011
Pons, J., and Pausas, J. G. (2007). Acorn dispersal estimated by radio-tracking. Oecologia 153, 903–911. doi:10.1007/s00442-007-0788-x
Rehm, E., Fricke, E., Bender, J., Savidge, J., and Rogers, H. (2019). Animal movement drives variation in seed dispersal distance in a plant–animal network. Proc. R. Soc. B-Biol. Sci. 286, 20182007. doi:10.1098/rspb.2018.2007
Shen, C., Wang, J., Jing, Z., Qiao, N. H., Xiong, C., and Ge, Y. (2022). Plant diversity enhances soil fungal network stability indirectly through the increase of soil carbon and fungal keystone taxa richness. Sci. Total Environ. 818, 151737. doi:10.1016/j.scitotenv.2021.151737
Song, Y., and Song, J. (2022). Analysis of surface temperature in an urban area using supervised spatial autocorrelation and Moran’s I. Earth Sci. Inf. 15, 2545–2552. doi:10.1007/s12145-022-00856-x
Sperandii, M. G., Bazzichetto, M., Gatti, F., and Acosta, A. T. R. (2019). Back into the past: resurveying random plots to track community changes in Italian coastal dunes. Ecol. Indic. 96, 572–578. doi:10.1016/j.ecolind.2018.09.039
Stein, A., Gerstner, K., and Kreft, H. (2014). Environmental heterogeneity as a universal driver of species richness across taxa, biomes and spatial scales. Ecol. Lett. 17, 866–880. doi:10.1111/ele.12277
Tan, X., Shan, Y., Wang, X., Liu, R., and Yao, Y. (2022). Comparison of the predictive ability of spectral indices for commonly used species diversity indices and Hill numbers in wetlands. Ecol. Indic. 142, 109233. doi:10.1016/j.ecolind.2022.109233
Tang, X., Zhang, C., and Shang, C. (2017). The flora of wild seed plants in Shibing Yuntai Mountain world heritage of dolomite karst. Mol. Plant Breed. 15, 1986–1993. doi:10.13271/j.mpb.015.001986
Thomson, F. J., Letten, A. D., Tamme, R., Edwards, W., and Moles, A. T. (2017). Can dispersal investment explain why tall plant species achieve longer dispersal distances than short plant species? New Phytol. 217, 407–415. doi:10.1111/nph.14735
Thomson, F. J., Moles, A. T., Auld, T. D., and Kingsford, R. T. (2011). Seed dispersal distance is more strongly correlated with plant height than with seed mass. J. Ecol. 99, 1299–1307. doi:10.1111/j.1365-2745.2011.01867.x
Tian, M., Chen, X., Gao, J., and Tian, Y. (2022). Identifying ecological corridors for the Chinese ecological conservation redline. PLoS One 17, e0271076. doi:10.1371/journal.pone.0271076
Tuomisto, H. (2010). A diversity of beta diversities: straightening up a concept gone awry. Part 1. Defining beta diversity as a function of alpha and gamma diversity. Ecography. 33, 2–22. doi:10.1111/j.1600-0587.2009.05880.x
Turtureanu, P. D., Palpurina, S., Becker, T., Dolnik, C., Ruprecht, E., Sutcliffe, L. M. E., et al. (2014). Scale- and taxon-dependent biodiversity patterns of dry grassland vegetation in Transylvania. Agric. Ecosyst. Environ. 182, 15–24. doi:10.1016/j.agee.2013.10.028
Uroy, L., Ernoult, A., and Mony, C. (2019). Effect of landscape connectivity on plant communities: a review of response patterns. Landsc. Ecol. 34, 203–225. doi:10.1007/s10980-019-00771-5
Wang, C., Zhou, T., Qin, Y., Zhou, G., Fei, Y., Xu, Y., et al. (2022). Wuling mountains function as a corridor for woody plant species exchange between northern and southern Central China. Front. Ecol. Evol. 10, 837738. doi:10.3389/fevo.2022.837738
Wang, K., Zhang, C., Chen, H., Yue, Y., Zhang, W., Zhang, M., et al. (2019). Karst landscapes of China: patterns, ecosystem processes and services. Landsc. Ecol. 34, 2743–2763. doi:10.1007/s10980-019-00912-w
Wei, J., Ding, Z., Meng, Y., and Li, Q. (2020). Regional sustainable assessment at city level based on CSDIS (China sustainable development indicator system) concept in the new era, China. Chin. Geogr. Sci. 30, 976–992. doi:10.1007/s11769-020-1158-4
Xue, X., Wang, Z., and Hou, S. (2023). NDVI-based vegetation dynamics and response to climate changes and human activities in Guizhou Province, China. Forests 14, 753. doi:10.3390/f14040753
Yang, C., Guo, W., Zhang, C., Cui, A., Li, X., Zhao, T., et al. (2022a). Characteristics and trends of hillside urbanization in China from 2007 to 2017. Habitat Int. 120, 102502. doi:10.1016/j.habitatint.2021.102502
Yang, J., and Huang, X. (2021). The 30 m annual land cover dataset and its dynamics in China from 1990 to 2019. Earth Syst. Sci. Data 13, 3907–3925. doi:10.5194/essd-13-3907-2021
Yang, S., Li, C., Lou, H., Luo, Y., Wang, P., Zhang, J., et al. (2022b). The impact of urban expansion on plant diversity change in karst regions of Southwest China. Chin. Geogr. Sci. 32, 493–505. doi:10.1007/s11769-022-1279-z
Yang, S., Li, C., Lou, H., Wang, P., Wu, X., Zhang, Y., et al. (2021). Role of the countryside landscapes for sustaining biodiversity in karst areas at a semi centennial scale. Ecol. Indic. 123, 107315. doi:10.1016/j.ecolind.2020.107315
Yao, S., Akram, M. A., Hu, W., Sun, Y., Sun, Y., Deng, Y., et al. (2021). Effects of water and energy on plant diversity along the aridity gradient across dryland in China. Plants (Basel) 10, 636. doi:10.3390/plants10040636
Zhang, J., Lou, H., Yang, S., Pan, Z., Yu, J., and Wang, Z. (2022a). Impact of river flow on vegetation change in riparian zone of middle and low reaches of Shule River. Jornal Arid Land Resour. Environ. 36, 123–129. doi:10.13448/j.cnki.jalre.2022.045
Zhang, S., Xiong, K., Qin, Y., Min, X., and Xiao, J. (2021). Evolution and determinants of ecosystem services: insights from South China karst. Ecol. Indic. 133, 108437. doi:10.1016/j.ecolind.2021.108437
Zhang, X., Liu, G., and Zheng, Z. (2022b). Construction of an ecological security pattern based on functional wetland theory: a case study in a landscape city. Front. Environ. Sci. 10, 955230. doi:10.3389/fenvs.2022.955230
Zhang, Z., Hu, B., and Hu, G. (2014). Spatial heterogeneity of soil chemical properties in a subtropical karst forest, Southwest China. Sci. World J. 2014, 473651–473659. doi:10.1155/2014/473651
Zhang, Z.-h., Hu, G., and Ni, J. (2013). Effects of topographical and edaphic factors on the distribution of plant communities in two subtropical karst forests, southwestern China. J. Mt. Sci. 10, 95–104. doi:10.1007/s11629-013-2429-7
Zhao, L., and Hou, R. (2019). Human causes of soil loss in rural karst environments: a case study of Guizhou, China. Sci. Rep. 9, 3225. doi:10.1038/s41598-018-35808-3
Zou, H., Gao, G., Yuan, C., and Yang, W. (2022). Interactions between soil water and plant community during vegetation succession in the restored grasslands on the Loess Plateau of China. Land Degrad. Dev. 34, 1582–1592. doi:10.1002/ldr.4555
Keywords: plant diversity, ecological connectivity, barrier risk, remote sensing, karst regions
Citation: Zhou B, Lou H, Yang S, Li C, Pan Z, Zhang Y, Li H, Yi Y and Gong J (2024) The barrier risk to the ecological connectivity of plant diversity in karst landscapes in Guizhou Province, China. Front. Environ. Sci. 12:1341327. doi: 10.3389/fenvs.2024.1341327
Received: 20 November 2023; Accepted: 17 May 2024;
Published: 05 June 2024.
Edited by:
Fernanda Michalski, Universidade Federal do Amapá, BrazilReviewed by:
Evelyn Elaine Gaiser, Florida International University, United StatesJuan Carlos López-Acosta, Universidad Veracruzana, Mexico
Copyright © 2024 Zhou, Lou, Yang, Li, Pan, Zhang, Li, Yi and Gong. This is an open-access article distributed under the terms of the Creative Commons Attribution License (CC BY). The use, distribution or reproduction in other forums is permitted, provided the original author(s) and the copyright owner(s) are credited and that the original publication in this journal is cited, in accordance with accepted academic practice. No use, distribution or reproduction is permitted which does not comply with these terms.
*Correspondence: Shengtian Yang, eWFuZ3NoZW5ndGlhbkBibnUuZWR1LmNu