
94% of researchers rate our articles as excellent or good
Learn more about the work of our research integrity team to safeguard the quality of each article we publish.
Find out more
ORIGINAL RESEARCH article
Front. Environ. Sci., 05 June 2024
Sec. Water and Wastewater Management
Volume 12 - 2024 | https://doi.org/10.3389/fenvs.2024.1340994
 Qin Yang1
 Jingsheng Chen2
 Yuyi Liu2,3*
 Yangguang Li2
 Haigang Zhang2Jing Zhang3
 Xiao Sun2
 Mingyang Lu2Rongqian Ma2
 Yanlin Wu2
The seven major river basins (the Yangtze River, the Yellow River, the Pearl River, the Songhua River, the Huai River, the Hai River and the Liao River) are the most important surface water resources in China, but there is a lack of quantitative analyses of water quality change trends, horizontal comparisons of governance effects, and systematic review of effective policies since the 21st century. Based on the water resources bulletin and environmental status bulletin issued by government departments, the changes in water quality, pollutant indicators and treatment effectiveness of seven major basins from 2001 to 2020 have been scientifically analyzed using mathematical and statistical methods. (1) Over the period 2001 to 2020, the overall water quality in the seven major river basins exhibited a gradual improvement. Different basins demonstrated varied growth values for Grade I-III water, reduction values for Grade IV-V, and inferior Grade V water. (2) Between 2001 and 2020, changes in sewage discharge volume and types led to adjustments in the main pollutant indicators of the seven basins. (3) The ranking of the pollution degree in the seven major basins exhibited dynamic changes but also remained relatively stable during specific periods or years. (4) Assessing the average annual growth rate of Grade I-III water and the average annual reduction rate of Grade IV-V and inferior Grade V water, the Huai River basin demonstrated the most outstanding governance effectiveness, while the Liao River basin, the Yellow River basin, and the Songhua River basin also achieved notable treatment results. (5) The improvement in water quality across the seven major river basins can be attributed to scientific planning, enhanced policies and regulations, surge in investment in water conservancy infrastructure, heightened environmental protection awareness, application of green production technology. To sum up, the research findings not only provide a scientific foundation for the governance and protection of the seven major basins but also offer a valuable reference for other developing countries to strike a balance between economic development and environmental protection.
Water, often hailed as the source of life, is an indispensable requirement for human survival, and freshwater resources play a pivotal role in this regard. Among the various sources of freshwater, rivers have the highest utilization rate. With the surge in population and societal progress, the demand for river water resources has witnessed a significant increase. However, rivers face challenges due to the discharge of substantial amounts of industrial wastewater (Suthar et al., 2010; Kanu and Achi, 2011) and domestic sewage (Ullah et al., 2013; Anh et al., 2023), so understanding the shifts in river water quality and identifying their causes is fundamental for targeted river management initiatives. Over the past 2 decades, many scholars have analyzed water quality changes in several famous river basins, such as the Thames River basin (Neal et al., 2006; Bowes et al., 2018), the Nile River basin (Wahaab and Badawy, 2004; Abdel-Satar et al., 2017), the Amazon River basin (Ríos-Villamizar et al., 2017; Nóbrega et al., 2018) and the Ganges River basin (Mishra, 2010; Meher et al., 2015).
China, endowed with an expansive territory, stands among the countries with the highest number of rivers globally. Within China’s borders, over 1,500 rivers boast a watershed area of at least 1,000 square kilometers. Notably, seven major river basins, crucial for their entire area covered by main streams and tributaries, hold paramount importance in China’s water resources (Wang, 2010). These basins, listed from north to south, include the Songhua River basin, the Liao River basin, the Hai River basin, the Yellow River basin, the Huai River basin, the Yangtze River basin, and the Pearl River basin, collectively sustaining over one billion Chinese people. While river water resources have played a crucial role in China’s economic development and social progress, safeguarding the river water environment has been a complex journey for the Chinese government and society. Since the 1980s, rapid industrialization and urbanization have led to the proliferation of factories and the expansion of cities along rivers, accompanied by a mass migration from rural areas to urban centers. Although these processes propelled China’s economic growth, they also precipitated a rapid deterioration of river water quality, reaching alarming levels by the late 20th century. For instance, in 1997, the Bulletin of China Water Resources reported that 47% of evaluated river reaches with water quality above Grade IV were polluted. Moreover, the ratio of sewage to surface runoff in significant river basins, such as the Liao, Yellow, Hai, and Huai River basins, soared to as high as 1:14-1:6 (Qian, 2001), underscoring the severity of the issue. Consequently, widespread concern emerged among the Chinese government and society regarding the continuous degradation of water quality and the frequent occurrence of water pollution incidents. Moreover, The accession of China to the World Trade Organization (WTO) in 2001 presented both opportunities and challenges for the nation. While it facilitated significant economic development prospects, it also accentuated China’s water pollution problem. According to WTO requirements, China should optimize the use of resources, protect the ecological balance and preserve the environment in accordance with the purpose of sustainable development (Peng, 2022). In response to mounting internal and external pressures, China initiated a series of ecological and environmental protection initiatives around the turn of the millennium. Notable efforts included the issuance of the National Ecological and Environmental Construction Plan in 1998, the National Program for Ecological and Environmental Protection in 2000, and the revision and adoption of The Water Law of the People’s Republic of China in 2002. Concurrently, the Chinese government implemented proactive measures to enhance river basin management, fortify water environmental protection, and counteract the decline in water quality.
Since the 21st century, has the water quality in China’s river basins, especially the seven representative river basins, improved? Scholars have adopted different research methods and evaluation indicators to conduct relevant research. The spatial and temporal distributions, causes of water quality and pollution characteristics of the Yangtze River have been studied from 2001 to 2018 (Lou et al., 2020), from 2016 to 2019 (Chen S. et al., 2020) and from 2014 to 2020 (He et al., 2021). For the Yellow River basin, different scholars chose different priorities, such as water quality change (Xu et al., 2021), pollutant index (Li et al., 2023; Zheng et al., 2023), and treatment strategy (Chen Y. P. et al., 2020). Chen et al. (2022) utilized the seasonal Kendall trend test method to assess water quality changes in the Huai River basin from 2003 to 2019, concluding that water pollution control was effective, and water quality exhibited an improving trend. Wang (2020) evaluated the water environment in the Liao River’s main stem during the summers of 2005, 2010, and 2015, noting a decline in inferior Grade V and Grade V water proportions, coupled with an increase in Grade I-IV water rates. Yu et al. (2021) conducted literature research on droughts, floods, water pollution events, and governance measures in the Hai River basin, finding substantial improvement in water quality by 2019, though challenges persist. Researches on the Songhua River basin (Lin et al., 2016; Tao et al., 2021) and the Pearl River basin (Zhang et al., 2010; Liu et al., 2018) have also been conducted in different years. The above researches show that the water quality of the seven major river basins has shown a trend of improvement in recent years.
In order to effectively strengthen the prevention of water pollution and ensure national water security, China promulgated a pivotal initiative in 2015: the Action Plan for Prevention and Control of Water Pollution. The most important target of this plan was more than 70% water quality in the seven major river basins meeting or surpassing Grade III water quality standards by 2020. Consequently, akin to the significance of 2001, 2020 emerged as a crucial year for water environmental governance in China. However, an assessment of the current research landscape, both domestically and internationally, reveals deficiencies in several aspects: the absence of scholarly analyses regarding the attainment of 2020 goals in the seven river basins, the dearth of water quality change trends of the seven major river basins from 2001 to 2020, the lack of quantitative analyses and horizontal comparisons of governance effects across river basins, and the absence of a systematic review of effective policies adopted over the past 2 decades to mitigate river pollution intensity.
To bridge these lacunae, this article undertakes mathematical and statistical analysis based on water quality information and data released by governmental departments from 2001 to 2020. Specifically, it systematically analyzes changes in water quality levels and pollutant indicators in the seven major river basins using a single-factor evaluation method. Moreover, it compares pollution degrees and trends across these basins, establishes a water quality improvement index, and assesses treatment effectiveness. Additionally, it deliberates on the reasons underlying changes in water quality across the seven basins. In a word, the research endeavors to furnish a scientific foundation for the future governance and protection of China’s major river basins and to offer insights for other developing nations seeking to balance economic development and environmental management.
The research period for water quality data spans from 2001 to 2020.
The research focuses on the seven most significant basins in China, including the Yangtze River basin, the Yellow River basin, the Pearl River basin, the Songhua River basin, the Huai River basin, the Hai River basin, and the Liao River basin.
To gauge the status of river water quality, the Chinese General Environmental Monitoring Station oversees the monitoring of major river basins in China. By 2020, the station had established a total of 1,937 monitoring sections in surface water basins, analyzing the percentage of each water quality type, main pollutants, and key pollution indicators. These data are annually published by the competent government. The water quality data for the seven major river basins analyzed were extracted from the Bulletin on the State of the Environment in China from 2001 to 2016 (State Environmental Protection Administration, 2002b; State Environmental Protection Administration, 2003; State Environmental Protection Administration, 2004; State Environmental Protection Administration, 2005; State Environmental Protection Administration, 2006; State Environmental Protection Administration, 2007; Ministry of Environmental Protection of China, 2008; Ministry of Environmental Protection of China, 2009; Ministry of Environmental Protection of China, 2010; Ministry of Environmental Protection of China, 2011a; Ministry of Environmental Protection of China, 2012; Ministry of Environmental Protection of China, 2013; Ministry of Environmental Protection of China, 2014; Ministry of Environmental Protection of China, 2015; Ministry of Environmental Protection of China, 2016; Ministry of Environmental Protection of China, 2017), and the Bulletin on the State of the Ecological and Environmental in China from 2017 to 2020 (State Environmental Protection Administration, 2002b; Ministry of Ecology and Environment of China, 2018; Ministry of Ecology and Environment of China, 2019; Ministry of Ecology and Environment of China, 2020; Ministry of Ecology and Environment of China, 2021).
According to the “Surface Water Environmental Quality Standards (GB3838-2002)" (State Environmental Protection Administration, 2002a), surface water quality evaluation indicators include pH, dissolved oxygen, chemical oxygen demand (COD), chemical oxygen demand determined by potassium permanganate method (CODMn), biochemical oxygen demand (BOD), chemical oxygen demand within five days (BOD5), ammonia nitrogen (NH3-N), total phosphorus (TP), total nitrogen (TN), fluoride, volatile phenols, among others. Water quality levels (Water Grades) are classified into six categories: I, II, III, IV, V, and inferior V, according to the environmental functions and protection objectives of river waters. While Grade I-III water is treatable and directly potable, Grade IV, V, and inferior V water quality cannot be used as a source of drinking water. The specific meanings of water grades are as follows: (1) Grade I water, typically originating from national nature reserves, can be used for drinking water after simple purification. (2) Grade II water is applicable to primary protected zones of centralized domestic drinking water sources, rare aquatic habitats, fish and shrimp spawning grounds, and young fish baiting sites, and can be used for drinking water after conventional purification treatment. (3) Grade III water applies to secondary protection zones of centralized domestic drinking water sources, general fish protection zones, and swimming areas. (4) Grade IV water is suitable only for industrial use and other recreational purposes that do not involve skin contact. (5) Grade V water is mainly applicable to agricultural water areas and general landscape requirements. (6) Inferior Grade V water serves no practical function, aside from local climate regulation. In order to ensure the uniformity of the water quality analysis of the seven rivers, according to the “Methods for Evaluating the Environmental Quality of Surface Water (Trial)" (Ministry of Environmental Protection of China, 2011b), the assessment of water quality categories for river cross-sections employs the single-factor evaluation method. It is determined according to the index of the highest category in the evaluation of the section during the evaluation period.
In accordance with the “Methods for Evaluating the Environmental Quality of Surface Water (Trial)", the method of proportion of cross-section water quality categories was employed for all the basins in this study. The water quality condition of the evaluation basin is assessed based on the percentage of the number of sections in each water quality category in the basin to the total number of all evaluated sections in the basin. According to the utilization value of surface water, water quality is classified into three groups: Grade I-III, Grade IV-V, and inferior Grade V. The relationship between the proportion of water quality categories in the basin and the qualitative evaluation of water quality is outlined in Table 1.
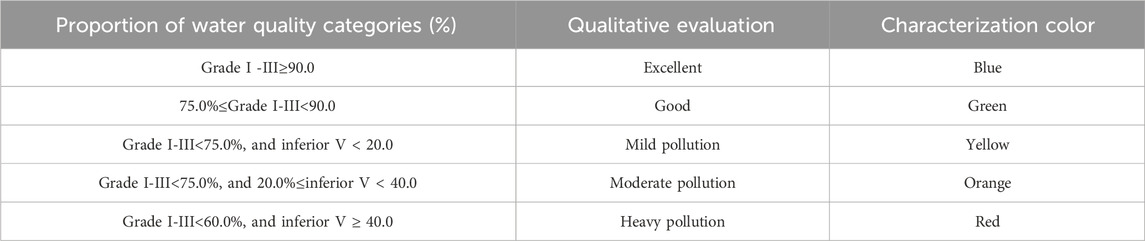
Table 1. Relationship between the proportion of water quality categories and qualitative evaluation.
Mathematical and statistical methods were employed to summarize the overall water quality of surface water and the seven major river basins, encompassing the annual percentages of various water quality types and major pollutant indicators. Simultaneously, linear fitting method in Origin 2018 was utilized to analyze the inter-annual trend of water quality indicators after plotting the proportions of Grades I-III, IV-V, and inferior V as a graph.
The results of surface water monitoring sections in the main river basins of China, as released by the National Environmental Monitoring Center of China, provide an overview of water quality in the country from 2001 to 2020. The proportions of Grades I-III, IV-V, and inferior V are depicted in Figure 1. From 2001 to 2020, the proportion of Grade I-III water exhibited an approximately linear increasing trend (fitting function is y = 0.0265x-52.710, y is proportion,%; x is year; correlation coefficient R2 = 0.9238). The proportion of Grade IV-V showed a decreasing trend, albeit at a slower rate. The proportion of inferior Grade V water displayed an approximate linear decreasing trend over time (fitting function is y = −0.0197x+39.771, the correlation coefficient R2 = 0.92164). In 2001, the proportion of Grade I-III, IV-V, and inferior V water was 29.5%, 26.5% and 44% respectively. By 2020, these proportions had shifted to 83.4%, 16.0%, and 0.6%. The observed trend over the past 20 years indicates a gradual improvement in the overall water quality of surface water.
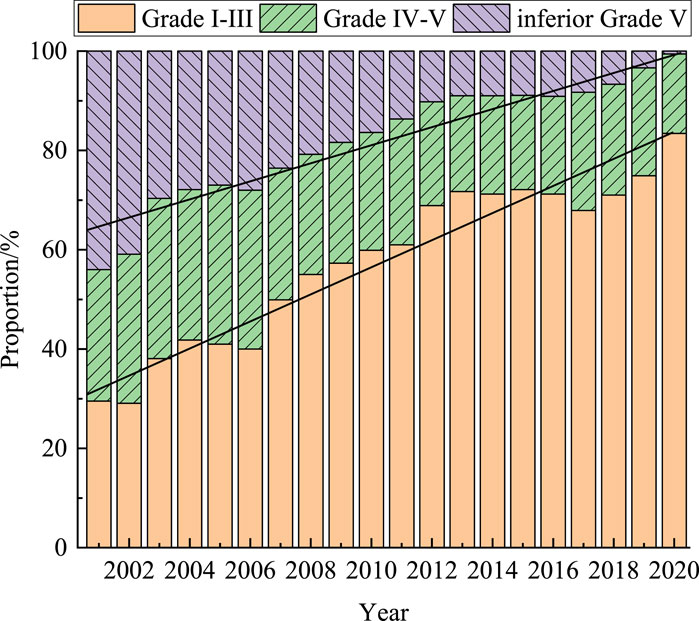
Figure 1. Interannual variations of water quality in China from 2001 to 2020.
In 2001, the monitoring results from 142 sections in the Yangtze River basin revealed that Grades I, II, III, IV, V, and inferior V accounted for 4.9%, 58.4%, 13.4%, 8.5%, 8.5%, and 6.3%, respectively, as illustrated in Figure 2A. Grade II water dominated, representing more than half of the water quality composition. By 2020, the number of monitoring sections increased to 510, and the results showed that Grades I, II, III, IV, V, and inferior V accounted for 8.2%, 67.8%, 20.6%, 2.9%, 0.4%, and 0.0%, respectively, as shown in Figure 2B. Grade II water continued to dominate the water quality composition.
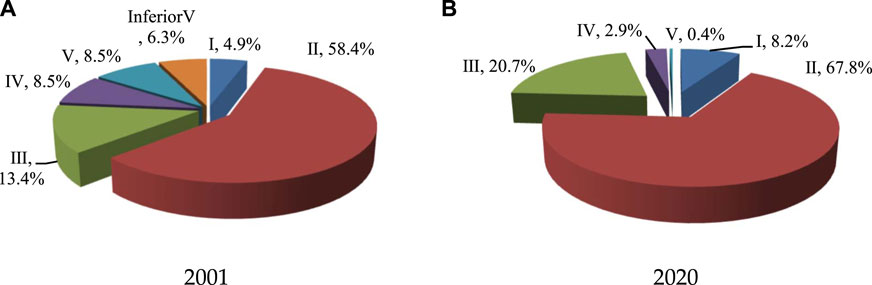
Figure 2. Proportion of water quality categories (Grades I, II, III, IV, V, and inferior V) in the Yangtze River basin in 2001 and 2020.
To visually depict the interannual trend of water quality in the Yangtze River basin, Figure 3 plots the proportions of Grade I-III, IV-V, and inferior V water from 2001 to 2020. The figure illustrates an overall increasing trend in Grade I-III water quality, while Grade IV-V and inferior V water quality exhibit a decreasing trend. According to the State of the Environment Bulletin data, in 2001, Grade I-III, IV-V, and inferior V water constituted 76.7%, 17.0%, and 6.3%, respectively. However, by 2020, these proportions shifted to 96.7%, 3.3%, and 0.0%, respectively. Notably, the proportion of inferior Grade V water reached zero for the first time. Over the 20-year period, Grade I-III water increased by 20.0%, while IV-V and inferior V decreased by 14.7% and 6.3%, respectively.
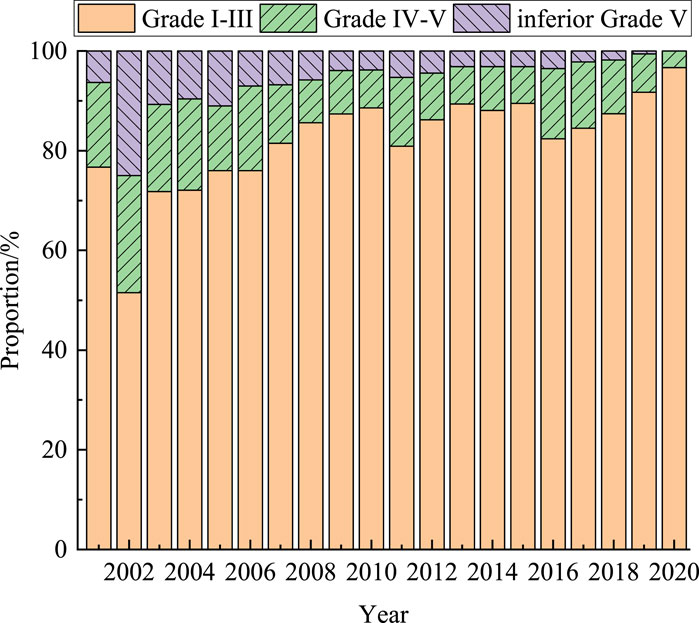
Figure 3. Interannual variations of water quality of the Yangtze River basin from 2001 to 2020.
Assessing the pollution level of the Yangtze River Basin, it experienced mild pollution in 2001, 2003, and 2004, moderate pollution in 2002, good water quality from 2005 to 2018, and excellent water quality in 2019 and 2020. In summary, since the beginning of the 21st century, the water quality of the Yangtze River has consistently improved, contributing to an enhanced water environment. It is noteworthy that in 2002, the water quality of the Yangtze River basin exhibited a distinctive pattern. The proportion of Grade IV-V and inferior V water was significantly higher than in other years, particularly with inferior V accounting for more than 25%. Upon investigation, the issue was primarily concentrated in four aspects. Firstly, the inability to effectively curb pollution in the near-shore waters of the mainstream was a notable concern. Secondly, the serious pollution from tributaries resulted in the deterioration of water quality in the mainstream. Thirdly, the eutrophication of lakes in this basin had damaged water ecosystems to a certain extent. Lastly, the entry of floating debris, plastics, and other forms of “white pollution” into the river during flooding and rainfall exacerbated the problem.
From 2001 to 2020, the main pollution indicators in the Yangtze River basin changed significantly, as shown in Table 2. The main pollutant indicators were Petroleum, NH3-N, CODMn, and BOD5 in 2001–2010, and were TP, NH3-N, and COD in 2011–2020. In the second decade, Petroleum and BOD5 are no longer on the list of major pollutants, with NH3-N emerging as the predominant pollution indicator.
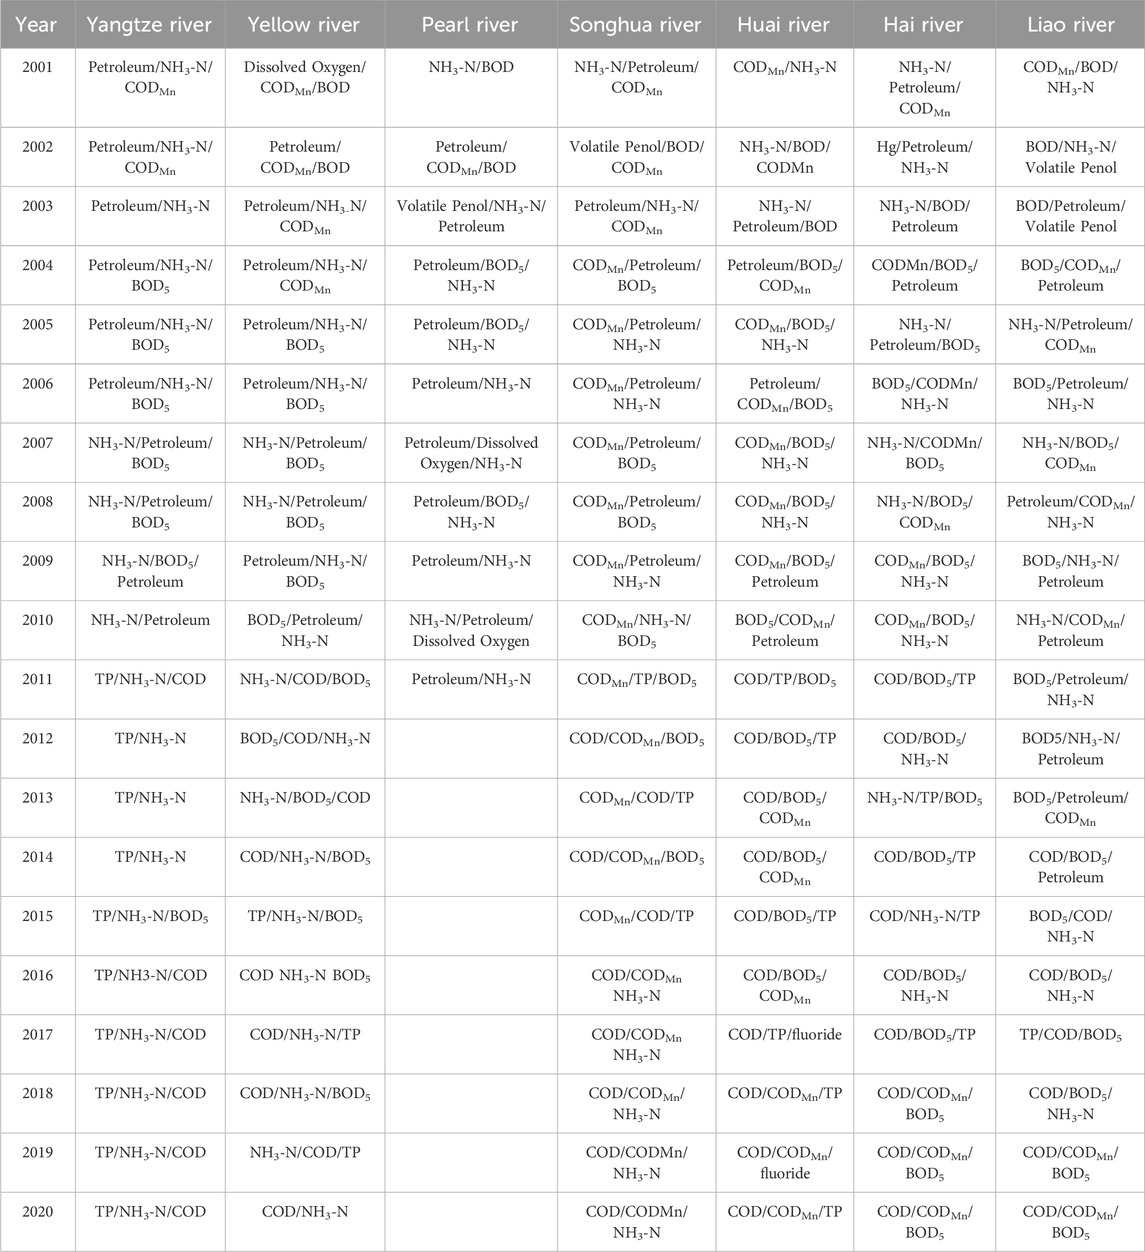
Table 2. Indicators of major pollutants in seven major river basins from 2001 to 2020.
From the data of the Environment Bulletin, it can be calculated by the monitoring results of 175 sections in the Yellow River basin that Grade I, II, III, IV, V and inferior V was 2.8%,3.6%,2.9%,25.1%,6.9%,56.0% respectively in 2001, as shown in Figure 4A. Inferior Grade V water is more than half of the water quality. It is clear that the Yellow River basin is very seriously polluted. In 2020, 137 monitoring section results showed that Grade I, II, III, IV, V and inferior V accounted for 6.6%,56.2%,21.9%,12.4%,2.9% and 0.0%, as shown in Figure 4B. The variety was dominated by Grade II water, and inferior Grade V water was reduced to zero for the first time. In 2001, Grades I-III, IV-V, and inferior V water accounted for 12.0%, 32.0%, and 56.0%, respectively, while in 2020, these proportions shifted to 84.7%, 15.3%, and 0.0%. Over 20 years, Grade I-III water increased by 72.7%, while IV-V and inferior V decreased by 16.7% and 56.0%.
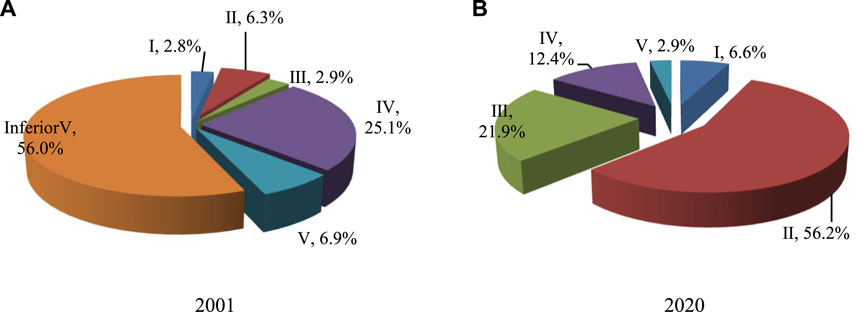
Figure 4. Proportion of water quality categories (Grades I, II, III, IV, V, and inferior V) in the Yellow River basin in 2001 and 2020.
The inter-annual changes in the proportion of Grades I-III, IV-V, and inferior V water in the Yellow River basin from 2001 to 2020 are illustrated in Figure 5. The figure reveals a significant increase in Grade I-III water between 2001 and 2008, peaking at 68.2% in 2008, followed by stability from 2008 to 2011, a decline between 2012 and 2017, and a rapid increase after 2017. The overall water quality of Grades I-III exhibited an increasing trend. Grade IV-V water showed annual fluctuations without a clear pattern, exceeding 25% between 2001 and 2006, dropping to less than 14.0% between 2007 and 2011, and rising again to over 20% between 2012 and 2018. However, inferior Grade V water displayed a consistent downward trend, experiencing a rapid decline in 2001–2005, a gradual decrease in 2006–2019, and ultimately reaching zero in 2020. The water quality of the Yellow River basin transformed from heavy pollution to mild pollution during 2001–2010 and then transitioned from light pollution to good during 2011–2020. Overall, there has been a significant improvement in water quality, indicating outstanding results in China’s management of the Yellow River basin.
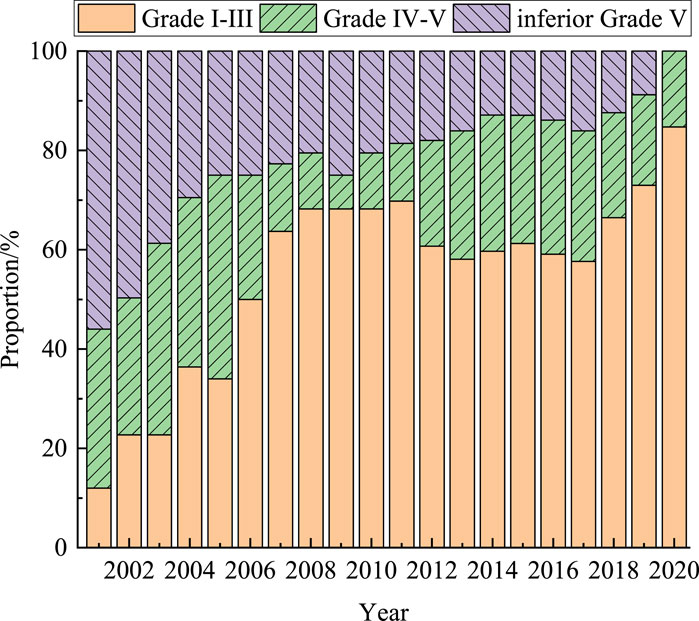
Figure 5. Interannual variations of water quality of the Yellow River basin in China from 2001 to 2020.
Table 2 shows that the main pollution indicators in the Yellow River basin are Petroleum, NH3-N, CODMn and BOD, and the main causes are physical sediment pollution, industrial and agricultural wastewater pollution, and toxic chemical pollution. Since 2003, the ammonia nitrogen content has consistently exceeded the standard for 18 consecutive years, attributed to various factors. Firstly, the Yellow River contains a substantial amount of sediment with a strong adsorption capacity for ammonia nitrogen and organic nitrogen. Secondly, the presence of numerous industrial enterprises in the Yellow River basin contributes to the discharge of nitrogen-containing wastewater, resulting in elevated concentrations of organic and ammonia nitrogen. The degradation of organic nitrogen further increases the concentration of ammonia nitrogen in the water. Finally, the presence of toxic substances and oxygen-depleting organic matter leads to the retention of ammonia nitrogen in the water (Zhang et al., 2007).
In 2001, based on data from 28 water quality monitoring sections in the Pearl River basin, Grades I, II, III, IV, V, and inferior V were illustrated in Figure 6A. Notably, Grade II water comprised more than 60%, indicating an overall relatively good water quality. However, inferior Grade V constituted more than 7.0%, signifying mild pollution in the local watersheds of the Pearl River basin. The statistics reveal Grades I-III, IV-V, and inferior V water constituted 78.6%, 14.3%, and 7.1%, respectively. In 2020, Grade I, II, III, IV, V, and inferior V were depicted in Figure 6B. By 2020, the proportions of Grades I-III, IV-V, and inferior V water shifted to 92.7%, 7.3%, and 0.0%, respectively. Over 20 years, Grade I-III water increased by 14.1%, while Grade IV-V and inferior V water decreased by 7.0% and 7.1%, respectively.
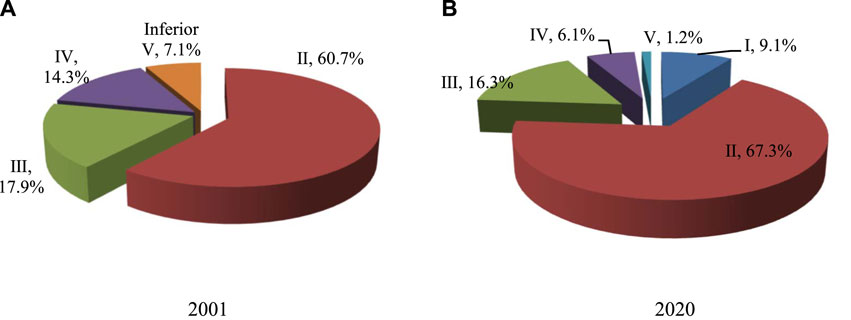
Figure 6. Proportion of water quality categories (Grades I, II, III, IV, V, and inferior V) in the Pearl River basin in 2001 and 2020.
Figure 7 illustrates the inter-annual changes in the proportion of Grades I-III, IV-V, and inferior V water in the Pearl River basin from 2001 to 2020. The variations in the condition of Grade I-III water were as follows: minimal change between 2001 and 2011 with an average value of about 81.0%, a higher proportion of water quality exceeding 90.0% from 2012 to 2015, and a parabolic trend with an upward opening between 2016 and 2020. The overall annual change in Grade IV-V water exhibited a trend of decreasing first and then increasing, reaching a very low value in 2013, which is 0. The change in inferior Grade V water remained relatively stable, maintained between 6% and 8% in 2001–2005 and between 3% and 5% in 2006–2019. In 2020, the water quality of inferior Grade V was reduced to 0 for the first time, marking a breakthrough in the history of governance in the Pearl River basin. Overall, the water environment of the Pearl River basin from 2001 to 2020 has seen significant improvement, transitioning from good to excellent, indicating successful outcomes in China’s management of the Pearl River basin.
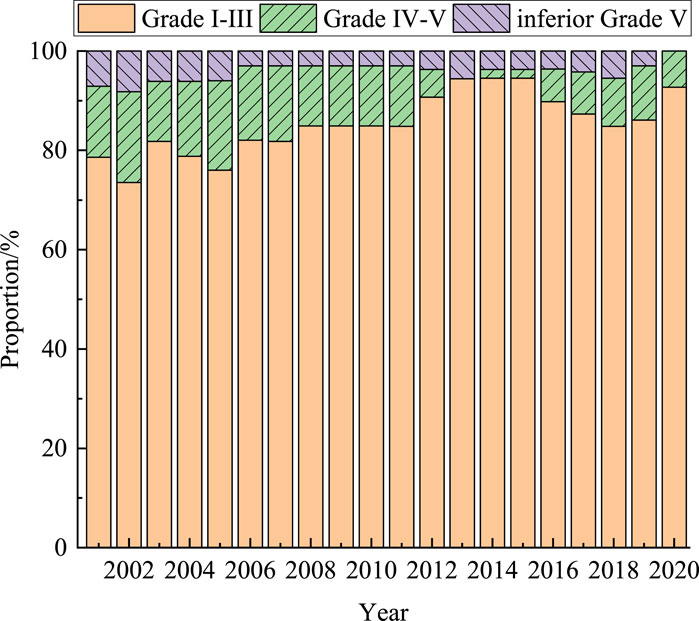
Figure 7. Interannual variations of water quality of the Pearl River basin from 2001 to 2020.
Table 2 illustrates that the primary pollution indicators in the Pearl River basin from 2001 to 2011 were petroleum and NH3-N, primarily attributed to industrial and agricultural wastewater pollution. Since 2012, the Pearl River basin has consistently maintained an excellent water quality status, being the earliest among the seven major basins to achieve this, and the main pollution indicators for the Pearl River are no longer featured in the Bulletin on the state of the environment in China.
According to data depicted in Figure 8A, Grades III and IV water collectively exceeded 60%, with inferior V water surpassing 16.0%, indicating significant pollution in the local water quality of the Songhua River basin. In 2020, as shown in Figure 8B, Grade III water dominated the categories, exceeding 60%. Statistical results indicate that the proportions of Grade I-III, IV-V, and inferior V water were 31.8%, 51.5%, and 16.7% in 2001, and 82.4%, 17.6%, and 0.0% in 2020, respectively. Over 20 years, Grade I-III water increased by 50.6%, while Grade IV-V and inferior V water decreased by 33.9% and 16.7%, respectively.
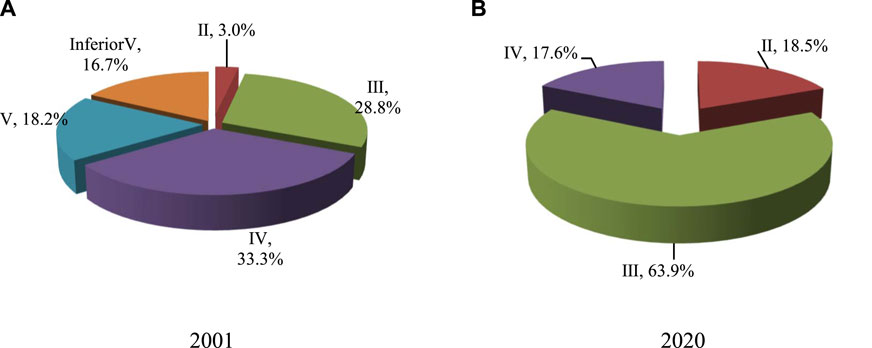
Figure 8. Proportion of water quality categories (Grades I, II, III, IV, V, and inferior V) in the Songhua River basin in 2001 and 2020.
The temporal fluctuations in the proportion of Grade I-III, IV-V, and inferior V water in the Songhua River basin from 2001 to 2020 are depicted in Figure 9. Notably, Grade I-III water experienced a sharp decline between 2001 and 2003, reaching a minimal value in 2003, and subsequently displayed an increasing trend, surpassing 75% in 2020. The annual variation of Grade IV-V water exhibited an initial increase followed by a decline, peaking in 2003 at 74.4%. Inferior Grade V water demonstrated a decreasing trend over the years, except for a relatively stable period during 2012–2017, maintaining around 5%–6%. In a noteworthy achievement, Inferior Grade V water reached zero for the first time in 2020, marking a significant milestone in the history of Songhua River basin governance. Overall, the water quality of the Songhua River basin displayed mild pollution from 2001 to 2019 and transitioned to good quality in 2020. These patterns underscore the continuous improvement in the water quality of the Songhua River basin over the past 2 decades, with substantial protection afforded to the water environment.
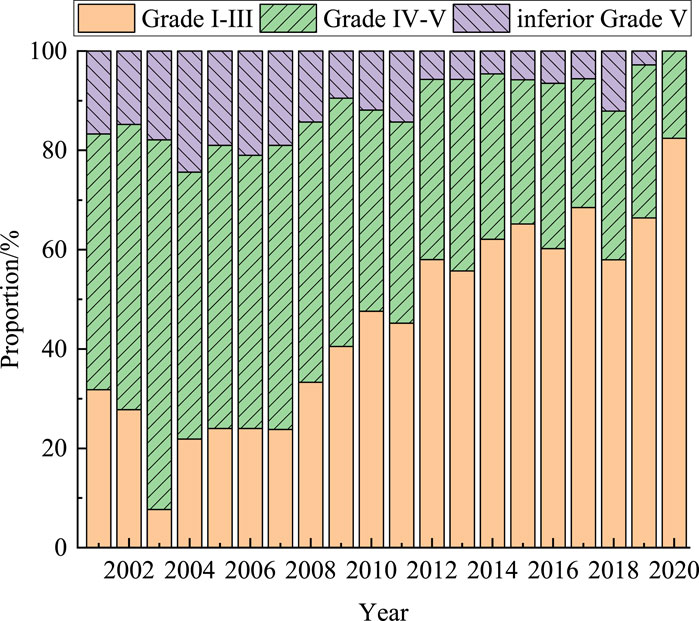
Figure 9. Interannual variations of water quality of the Songhua River basin from 2001 to 2020.
It is worth noting that in 2003, 2016 and 2018, the distribution of water types in the Songhua River basin exhibited significant deviations compared to the preceding year. For example, the proportion of Grade I-III water decreased rather than increased. Especially in 2003, the Songhua River water was the worst, Grade I-III water accounted for only 7.7% but Grade IV-V water accounted for 74.4%. This underscores the susceptibility of the Songhua River’s water quality to various factors, indicating a limited ability to resist interference and a propensity for rebound.
Table 2 shows that the main pollution indicators in the Songhua River basin from 2001 to 2010 are CODMn, petroleum, and BOD5, and from 2011 to 2020 the main pollution indicators are COD, NH3-N, and CODMn. Investigations reveal that the perennial exceedance of the permanganate index is attributed to several factors: (1) The presence of numerous industrial bases discharging substantial volumes of industrial wastewater into the Songhua River basin. (2) The prolonged ice closure period in the Songhua River results in a low sewage treatment rate and inadequate sewage treatment facilities. (3) Periodic occurrences of large-scale industrial water pollution incidents further contribute to the challenges in the Songhua River basin.
In 2001, as depicted in Figure 10A, the prevalence of over half inferior Grade V water indicated severe pollution in the Huai River basin. By 2020, Grade III water was the most predominant water quality, as shown in Figure 10B. Particularly noteworthy is the absence of inferior Grade V water, marking the first occurrence of such a situation in the Huai River basin in recent decades. According to statistical data, Grade I-III, IV-V, and inferior V water were 22.1%, 24.7%, and 53.2% in 2001, and transformed to 78.9%, 21.1%, and 0.0% in 2020. Over the span of 20 years, Grade I-III water increased by 56.8%, while Grade IV-V and inferior V water witnessed reductions of 3.6% and 53.2%, respectively.
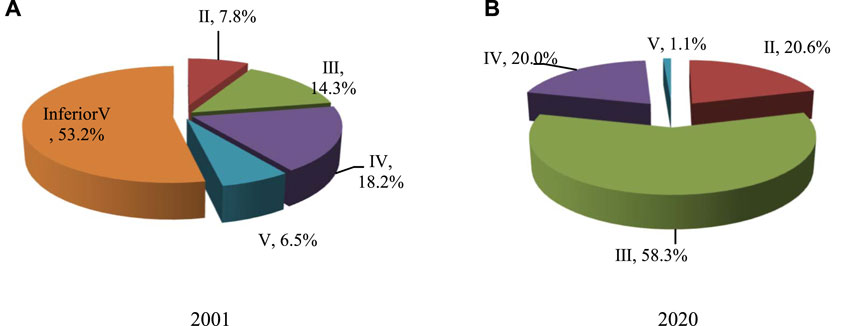
Figure 10. Proportion of water quality categories (Grades I, II, III, IV, V, and inferior V) in the Huai River basin in 2001 and 2020.
The interannual changes in the proportion of Grade I-III, IV-V and inferior V water of the Huai River basin from 2001 to 2020 are shown in Figure 11. The proportion of Grade I-III water is approximately linearly increasing (the correlation index R2 is 0.88532), the proportion of inferior Grade V water is approximately linearly decreasing (R2 is 0.93269), and the proportion of Grade IV-V is relatively stable. The Huai River water was heavily polluted from 2001 to 2002, moderately polluted from 2003 to 2008, mildly polluted from 2009 to 2019 and was good in 2020. Over the past 2 decades, the pollution level of Huai River water has consistently diminished, signifying significant progress in China’s governance of the Huai River Basin.
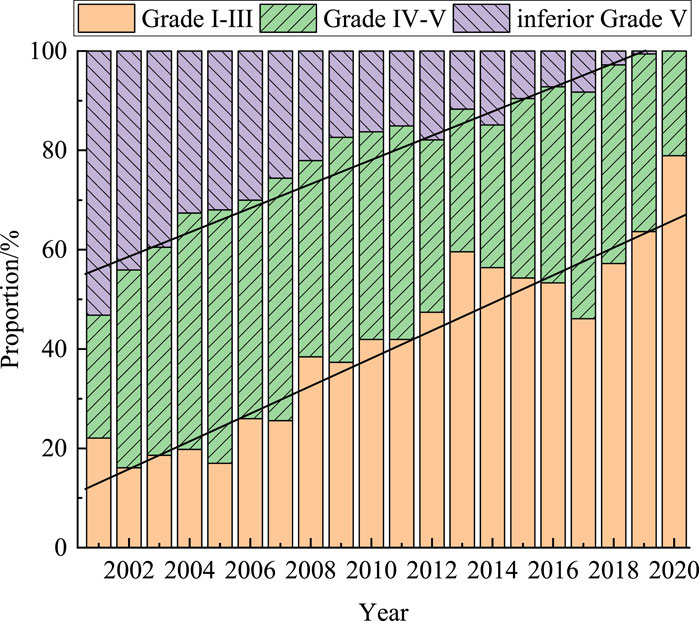
Figure 11. Interannual variations of water quality of the Huai River basin from 2001 to 2020.
The main pollutants in the Huai River Basin in the past 20 years are NH3-N, CODMn, BOD5, and total phosphorus (TP), as shown in Table 2. According to the survey, the concentrations of NH3-N, CODMn, and BOD5 have decreased significantly, but the concentration of TP has not decreased significantly. The initial severe pollution of the Huai River basin can be attributed to several factors: (1) high population density resulting in a relative scarcity of water resources; (2) a focus on economic development by local governments, leading to substantial discharges of domestic and industrial wastewater; (3) extensive arable land, contributing to surface source pollution such as fertilizers and pesticides (Zeng et al., 2021). Since the early 21st century, various measures, including adjusting industrial structures, accelerating pollution source treatment, implementing centralized sewage treatment, and enhancing water function zone management, have led to a significant decrease in riverine discharges. Consequently, river water quality has markedly improved, showcasing remarkable achievements in the Huai River basin’s water pollution and resource protection efforts.
Utilizing data from 167 water quality monitoring sections in 2001, the proportions of Grade I, II, III, IV, V, and inferior V water in the Hai River basin were showed in Figure 12A. The proportion of inferior Grade V water exceeded 65.0%, indicating severe pollution and significant impact on water resource utilization. In 2020, among 161 monitoring sections, Grade II, III, and IV water collectively exceeded 1/4 of the total (Figure 12B). Statistical analysis revealed that water quality proportions of Grades I-III, IV-V, and inferior V were 14.4%, 18.6%, 67.0% in 2001, and 64.0%, 35.4%, 0.6% in 2020, respectively. Over 2 decades, Grades I-III and Grades IV-V increased by 49.6% and 16.8%, while inferior Grade V decreased by 66.4%.
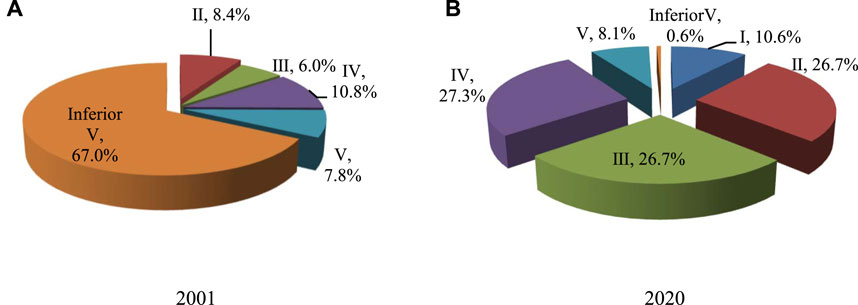
Figure 12. Proportion of water quality categories (Grades I, II, III, IV, V, and inferior V) in the Hai River basin in 2001 and 2020.
The inter-annual changes in the proportion of Grade I-III, IV-V and inferior V water of the Hai River basin from 2001 to 2020 are shown in Figure 13. The proportion of Grade I-III water increased approximately linearly over time (the correlation index R2 was 0.89666), whereas the proportion of inferior Grade V water showed a decreasing trend without forming a significant mathematical relationship. There was no discernible pattern in the changes in Grade IV-V water. Regarding pollution levels, the Hai River basin experienced heavy pollution in 2001–2010 and 2016, moderate pollution in 2011–2015 and 2017-2018, and light pollution in 2019–2020. This indicates a substantial improvement in water pollution levels over the past 20 years, underscoring China’s outstanding achievements in managing the Hai River basin. However, the susceptibility of Hai River basin water quality to basin environment and human activities has led to occasional rebounds in pollution levels in certain years.
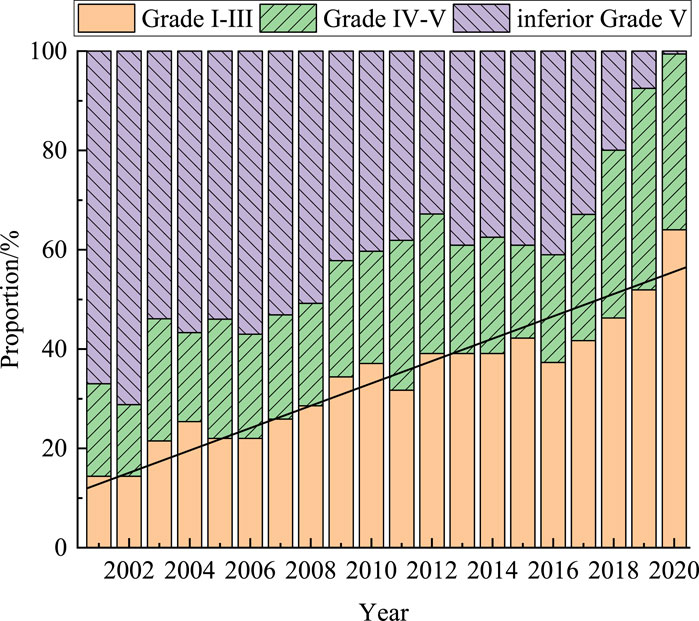
Figure 13. Interannual variations of water quality of the Hai River basin from 2001 to 2020.
The Hai River basin stands out as the most polluted among the seven major river basins. Its main pollutants are BOD5, NH3-N, COD and CODMn, with BOD5 occurring in 14 years, NH3-N in 13 years, CODMn in 9 years and COD in 9 years. The primary factors contributing to Hai River Basin pollution include a limited water volume with poor self-purification capabilities, large discharges of untreated industrial wastewater and domestic sewage, and recurrent industrial water pollution incidents (Zhu et al., 2022). Substantial investments in Hai River basin treatment, coupled with increased sewage treatment rates, are expected to further improve water quality. In the coming years, the goal is to shed the label of “mild pollution” and attain a status of good water quality.
Inferior Grade V water quality comprised nearly 60.0% in 2001 (Figure 14A), indicating heavy pollution in the Liao River basin. However, in 2020, Grade II water dominated with surpassing 40.0% and inferior V water magically dropped to zero (Figure 14B). Grade I-III, IV-V, and inferior V water proportions were 8.3%, 32.0%, 59.7% in 2001, and 70.9%, 29.1%, 0.0% in 2020, respectively. Over 2 decades, Grade I water increased by 62.6%, while Grade IV-V and inferior V decreased by 2.9% and 59.7%, respectively.
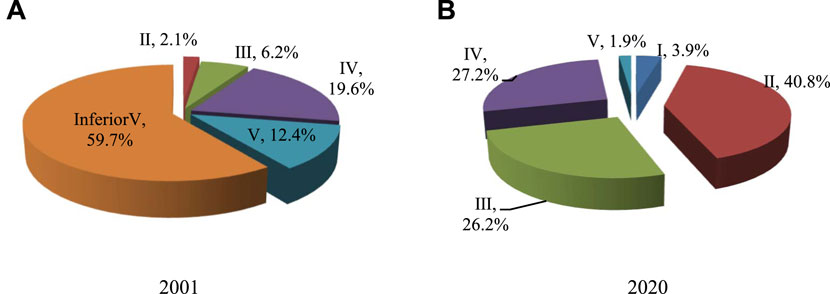
Figure 14. Proportion of water quality categories (Grades I, II, III, IV, V, and inferior V) in the Liao River basin in 2001 and 2020.
The temporal variations in the proportion of Grade I-III, IV-V, and inferior V water in the Liao River basin from 2001 to 2020 are illustrated in Figure 15. The proportion of Grade I-III water exhibits an upward trend, roughly divided into three phases: a rapid rise from 2001 to 2007, a relatively steady increase from 2008 to 2015, and a sharp ascent from 2016 to 2020. Grade IV-V water proportions follow no discernible pattern of change. The evolution of the inferior Grade V water proportion also unfolds in three stages: a rapid decrease from 2001 to 2013, a rebound phenomenon from 2014 to 2018, and a substantial decline in 2019–2020. Notably, the inferior Grade V water reached zero for the first time in 2020. Regarding pollution levels, the water quality of the Liao River Basin was heavily polluted in 2001–2003 and 2005-2007, moderately polluted in 2008–2010 and 2004, and 2018, and mildly polluted in 2011–2017 and 2019-2020. The evident improvement in water pollution levels over the past 2 decades indicates successful water management in the Liao River, though occasional rebounds in pollution levels suggest that strict control measures are still necessary.
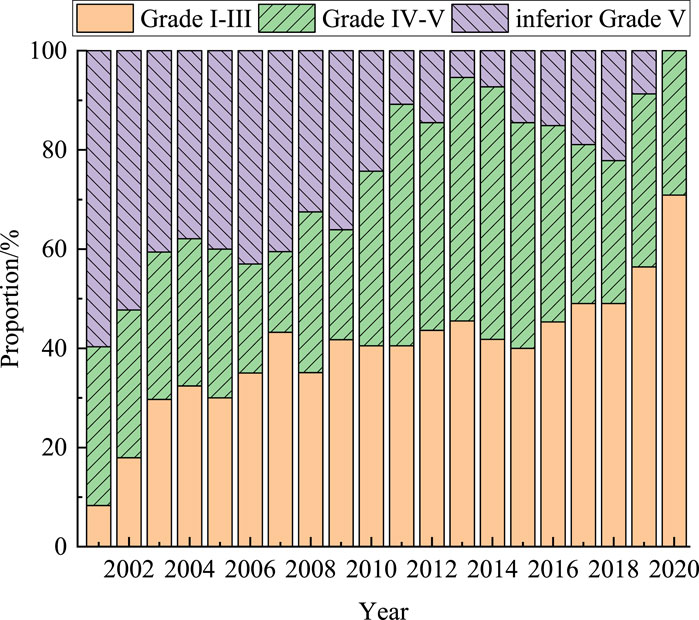
Figure 15. Interannual variations of water quality of the Liao River basin from 2001 to 2020.
As shown in Table 2, the main pollutants in the Liao River basin in 20 years are Petroleum, BOD5, CODMn, BOD and NH3-N. Pollution sources mainly come from oxygen-consuming organic pollutants in municipal domestic sewage and industrial wastewater, pollutants of eutrophication factors formed by paper mills, petrochemical factories, metallurgical plants, toxic organic pollutants formed by the production wastewater of steel mills, etc., (Fu et al. ,2012). The main reasons for these pollutants in the Liao River basin are (1) the low utilization efficiency and low sewage treatment rate; (2)the insufficient regulatory capacity to effectively circumvent excessive discharge; (3) in addition, the Liao River basin is a water-scarce river in a cold region with insufficient ecological flow (Yuan et al., 2020).
The above research results show that the overall water quality of the seven major basins have witnessed gradual improvement over the past 2 decades. Of particular concern is that all the seven major basins have been realized targets of the Action Plan for Prevention and Control of Water Pollution (the proportion of Grade I-III water >70%) by 2020. The following part focuses on the comparison of pollution degree and treatment effectiveness of each basin, and summarizes the reasons for improvement.
The proportion of Grade I-III, IV-V and inferior V water quality in the seven major basins in each year is summarized and plotted in Figure 16. Based on the determination principles outlined in Table 1 and the analytical findings from Figure 16, the qualitative assessment of the seven major basins in each year can be inferred. For instance: (1) in 2001, the Hai River, Liao River, Huai River and Yellow River basin were heavily polluted, the Songhua River basin was mildly polluted, and the Yangtze River and Pearl River basin were of good water quality. (2) In 2010, the Hai River basin was heavily polluted, the Liao River and Yellow River basin were moderately polluted, the Huai River and Songhua River basin were mildly polluted, and the Yangtze River and Pearl River basin were of good water quality. (3) In 2020, the Hai River and Liao River basins were mildly polluted, the Yellow River, Huai River and Songhua River basins were of good water quality, and water quality was excellent in the Yangtze River and Pearl River basin.
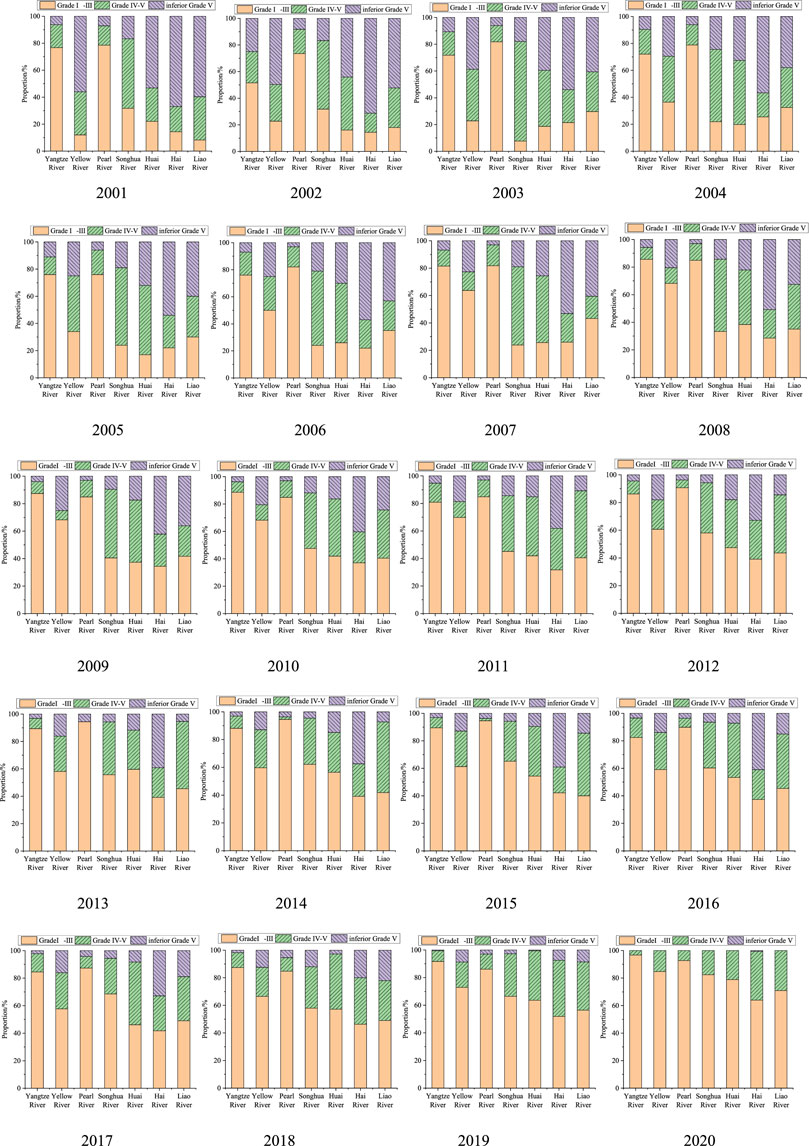
Figure 16. Comparison of water quality in the seven major river basins, 2001-2020.
In accordance with the analytical findings in the figures, the pollution levels of the seven major river basins can be accurately compared horizontally each year. The sorting principles of pollution degree are as follows.
(1) For moderate pollution and heavy pollution basin. The ranking is determined based on the proportion of inferior Grade V, with a higher pollution degree attributed to basins exhibiting a larger proportion of inferior Grade V.
(2) For mild pollution, good and excellent basins. The ranking is established considering the sum of the proportion of Grade IV-V and inferior V. A higher pollution degree is assigned to basins with a larger sum of the proportion of Grade IV-V and inferior V.
Applying these principles, the pollution degree rankings for the seven basins are presented in Table 3, yielding the following observations.
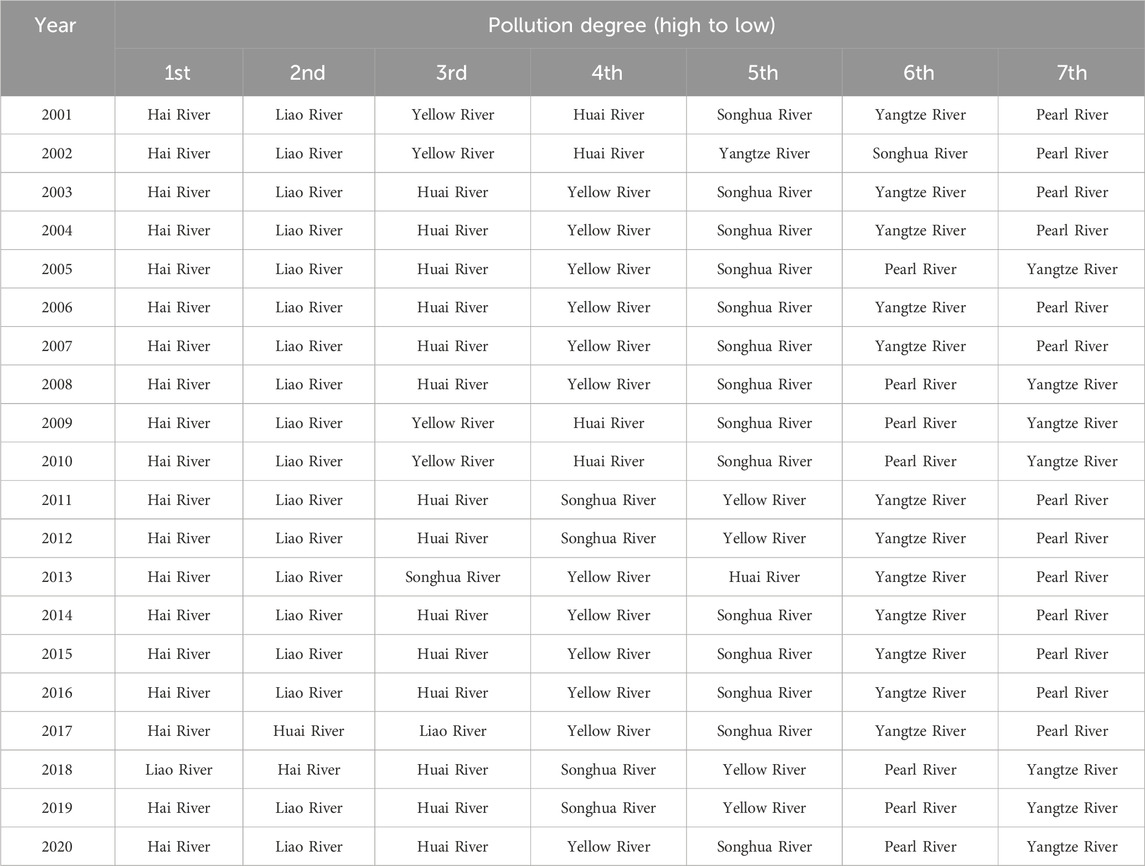
Table 3. Pollution degree in seven major river basins, 2001-2020.
(1) Dynamic changes in pollution degree rankings. The pollution degree rankings of the seven basins changed dynamically over the 20 years. For instance, the rankings in 2001, 2011, and 2020 differed. In 2001, the order from heavy to light was the Hai River, Liao River, Yellow River, Huai River, Songhua River, Yangtze River, and Pearl River basins. In 2011, the order was the Hai River, Liao River, Huai River, Songhua River, Yellow River, Yangtze River, and Pearl River basins. By 2020, the order became the Hai River, Liao River, Huai River, Yellow River, Songhua River, Yangtze River, and Pearl River basins. The rankings of the seven major basins varied between these 3 years.
(2) Periods of relative stability in rankings. Despite the dynamic changes, certain periods or years exhibited relative stability. For instance, in 2003, 2004, 2006, 2007, 2014, 2015, and 2016, the ranking of the seven major basins was consistently: the Hai River, Liao River, Huai River, Yellow River, Songhua River, Yangtze River, and Pearl River basins.
(3) Impact of pollution history on rankings. The rankings of seriously polluted and less polluted river basins remained relatively stable, influenced by their pollution history. The Hai River basin consistently ranked first in 19 years, and the Liao River basin secured the second position in 18 years. This suggests that, despite varying degrees of treatment for seriously polluted rivers, achieving a fundamental shift in a short period is challenging. The Yangtze River and Pearl River basins consistently held the positions of the two least polluted rivers, with the Yangtze River basin ranking sixth 12 times and seventh 7 times in 20 years, while the Pearl River basin ranked sixth 7 times and seventh 13 times.
(4) Unstable rankings for basins with medium pollution levels. Basins with medium pollution levels (ranked third, fourth, and fifth) were consistently occupied by the Huai River, Yellow River, and Songhua River basins over an extended period. However, the rankings of these three basins were unstable, with positions changing from time to time.
The above analysis shows that the water quality of the seven major river basins has improved between 2001 and 2020, but the treatment effectiveness of each basin has only been given qualitative conclusions, but no quantitative results. For this reason, the index of average annual rate of change is used to calculate the improvement of water quality in three groups (Grade I-III, Grade IV-V, and inferior Grade V), to visualize the treatment effectiveness of each basin.
The average annual rate of change is defined as follows:
Where A represents the proportion of each water quality group in a specific basin in 2001.
B signifies the proportion of each water quality group in a particular basin in 2020. Given that the proportion of inferior Grade V water in six basins reached 0 in 2020, and only the Hai River basin has not yet reached 0, the calculation for indicator B utilizes the 2019 data to standardize the calculation criteria.
ϕ denotes the average annual rate of change. For Grade I-III water, it signifies the growth rate, and the value is positive when there is an increase. For Grade IV-V and inferior V water, it primarily represents the reduction rate, and it is positive when a decrease occurs.
N corresponds to the number of years. The calculation considers 19 years for Grades I-III and IV-V water. Specifically, for the calculation of inferior Grade V water, it takes 18 years.
Under the above formula, the average annual growth rate of Grade I-III and the average annual reduction rate of Grade IV-V and inferior V can be calculated from 2001 to 2020 in the seven basins. The treatment effectiveness of each basin is shown in Figure 17.
(1) The average annual growth rates of Grade I-III water in the seven major river basins are all positive, indicating an increase in the proportion of Grade I-III water in each basin over the past 20 years. The average annual growth rates of the seven basins are ranked in descending order: the Liao River and Yellow River basins belong to the first echelon, with average annual growth rates of 12.0% and 10.8%; the Hai River, Huai River, and Songhua River basins belong to the second echelon with average annual growth rates ranging from 5.0% to 8.2%; and the Yangtze River and Pearl River basins, with average annual growth rates of only 1.2% and 0.88%, form the third echelon.
(2) The average annual reduction rates of Grade IV-V water in the seven major basins are ranked in descending order: the Yangtze River, Songhua River, Yellow River, Pearl River, Huai River, Liao River, and Hai River basins. According to the average annual growth rate of Grade IV-V water, the seven basins can be categorized into four echelons. The reduction rate of Grade IV-V water in the Yangtze River basin is notably distinct, with an average annual reduction rate of 8.3%, placing it in the first echelon. The average annual rates of Grade IV-V water in the Songhua River, Yellow River, and Pearl River basins range between 3.5% and 5.5%, classifying them into the second echelon. The average annual rates of Grade IV-V water in the Huai River and Liao River basins are less than 1, assigning them to the third echelon. It is noteworthy that the average annual reduction rate of Grade IV-V water in the Hai River basin is −3.4%, resulting in its categorization into the fourth echelon. This can be mainly attributed to two reasons. First, in 2001, the Hai River basin was severely polluted, with the proportion of inferior Grade V water as high as 67.0%, while Grade IV-V water was only 18.6%. The calculation of the average annual rate of reduction (using formula 2) yielded a small A value. Second, by 2020, the water quality in the Hai River had significantly improved, with inferior Grade V water reduced to only 0.6%. Some of the inferior Grade V water quality shifted to Grade IV-V water, resulting in an increase in Grade IV-V water compared to 2001. Consequently, the B value in formula (2) exceeded the A value, leading to the performance of a negative average annual rate of reduction.
(3) The average annual reduction rate of inferior Grade V water in the seven major basins is positive, signifying a reduction in the proportion of inferior Grade V water in each basin over the past 20 years. The average annual reduction rate is ranked as follows: the Huai River, Yangtze River, Hai River, Liao River, Yellow River, Songhua River, and Pearl River basin. According to the average annual reduction rate of inferior Grade V water, the basins can be classified into three echelons. The Huai River basin achieved the first echelon with a reduction rate of 22.1%; the Yangtze River, Hai River, Liao River, Yellow River, and Songhua River basins form the second echelon, with an average annual reduction rate ranging from 9.4% to 12.2%; and the Pearl River basin, with a reduction rate of only 4.7%, belongs to the third echelon.
(4) Among the seven basins, the Huai River basin ranked first in the average annual reduction rate of inferior Grade V water and fourth in the average annual growth rate of Grade I-III water. This indicates that the treatment of the Huai River basin over the past 20 years has yielded excellent results. The Liao River, Yellow River, and Songhua River basins also demonstrated significant effects, with relatively high average annual growth rates of Grade I-III water and average annual reduction rates of inferior V water. However, ecological stability should be strengthened in subsequent management to avoid a rebound phenomenon. In the Yangtze River basin, the reduction rate of Grade IV-V water and inferior V water was relatively high, but the average annual growth rate of Grade I-III water was not prominent. This suggests a shift in governance from simple to complex and from overall to local in the Yangtze River basin. The Pearl River basin, having relatively good water quality in 2001, exhibited lower average annual growth rates of Grade I-III water and average annual reduction rates of Grade IV-V and inferior V water. Additionally, the Hai River basin showed relatively high average annual growth rates of Grade I-III water and average annual reduction rates of inferior V water, but experienced an increase in Grade IV-V water. Although positive effects have been achieved, they fall short of the ideal target, necessitating stronger control of wastewater sources and further improvement in governance measures.
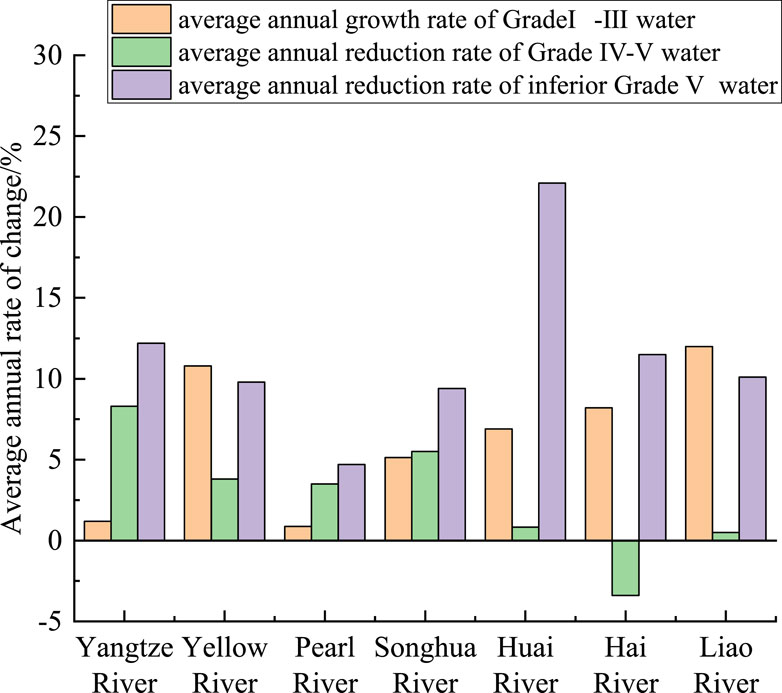
Figure 17. Treatment results of each basin from 2001 to 2020.
Several factors contribute to the improvement of water quality in the seven basins, summarized as follows.
(1) Scientific planning. The comprehensive planning of the seven major river basins, approved and implemented by the State Council or competent department have been elevated to a national strategy, emphasizing the significant importance the Chinese government places on water resource protection. Table 4 lists the national water conservation plans for the seven major river basins from 2001 to 2020.
(2) Enhanced policies and regulations. In 2002, the promulgation and implementation of the revised Water Law of the People’s Republic of China represent a new historical stage in China’s water governance and legal management. Specific protection laws for various river basins, such as the Protection Law of the Yangtze River and the Protection Law of the Yellow River, offer enhanced legal guidance for the protection of major river basins. In addition, the state introduced the development strategy of “Common protection, no large-scale development” for the Yangtze River Economic Belt in 2016 (Wang and Fan, 2021). Emphasizing ecological priority and green development, this strategy provided a clear direction and tone for the governance of the Yangtze River basin (Yang and Xu, 2020).
(3) Surge in investment in water conservancy infrastructure. The state allocates substantial funds annually to water conservancy infrastructure construction, facilitating the planning and construction of water sources to mitigate the potential for natural disasters and human-induced pollution in major watersheds. In 2001, the investment in water conservancy construction was about 60 billion Yuan, and by 2020, 770 billion Yuan has been invested, 12.8 times that of 2001.
(4) Heightened environmental protection awareness. The water conservancy sector adheres to a comprehensive, coordinated, and sustainable development concept, while residents respond to the national call for large-scale pollution reduction and emission reduction in both production and daily life.
(5) Application of green production technology. Advances in science and technology have elevated the level of green production, allowing for effective treatment of most wastes and sewage from industrial production and daily life. As a consequence, the national rate of industrial wastewater discharge meeting standards has risen from 85.6% in 2001 to 100% in 2020. This reduction in pollutant emissions at the source contributes to improved river water quality.
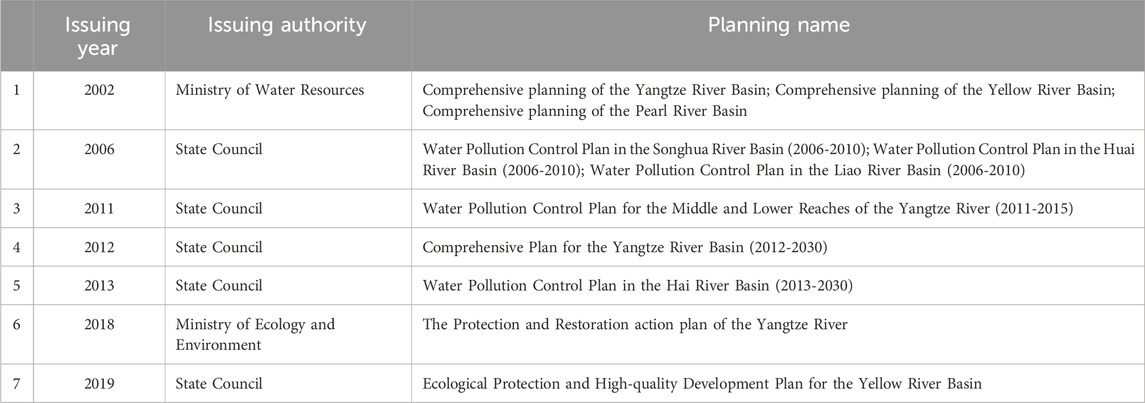
Table 4. Major planning in the seven river basins from 2001 to 2020.
(1) Over the past 2 decades, the overall quality of surface water in China has witnessed gradual improvement. In 2001, surface water pollution was severe, with Grade I-III, IV-V, and inferior V water constituting 29.5%, 26.5%, and 44%, respectively. However, by 2020, Grade I-III water had surged to 87.4%, marking a 57.9% increase from 2001, while Grade IV-V water decreased to 12.3%, reflecting a 14.2% reduction, and inferior V water plummeted to 0.2%, indicating a significant 43.8% decrease. The proportion of Grade I-III water exhibits an approximate linear increasing trend over time, while the proportion of inferior Grade V water shows an approximate linear decreasing trend.
(2) In 2001, the descending order of Grade I-III water proportions across the seven major basins was as follows: Pearl River basin (78.6%), Yangtze River basin (76.7%), Songhua River basin (31.8%), Huai River basin (22.1%), Hai River basin (14.4%), Yellow River basin (12.0%), and Liao River basin (8.3%). The descending order of inferior Grade V water proportions was the Hai River basin (67.0%), Liao River basin (59.7%), Yellow River basin (56.0%), Huai River basin (53.2%), Songhua River basin (16.7%), Pearl River basin (7.1%), and Yangtze River basin (6.3%). The Hai River, Liao River, Huai River, and Yellow River basins were heavily polluted, the Songhua River was mildly polluted, and the Yangtze River and Pearl River basin exhibited good water quality. In 2020, the proportion of Grade I-III water from highest to lowest was the Yangtze River basin (96.7%), Pearl River basin (92.8%), Yellow River basin (84.7%), Songhua River basin (82.4%), Huai River basin (78.9%), Liao River basin (70.9%), and Hai River basin (64.0%). The proportion of inferior Grade V water in the Hai River basin was 0.6%, while the rest of the basins registered 0. The Hai River and the Liao River basin were mildly polluted, while the Yellow River, Huai River, and Songhua River basin exhibited good water quality, and the Yangtze River and Pearl River basin showcased excellent water quality.
(3) From 2001 to 2020, due to changes in the volume and types of sewage discharge, the main pollutant indicators of the seven basins have been adjusted. However, some pollutant indicators have been dominant, such as, NH3-N in the Yangtze River basin, ammonia-nitrogen in the Yellow River basin, CODMn in the Songhua River and Huai River basin, BOD5 and NH3-N in the Hai River basin, and BOD5 in the Liao River basin.
(4) From 2001 to 2020, the ranking of the pollution degree in the seven major basins exhibited dynamic changes but also remained relatively stable during specific periods or years. In 2003, 2004, 2006, 2007, 2014, 2015, and 2016, the pollution degree ranking was consistently as follows: the Hai River, Liao River, Huai River, Yellow River, Songhua River, Yangtze River, and Pearl River basin. The stability in the ranking of heavily and lightly polluted basins can be attributed to the historical context of pollution.
(5) Regarding treatment effectiveness, the average annual growth rate of Grade I-III water in the seven major basins showed positive trends, ranked in descending order: Liao River, Yellow River, Hai River, Huai River, Songhua River, Yangtze River, and Pearl River basin. The average annual reduction rate of Grade IV-V water ranked as follows: Yangtze River, Songhua River, Yellow River, Pearl River, Huai River, Liao River, and Hai River basin. The average annual reduction rate of inferior Grade V water was positive, with the ranking as follows: Huai River, Yangtze River, Hai River, Liao River, Yellow River, Songhua River, and Pearl River basin. Taking a comprehensive view, the treatment effectiveness of the Huai River basin stands out. The Liao River, Yellow River, and Songhua River basins have also achieved commendable treatment results. Due to relatively good water quality at the turn of the century, the Yangtze River and Pearl River basin have become more challenging to treat. The Hai River basin exhibits a mere 8.2% average annual growth rate of Grade I-III water, and Grade IV-V water shows a growth phenomenon, necessitating more rigorous management.
(6) Several factors contribute to the improvement of water quality in the seven basins, including scientific planning, enhanced policies and regulations, surge in investment in water conservancy infrastructure, heightened environmental protection awareness, application of green production technology. These successful practices set an example for other developing countries to strike a balance between economic development and environmental protection.
The original contributions presented in the study are included in the article/Supplementary material, further inquiries can be directed to the corresponding authors.
QY: Writing–original draft, Conceptualization. JC: Formal Analysis, Writing–original draft. YuL: Conceptualization, Methodology, Supervision, Writing–review and editing. YaL: Writing–review and editing. HZ: Formal Analysis, Writing–review and editing. JZ: Methodology, Writing–original draft. XS: Investigation, Writing–review and editing. ML: Investigation, Writing–review and editing. RM: Investigation, Writing–review and editing. YW: Investigation, Writing–review and editing.
The author(s) declare financial support was received for the research, authorship, and/or publication of this article. This research was funded in part by the National Natural Science Foundation of China (grant number 12205113), Jiangsu Education Science Planning Project (grant number 2022B16), Key Research Project about Frontier Foundation of Huai’an (grant number HAQ202202), and Open fund for Jiangsu Engineering Laboratory of Structure Assembly Technology on Urban and Rural Residence (grant number JSZP201904).
The authors declare that the research was conducted in the absence of any commercial or financial relationships that could be construed as a potential conflict of interest.
All claims expressed in this article are solely those of the authors and do not necessarily represent those of their affiliated organizations, or those of the publisher, the editors and the reviewers. Any product that may be evaluated in this article, or claim that may be made by its manufacturer, is not guaranteed or endorsed by the publisher.
Abdel-Satar, A. M., Ali, M. H., and Goher, M. E. (2017). Indices of water quality and metal pollution of Nile River, Egypt. Egypt. J. Aquatic Res. 43 (1), 21–29. doi:10.1016/j.ejar.2016.12.006
Anh, N. T., Nhan, N. T., Schmalz, B., and Le Luu, T. (2023). Influences of key factors on river water quality in urban and rural areas: a review. Case Stud. Chem. Environ. Eng. 8, 100424. doi:10.1016/j.cscee.2023.100424
Bowes, M. J., Armstrong, L. K., Harman, S. A., Wickham, H. D., Nicholls, D. J., Scarlett, P. M., et al. (2018). Weekly water quality monitoring data for the River Thames (UK) and its major tributaries (2009–2013): the Thames Initiative research platform. Earth Syst. Sci. Data 10 (3), 1637–1653. doi:10.5194/essd-10-1637-2018
Chen, K., Wu, L., and Zhou, H. (2022). Assessment and trend analysis of water quality in the Huai River basin. J. Hydroecology 43, 15–21. doi:10.15928/j.1674-3075.202104080099
Chen, S., He, L., Zhang, F., Ma, G., and Lin, L. (2020a). Spatiotemporal characteristics of surface water quality of the Yangtze River basin during 2016-2019. Res. Environ. Sci. 33, 1100–1108. doi:10.13198/j.issn.1001-6929.2020.04.03
Chen, Y. P., Fu, B. J., Zhao, Y., Wang, K. B., Zhao, M. M., Ma, J. F., et al. (2020b). Sustainable development in the Yellow River Basin: issues and strategies. J. Clean. Prod. 263, 121223. doi:10.1016/j.jclepro.2020.121223
Fu, J., Bai, Y., Ma, X., Guo, H., Yang, Y., and Wang, W. (2012). Analysis on causes and treatment countermeasures for main pollution of Liao River basin. Mod. Chem. Ind. 32, 5–8. doi:10.16606/j.cnki.issn0253-4320.2012.11.033
He, Y., Jin, S., and Shang, W. (2021). Water quality variability and related factors along the Yangtze River using Landsat-8. Remote Sens. 13 (12), 2241. doi:10.3390/rs13122241
Kanu, I., and Achi, O. K. (2011). Industrial effluents and their impact on water quality of receiving rivers in Nigeria. J. Appl. Technol. Environ. sanitation 1 (1), 75–86.
Li, X., Xiao, J., Chai, N., and Jin, Z. (2023). Controlling mechanism and water quality assessment of arsenic in China's Yellow River Basin. J. Clean. Prod. 418, 137953. doi:10.1016/j.jclepro.2023.137953
Lin, L., Shi, Y., Luo, H., Zhang, Y., Yu, Y., and Chen, Y. (2016). Study on the characteristics of water pollution change of Songhua River basin in 2001-2015. Environ. Monit. China 32, 58–62. doi:10.19316/j.issn.1002-6002.2016.06.09
Liu, Q., Ma, J., Su, X., Fang, Y., and Zhou, Y. (2018). Dynamic changes of main water quality parameters in the Pearl River(China) water system from 2006 to 2015. Pearl River 39, 54–58+67. doi:10.3969/j.issn.1001-9235.2018.12.008
Lou, B., Zhuo, H., Zhou, Z., Wu, Y., and Wang, R. (2020). Analysis of alteration of water quality and pollutant fluxes in the Yangtze mainstem during recent 18 years. Res. Environ. Sci. 33, 1150–1162. doi:10.13198/j.issn.1001-6929.2020.04.24
Meher, P. K., Sharma, P., Gautam, Y. P., Kumar, A., and Mishra, K. P. (2015). Evaluation of water quality of Ganges River using water quality index tool. Environ. Asia 8 (1), 124–132.
Ministry of Ecology and Environment of China (2018). Bulletin of the state of Ecology and environment in China 2017. Available at: https://www.mee.gov.cn/hjzl/sthjzk/zghjzkgb/201805/P020180531534645032372.pdf.
Ministry of Ecology and Environment of China (2019). Bulletin of the state of Ecology and environment in China 2018. Available at: https://www.mee.gov.cn/hjzl/sthjzk/zghjzkgb/201905/P020190619587632630618.pdf.
Ministry of Ecology and Environment of China (2020). Bulletin of the state of Ecology and environment in China 2019. Available at: https://www.mee.gov.cn/hjzl/sthjzk/zghjzkgb/202006/P020200602509464172096.pdf.
Ministry of Ecology and Environment of China (2021). Bulletin of the state of Ecology and environment in China 2020. Available at: https://www.mee.gov.cn/hjzl/sthjzk/zghjzkgb/202105/P020210526572756184785.pdf.
Ministry of Environmental Protection of China (2008). Bulletin on the state of the environment in China 2007. Available at: https://www.mee.gov.cn/hjzl/sthjzk/zghjzkgb/201605/P020160526560006255479.pdf.
Ministry of Environmental Protection of China (2009). Bulletin on the state of the environment in China 2008. Available at: https://www.mee.gov.cn/hjzl/sthjzk/zghjzkgb/201605/P020170331526784987758.pdf.
Ministry of Environmental Protection of China (2010). Bulletin on the state of the environment in China 2009. Available at: https://www.mee.gov.cn/hjzl/sthjzk/zghjzkgb/201605/P020160526561125391815.pdf.
Ministry of Environmental Protection of China (2011a). Bulletin on the state of the environment in China 2010. Available at: https://www.mee.gov.cn/hjzl/sthjzk/zghjzkgb/201605/P020160526562650021158.pdf.
Ministry of Environmental Protection of China (2011b). Methods for evaluating the environmental quality of surface water (trial). Available at: https://www.mee.gov.cn/gkml/hbb/bgt/201104/t20110401_208364.htm?collcc=2304170105&,2011.03.09.
Ministry of Environmental Protection of China (2012). Bulletin on the state of the environment in China 2011. Available at: https://www.mee.gov.cn/hjzl/sthjzk/zghjzkgb/201605/P020160526563389164206.pdf.
Ministry of Environmental Protection of China (2013). Bulletin on the state of the environment in China 2012. Available at: https://www.mee.gov.cn/hjzl/sthjzk/zghjzkgb/201605/P020160526563784290517.pdf.
Ministry of Environmental Protection of China (2014). Bulletin on the state of the environment in China 2013. Available at: https://www.mee.gov.cn/hjzl/sthjzk/zghjzkgb/201605/P020160526564151497131.pdf.
Ministry of Environmental Protection of China (2015). Bulletin on the state of the environment in China 2014. Available at: https://www.mee.gov.cn/hjzl/sthjzk/zghjzkgb/201605/P020160526564730573906.pdf.
Ministry of Environmental Protection of China (2016). Bulletin on the state of the environment in China 2015. Available at: https://www.mee.gov.cn/hjzl/sthjzk/zghjzkgb/201606/P020160602333160471955.pdf.
Ministry of Environmental Protection of China (2017). Bulletin on the state of the environment in China 2016. Available at: https://www.mee.gov.cn/hjzl/sthjzk/zghjzkgb/201706/P020170605833655914077.pdf.
Mishra, A. (2010). Assessment of water quality using principal component analysis: a case study of the river Ganges. J. Water Chem. Technol. 32, 227–234. doi:10.3103/s1063455x10040077
Neal, C., Neal, M., Hill, L., and Wickham, H. (2006). The water quality of the river thame in the Thames basin of south/south-eastern england. Sci. Total Environ. 360 (1-3), 254–271. doi:10.1016/j.scitotenv.2005.08.039
Nóbrega, R. L. B., Lamparter, G., Hughes, H., Guzha, A. C., Amorim, R. S. S., and Gerold, G. (2018). A multi-approach and multi-scale study on water quantity and quality changes in the Tapajós River basin, Amazon. Proc. Int. Assoc. Hydrological Sci. 377, 3–7. doi:10.5194/piahs-377-3-2018
Qian, Z. Y. (2001) “Comprehensive report of research on water resources strategy for sustainable development in China,” in Proceedings of the 2001 annual conference of the Chinese hydraulic society, 1–18.
Ríos-Villamizar, E. A., Piedade, M. T., Junk, W. J., and Waichman, A. V. (2017). Surface water quality and deforestation of the Purus river basin, Brazilian Amazon. Int. Aquatic Res. 9 (1), 81–88. doi:10.1007/s40071-016-0150-1
State Environmental Protection Administration (2002a). Bulletin on the state of the environment in China 2001. Available at: https://www.mee.gov.cn/hjzl/sthjzk/zghjzkgb/201605/P020160526552473168912.pdf.
State Environmental Protection Administration (2002b) Environmental quality standards for surface water (GB 3838-2002). Beijing: China Environmental Science Press. State General Administration of Quality Supervision, Inspection and Quarantine.
State Environmental Protection Administration (2003). Bulletin on the state of the environment in China 2002. Available at: https://www.mee.gov.cn/hjzl/sthjzk/zghjzkgb/201605/P020160526552803668343.pdf.
State Environmental Protection Administration (2004). Bulletin on the state of the environment in China 2003. Available at: https://www.mee.gov.cn/hjzl/sthjzk/zghjzkgb/201605/P020160526553278257401.pdf.
State Environmental Protection Administration (2005). Bulletin on the state of the environment in China 2004. Available at: https://www.mee.gov.cn/hjzl/sthjzk/zghjzkgb/201605/P020160526553974502531.pdf.
State Environmental Protection Administration (2006). Bulletin on the state of the environment in China 2005. Available at: https://www.mee.gov.cn/hjzl/sthjzk/zghjzkgb/201605/P020160526558688821300.pdf.
State Environmental Protection Administration (2007). Bulletin on the state of the environment in China 2006. Available at: https://www.mee.gov.cn/hjzl/sthjzk/zghjzkgb/201605/P020160526559046430351.pdf.
Suthar, S., Sharma, J., Chabukdhara, M., and Nema, A. K. (2010). Water quality assessment of river Hindon at Ghaziabad, India: impact of industrial and urban wastewater. Environ. Monit. Assess. 165, 103–112. doi:10.1007/s10661-009-0930-9
Tao, H., Song, K., Liu, G., Wen, Z., Wang, Q., Du, Y., et al. (2021). Songhua River basin's improving water quality since 2005 based on Landsat observation of water clarity. Environ. Res. 199 (111299), 111299–111312. doi:10.1016/j.envres.2021.111299
Ullah, Z., Khan, H., Waseem, A., Mahmood, Q., and Farooq, U. (2013). Water quality assessment of the River Kabul at Peshawar, Pakistan: industrial and urban wastewater impacts. J. Water Chem. Technol. 35, 170–176. doi:10.3103/s1063455x1304005x
Wahaab, R. A., and Badawy, M. I. (2004). Water quality assessment of the River Nile system: an overview. Biomed. Environ. Sci. 17 (1), 87–100.
Wang, H. (2010) Study on China's water resource problems and sustainable development strategies. Beijing: China Electric Power Publishing House.
Wang, J. (2020) Analysis of water environmental quality trends and evaluation in the decade of the Liao River basin. Liaoning University.
Wang, R., and Fan, K. (2021). Water pollution control in the middle and lower reaches of the Yangtze River since reform and opening-up. Contemp. China Hist. Stud. 28, 84–99+153.
Xu, F., He, L., Wang, Y., He, C., Niu, Y., Liu, W., et al. (2021). Temporal and spatial variation characteristics of water quality in Lanzhou and Baiyin section of the Yellow River mainstream from 2010 to 2019. Water Resour. Prot. 37, 44–50. doi:10.3880/j.issn.1004-6933.2021.04.007
Yang, G., and Xu, X. (2020). Foundation and strategy of well-coordinated environmental conservation and avoiding excessive development in the Yangtze River economic belt. Chin. Acad. Sci. Proc. 35, 940–950.
Yu, Z., Song, Y., Wei, J., Hu, S., and Xu, Q. (2021). 70 Years' governance process of Hai River. Res. Environ. Sci. 34, 1347–1358. doi:10.13198/j.issn.1001-6929.2021.01.08
Yuan, Z., Xu, Q., Song, Y., Wei, J., Gao, Y., and Fu, J. (2020). Water pollution management process and “14th Five-Year Plan” pollution control strategy for Liao River basin. Res. Environ. Sci. 33, 1805–1812. doi:10.13198/j.issn.1001-6929.2020.05.22
Zeng, F., Yang, G., Wang, P., Jiao, H., and Zhang, T. (2021). Temporal and spatial variation of water quality and pollution trend of Huai River. J. Hydroecology 42, 86–94. doi:10.15928/j.1674-3075.202106290209
Zhang, X., Xia, X., and Yang, Z. (2007). Reasons of high concentration ammonium in Yellow River, China. Environ. Sci. 28, 1435–1441. doi:10.13227/j.hjkx.2007.07.005
Zhang, Y., Dudgeon, D., Cheng, D., Thoe, W., Fok, L., Wang, Z., et al. (2010). Impacts of land use and water quality on macroinvertebrate communities in the Pearl River drainage basin, China. Hydrobiologia 652, 71–88. doi:10.1007/s10750-010-0320-x
Zheng, K., Shao, T., Ning, J., Zhuang, D., Liang, X., and Ding, X. (2023). Water quality, basin characteristics, and discharge greatly affect CDOM in highly turbid rivers in the Yellow River Basin, China. J. Clean. Prod. 404, 136995. doi:10.1016/j.jclepro.2023.136995
Keywords: seven major river basins, water quality, major pollutants, treatment effectiveness, improvement factors
Citation: Yang Q, Chen J, Liu Y, Li Y, Zhang H, Zhang J, Sun X, Lu M, Ma R and Wu Y (2024) Analysis of changes in water quality and treatment effectiveness of seven major river basins in China from 2001 to 2020. Front. Environ. Sci. 12:1340994. doi: 10.3389/fenvs.2024.1340994
Received: 19 November 2023; Accepted: 09 May 2024;
Published: 05 June 2024.
Edited by:
Juan Manuel Peralta-Hernandez, University of Guanajuato, MexicoReviewed by:
Love Kumar, University of Florida, United StatesCopyright © 2024 Yang, Chen, Liu, Li, Zhang, Zhang, Sun, Lu, Ma and Wu. This is an open-access article distributed under the terms of the Creative Commons Attribution License (CC BY). The use, distribution or reproduction in other forums is permitted, provided the original author(s) and the copyright owner(s) are credited and that the original publication in this journal is cited, in accordance with accepted academic practice. No use, distribution or reproduction is permitted which does not comply with these terms.
*Correspondence: Yuyi Liu, bGl1eXV5aTg4QDE2My5jb20=
Disclaimer: All claims expressed in this article are solely those of the authors and do not necessarily represent those of their affiliated organizations, or those of the publisher, the editors and the reviewers. Any product that may be evaluated in this article or claim that may be made by its manufacturer is not guaranteed or endorsed by the publisher.
Research integrity at Frontiers
Learn more about the work of our research integrity team to safeguard the quality of each article we publish.