
94% of researchers rate our articles as excellent or good
Learn more about the work of our research integrity team to safeguard the quality of each article we publish.
Find out more
ORIGINAL RESEARCH article
Front. Environ. Sci. , 18 April 2024
Sec. Environmental Economics and Management
Volume 12 - 2024 | https://doi.org/10.3389/fenvs.2024.1331530
This article is part of the Research Topic Low-Carbon Economy and Sustainable Development: Driving Force, Synergistic Mechanism, and Implementation Path View all 21 articles
 Yu Zheng1†Yanqing Qin2†Weidong Duan3Wenshuai Dong1Xi Zhang4Guangting Yin3Changgen Li1Zonghao Song1Liangwen Xie2Lei Zhan4*
 Jinsong Ti1*
Introduction: Tobacco, as a significant cash crop in China, warrants a comprehensive investigation into the spatiotemporal dynamics of its carbon footprint in order to address greenhouse gas (GHG) emissions and foster low-carbon, environmentally friendly agricultural practices.
Methods: Employing the life cycle assessment (LCA) methodology, this study aims to scrutinize the temporal variations in the carbon footprint across different functional units of tobacco production in China from 2004 to 2017, thereby elucidating its composition and key influencing factors.
Results and Discussion: The findings reveal that the average carbon footprint per unit area and per unit yield of tobacco production in China during the aforementioned period amounted to 4,098.99 kg CO2-eq∙ha−1 and 1.97 kg CO2-eq∙kg−1, respectively, exhibiting an upward trend over time. Notably, fertilizer and agricultural films emerged as the primary sources of greenhouse gas emissions in Chinese tobacco production, accounting for 26.63% and 24.54% of the total emissions, respectively. Remarkably divergent carbon footprints were observed among various provinces in China. Specifically, Jiangxi, Hunan, and Guangdong exhibited the highest carbon footprints per unit area, with values of 4,908.65 kg CO2-eq∙ha−1, 4,852.90 kg CO2-eq∙ha−1 and 4,833.56 kg CO2-eq∙ha−1, respectively. Likewise, Jiangxi, Fujian, and Yunnan recorded the highest carbon footprints per unit yield, reaching 2.31 kg CO2-eq∙kg−1, 2.23 kg CO2-eq∙kg−1 and 2.22 kg CO2-eq∙kg-1, respectively. Conversely, Inner Mongolia, Hebei, Jilin, and Heilongjiang exhibited lower carbon footprints per unit area, namely, 3,952.06 kg CO2-eq∙ha−1, 3,751.08 kg CO2-eq∙ha−1, 2,935.81 kg CO2-eq∙ha−1, 3,264.83 kg CO2-eq∙ha−1 and 2,830.92 kg CO2-eq∙ha−1, respectively. Moreover, these regions displayed both high yield and productivity. This investigation highlights the significance of implementing measures such as scientific fertilization, reducing agricultural film usage, and expediting the mechanization process of tobacco cultivation to foster the development of an environmentally sustainable tobacco industry in China.
Global climate change, caused by excessive greenhouse gas emissions, has become an indisputable fact, and reducing greenhouse gas emissions and promoting low-carbon industries have become the focus of industrial development in countries around the world. The critical link between the overuse of fossil fuels in production systems and global climate change is well-established, with excessive emissions of greenhouse gases being a key contributor (Peng et al., 2019; Abbas et al., 2022; Elahi et al., 2022; Elahi and Khalid, 2022). This recognition has led countries globally to increasingly focus on reducing greenhouse gas emissions and promoting the development of low-carbon industries as part of their industrial advancement strategies (Abbas et al., 2023). China is the world’s largest greenhouse gas emitter, and the State Council Government Work Report in 2021 stated that it should do a solid job of carbon peaking and carbon neutral work and develop an action plan for carbon peaking by 2030 (Lin, 2021). Greenhouse gas emissions from agricultural ecosystems account for 13.5% (Montzka et al., 2011) of global greenhouse gas emissions, and how to develop effective measures to reduce agricultural greenhouse gas emissions is an urgent issue for agricultural development. The quantitative assessment of greenhouse gas emissions across various stages of agricultural ecosystem production plays a crucial role in formulating effective emission reduction strategies in agriculture. The concept of the carbon footprint, pivotal in this context, evaluates greenhouse gas emissions attributable to specific human activities. Originally derived from the ecological footprint concept, the term “carbon footprint” was first introduced by British scholars in 2009. Over the years, the carbon footprint theory has evolved significantly. To standardize its calculation, the International Organization for Standardization (ISO). (2018) in 2018 defined the carbon footprint as the total direct and indirect greenhouse gas emissions of a product or activity across its life cycle, ascertained using the life cycle assessment (LCA) method.
In the field of agricultural carbon footprint research, there has been a considerable global scholarly focus on the production of different crops in recent years. Studies indicate that in China, the carbon footprints and GHG emissions per unit area for wheat and corn have been on an upward trend over the past decade. Specifically, fertilizer use contributes to over half of the wheat’s carbon emissions (Yan et al., 2015; Zhang et al., 2023). In the case of rice production, while the carbon footprint per unit area has increased (Wang et al., 2017), the carbon footprint per unit yield has exhibited a decreasing trend during the same period. In addition to crop types, farming practices, altitude, latitude and longitude and soil properties will have an impact on the carbon footprint of agroecosystems, and the scale and intensification of agricultural production will become the main measures to reduce the carbon footprint of farmland in the future (Wang et al., 2016; Tian et al., 2021). Previous studies have mostly focused on food crops; however, few studies have reported on the carbon footprint of cash crop production.
Tobacco, a key cash crop in China, encompassed a planting area of 887,533 ha in 2019 (Liu and Huang, 2020). The entire tobacco production process, which includes growing, curing, processing, cigarette manufacturing, marketing, consumption, and waste disposal, contributes significantly to climate change, emitting approximately 84 million tonnes of CO2 equivalent annually. This accounts for about 0.2% of the total global GHG emissions (Zafeiridou et al., 2018), with the stages of tobacco growing, cigarette manufacturing, and tobacco curing identified as primary contributors. While cigarette enterprises’ sustainability reports (British American Tobacco, 2016) have disclosed emissions from cigarette production, the carbon emissions attributable to tobacco cultivation remain largely underestimated. Previous research on the carbon footprint of tobacco has been limited by short study durations and small geographical coverage (Hussain et al., 2014), highlighting a gap in comprehensive, large-scale assessments of tobacco’s environmental impact. In the context of green agricultural development, the quantitative evaluation of greenhouse gas emissions caused by various agricultural inputs and their use during tobacco cultivation in different tobacco regions of China is important to mitigate greenhouse gas emissions from tobacco farmlands and to promote the development of green tobacco agriculture. Based on statistical data, this study systematically analyzed the spatial and temporal dynamics of the carbon footprint and the carbon footprint composition of tobacco production in China from 2004 to 2017 using carbon footprint theory and the LCA method in order to provide theoretical references for the construction of green and low-carbon tobacco agriculture in China.
The study area included 20 provincial administrative regions of Hebei, Inner Mongolia, Liaoning, Jilin, Heilongjiang, Anhui, Fujian, Jiangxi, Shandong, Henan, Hubei, Hunan, Guangdong, Guangxi, Chongqing, Sichuan, Guizhou, Yunnan, Shaanxi and Gansu, covering the entire area of tobacco cultivation in China Figure 1. Due to difficulties in obtaining data, Hong Kong, Macao and Taiwan were not covered in this study. Data on tobacco production and cultivated area from 2004 to 2017 were obtained from the China Agricultural Statistical Yearbook. Agricultural inputs (fertilizers such as nitrogen, phosphorus, potassium, compound fertilizers, organic fertilizers, diesel, labor, pesticides, etc.) in tobacco production from 2004 to 2017 were obtained from the China Agricultural Statistical Yearbook and the National Compilation of Information on Costs and Benefits of Agricultural Products.

Figure 1. Tobacco growing areas in China.
The system boundary of this study was the whole process from seedling transplanting to harvesting, and it mainly accounted for the potential GHG emissions caused by agricultural inputs such as fertilizer, diesel, pesticides and seedlings as well as soil non-CO2 GHG emissions produced during tobacco production in China Figure 2.
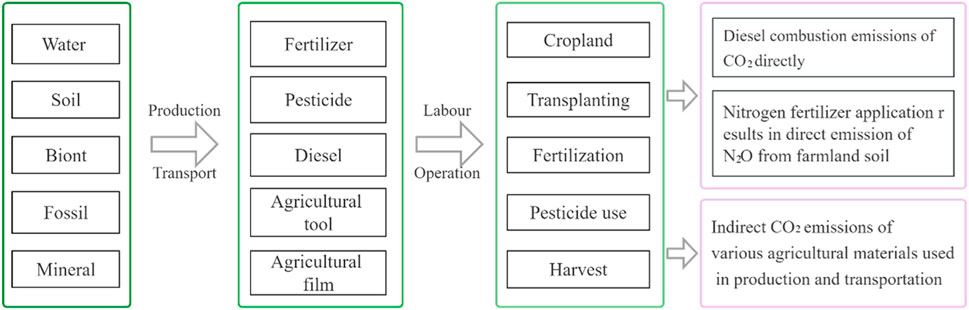
Figure 2. Calculation boundary of carbon footprint of tobacco production in China.
In this study, the LCA method was used to quantitatively estimate direct and indirect GHG emissions produced during the production cycle of Chinese tobacco farmland with reference to the ISO 140674 product carbon footprint accounting standard. The carbon footprint of the tobacco production process was calculated as Eq. 1.
In the above equation (Eq. 1), CFT is the carbon emissions from tobacco production,
In Eq. 2, Qi is the amount of each production material input (kg∙ha-1) during tobacco farm production, and EFi is the emission factor of each production material input; the emission parameters are shown in Table 1, mainly referring to the China Life Cycle Database and Ecoinvent database.

Table 1. Greenhouse gas emission factors for agricultural inputs.
In Eqs 3–6,
The carbon footprint per unit area and carbon footprint per unit yield of tobacco production were calculated as follows (Eqs 7, 8):
In the above equation (Eqs 7, 8), a is tobacco planting area, and y is the tobacco yield (t∙ha-1).
Microsoft Excel 2011 and SPSS 26 software were used to process and analyze the data, and Microsoft Excel 2011 and ArcGIS 10.2 software were used to make the graphs.
The average carbon footprint per unit area of tobacco production in China from 2004 to 2017 was 4,098.99 kg CO2-eq∙ha−1, with an overall trend of a slow increase Figure 3. The carbon footprint per unit area of tobacco production increased from 3,626.61 kg CO2-eq∙ha−1 in 2004–4,585.96 kg CO2-eq∙ha−1 in 2017, with an average annual increase of 1.82% (y = 57.64x - 111,787, R2 = 0.8418); the average carbon footprint per unit production of tobacco production in China from 2004 to 2017 was 1.97 kg CO2-eq kg −1, with an overall slow upward trend and an average annual increase of 0.98% (y = 0.019x - 36.139, R2 = 0.4422). The carbon footprint per unit of production of tobacco production increased from 1.92 kg CO2-eq∙kg−1 in 2004 to 2.18 kg CO2-eq∙kg−1 in 2017, with the lowest value of 1.78 kg CO2-eq∙kg−1 in 2010.
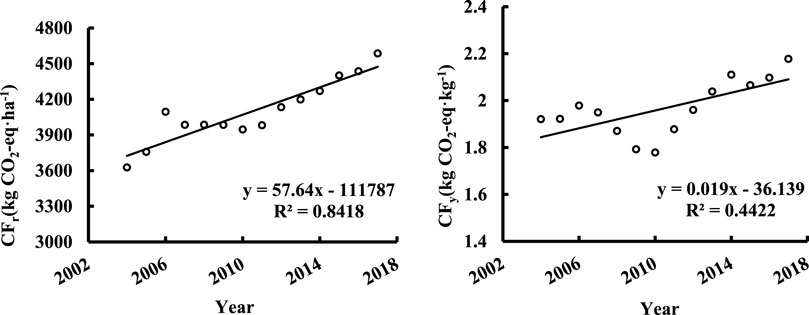
Figure 3. Change in carbon footprint per unit area and carbon footprint per unit production of tobacco production in China from 2004 to 2017.
The proportion of the carbon footprints generated by various agricultural inputs during tobacco production have varied widely Figure 4. Fertilizer inputs had the highest carbon footprint of 26.63%, and N2O emissions from agricultural soils produced due to N fertilizer application accounted for 23.08%; agricultural film inputs were the second largest contributor, accounting for 24.54%; pesticide inputs had the lowest carbon footprint of about 1.48%; and diesel inputs and labor inputs accounted for 13.65% and 10.63%, respectively. The share of the carbon footprint caused by agricultural film inputs increased significantly from 24.11% in 2004 to 32.43% in 2017, with an average annual increase of 2.31%, mainly due to the dramatic increase in the use of agricultural film in the tobacco production process over the last 15 years (Gao et al., 2022).
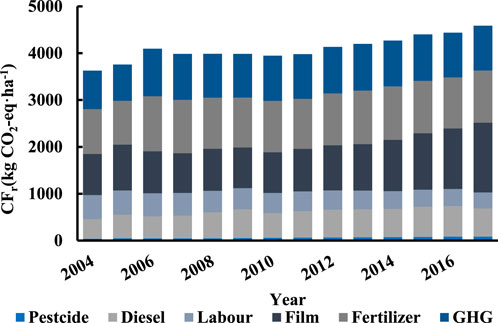
Figure 4. Interannual variation in the composition of the carbon footprint of tobacco production in China from 2004 to 2017.
Based on the absolute values of the carbon footprint components of China’s tobacco production system, nine actual amounts of agricultural inputs, namely, nitrogen fertilizer, phosphate fertilizer, potash fertilizer, compound fertilizer, pesticide, diesel fuel, labor, agricultural film and organic fertilizer, were selected for a stepwise regression analysis of the carbon footprint per unit area and the carbon footprint per yield of tobacco production in China from 2004 to 2017, respectively. The carbon footprint per unit area of tobacco production in China during 2004–2017 showed a gradual increase Figure 3. The influence of a compound fertilizer input (X4), pesticide input (X5) and agricultural film input (X8) showed a positive correlation; the coefficient of determination was 0.912 in which the compound fertilizer input showed a significantly positive correlation, with a significance level of 5%, and in which the agricultural film input showed a very significant positive correlation, with a significance level of 1% Table 2. It can be expressed as Y1 = 0.105X4 + 4.994X5 + 1.107X8 + 2013.268. The main factor influencing the increase in the carbon footprint per unit yield of tobacco leaf production in China from 2004 to 2017 was the actual agricultural film input (X8), which showed a positive correlation, with a coefficient of determination of 0.613. At a significance level of 1%, it could be expressed as Y2 = 0.001X8 + 1.267.
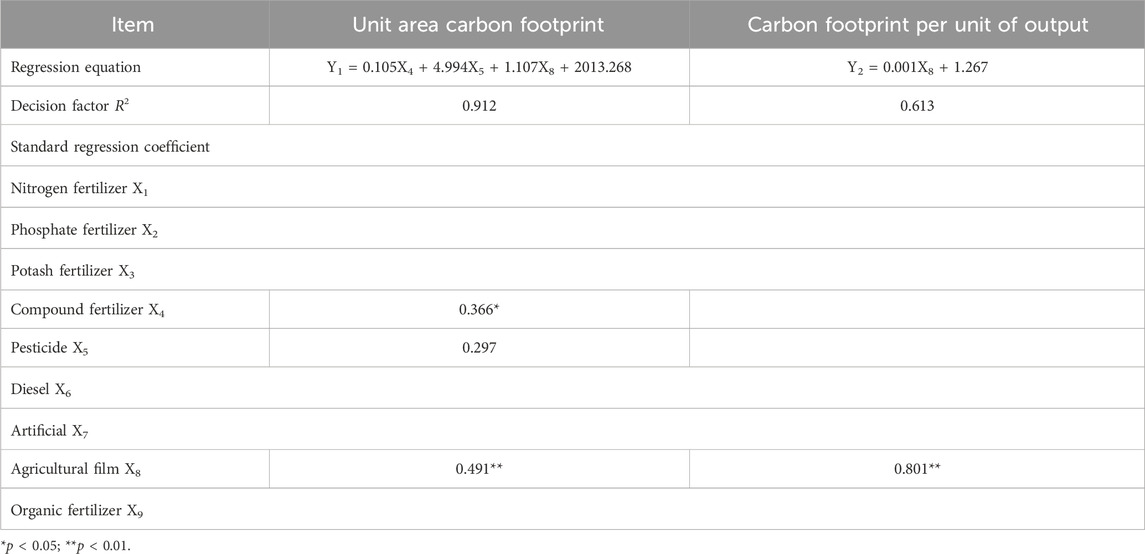
Table 2. Regression equation of carbon footprint of tobacco production in China from 2004 to 2017.
There are obvious differences in the tobacco planting areas among the Chinese provinces Figure 5. Yunnan Province has the largest average annual planting area of 424.97 ha, while Hebei Province has the lowest of 2.18 ha. The rate of change in the planted area of tobacco by province ranged from −1.067–8.257 ha∙a−1 from 2004 to 2017, with nine provinces showing an overall increasing trend year by year. Yunnan Province showed the largest increase, with an average annual rate of change of 8.257 ha∙a−1. The lowest rate of change of −1.067 ha∙a−1 was in Shandong Province. The average annual tobacco production per unit area in China’s provinces ranged from 1719.00 to 3,835.00 kg ha−1, with Inner Mongolia having the highest average annual production per unit area of 3,835 kg ha−1. Guangxi was the lowest at 1719.00 kg ha−1. The annual average yield per unit area in each province in China ranged from −4.46–75.15 kg ha-1∙a−1, with an overall increasing trend from northeast to southwest. The highest annual average rate of change was found in Gansu Province at 75.15 kg ha-1∙a−1, and the lowest value was found in Sichuan Province at −4.46 kg ha-1∙a−1.
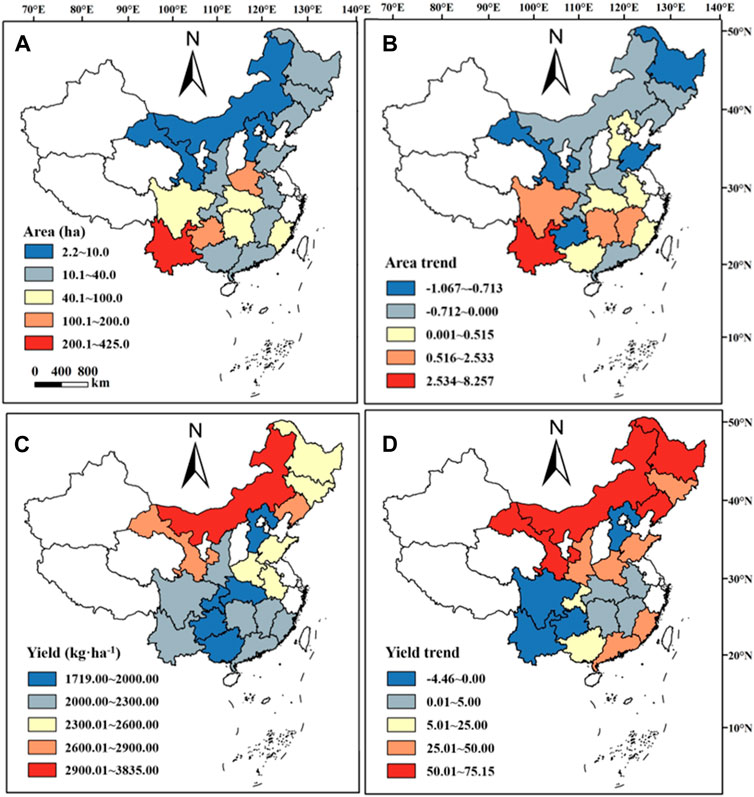
Figure 5. Distribution of tobacco planted area, yield per unit area and its rate of change by province in China from 2003 to 2017. (A) Distribution of tobacco planted area (unit is ha), (B) distribution of the rate of change of tobacco planted area (unit is ha∙a−1), (C) distribution of yield per unit area (unit is kg∙ha) and (D) distribution of the rate of change of yield per unit area (unit is kg∙ha−1∙a−1).
There are significant differences in the average annual carbon footprints of tobacco production among the Chinese provinces Figure 6. The highest annual average carbon footprint per unit area was found in Jiangxi Province at 4,908.65 kg CO2-eq∙ha−1, while Heilongjiang Province had the lowest annual average carbon footprint of 2,830.92 kg CO2-eq∙ha−1. The results reveals notable regional differences in the annual average change rates of the carbon footprint for tobacco production across China, with a particular concentration of higher rates in the western provinces. Inner Mongolia experienced the most significant decrease in carbon footprint per unit area, indicating a substantial annual average reduction rate. There is a discernible trend in the annual average carbon footprint per unit of production, displaying a skewed pattern from the south to the north of China. Provinces in southwest China particularly exhibited higher increases in carbon footprint per unit production. Notably, Guangdong Province achieved the largest reduction in carbon footprint per unit of production, recording an average annual rate of change of −0.051 kg CO2-eq∙kg-1∙a−1.
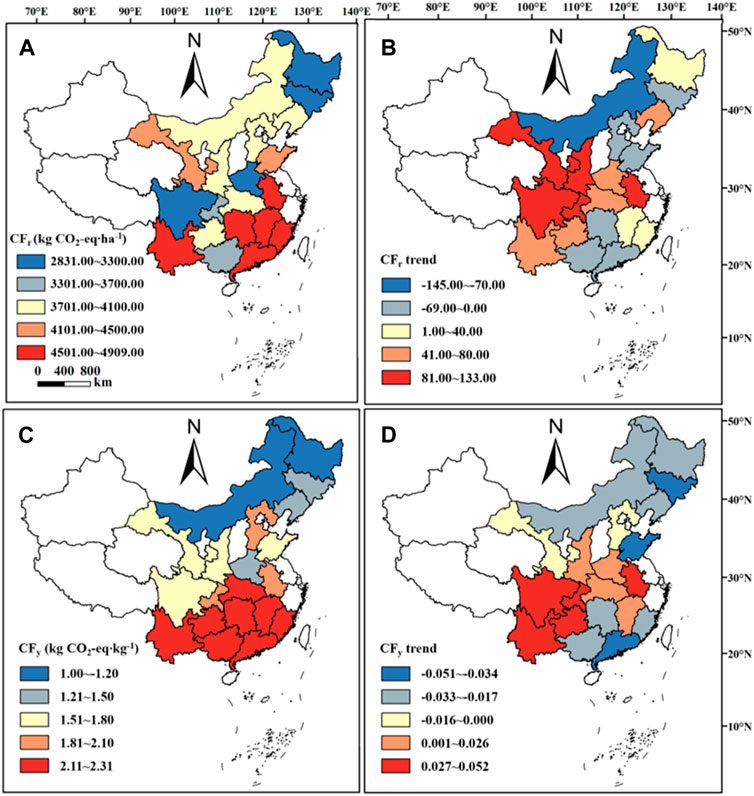
Figure 6. Distribution of carbon footprint per unit area, carbon footprint per unit production and the change rate of tobacco production by province in China from 2003 to 2017. (A) Distribution of carbon footprint per unit area in kg CO2-eq∙ha−1, (B) distribution of carbon footprint change rate per unit area in kg CO2-eq∙ha−1∙a−1, (C) distribution of carbon footprint per unit production in kg CO2-eq∙kg−1 and (D) distribution of carbon footprint change rate per unit production in kg CO2-eq∙kg−1∙a−1.
The 20 tobacco-growing provinces of China were divided into four categories, or regions, based on the average annual carbon footprint per unit area and the average annual yield: high emissions–high yield, high emissions–low yield, low emissions–high yield and low emissions–low yield Figure 7. The Shandong, Anhui and Jiangxi provinces were located in the high-emissions–high-yield region, while the Yunnan, Hunan, Gansu, Guangdong and Fujian provinces were located in the high-emissions–low-yield region. This was especially accurate for Gansu Province, which exhibited significantly higher carbon emissions accompanied by lower yields. Seven provinces, Sichuan, Chongqing, Liaoning, Shaanxi, Hubei, Guangxi and Guizhou Province, were in the low-emissions–low-yield region. Heilongjiang, Jilin, Hebei and Inner Mongolia were in the low-emissions–high-yield region, and this was especially accurate for Inner Mongolia, which exhibited significantly low-effect carbon emissions accompanied by high yields.
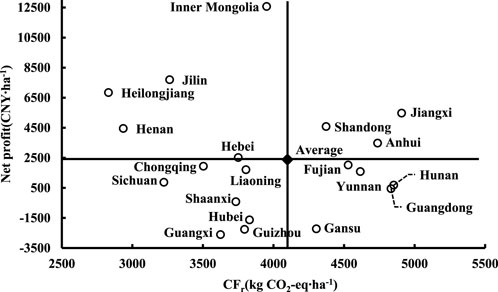
Figure 7. Distribution of annual carbon emissions and yield per unit area of tobacco production in different provinces of China from 2004 to 2017.
The 20 tobacco-growing provinces of China were divided into four categories, or regions, based on the average annual carbon footprint per unit area and the average annual net profit: high emissions–high benefit, high emissions–low benefit, low emissions–high benefit and low emissions–low benefit Figure 8. Shandong, Anhui and Gansu Province were located in the high-emissions–high-benefit region, while Fujian, Yunnan, Hunan, Guangdong and Jiangxi were located in the high-emissions–low-benefit region, with Fujian Province exhibiting a significantly low benefit combined with high levels of carbon emissions. Chongqing, Sichuan, Shaanxi, Hubei, Guizhou and Guangxi were in the low-emissions–low-yield region, and Heilongjiang, Henan, Jilin, Hebei, Liaoning and Inner Mongolia were in the low-emissions–high-yield region, with Inner Mongolia in particular exhibiting significantly low-effect carbon emissions combined with a high yield. The Yunnan, Guangdong and Hunan provinces were located in the high-emissions regions with both a low yield and low revenue, and five provinces, Inner Mongolia, Hebei, Jilin, Heilongjiang and Henan Province, were located in the low-emissions regions with both a high yield and high revenue.
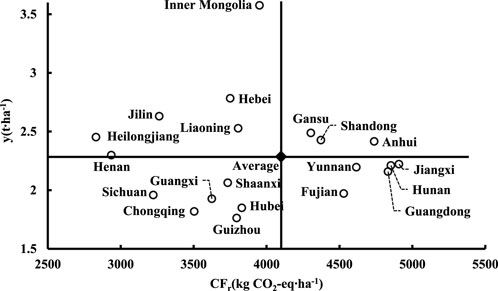
Figure 8. Distribution of annual carbon emissions and revenue per unit area of tobacco production in different provinces of China from 2004 to 2017.
Since the formation of the China National Tobacco Corporation (CNTC), which has significantly contributed to China’s financial revenue, there has been a notable shift in focus towards ecological sustainability. This change was particularly emphasized following the 18th Party Congress, which integrated the construction of ecological civilization into China’s comprehensive ‘Five-in-One’ development strategy, with green agricultural development being a key component of this initiative (Jin et al., 2021). In the years 2021 and 2022, the tobacco industry in China took decisive steps by issuing implementation opinions aimed at promoting the green transformation of the tobacco sector. These steps include aligning with the ‘double carbon’ objectives - carbon peaking and carbon neutrality - as part of the industry’s commitment to high-quality development (Dongfang, 2022). Li et al. (2017) analyzed the carbon footprint of the manufacturing section of a domestic brand of cigarette based on the LCA method. Wang et al. (2018) developed a comprehensive energy consumption model to provide a theoretical basis for reducing emissions in the cigarette yarn-making section. No carbon footprint studies have been reported for tobacco growing, which is an important stage of tobacco production. Therefore, there is an urgent need to account for the carbon footprint of the tobacco growing process and to analyze its composition and dynamic changes. From 2004 to 2017, the carbon footprint of tobacco production in China exhibited an upward trend, with a notable increase in 2006 primarily due to the rising carbon footprint from fertilizer use. This increase coincided with the abolition of the agricultural tax in China in 2006, which, coupled with escalating food prices, spurred farmers’ enthusiasm for cultivation and increased fertilizer demand (Xu et al., 2020). This surge in fertilizer usage led to an upswing in domestic production capacity, subsequently elevating the carbon footprint. However, the introduction and widespread adoption of scientific fertilization methods have since contributed to a gradual deceleration in the carbon footprint’s growth rate. In recent years, China’s tobacco leaf production has shown a fluctuating pattern. Initially, it increased annually, driven by the domestic macroeconomic improvement, population growth, and rising per capita income, which stimulated cigarette consumption. The production peaked in 2010 but has since been on a decline. This downward trend can be attributed to growing health consciousness among the public, leading to reduced cigarette demand and consequently, a decrease in tobacco leaf production. The results of this study show that the carbon footprint per unit area of tobacco production in China is 4,098.99 kg CO2-eq∙ha−1, which is higher than China’s average carbon footprint per unit area of maize production of 3,934 kg CO2-eq∙ha−1 and higher than China’s average carbon footprint per unit area of wheat production of 2,786 kg CO2-eq∙ha−2 (Wu, 2022). Therefore, the carbon footprint per unit area of these three crops in China can be shown as tobacco > maize > wheat. Therefore, in the future crop production layout, the tobacco planting area can be appropriately reduced, and the wheat and corn planting areas can be appropriately expanded to reduce planting carbon emissions.
Multiple studies have shown that the main source of greenhouse gas emissions from fields is fertilizer application of which the carbon emissions caused by N fertilizer application account for more than half (Yan et al., 2015), and this study also found that fertilizer input makes up the highest proportion of the carbon footprint per unit area of tobacco, reaching 26.63%, of which N fertilizer input causes 23.08% of farmland soil emissions. Additionally, this study shows that the utilization rate of fertilizer in China is low through the utilization rates of nitrogen, phosphorus and potassium fertilizers. Some studies have shown that the fertilizer utilization rates in China are low, with rates of 30%–45%, 10%–20% and 35%–40% for nitrogen fertilizer, phosphorus fertilizer and potassium fertilizer, respectively, which is less than half of the utilization rates in developed countries (Zhang et al., 2013; Yang et al., 2015), and they have shown that low fertilizer application rates are generally accompanied by the excessive application of nitrogen fertilizer (Ke et al., 2018). In China, a prevalent issue among tobacco farmers is the lack of scientific fertilization knowledge, which leads to an elevated carbon footprint from fertilizer use in tobacco production. This challenge is not unique to tobacco but is also common in the production of various grain crops across the country. To mitigate nitrogen fertilizer loss and reduce the fertilizer’s carbon footprint, one potential strategy is to increase the frequency of topdressing appropriately. Furthermore, this study highlights that the use of agricultural film constitutes 24.54% of the carbon footprint per unit area in tobacco production, ranking as the second largest emission source after fertilizer. The reliance on agricultural film, increasing by an average of 2.31% annually, is part of the mainstream tobacco cultivation practice in China. While it improves the economic efficiency of tobacco farming, it also leads to issues like seedling collapse and white pollution (Cheng et al., 2014). Some studies have shown that the amount of film used in tobacco cultivation is high, and some tobacco farmers use agricultural film of a substandard thickness, which cannot be recycled (Chen and Wang, 2022). This study also found that the amount of agricultural film used in tobacco production in Yunnan Province is as high as 57.87 kg ha−1, which has the highest carbon footprint in China, and the use of agricultural film in Yunnan Province accounts for 28.48% of the carbon footprint per unit area of tobacco production, which is higher than most provinces in China. Therefore, reducing the amount of agricultural film is the key to reducing emissions in tobacco production in Yunnan Province. The China National Tobacco Corporation’s Guizhou Province Company initiated a notable pilot project in Zunyi for agricultural film recycling. In 2017, this project successfully removed and processed 71,260 ha of used tobacco mulch, covering 71.07% of the total mulched area in Guizhou Province. This endeavor resulted in the recycling of 7,520 tons of waste mulch, which was repurposed to produce 2,915 tons of materials such as plastic trays and seedling trays, as reported (Guizhou Provincial Committee of the Communist Party of China, 2019). This model of recycling used agricultural film presents a commendable approach for all tobacco planting regions. Similarly, the waste agricultural film generated from corn cultivation in Southwest China and winter wheat farming in the Huanghuai Plain could be repurposed using this method. To promote the reduction and recycling of agricultural film, vigorous supervision, subsidies for farmers who adopt emission reduction practices, and improved verification standards are necessary. Straw and grass mulching are widely used in the United States, Japan and other developed countries for crops such as apples and grapefruit (Tu et al., 2021), and they are worthy of reference in tobacco production. In addition, the labor cost is the highest part of the total cost of tobacco production in China, exceeding the cost of land and other agricultural inputs, and machinery, instead of manual work, is one of the effective ways to improve the efficiency of tobacco cultivation in China.
There are significant regional differences in the carbon footprints per unit area and the carbon footprints per unit production of tobacco production in the different provinces of China, which are related to the differences in climate, topography and soil in different tobacco growing regions in China as well as the differences in the main tobacco varieties planted in each province. In this study, we found that the carbon footprint and the cost input of tobacco production in Guangdong Province are both at a high level in China. Due to urbanization, the tobacco growing areas in Guangdong Province have gradually shifted from the plains to remote mountainous areas (Zhen et al., 2017), resulting in the low penetration of tobacco growing machinery and high labor costs in tobacco production, with the highest cost reaching 130 CNY∙p−1∙d-1. This study also found that Inner Mongolia exhibits significantly lower emissions combined with higher yields and production values. Inner Mongolia is located in the midlatitude region, with simultaneous rain and heat, which is conducive to the growth of tobacco leaves (Tian, 2020). The average annual tobacco yield in Inner Mongolia is 3,450 kg ha−1, which is mainly in Chifeng City; its subordinate county-level cities are all national or provincial poverty-stricken counties, where tobacco is a major cash crop and where it enjoys policy advantages. The cost of agricultural inputs is lower than that of resource-poor areas, and the labor cost is much lower than that of coastal provinces. Meanwhile, agricultural carbon emission intensity is influenced by agricultural technical efficiency (Guo et al., 2022), which is at a higher level in eastern China and which is significantly better than in the central and western regions. The intensity of agricultural carbon emissions is higher in nongrain-producing regions than in grain-producing regions because the implementation of agricultural emission reduction measures effectively reduces greenhouse gas emissions in grain-producing regions (Yang et al., 2021). At the same time, the high standard of safety requirements for food rations inhibits farmers from overapplying medicines and performing other high-carbon-emission behaviors (Gelfand et al., 2013; Sun et al., 2021), and the carbon emission of the food crop production process is lower than that of cash crops. Therefore, appropriately expanding the cultivation area of food crops in the crop layout and improving agricultural technology efficiency are important ways to reduce regional agricultural carbon emissions.
This study underscores that optimizing scientific fertilization and managing tobacco field mulch effectively are crucial for reducing emissions in China’s tobacco production. Prioritizing soil testing and balanced fertilization practices is essential. This includes applying the correct amount of base fertilizer, avoiding excessive single-application fertilization, increasing fertilization frequency, and utilizing slow-release fertilizers to minimize nitrogen loss and enhance nutrient utilization. While high-efficiency fertilizers present a viable solution for scientific fertilization, their widespread adoption among farmers is hampered by cost concerns. Additionally, increasing the frequency of top-dressing fertilization raises labor inputs and presents challenges in standardization. To address these issues, the implementation of subsidy policies and enforcement mechanisms is necessary to incentivize and standardize these practices. Rational crop rotation is an important way to reduce greenhouse gas emissions from farmland soils. With the same amount of fertilizer, N2O emissions from a roasted tobacco–corn rotation are reduced by more than half compared with those of continuous roasted tobacco crops (Jiang et al., 2020). According to the differences in the climate and soil conditions in different tobacco growing provinces, we should develop suitable emission reduction policies. To balance the reduction of agricultural film use with maintaining tobacco leaf yield, region-specific strategies are essential. In areas prone to droughts and low temperatures during the transplanting period, substantial reductions in agricultural film use may be challenging. Here, the focus should shift to effective recycling of waste agricultural film and avoiding the use of ultra-thin films. Concurrently, the trend towards planting mechanization, essential for large-scale production, faces obstacles in tobacco cultivation due to its labor-intensive nature. This challenge is particularly pronounced in major producing areas like Yunnan and Sichuan, where complex terrain limits large-scale mechanical operations. Therefore, in such regions, emphasis should be placed on small-scale farming and the widespread adoption of compact agricultural machinery to reduce labor costs. Sustainable tobacco production also relies heavily on supportive policies and robust regulatory systems. High standards set by cigarette companies for raw materials not only address consumer demands for food safety but also incentivize farmers towards scientific production practices. This approach indirectly reduces carbon emissions associated with the overuse of fertilizers and pesticides. Additionally, the establishment of specialized supervision departments at local tobacco stations can play a crucial role. By conducting regular visits and overseeing the planting process, these departments can ensure the implementation of low-carbon measures by farmers, thereby facilitating effective emission reduction at the source.
This study used the LCA method to account for the carbon footprint of tobacco production in China based on relevant national statistical data, and the calculation process considered the carbon emissions caused by the nine most important agricultural inputs in tobacco production as well as the greenhouse gas emissions from farmland, achieving a more comprehensive calculation measurement and comparison under the same standard. However, the calculation method of direct GHG emissions from farmland soils in this study refers to previous research results, and the differences in the climatic conditions and soil properties in the study area led to some deviations between the measured results and the actual data. Secondly, the pesticide used a single emission factor without further refinement, which would also cause some differences between the measured results and the actual values. In a subsequent in-depth study, the emission factors of each input should be refined, and carbon footprint calculation formulas that meet different research geographical conditions should be adopted so as to obtain more accurate carbon footprint values.
This study, employing the LCA method, meticulously analyzes the carbon footprint of various functional units in China’s tobacco production from 2004 to 2017, delineating its composition, influencing factors, and dynamic changes. The key findings and conclusions are as follows:
• The average values of the carbon footprint per unit area and the carbon footprint per unit yield of tobacco production in China from 2004 to 2017 were 4,098.99 kg CO2-eq∙ha−1 and 1.97 kg CO2-eq∙kg−1, respectively, and both showed an increasing trend with an increase in the years.
• The carbon footprints caused by fertilizer inputs in the tobacco production process were the highest at 24.31%–28.70% followed by agricultural film inputs at 21.27%–32.43%.
• Notable regional disparities were observed in the carbon footprints of tobacco production among different provinces. Jiangxi, Guangdong, Hunan, and Yunnan reported higher values for both per unit area and per unit yield. Conversely, Inner Mongolia, Hebei, Henan, Jilin, and Heilongjiang exhibited lower carbon footprints per unit area, alongside high yields and benefits.
In light of these findings, the study underscores the importance of scientific fertilization, minimizing agricultural film usage, strategic adjustment of tobacco planting layouts, and the acceleration of mechanization in tobacco cultivation as critical measures for reducing carbon emissions in China’s tobacco industry.
The original contributions presented in the study are included in the article/Supplementary Material, further inquiries can be directed to the corresponding authors.
YZ: Writing–original draft. YQ: Data curation, Writing–original draft. WDu: Data curation, Writing–original draft. WDo: Data curation, Writing–review and editing. XZ: Methodology, Writing–original draft. GY: Data curation, Writing–original draft. CL: Software, Writing–original draft. ZS: Validation, Writing–original draft. LX: Formal Analysis, Software, Writing–review and editing. LZ: Writing–review and editing. JT: Funding acquisition, Writing–review and editing.
The author(s) declare financial support was received for the research, authorship, and/or publication of this article. This research was funded by Science and Technology Projects of Yunnan Provincial Tobacco Company (2023530000241024), Science and Technology Projects of Henan Provincial Tobacco Company (2023410000240027) and China Tobacco Henan Industrial Co., LTD funded project (2022410000340099 and 2021410000340261).
We gratefully acknowledge the funding support from Science and Technology Projects of Yunnan Provincial Tobacco Company (2023530000241024), Science and Technology Projects of Henan Provincial Tobacco Company (2023410000240027), and China Tobacco Henan Industrial Limited Corporation funded project (2022410000340099, 2021410000340261).
Authors YQ and LX were employed by Sichuan Tobacco Company. Authors WDu and GY were employed by China Tobacco Henan Industrial Co., LTD. Authors XZ and LZ were employed by China Tobacco Guangdong Industrial Co., LTD.
The remaining authors declare that the research was conducted in the absence of any commercial or financial relationships that could be construed as a potential conflict of interest.
All claims expressed in this article are solely those of the authors and do not necessarily represent those of their affiliated organizations, or those of the publisher, the editors and the reviewers. Any product that may be evaluated in this article, or claim that may be made by its manufacturer, is not guaranteed or endorsed by the publisher.
Abbas, A., Mushtaq, Z., Ikram, A., Yousaf, K., and Zhao, C. (2023). Assessing the factors of economic and environmental inefficiency of sunflower production in Pakistan: an epsilon-based measure model. Front. Environ. Sci. 11. doi:10.3389/fenvs.2023.1186328
Abbas, A., Waseem, M., Ahmad, R., Khan, K. A., Zhao, C., and Zhu, J. (2022). Sensitivity analysis of greenhouse gas emissions at farm level: case study of grain and cash crops. Environ. Sci. Pollut. Res. 29 (54), 82559–82573. doi:10.1007/s11356-022-21560-9
British American Tobacco (2016). Responding to a changing world. Avaliable from: http://www.bat.com/group/sites/uk__9d9kcy.nsf/vwPagesWebLive/DO9DCL3P/$FILE/medMDAKJK4B.pdf.
Chen, Y. F., and Wang, Q. (2022). Analysis on the mechanism construction of waste plastic film recycling in yunnan province. J. Anhui Agric. Sci. 50 (06), 236–238+241. doi:10.11838/sfsc.1673-6257.19250
Cheng, Z. M., Xiang, J. Y., Cai, Y., Zuo, J., Huang, S., Zheng, M., et al. (2014). Research on different mulching methods for flue-cured tobacco production in deep hill area. Acta Agric. jiangxi. 26 (02), 111–114. doi:10.19386/j.cnki.jxnyxb.2014.02.029
Elahi, E., and Khalid, Z. (2022). Estimating smart energy inputs packages using hybrid optimisation technique to mitigate environmental emissions of commercial fish farms. Appl. Energy 326, 119602. doi:10.1016/j.apenergy.2022.119602
Elahi, E., Khalid, Z., and Zhang, Z. (2022). Understanding farmers' intention and willingness to install renewable energy technology: a solution to reduce the environmental emissions of agriculture. Appl. Energy 309, 118459. doi:10.1016/j.apenergy.2021.118459
Gao, C., Shao, X. H., Yang, X., Li, X. N., and Wu, W. B. (2022). Effects of biochar and residual plastic film on soil properties and root of flue-cured tobacco. J. Irrig. Drain. Eng. 148 (4). doi:10.1061/(asce)ir.1943-4774.0001673
Gelfand, I., Sahajpal, R., Zhang, X. S., Izaurralde, R. C., Gross, K. L., and Robertson, G. P. (2013). Sustainable bioenergy production from marginal lands in the US Midwest. Nature 493 (7433), 514–517. doi:10.1038/nature11811
Guizhou Provincial Committee of the Communist Party of China (2019). Green ecology leads the magnificent "turn" of modern tobacco and water agriculture -- A documentary of Guizhou Provincial Tobacco Monopoly Bureau (Company) Speeding up transformation and upgrading to help poverty alleviation. Theory Contemp. 3, 2–4+65.
Guo, Y. H., Tong, L. J., and Mei, L. (2022). Spatiotemporal characteristics and influencing factors of agricultural eco-efficiency in Jilin agricultural production zone from a low carbon perspective. Environ. Sci. Pollut. Res. 29 (20), 29854–29869. doi:10.1007/s11356-021-16463-0
Hussain, M., Zaidi, S. M. H., Malik, R. N., and Sharma, B. D. (2014). Greenhouse gas emissions from production chain of a cigarette manufacturing industry in Pakistan. Environ. Res. 134, 81–90. doi:10.1016/j.envres.2014.06.015
International Organization for Standardization (2018). ISO 14067: 2018: greenhouse gases carbon footprint of products-requirements and Guidelines for quantification and communication. Geneva: International Organization for Standardization.
Jiang, Y. Z., Liu, Q. L., Li, Z. H., Zhang, Y. G., Zou, Y., Zhu, J. W., et al. (2020). Effect of different planting patterns on N2O emissions characteristics in tobacco yellow soil. Soil. Fertil. Sci. China (04), 26–31. doi:10.11838/sfsc.1673-6257.19250
Jin, S. Q., Lin, Y., and Niu, K. Y. (2021). Driving green transformation of agriculture with low carbon:characteristics of agricultural carbon emissions and its emission reduction path in China. Reform (05), 29–37.
Ke, J., He, R., Hou, P., Ding, C., Ding, Y., Wang, S., et al. (2018). Combined controlled-released nitrogen fertilizers and deep placement effects of N leaching, rice yield and N recovery in machine-transplanted rice. Agric. Ecosyst. Environ. 265, 402–412. doi:10.1016/j.agee.2018.06.023
Li, B., Wei, K. C., Yi, J. M., and He, B. Q. (2017). Analysis of carbon footprint of cigarette based on life cycle assessment. Tob. Sci. Technol. 50 (06), 68–72. doi:10.16135/j.issn1002-0861.2016.0359
Dongfang, Y. (2022). Landmark events in 40 years of reform and development of the tobacco industry. East Tob. News (001). doi:10.28179/n.cnki.ndfyc.2022.000003
Lin, B. Q. (2021). Promoting carbon peaking and carbon neutral, how to make efforts in the next five years? Avaliable from: https://baijiahao.baidu.com/s?id=1693544927584530782&wfr=spider&for=pc.
Liu, G. S., and Huang, X. D. (2020). Practical technology guide for tobacco production in China. Beijing: China National Tobacco Corporation.
Montzka, S. A., Dlugokencky, E. J., and Butler, J. H. (2011). Non-CO2 greenhouse gases and climate change. Nature 476 (7358), 43–50. doi:10.1038/nature10322
Peng, B., Huang, Q., Elahi, E., and Wei, G. (2019). Ecological environment vulnerability and driving force of yangtze river urban agglomeration. Sustain 11 (23), 6623. doi:10.3390/su11236623
Sun, Z. Y., Sun, D. P., Yu, B. T., and Wang, Z. G. (2021). How does concurrent BusinessAffect Farmers’Production behavior of“One Family,Two Systems”?Empirical evidences from 1458 HouseholdQuestionnaires in five provinces of China. Chin. Rural. Econ. (06), 44–59.
Tian, L. A. (2020). Situation, limiting factors and suggestions of flue-cured tobacco production in the inner Mongolia Autonomous region. Central China Normal University.
Tian, P. P., Li, D., Lu, H. W., Feng, S. S., and Nie, Q. W. (2021). Trends, distribution, and impact factors of carbon footprints of main grains production in China. J. Clean. Prod. 278, 123347. doi:10.1016/j.jclepro.2020.123347
Tu, A. G., Xie, S. H., Zheng, H. J., Li, H. R., Li, Y., and Mo, M. H. (2021). Long-term effects of living grass mulching on soil and water conservation and fruit yield of citrus orchard in south China. Agric. Water. Manag. 252, 106897. doi:10.1016/j.agwat.2021.106897
Wang, Q., Li, X. Y., Zhang, Z. T., Tao, Z. L., and Tang, B. J. (2018). Carbon emissions reduction in tobacco primary Processing line: a case study in China. J. Clean. Prod. 175, 18–28. doi:10.1016/j.jclepro.2017.11.055
Wang, X., Zhao, X., Wang, Y. Q., Xue, J. F., Zhang, H. L., Xia, H., et al. (2017). Genome-wide analysis of gene expression provides new insights into cold responses in Thellungiella salsuginea. Resour. Sci. 39 (04), 713–722. doi:10.3389/fpls.2017.00713
Wang, Z. B., Zhang, H. L., Lu, X. H., Wang, M., Chu, Q. Q., Wen, X. Y., et al. (2016). Lowering carbon footprint of winter wheat by improving management practices in North China Plain. J. Clean. Prod. 112, 149–157. doi:10.1016/j.jclepro.2015.06.084
Wu, H. (2022). Integrated analysis of carbon, nitrogen and water footprints for major grain crops production in China. Nanjing Agricultural University.
Xu, X., Zhang, L., Chen, L., and Liu, C. (2020). The role of soil N2O emissions in agricultural green total factor productivity: an empirical study from China around 2006 when agricultural tax was abolished. Agric(Basel) 10 (5), 150. doi:10.3390/agriculture10050150
Xue, J. F., Pu, C., Liu, S. L., Zhao, X., Zhang, R., Chen, F., et al. (2016). Carbon and nitrogen footprint of double rice production in Southern China. Ecol. Indic. 64, 249–257. doi:10.1016/j.ecolind.2016.01.001
Yan, M., Cheng, K., Luo, T., Yan, Y., Pan, G. X., and Rees, R. M. (2015). Carbon footprint of grain crop production in China - based on farm survey data. J. Clean. Prod. 104, 130–138. doi:10.1016/j.jclepro.2015.05.058
Yang, C., Hu, P. Q., Diao, B. D., Cheng, J. H., and Cui, H. Y. (2021). Environmental performance evaluation of policies in main grain producing areas: from the perspective of agricultural carbon emissions. China Popul. Resour. Environ. 31 (12), 35–44. doi:10.12062/cpre.20210804
Yang, F., Meng, Y. D., Jiang, Y., Cui, Y., Li, R., Dong, Y., et al. (2015). Chemical fertilizer application and supply in crop farming in China in 2013. J. Plant. Nutr. Fertil. 21 (01), 217–225. doi:10.1016/j.jclepro.2015.05.058
Zafeiridou, M., Hopkinson, N. S., and Voulvoulis, N. (2018). Cigarette smoking: an assessment of tobacco's global environmental footprint across its entire supply chain. Environ. Sci. Technol. 52 (15), 8087–8094. doi:10.1021/acs.est.8b01533
Zhang, D., Guo, Y., Fan, Z., Hu, X., Hao, X., Fang, L., et al. (2023). Trade-offs between grain yields and ecological efficiencies in a wheat-maize cropping system using optimized tillage and fertilization management on the North China Plain. Environ. Sci. Pollut. Res. 30 (9), 24479–24493. doi:10.1007/s11356-022-23644-y
Zhang, D., Shen, J. B., Zhang, F. S., Li, Y. E., and Zhang, W. F. (2017). Carbon footprint of grain production in China. Sci. Rep. 7, 4126. doi:10.1038/s41598-017-04182-x
Zhang, W. F., Dou, Z. X., He, P., Ju, X. T., Powlson, D., Chadwick, D., et al. (2013). New technologies reduce greenhouse gas emissions from nitrogenous fertilizer in China. Proc. Natl. Acad. Sci. United. States. Am. 110 (21), 8375–8380. doi:10.1073/pnas.1210447110
Keywords: carbon footprint, tobacco, life-cycle assessment, global warming, emission reduction
Citation: Zheng Y, Qin Y, Duan W, Dong W, Zhang X, Yin G, Li C, Song Z, Xie L, Zhan L and Ti J (2024) Spatiotemporal variation of the carbon footprint of tobacco production from 2004 to 2017 in China. Front. Environ. Sci. 12:1331530. doi: 10.3389/fenvs.2024.1331530
Received: 01 November 2023; Accepted: 03 April 2024;
Published: 18 April 2024.
Edited by:
Zhen Liu, Nanjing Normal University, ChinaReviewed by:
Adnan Abbas, Nanjing University of Information Science and Technology, ChinaCopyright © 2024 Zheng, Qin, Duan, Dong, Zhang, Yin, Li, Song, Xie, Zhan and Ti. This is an open-access article distributed under the terms of the Creative Commons Attribution License (CC BY). The use, distribution or reproduction in other forums is permitted, provided the original author(s) and the copyright owner(s) are credited and that the original publication in this journal is cited, in accordance with accepted academic practice. No use, distribution or reproduction is permitted which does not comply with these terms.
*Correspondence: Lei Zhan, MzUwNjExNjMwQHFxLmNvbQ==; Jinsong Ti, dGlqaW5zb25nQGhlbmF1LmVkdS5jbg==
†These authors have contributed equally to this work and share first authorship
Disclaimer: All claims expressed in this article are solely those of the authors and do not necessarily represent those of their affiliated organizations, or those of the publisher, the editors and the reviewers. Any product that may be evaluated in this article or claim that may be made by its manufacturer is not guaranteed or endorsed by the publisher.
Research integrity at Frontiers
Learn more about the work of our research integrity team to safeguard the quality of each article we publish.