 Sneha Dhankar
 Gayatri Singh
 Krishan Kumar*
95% of researchers rate our articles as excellent or good
Learn more about the work of our research integrity team to safeguard the quality of each article we publish.
Find out more
ORIGINAL RESEARCH article
Front. Environ. Sci. , 26 February 2024
Sec. Toxicology, Pollution and the Environment
Volume 12 - 2024 | https://doi.org/10.3389/fenvs.2024.1324186
This article is part of the Research Topic Satellite Remote Sensing Data Processing and its Environmental Application View all 7 articles
The present study investigates the impact of urbanization on land surface temperature and air quality in Dehradun district of the Uttarakhand state in India. We utilized data from LANDSAT, TROPOMI, OMI, MODIS, MOPITT, and CHIRPS, for spatio-temporal and trend analyses along with the assessment of correlation matrix. Our findings revealed a significant increase in the built-up area of Dehradun district in 2023 as compared to 2003. This expansion was particularly prominent in the southern and south-eastern regions of the district. The findings highlight the impact of rapid urban expansion on land use and land cover, leading to a rise in land surface temperature (LST) and the formation of surface urban heat islands (SUHI). Notably, the study reveals distinct spatial and temporal patterns, with lower regions of Dehradun district experiencing higher temperatures and pollutant concentrations due to intensified urbanization. Dehradun city also emerged as a hotspot for nitrogen dioxide within the district. Long-term trends indicate a rise in formaldehyde and nitrogen dioxide, attributed to both urbanization and increasing temperatures, while carbon monoxide levels decrease due to reduced biomass burning and the adoption of cleaner household fuels. Correlation matrix analysis underscores the complex relationships between land use, temperature, and pollutants, with built-up areas exhibiting strong positive correlations with all pollutants. This comprehensive study highlights the importance of sustainable urban planning and management to mitigate the adverse effects of rapid urbanization on air quality and overall environmental health in the Dehradun district.
Numerous people are drawn to reside in cities because of the potential of the metropolitan setting. By 2050, two-thirds of the world’s population is expected to live in cities, according to reports from the UN (2019). Urbanization and industry are the main causes of the variability of the global climate. Natural land surfaces, which are normally made up of vegetation and permeable surfaces, have been transformed into high-density constructions and impermeable zones as a result of the world’s cities seeing a sharp rise in population Zeren Cetin et al. (2023). The use of different materials for building, roadways, and parking spaces, including asphalt, concrete, bricks, and tiles, is primarily responsible for the formation of these impermeable surfaces (Landsberg, 1981; Pandey et al., 2009). Heat, humidity, and pollution emissions, along with the thermal properties of the surfaces, all cause changes in the urban environment (Roth et al., 1989; Nguyen et al., 2019).
Yang et al. (2017) conducted a study focusing on the changes in land use/land cover (LUCC) and the thermal conditions in Changchun, China, over the past 3 decades. During this period, Changchun’s urban area expanded more than fourfold, leading to an increased proportion of urban heat island (UHI) regions. The thermal environment within the city displayed significant variability, even within smaller areas, demonstrating a strong positive correlation between land surface temperature (LST) and impervious surface area (ISA). Balew and Semaw, (2022) have concluded that Land-use and land-cover changes due to rapid urban expansion have led to variations in land surface temperature (LST) and the formation of Surface Urban Heat Islands (SUHI) in Addis Ababa city and its surrounding areas. The expansion of impervious surfaces (IS) and the degradation of vegetation cover have contributed to the increase in SUHI. The study highlights the importance of satellite images in analysing landscape dynamics, monitoring urban expansion, and understanding the impact of LULC changes on the environment and climate change. Piyush and Ghosh (2020) revealed unprecedented urban growth in Dehradun, India, primarily due to encroachment on agricultural land. They also reported transformation of vegetated areas into non-vegetated ones enhanced the land surface temperature (LST), while the shift from non-vegetated regions to vegetated areas decreased LST.
The process of urbanization also results in a rise in the local temperature which is associated with deteriorating air quality of that region (Lin and Zhu, 2018). Fuladlu and Altan (2021) examined how the LULC transformation contributed to the development of urban air pollution as well as the rise in land surface temperature (LST) and main air pollutants in Tehran. Morabito et al. (2016) found a substantial linear association between LST changes and built-up areas in various Italian towns. A comparable study conducted over Kuala Lumpur similarly reveals that whereas green spaces exhibit a decrease in LST, built-up areas tend to increase LST (Isa et al., 2017). According to a study conducted across several Punjabi cities, the average temperature in urban areas is greater than that in suburban and rural areas (Mukherjee et al., 2017). According to Pathak et al. (2021), Agra’s city center has a higher LST than the periphery.
Numerous research (Lai and Cheng, 2009; Alseroury, 2015; Fuladlu and Altan, 2021; Ngarambe et al., 2021) have shown a strong association between LST and air pollutants, such as hydrocarbons, carbon monoxide, nitrogen oxides, and sulfur dioxide. A rise in the concentrations of air pollutants, such as sulphur dioxide, nitrous oxide, and hydrocarbons, has been attributed to various factors such as the fast development of cities, industrialization of the region, coal mining, coal-fired power plants, extensive agricultural activities, proliferation of transportation methods, and rapid population growth (Ghosh and Majee, 2000; Kean et al., 2000; Khare and Nagendra, 2007). According to Aghazadeh et al. (2023), the population density, airport, and surface urban heat island (SUHI) had the strongest negative link with NDVI. According to Hereher’s (2022) research, CO2 and NO2 have a positive correlation with urban heat island intensity (UHII). According to Bonn et al. (2016) and Arabi et al. (2015), adding more green spaces, green roofs, and woodland areas to urban areas may help reduce particulate pollution; nevertheless, lowering NO2 mixing ratios would require lowering traffic emissions. According to Panda et al. (2018) studies, more trees should be planted in order to reduce air pollution, as indicated by the trees’ air pollution tolerance index (APTI). Gautam et al. (2020) have examined the amount of air pollutants exposure of individuals during the bonfire activities in Gujarat (India). Their study found that PM2.5, PM10, and CO concentrations were higher than permissible limit, which might cause a serious negative impact on human’s health. Their study emphasizes attention to the major consequences of having bonfires in rural India and suggested for lowering exposure levels that includes utilizing high-quality fuel, avoiding burning plastics and chemicals, combustion materials should be clean and dry, and installing chimneys in enclosed spaces. Coarser particles were produced more closer to the source than finer ones, and PM10 exposure is more harmful to human health than PM2.5. Gupta et al. (2022) found heavy metals exceeding permissible limit in road dust of Lucknow city. Heavy metals such as Nickel (Ni), Chromium (Cr), Cadmium (Cd), and Arsenic (As) were mostly caused by industrial operations, whereas the most important anthropogenic source of Manganese (Mn), Zinc (Zn), Copper (Cu), and Lead (Pb) was vehicular emissions. The central and southwest regions of Lucknow were most polluted of all.
Kumar et al. (2023) study emphasized a number of the health impacts of air pollution, such as heart and respiratory problems, depression, mood disorders, mental and psychiatric disorders, autoimmune diseases. Their study also focussed on relationships between air pollutants and their risk factors for health and the environment; chemical composition of aerosol and fine particulate matter; effects of air pollution and exposure on human health; and modelling analytical methods to mitigate and eliminate the effects of air pollution. Wright et al. (2023) concluded that extended exposure to ambient air pollution is linked with high risk of cardio and respiratory disease in China cities. The risk of serious respiratory and cardiovascular disorders is positively correlated with ambient air pollution, especially SO2 and Ozone (O3).
Environmental degradation has occurred in Dehradun as a result of the city’s uncontrolled expansion, which has had a negative influence on the ecosystem overall and especially in vegetated areas (Gupta and Goyal, 2014). According to Nautiyal et al. (2021), there was a rise in Dehradun’s average LST of 14.8% between 2000 and 2010 and 11.8% between 2010 and 2019. The primary causes of this rise in LST values were identified as urban densification, urban geometry, and man-made heat sources like air conditioners, transportation, and commercial activity. The Land Use Land Cover (LULC) variations in Dehradun city between 1991 and 2019 were studied by Piyoosh and Ghosh (2020). According to their findings, there was a noticeable increase in the population of the urban region, and vegetative areas were turned into inhabited areas, which also caused an increase in LST. Deep et al. (2019) examined the Dehradun city’s air quality between 2011 and 2014, determining the concentrations of pollutants such SO2 and NO2 as well as particulate matter (PM10) and SPM. They stated that during the winter, the levels of PM10 and SPM were higher than the federal regulations.
Our study departs from earlier research on Dehradun, which was frequently restricted to short time periods and concentrated mostly on the city of Dehradun (Piyoosh and Ghosh, 2020; Kansal et al., 2023). By including the entire Dehradun area, we close a major study gap and make important comparisons between urban and rural air quality possible. Furthermore, we use the higher-resolution TROPOMI data, whereas earlier research (Deep et al., 2019) depended on older sensors. Notably, our study spans from 2005 to 2022, providing a comprehensive view of air pollutant trends. Furthermore, we bridge another gap by considering multiple pollutants (NO2, HCHO, CO, tropospheric O3) and environmental factors such as Land Surface Temperature (LST) offering a more holistic understanding of the interdependence of these factors over Dehradun district and overall environment health in the region.
Therefore, the purpose of our study is to evaluate the spatiotemporal variations in air pollutants and other environmental parameters as well as the changes in Land Use and Land Cover (LULC) in the Dehradun area between 2003 and 2023. It also looks at seasonal changes in these factors from 2019 to 2023. Additionally, we analysed deep into the trend of air pollution in Dehradun district from 2005 to 2023. The primary cause of the Dehradun district’s declining air quality is changes in land use and land cover. The region’s general environmental health is also negatively impacted by the ongoing growth of the built-up population and a rise in anthropogenic activities. This study draws attention to this important problem and offers insightful information to decision-makers. It is possible to limit uncontrolled urban sprawl and lessen its negative effects on the environment in the Dehradun district by adopting educated action. This is especially important for Himalayan states like Uttarakhand, which are extremely sensitive to changes in the environment and have a delicate ecosystem.
Dehradun district lies between the latitude 29°95′N to 30°99′N and longitude 77°57′E to 78°31′E. Dehradun district is situated in a region that is bordered on the east by the Ganges River and the west by the Yamuna River. To the north, there is Himalayan Range while to the south of the district, the Shivalik Range is situated. It is one of the most populous districts of Uttarakhand state, covering an area of 3,088 km2 and population of 1.6 million in 2011 with population density 549 persons per km2 (Census of India, 2011) which has now increased to be 2.25 million in 2023 (Dehradun population, 2023). Elevation of Dehradun district ranges from 269 m to 3,062 m Figure 1.
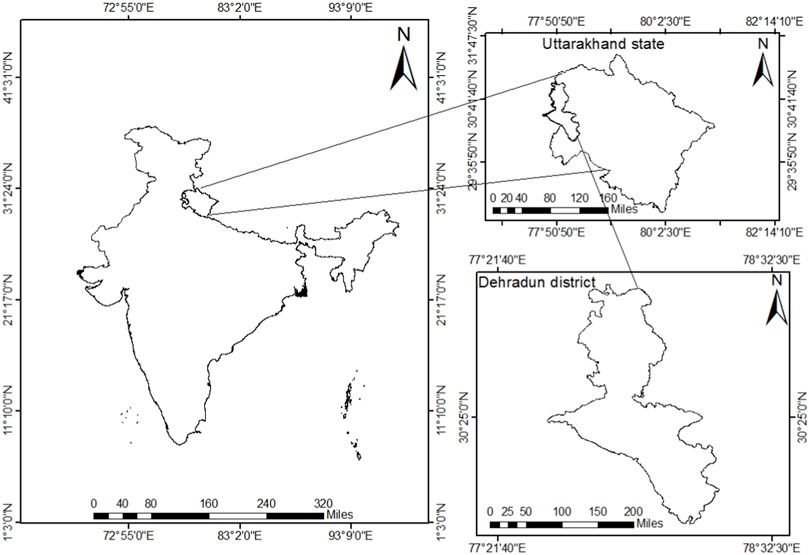
FIGURE 1. Study area India, Uttarakhand state Dehradun district.
This district is divided into 7 tehsils, 6 blocks along with 767 villages. The minimum temperature during extreme winter goes to 3.6°C while maximum goes upto19.3°C (January month) and during extreme summer (June month) minimum temperature rises up to 29.4°C while maximum rises up to 34.4°C. The majority of the annual rainfall, i.e., 2073.3 mm (annual average), occurs during the period from June to September Anand SharmaSaklani (2012).
We have classified our study area using the LANDSAT 5 images for the years 2003 and 2013. LANDSAT 5 is a NASA-built satellite that was launched in 1984. It has the MSS and TM sensors that generate images with six different bands, each with a resolution of 30 m (1–5, and 7). It also has one thermal band (6).
LANDSAT-8 dataset was used to classify our study area for the year 2023. On 11 February 2013, the United States National Aeronautics and Space Administration (NASA) launched the Landsat-8 satellite as part of a joint NASA-USGS project. The payload of the Landsat 8 satellite is composed of the Operational Land Image (OLI) Sensor and Thermal Infrared Sensor. The OLI and TIRS sensors provide a global coverage of the landmass with spatial resolution of 30 m for visible, NIR and SWIR, 100 m for thermal, and 15 m for panchromatic.
Supervised classification method was used to classify our study area into different categories-Dense forest, Open forest, Agriculture land, Fallow land, Built up, Open space/shrub land and water body/dry river bed.
Data for Nitrogen dioxide (NO2), Formaldehyde (HCHO), Carbon monoxide (CO) and tropospheric ozone was collected using the Copernicus Sentinel 5-Precursor Tropospheric Monitoring Instrument (S5-P/TROPOMI). The European Space Agency (ESA) launched this Sun synchronous satellite on 30th October 2017, orbits the Earth at an altitude of 824 km. It passes over the equator in the afternoon, i.e. 13:30 (Pakkattil et al., 2021; Stavrakou et al., 2021). It has a higher spatial resolution data of 7 km by 3.5 km (now 5.5 km by 3.5 km) at nadir. TROPOMI, the sole payload aboard the Sentinel 5P satellite, is equipped with four spectrometers that assess radiance across a total of eight spectral bands, encompassing the ultraviolet (UV) to near-infrared (NIR) range. This wide range helps TROPOMI to measure atmospheric concentration of various trace gases like nitrogen dioxide, formaldehyde, carbon monoxide, methane and ozone (Veefkind et al., 2012; De Smedt et al., 2021). Level 3 data spanning 4 years, from January 2019 to December 2023, was obtained for Nitrogen dioxide (NO2), Formaldehyde (HCHO), and Carbon monoxide (CO). The data was processed to create the monthly averaged spatial plots across all 4 years, i.e. 2019-23 with a 5 km resolution. This data was further processed to create spatial maps depicting the distribution of these atmospheric species and to generate a temporal series covering the study period.
To effectively analyse trends in the present study, a substantial 15-year dataset for HCHO and NO2, i.e., from January 2005 to December 2021 was acquired from the OMI sensor, as a longer time period is crucial for detecting increasing or decreasing patterns over time. OMI sensor is onboard NASA’s Aura satellite. It was launched in 2004 through a collaborative effort between Dutch and Finnish institutions (Levelt et al., 2006). This hyperspectral imager operates in a push broom configuration. OMI covers a wide swath of 2,600 km, with spatial resolutions ranging from 13 × 24 km2 to 28 × 160 km2 from Nadir to the outermost swath angle (Millet et al., 2008). It functions as a near UV/Visible spectrometer, capable of measuring various trace gases in the atmosphere. Data for HCHO and NO2 of the OMI satellite sensor was procured from the Giovanni which is an online data system developed by NASA GES DISC. The monthly data were downloaded in ASCII format. Microsoft Excel was used for the time series plot from January 2005 to December 2021 for the Dehradun district.
In order to conduct a comprehensive trend analysis of for CO (Carbon Monoxide) in the current study, an extensive dataset was obtained from the MOPITT sensor which covered the period from January 2005 to December 2019. MOPITT, an instrument on NASA’s Terra satellite, monitors global carbon monoxide (CO) levels. It has a swath of over a 640 km swath and captures data with a 22 km by 22 km spatial resolution at nadir (Drummond et al., 2010). Its algorithm employs optimal estimation to derive CO vertical profiles from observed radiance and a priori data. The profile is then integrated to obtain the total column values of CO (Deeter et al., 2003). We used MOP03JM.009, a monthly gridded MOPITT product, to analyse temporal variations in CO over the Dehradun district.
MODIS, a Moderate Resolution Imaging Spectroradiometer, is deployed on NASA’s Terra and Aqua satellites, which were launched in 1999 and 2002, respectively. In our study we utilized MODIS Aqua data. Aqua orbits at 705 km altitude, having a wide swath of 2,330 km. MODIS captures data across 36 spectral bands (spanning wavelength from 0.405 to 14.385 μm) at various spatial resolutions: from 250 m to 1,000 m (Justice et al., 2002). In our analysis, we utilized MODIS Aqua data (MYD11A1.061) to acquire land surface temperature (Day) at 1 km resolution over Dehradun and subsequently plotting the seasonal average.
For the land use land cover (LULC) classification, we have used the Maximum Likelihood Classifier (MLC) method of supervised classification. The study area was classified into seven classes, namely, Dense Forest, Open Forest, Agriculture, Fallow Land, Built-Up, Water Body, and Open Space. This classification technique is based on the affinity of the spectral signature of a targeted pixel to the specific class (Otukei and Blaschke, 2010). Presuming that each classification is chosen based on the training area function has a normal distribution as its correspondence, and these statistics are used to compute the likelihood that the area to be classed will be assigned (Cabral et al., 2018). Each pixel’s reflectance value is assigned to the class for which it has the highest probability of resembling a signature under a probability-based weighting scheme (Strahler, 1980; Yuan et al., 2005). The accuracy assessment was performed using the stratified random point generation method, which involved generating 50 sample points for each class to obtain a confusion matrix and Kappa statistics for the classified image.
For air pollutants data, TROPOMI data of atmospheric species including HCHO, NO2, tropospheric O3 and CO for Dehradun district was acquired from Google Earth Engine (GEE) at the resolution of 5 km. The seasonal spatial maps were plotted using python depicting the averaged data over a 5-year (2019–2023) period. For long term time sequence plots and trend analysis OMI data for HCHO and NO2 as well as MOPITT data for CO were used from 2005 onwards. Additionally, seasonal spatial maps of averaged 5-year (2019–23) MODIS LST data were generated using python to observe spatial changes in LST across different seasons over Dehradun district. Correlation study involves datasets of LULC classes along with the temperature and atmospheric species data. The Census of India data was also utilized to examine changes in the fuel usage pattern in Dehradun district from 2001 to 2011.
The scatter plot comparing HCHO data from TROPOMI and OMI sources reveals a suboptimal R-squared value which indicates a weak correlation Figure 2. However, when NO2 is considered there is a significant enhancement in the correlation. This improvement suggests that OMI data can effectively complement TROPOMI data for a comprehensive and prolonged study of these trace gases. Given that TROPOMI data is only available up to 2019, the utilization of OMI data becomes crucial for conducting long-term analyses. Notably, the moderate R-squared value for HCHO coupled with a good R-squared value for NO2 strengthens the case for incorporating OMI data for trend analyses. The ability of OMI to capture the broader patterns observed in TROPOMI data further supports its applicability in investigating long-term trends of these trace gases.
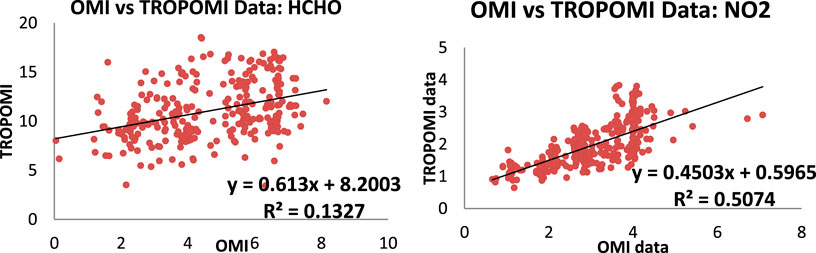
FIGURE 2. Scatter plot between TROPOMI and OMI data for HCHO and NO2.
The validation process also involved comparing MODIS Land Surface Temperature (LST) data with corresponding air temperature data collected at specific sites Figure 3. The mean LST was computed by averaging Aqua day-time and night-time LST values for the pixel corresponding to the air temperature collection site. The resulting scatter plot, depicting the relationship between mean MODIS LST and mean air temperature, indicates a robust agreement between the two variables, supported by a high R-squared value of approximately 0.9. The high level of agreement suggests that MODIS LST can effectively serve as a reliable alternative to air temperature in investigating the temperature-related dynamics of air quality.
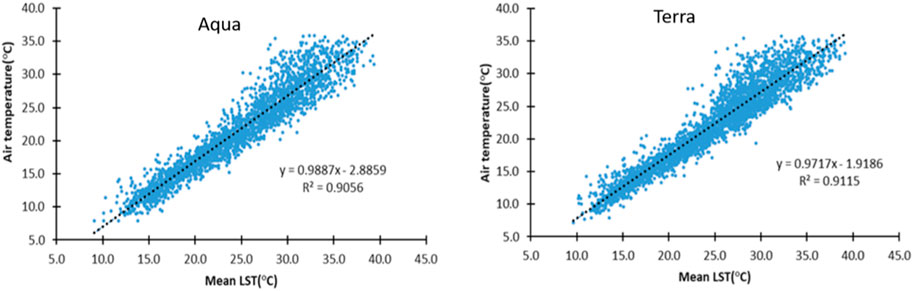
FIGURE 3. Scatter plot between the MODIS LST data and the air temperature from Aqua and Terra satellites.
In the course of approximately 20 years, significant alterations in the LULC pattern have been observed in Dehradun district. It can be observed that the urban area of Dehradun has expanded significantly. In the year 2000, Dehradun regarded as the capital of Uttarakhand, which resulted in a population boom and a number of urban activities. Heavy suburban construction was done during this time period to accommodate the immigrants and new roles. The built-up increase took place in the south and south-east of the city (Figure 4) during periods (2003–2013) and (2013–2023). The flat geography of these locations made them easier to build in, and they were also traversed by the state and national roads that connected Dehradun to the rest of Uttarakhand and other significant towns. Urban expansion in the south and west of Dehradun has been greatly sparked by the existence of natural obstacles in the city’s northern direction (Maithani, 2020).
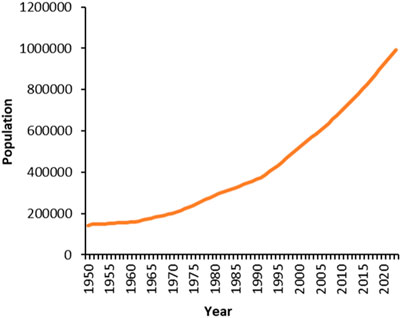
FIGURE 4. Trend of population growth in Dehradun over the years.
Between the years 2013–2023, the built-up area in Dehradun district increased from 1.4% to 8.9%. The percent of dense forest area has shown a decline from 20.9% to 18.7% during time period of 2003–2023. Simultaneously, percent of open forest area has also been declined from 62.7% to 60.6% (Figure 5).
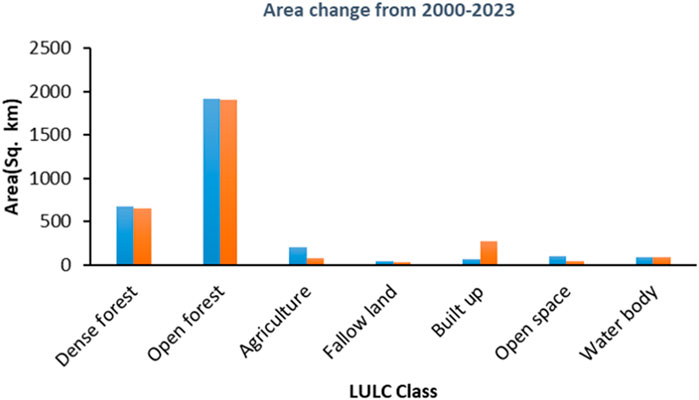
FIGURE 5. Percentage change in land use and land cover categories in Dehradun district (2000–2019).
As urbanization increases in Dehradun, population growth (in 1950–1,39,000 to 993,000 in 2023), industrial growth and employment expansion have a considerable impact on land use and land cover (Figures 4, 6). Figure 6 illustrates that the growth of MSMEs has doubled from 2008 to 2022, resulting in a proportional increase in employment over the last 14 years (http://mddaonline.in/wp-content/uploads/2023/04/Dehradun-Master-Plan-2.0A.pdf). As industries multiply, the need for larger and improved infrastructure and transport systems arises. This process leads to the development of urban areas, consuming land for residential, commercial, and industrial purposes and resulting in the conversion of agricultural or natural landscapes into industrial regions an impact directly influencing land use.
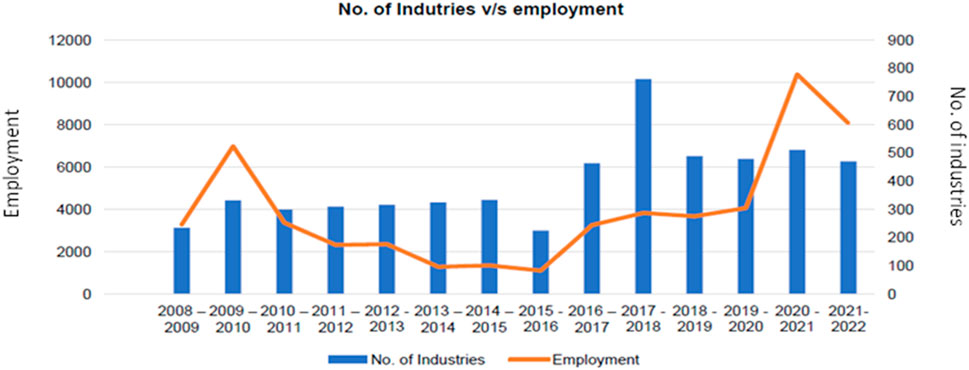
FIGURE 6. Growth of the industries MSME sector and employment generation in Dehradun.
The seasonal average of MODIS LST (Land Surface Temperature) reveals that the maximum temperature is observed in the pre-monsoon season, while the minimum temperature is noted during the winter months. Spatially, the southern and south-eastern regions of Dehradun district exhibit elevated temperatures as compared to the northern part of the district as shown in Figure 7. The upper Dehradun region also boasts higher elevation which may account for the lower temperatures in the upper regions of the Dehradun district (Figure 8). After closely examining the land surface temperature plots, it is evident that Dehradun city stands out prominently in the spatial plots. The city experiences elevated temperatures compared to surrounding areas.
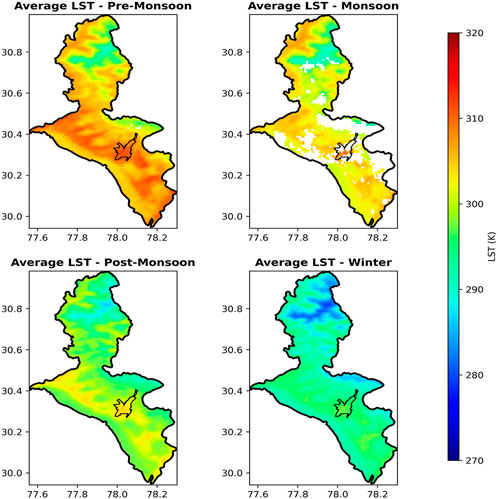
FIGURE 7. Five year (2019–2023) seasonal average of MODIS LST over Dehradun district.
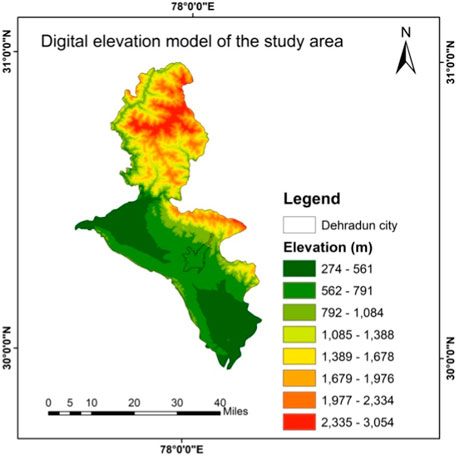
FIGURE 8. Digital elevation model for Dehradun district.
Upon careful observation, it becomes evident that higher elevations on maps generally experience lower temperatures. However, Dehradun city also demonstrates high temperatures comparable to the lowest elevation within the Dehradun district. The spatial maps of the air pollutants including HCHO, NO2, CO and tropospheric ozone reveal that the northern regions of Dehradun district exhibit lower pollution levels compared to the lower regions throughout the year whereas the south and south-eastern region of the Dehradun district exhibit the higher levels of pollutants (Figures 9–11). This highlights the impact of anthropogenic activities on the air quality of the study region.

FIGURE 9. Five year (2019–2023) seasonal average of TROPOMI NO2 over Dehradun district.
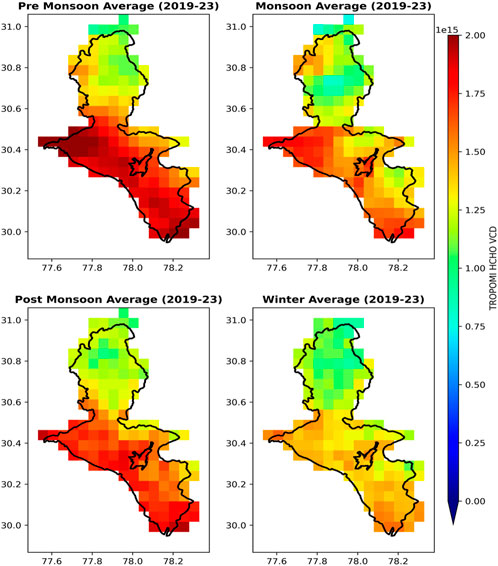
FIGURE 10. Five year (2019–23) average spatial distribution of TROPOMI formaldehyde (HCHO) levels in Dehradun district.
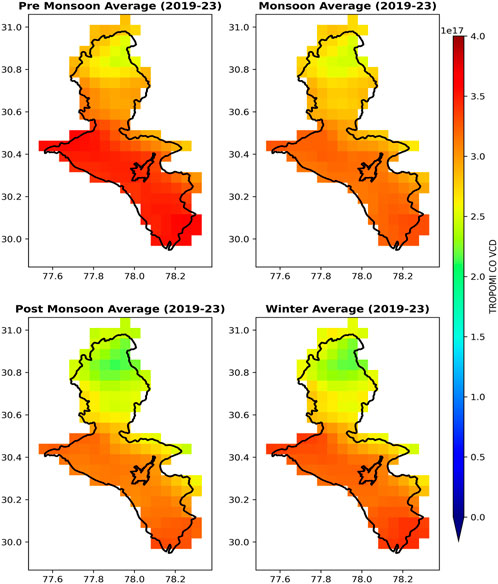
FIGURE 11. Five year (2019–23) average spatial distribution of TROPOMI carbon monoxide (CO) levels in Dehradun district.
Spatial plots of nitrogen dioxide (Figure 9) reveal Dehradun city as a prominent nitrogen dioxide hotspot in Dehradun district. This observation indicates that urbanized areas are the primary source of nitrogen dioxide (Duncan et al., 2016). Furthermore, nitrogen oxide levels are highest during the winter and pre monsoon months. Elevated pollution levels in the lower regions can be attributed to extensive urbanization.
Spatial plots of formaldehyde indicate that maximum HCHO levels occur during the summer months, especially in the southwest region of Dehradun district, where dense forests are present (as shown in Figure 12). This observation aligns with the well-established fact that formaldehyde is mainly emitted from biogenic sources. However, anthropogenic activities also contribute to formaldehyde levels, explaining the higher concentrations in the southern and south-eastern regions of Dehradun district characterized with high built up area. Spatial plots of carbon monoxide also show the highest concentrations of CO in the winter and summer months (Figure 11).
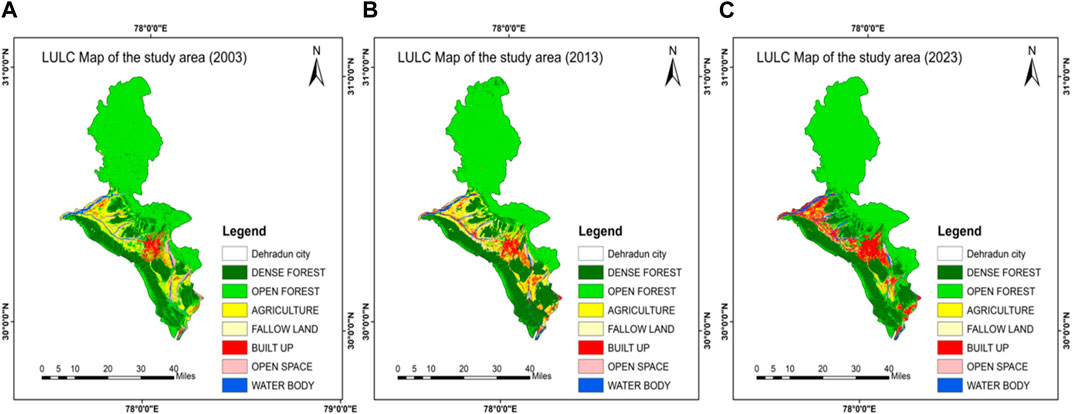
FIGURE 12. Land use and land cover changes in Dehradun district (A) 2003, (B) 2013, (C) 2023.
The seasonal variation in tropospheric ozone levels reveals a distinctive pattern in the Dehradun region (Figure 13). During the summer months, higher tropospheric ozone concentrations are observed in the lower regions of Dehradun district. In contrast, during post-monsoon months, elevated ozone levels are noted in the North East region of Dehradun. Interestingly, except for the post-monsoon period, the lower Dehradun region consistently exhibits higher tropospheric ozone values throughout the rest of the seasons, including pre-monsoon, monsoon, and winter months. Overall the maximum concentration of tropospheric ozone is observed in the post monsoon season.
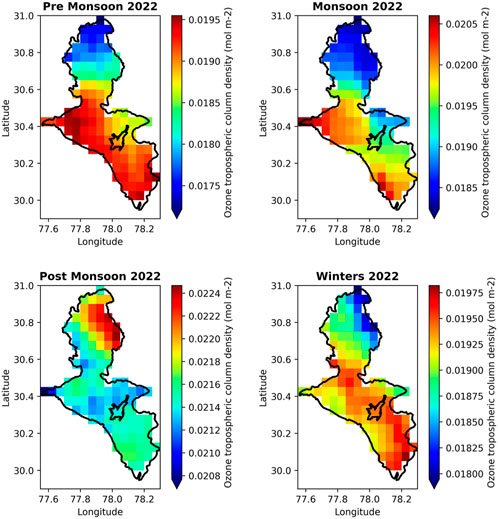
FIGURE 13. Average spatial distribution of TROPOMI tropospheric ozone levels in Dehradun district.
In Dehradun, distinct temperatures and pollutant levels are evident in the lower and upper regions. The lower region experiences higher temperatures and increased pollutants, while the upper region has lower temperatures and reduced air pollutant concentrations. Studying the temporal variations separately for each region is crucial for comprehending the patterns. Figure 14 shows the long term trends of Land Surface Temperature (LST) (Day) from January 2003 to December 2022 of MODIS sensor onboard Aqua and Terra in Dehradun District. The plots reveal a consistent trend where the lower region of Dehradun consistently records higher temperatures as compared to its upper reaches. Significantly, the slope values validate this observation, highlighting a more pronounced temperature increase in lower Dehradun. This analysis highlights the enduring temperature disparity between the lower and upper regions of Dehradun throughout the specified timeframe. Specifically, concerning Terra MODIS LST data, the substantial difference in slopes further corroborates the observation which emphasizes that the slope of lower Dehradun is significantly higher than that of upper Dehradun. This additional detail reinforces the noted temperature dynamics between the two regions.
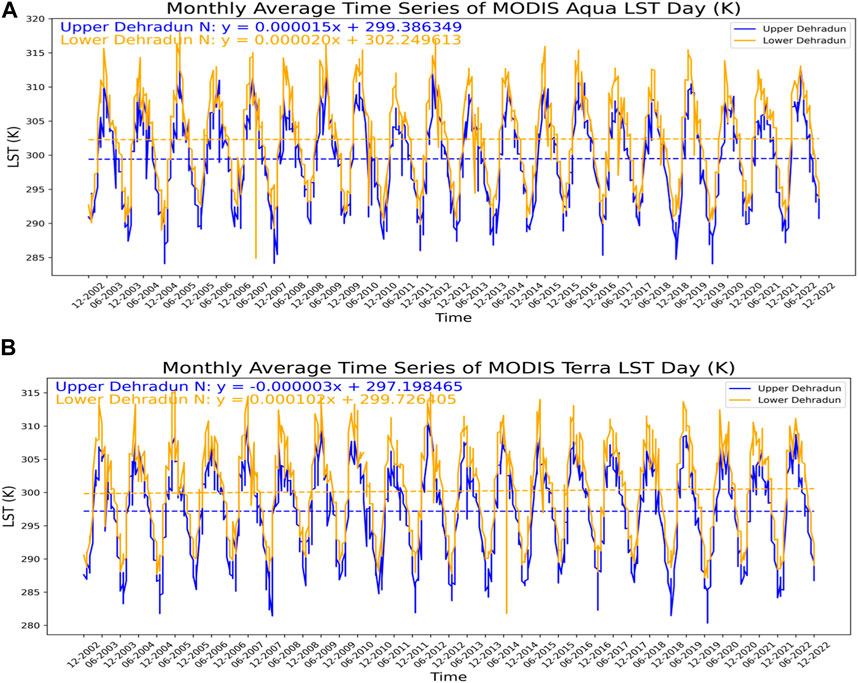
FIGURE 14. Long term trends of Land Surface Temperature (LST) (Day) from January 2003 to December 2022 of MODIS sensor onboard (A) Aqua and (B) Terra in Dehradun District.
Likewise, the upper and lower regions of Dehradun exhibit varying levels of air pollutants. Figure 15 displays a 4-year (2019–2022) monthly averaged temporal series of TROPOMI data for formaldehyde, nitrogen dioxide, tropospheric ozone and carbon monoxide, revealing seasonal fluctuations in air pollutant concentrations throughout the Dehradun district. The lower region of Dehradun consistently shows higher pollutant levels compared to the upper region, as evident in the seasonal spatial plot. Further analysis of the temporal series of pollutants in both lower and upper regions of Dehradun (Figure 15) indicates that nitrogen dioxide is consistently higher in lower Dehradun throughout the entire study period compared to upper Dehradun. The same holds true for carbon monoxide. Formaldehyde is also higher in lower Dehradun, although the concentration difference between both regions is less pronounced, as formaldehyde is released from biogenic sources which are also present in the upper regions of Dehradun (Figure 12). Tropospheric ozone exhibits higher levels in the lower region, especially during the summer months, but having the lowest difference between lower and upper Dehradun levels suggesting a regional phenomenon independent of local sources and sinks.

FIGURE 15. TROPOMI derived temporal variations of (A) Nitrogen Dioxide, (B) Carbon Monoxide, (C) formaldehyde, and (D) tropospheric ozone in lower and upper Dehradun District (2019–2022).
We also conducted an analysis of the long-term trends in formaldehyde (HCHO) and nitrogen dioxide (NO2) utilizing OMI data, as depicted in Figure 16. The time sequence plot (Figure 16A) illustrates OMI NO2 data from 2005 to 2021 and TROPOMI NO2 data from 2019 to 2022. Despite potential errors in OMI data introduced after a few years of operation due to the row anomaly (De Smedt et al., 2021), it remains valuable in capturing broad patterns of maxima and minima, enabling its utilization for trend analysis of pollutants across the study region. The trend analysis of a long-term temporal series of OMI data for nitrogen dioxide in Dehradun city indicates a rising trend in the district (Figure 16). OMI data tends to overestimate NO2 values compared to TROPOMI values over the Dehradun district (Figure 16). Furthermore, Figure 17 demonstrates that OMI data successfully captures the difference between lower and upper Dehradun, highlighting higher NO2 levels in lower Dehradun in OMI data as well.
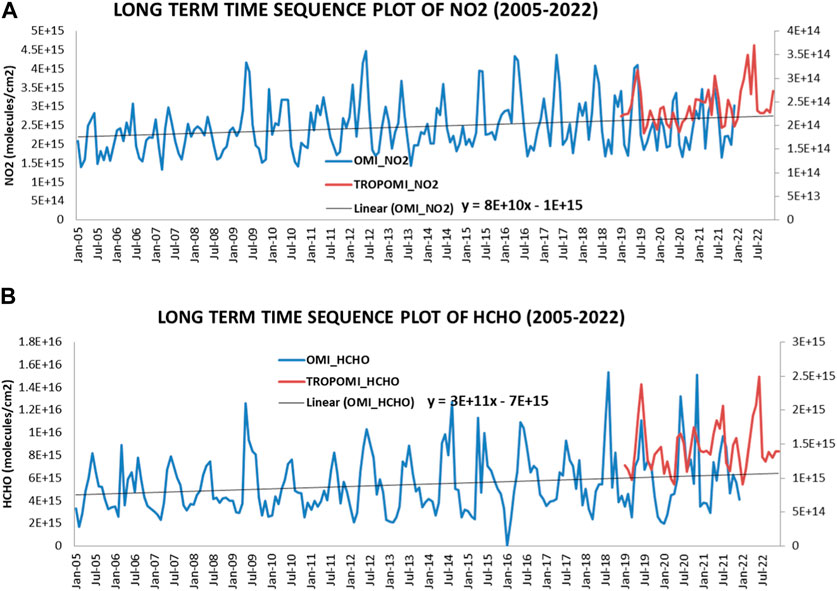
FIGURE 16. Long-term time series (2005–2022) of (A) Nitrogen dioxide (NO2) and (B) Formaldehyde (HCHO) levels in Dehradun district.
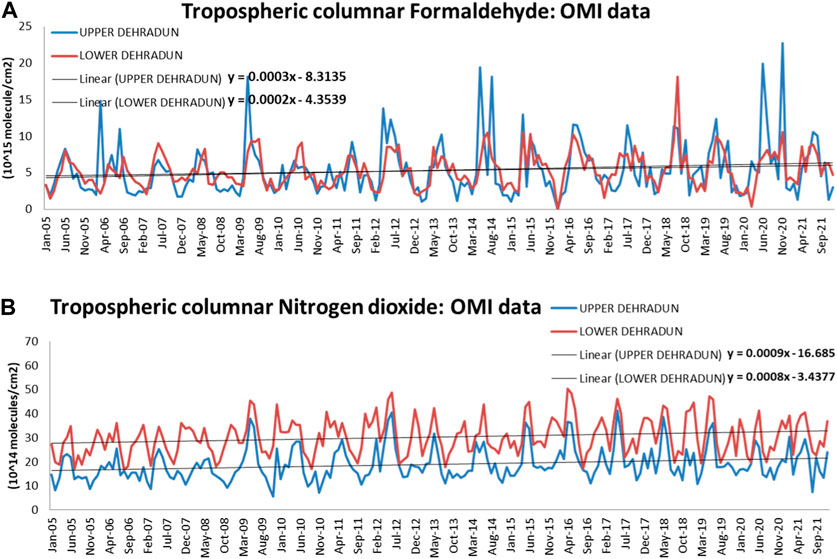
FIGURE 17. Long-term time series (2005–2022) of (A) Formaldehyde (HCHO) and (B) Nitrogen dioxide (NO2) levels in the lower and upper regions of Dehradun district.
Figure 16B displays the time sequence plot for OMI formaldehyde (HCHO) data spanning from 2005 to 2021 and for TROPOMI HCHO data from 2019 to 2022. Similar to NO2, OMI data effectively captures the overall pattern of HCHO’s maxima and minima across the study region. The monthly average formaldehyde time sequence plot from OMI data indicates an upward trend in the Dehradun district (Figure 16B). HCHO emissions can originate from biogenic, pyrogenic, or anthropogenic sources (Zarzana et al., 2018; Biswas et al., 2019; Su et al., 2019; Zhang et al., 2022). Since pyrogenic activities are not predominant in the Dehradun district, the major sources of HCHO emissions are likely to be either biogenic or anthropogenic. The change detection analysis (Section 3.1) revealed a significant increase in the “built-up” land class in the last 2 decades in Dehradun district. This rise in built-up areas has contributed to the escalating temperatures across the region, potentially leading to higher biogenic emissions. This suggests that the increasing trend in HCHO can be attributed to the combined impact of urbanization and rising temperatures over the study region, influencing both anthropogenic and biogenic emissions of HCHO. However, the HCHO level difference between the lower and upper regions of Dehradun is not captured in OMI data, as observed in Figure 17, while TROPOMI data does exhibit this difference. Thus, it is further confirmed that the OMI data performs well for NO2, but its performance for HCHO, as indicated by the scatter plots and R2 values of OMI vs. TROPOMI, is not as robust (Figure 2).
Long-term temporal analysis revealed an increase in both formaldehyde (HCHO) and nitrogen dioxide (NO2) over the Dehradun district. However, no such increasing trend is observed in the case of carbon monoxide (Figure 18), rather a decreasing trend is observed. This is possibly due to reduced biomass burning (which is a major source of carbon monoxide emissions in the region) and the growing adoption of LPG as the preferred household fuel choice throughout the Dehradun district. Figure 19 shows the increased LPG usage among households from 2001 to 2011 (Census of India). This trend has been further accelerated by schemes like Ujjwala yojana. Ujjwala Yojana was launched in 2016 by government of India to promote the use of LPG as a household fuel.
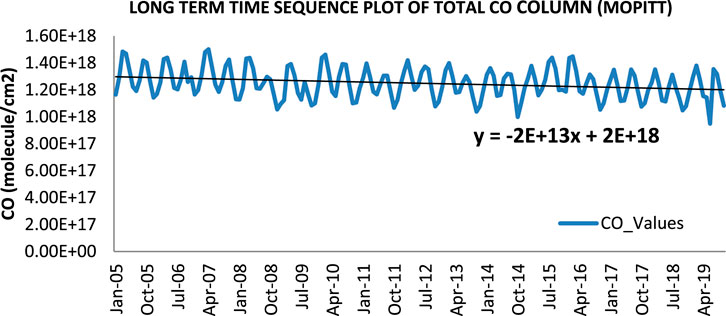
FIGURE 18. Long-term time series of total column carbon monoxide (CO) levels in Dehradun district.
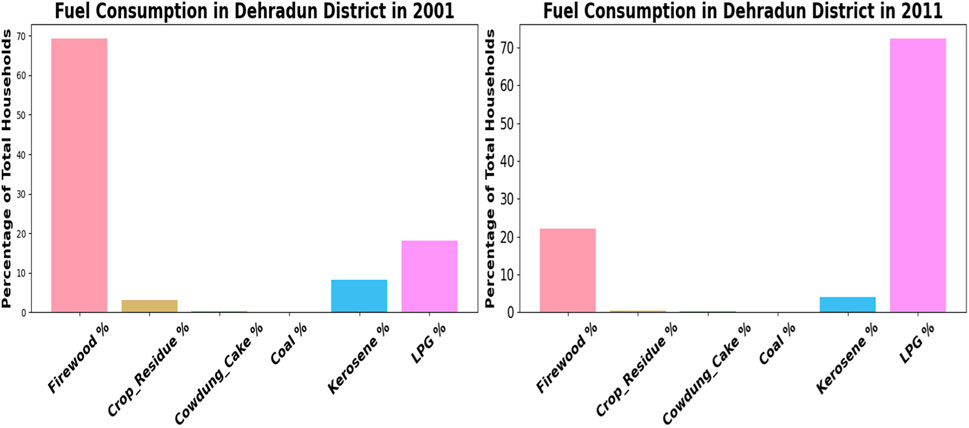
FIGURE 19. Fuel consumption in Dehradun district in 2001 and 2011 (Census of India data).
The correlation table (Table 1) illustrates the relationships between the percentage of land use classes, land surface temperature and air pollutants. Various land use and land cover (LULC) classes exhibit correlations with temperature and pollutants, providing insights into their intricate connections. Among LULC classes, built-up areas demonstrate positive correlations with all pollutants. Particularly noteworthy is the observation that built-up areas exhibit the highest correlation with temperature compared to other LULC classes. Additionally, built-up areas show the maximum correlation with NO2, aligning with the understanding that anthropogenic sources predominantly contribute to NO2 levels. HCHO displays its highest correlation with dense forest, supporting the theory that biogenic emissions significantly contribute to HCHO concentrations. Furthermore, CO exhibits maximum correlations with both dense forest and built-up areas, highlighting its dual sources from secondary formation through biogenic sources and primary anthropogenic emissions. Notably, formaldehyde shows a high correlation with carbon monoxide (0.934), emphasizing their interdependence. HCHO oxidation contributes to CO formation, and CO, in turn, aids in the photochemical production of HCHO. Nitrogen dioxide (NO2) displays a significant correlation with both HCHO and CO (0.863 and 0.890 respectively), indicating associated photochemistry and sources. Remarkably, pollutants exhibit a strong correlation with land surface temperature, revealing higher concentrations in regions with elevated temperatures, such as the lower or plain areas of Dehradun district, attributed to increased urbanization.
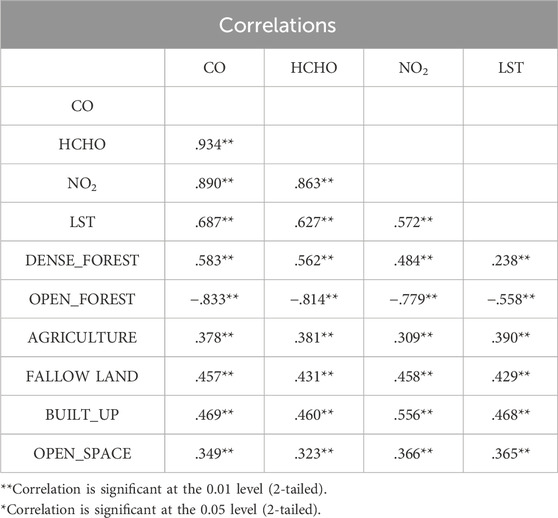
TABLE 1. Correlation matrix of air pollutants and temperature with different LULC classes.
In conclusion, the comprehensive study conducted in the Dehradun district from 2003 to 2023 emphasizes on the intricate interplay between urbanization, land use changes, temperature variations, and air quality. The observed spatiotemporal patterns emphasize the significant impact of anthropogenic activities on the local environment. The expansion of urban areas and industrial zones, driven by population growth and economic activities, has led to notable alterations in land use and land cover. The transformation of natural landscapes into high-density constructions and impervious surfaces has resulted in a rise in land surface temperature (LST) and the formation of surface urban heat islands (SUHI). The study utilizes high-resolution TROPOMI data, providing a nuanced understanding of pollutant trends over a long time period.
Spatial analysis reveals distinct patterns, with lower regions experiencing higher temperatures and pollutant concentrations due to increased urbanization. Temporal analyses reveal enduring temperature disparities between lower and upper Dehradun, with the lower region consistently recording higher temperatures and high levels of pollutants. OMI data proves valuable for NO2 trend analysis, but its performance for HCHO is less robust. Long-term trends indicate rising formaldehyde and nitrogen dioxide, attributed to urbanization and rising temperatures, while carbon monoxide decreases due to reduced biomass burning and increased LPG usage.
The correlation matrix analysis reinforces intricate connections between land use, temperature, and pollutants. Built-up areas demonstrate positive correlations with all pollutants, exhibiting the highest correlation with temperature among land use classes. Formaldehyde exhibits high correlation with carbon monoxide, while nitrogen dioxide shows significant correlations with both formaldehyde and carbon monoxide. These findings collectively underscore the complex interplay between anthropogenic activities, land use changes, and their impact on air quality in Dehradun. This study emphasize on the importance of addressing the adverse effects of rapid urbanization on temperature, air quality and overall environmental health in the Dehradun district. It highlights the necessity of implementing sustainable urban planning and management strategies in the region. (Weng and Yang, 2006; Anand SharmaSaklani, 2012; Padilla et al., 2014; Pakkattil et al., 2021b; Dehradun Population, 2023; Zeren Cetin et al., 2023).
The original contributions presented in the study are included in the article/Supplementary material, further inquiries can be directed to the corresponding author.
The manuscript presents research on animals that do not require ethical approval for their study.
SD: Conceptualization, Data curation, Formal Analysis, Investigation, Methodology, Software, Visualization, Writing–original draft, Writing–review and editing. GS: Conceptualization, Data curation, Formal Analysis, Investigation, Methodology, Software, Visualization, Writing–original draft, Writing–review and editing. KK: Conceptualization, Formal Analysis, Project administration, Resources, Supervision, Writing–review and editing.
The author(s) declare that no financial support was received for the research, authorship, and/or publication of this article.
The author acknowledges School of Environmental Science, Jawaharlal Nehru University, New Delhi, India, for providing the necessary facilities and expertise.
The authors declare that the research was conducted in the absence of any commercial or financial relationships that could be construed as a potential conflict of interest.
All claims expressed in this article are solely those of the authors and do not necessarily represent those of their affiliated organizations, or those of the publisher, the editors and the reviewers. Any product that may be evaluated in this article, or claim that may be made by its manufacturer, is not guaranteed or endorsed by the publisher.
Aghazadeh, F., Bageri, S., Garajeh, M. K., Ghasemi, M., Mahmodi, S., Khodadadi, E., et al. (2023). Spatial-temporal analysis of day-night time SUHI and its relationship between urban land use, NDVI, and air pollutants in Tehran metropolis. Appl. Geomatics 15 (3), 697–718. doi:10.1007/s12518-023-00515-w
Alseroury, F. A. (2015). The effect of pollutants on land surface temperature around power plant. Int. J. Mech. Prod. Eng. 3, 2320–2092.
Anand Sharma, O. P., and Saklani, S. M. M. (2012). Climate of Dehradun. New Delhi, India: Indian Meteorological Department, Government of India, Ministry of Earth Sciences.
Arabi, R., Shahidan, M. F., Kamal, M. M., Jaafar, M. F. Z. B., and Rakhshandehroo, M. (2015). Mitigating urban heat island through green roofs. Curr. World Environ. 10 (1), 918–927. doi:10.12944/cwe.10.special-issue1.111
Balew, A., and Semaw, F. (2022). Impacts of land-use and land-cover changes on surface urban heat islands in Addis Ababa city and its surrounding. Environ. Dev. Sustain. 24 (1), 832–866. doi:10.1007/s10668-021-01472-3
Biswas, M. S., Ghude, S. D., Gurnale, D., Prabhakaran, T., and Mahajan, A. S. (2019). Simultaneous observations of nitrogen dioxide, formaldehyde and ozone in the indo-gangetic plain. Aerosol Air Qual. Res. 19 (8), 1749–1764. doi:10.4209/aaqr.2018.12.0484
Bonn, B., Von Schneidemesser, E., Andrich, D., Quedenau, J., Gerwig, H., Lüdecke, A., et al. (2016). BAERLIN2014 -The influence of land surface types on and the horizontal heterogeneity of air pollutant levels in Berlin. Atmos. Chem. Phys. 16 (12), 7785–7811. doi:10.5194/acp-16-7785-2016
Cabral, A. I., Silva, S., Silva, P. C., Vanneschi, L., and Vasconcelos, M. J. (2018). Burned area estimations derived from Landsat ETM+ and OLI data: comparing genetic programming with maximum likelihood and classification and regression trees. ISPRS J. Photogrammetry Remote Sens. 142, 94–105. doi:10.1016/j.isprsjprs.2018.05.007
Deep, A., Pandey, C. P., Nandan, H., Purohit, K. D., Singh, N., Singh, J., et al. (2019). Evaluation of ambient air quality in Dehradun city during 2011–2014. J. Earth Syst. Sci. 128 (4), 96–14. doi:10.1007/s12040-019-1092-y
Deeter, M. N., Emmons, L. K., Francis, G. L., Edwards, D. P., Gille, J. C., Warner, J. X., et al. (2003). Operational carbon monoxide retrieval algorithm and selected results for the MOPITT instrument. J. Geophys. Res. 108 (D14), 4399. doi:10.1029/2002JD003186
Dehradun Population (2023). Dehradun Population,2023. 23-05-2023. Available at: https://www.macrotrends.net/cities/21227/dehradun/population.
De Smedt, I., Pinardi, G., Vigouroux, C., Compernolle, S., Bais, A., Benavent, N., et al. (2021). Comparative assessment of TROPOMI and OMI formaldehyde observations and validation against MAX-DOAS network column measurements. Atmos. Chem. Phys. 21 (16), 12561–12593. doi:10.5194/acp-21-12561-2021
Drummond, J. R., Zou, J., Nichitiu, F., Kar, J., Deschambaut, R., and Hackett, J. (2010). A review of 9-year performance and operation of the MOPITT instrument. Adv. Sp. Res. 45, 760–774. doi:10.1016/j.asr.2009.11.019
Duncan, B. N., Lamsal, L. N., Thompson, A. M., Yoshida, Y., Lu, Z., Streets, D. G., et al. (2016). A space-based, high-resolution view of notable changes in urban NO x pollution around the world (2005–2014). J. Geophys. Res. Atmos. 121 (2), 976–996. doi:10.1002/2015JD024121
Fuladlu, K., and Altan, H. (2021). Examining land surface temperature and relations with the major air pollutants: a remote sensing research in case of Tehran. Urban Clim. 39, 100958. doi:10.1016/j.uclim.2021.100958
Gautam, S., Talatiya, A., Patel, M., Chabhadiya, K., and Pathak, P. (2020). Personal exposure to air pollutants from winter season bonfires in rural areas of Gujarat, India. Expo. Health 12 (1), 89–97. doi:10.1007/s12403-018-0287-9
Ghose, M. K., and Majee, S. R. (2000). Sources of air pollution due to coal mining and their impacts in Jharia coalfield. Environ. Int. 26 (1-2), 81–85. doi:10.1016/s0160-4120(00)00085-4
Goyal, G. (2014). International journal of environment. Int. J. Environ. 1 (1), 9–19. https://citeseerx.ist.psu.edu/viewdoc/download?doi=10.1.1.883.2659&rep=rep1&type=pdf.
Gupta, V., Bisht, L., Arya, A. K., Singh, A. P., and Gautam, S. (2022). Spatially resolved distribution, sources, exposure levels, and health risks of heavy metals in< 63 μm size-fractionated road dust from Lucknow City, North India. Int. J. Environ. Res. Public Health 19 (19), 12898. doi:10.3390/ijerph191912898
Hereher, M. E. (2022). Climate change during the third millennium—the gulf cooperation council countries. Sustainability 14 (21), 14181. doi:10.3390/su142114181
Isa, N. A., Wan Mohd, W. M. N., and Salleh, S. A. (2017). The effects of built-up and green areas on the land surface temperature of the Kuala Lumpur City. Int. Archives Photogrammetry, Remote Sens. Spatial Inf. Sci. 42, 107–112. doi:10.5194/isprs-archives-xlii-4-w5-107-2017
Justice, C. O., Townshend, J. R. G., Vermote, E. F., Masuoka, E., Wolfe, R. E., Saleous, N., et al. (2002). An overview of MODIS Land data processing and product status. Remote Sens. Environ. 83, 3–15. doi:10.1016/s0034-4257(02)00084-6
Kansal, A., Subuddhi, S. P., Pandey, P., Gupta, D., Rawat, T., Gautam, A. S., et al. (2023). Investigating the impression of national clean air programme in enhancement of air quality characteristics for non-attainment cities of Uttarakhand. Aerosol Sci. Eng. 7, 415–425. doi:10.1007/s41810-023-00181-w
Kean, A. J., Sawyer, R. F., and Harley, R. A. (2000). A fuel-based assessment of off-road diesel engine emissions. J. Air Waste Manag. Assoc. 50 (11), 1929–1939. doi:10.1080/10473289.2000.10464233
Khare, M., and Nagendra, S. S. (2006). Artificial neural networks in vehicular pollution modelling 41, Springer.
Kumar, R. P., Perumpully, S. J., Samuel, C., and Gautam, S. (2023). Exposure and health: a progress update by evaluation and scientometric analysis. Stoch. Environ. Res. Risk Assess. 37 (2), 453–465. doi:10.1007/s00477-022-02313-z
Lai, L. W., and Cheng, W. L. (2009). Air quality influenced by urban heat island coupled with synoptic weather patterns. Sci. Total Environ. 407 (8), 2724–2733. doi:10.1016/j.scitotenv.2008.12.002
Levelt, P. F., Hilsenrath, E., Leppelmeier, G., van den Oord, G., Bhartia, P., Tamminen, J., et al. (2006). Science objectives of the ozone monitoring instrument. IEEE Trans. Geoscience Remote Sens. 44 (5), 1199–1208. doi:10.1109/TGRS.2006.872336
Lin, B., and Zhu, J. (2018). Changes in urban air quality during urbanization in China. J. Clean. Prod. 188, 312–321. doi:10.1016/j.jclepro.2018.03.293
Maithani, S. (2020). A quantitative spatial model of urban sprawl and its application to Dehradun urban agglomeration, India. J. Indian Soc. Remote Sens. 48 (11), 1583–1592. doi:10.1007/s12524-020-01182-9
Millet, D. B., Jacob, D. J., Boersma, K. F., Fu, T. M., Kurosu, T. P., Chance, K., et al. (2008). Spatial distribution of isoprene emissions from North America derived from formaldehyde column measurements by the OMI satellite sensor. J. Geophys. Res. Atmos. 113 (2). doi:10.1029/2007JD008950
Morabito, M., Crisci, A., Messeri, A., Orlandini, S., Raschi, A., Maracchi, G., et al. (2016). The impact of built-up surfaces on land surface temperatures in Italian urban areas. Sci. Total Environ. 551, 317–326. doi:10.1016/j.scitotenv.2016.02.029
Mukherjee, S., Joshi, P. K., and Garg, R. D. (2017). Analysis of urban built-up areas and surface urban heat island using downscaled MODIS derived land surface temperature data. Geocarto Int. 32 (8), 900–918. doi:10.1080/10106049.2016.1222634
Nautiyal, G., Maithani, S., and Sharma, A. (2021). Exploring the relationship between spatio-temporal land cover dynamics and surface temperature over Dehradun urban agglomeration, India. J. Indian Soc. Remote Sens. 49 (6), 1307–1318. doi:10.1007/s12524-021-01323-8
Ngarambe, J., Joen, S. J., Han, C. H., and Yun, G. Y. (2021). Exploring the relationship between particulate matter, CO, SO2, NO2, O3 and urban heat island in Seoul, Korea. J. Hazard. Mater. 403 (2), 123615. doi:10.1016/j.jhazmat.2020.123615
Nguyen, Q. K., Trinh, L. H., Dao, K. H., and Dang, N. D. (2019). Land surface temperature dynamics in dry season 2015-2016 according to Landsat 8 data in the southsouth-east region of vietnam. Geogr. Environ. Sustain. 12 (1), 75–87. doi:10.24057/2071-9388-2018-06
Otukei, J. R., and Blaschke, T. (2010). Land cover change assessment using decision trees, support vector machines and maximum likelihood classification algorithms. Int. J. Appl. Earth Observation Geoinformation 12, 27–31. doi:10.1016/j.jag.2009.11.002
Padilla, C. M., Kihal-Talantikite, W., Vieira, V. M., Rossello, P., Nir, G. L., Zmirou-Navier, D., et al. (2014). Air quality and social deprivation in four French metropolitan areas-A localized spatiotemporal environmental inequality analysis. Environ. Res. 134, 315–324. doi:10.1016/j.envres.2014.07.017
Pakkattil, A., Muhsin, M., and Varma, M. K. (2021a). COVID-19 lockdown: effects on selected volatile organic compound (VOC) emissions over the major Indian metro cities. Urban Clim. 37, 100838. doi:10.1016/j.uclim.2021.100838
Pakkattil, A., Muhsin, M., and Varma, M. R. (2021b). COVID-19 lockdown: effects on selected volatile organic compound (VOC) emissions over the major Indian metro cities. Urban Clim. 37, 100838. doi:10.1016/j.uclim.2021.100838
Panda, L. L., Aggarwal, R. K., and Bhardwaj, D. R. (2018). A review on air pollution tolerance index (APTI) and anticipated performance index (API). Curr. World Environ. 13 (1), 55–65. doi:10.12944/cwe.13.1.06
Pandey, P., Kumar, D., Prakash, A., Kumar, K., and Jain, V. K. (2009). A study of the summertime urban heat island over Delhi. Int. J. Sustain. Sci. Stud. 1 (1), 27–34.
Pathak, C., Chandra, S., Maurya, G., Rathore, A., Sarif, M. O., and Gupta, R. D. (2021). The effects of land indices on thermal state in surface urban heat island formation: a case study on Agra City in India using remote sensing data (1992–2019). Earth Syst. Environ. 5, 135–154. doi:10.1007/s41748-020-00172-8
Piyoosh, A. K., and Ghosh, S. K. (2020). Analysis of land use land cover change using a new and existing spectral indices and its impact on normalized land surface temperature. Geocarto Int. 37 (8), 2137–2159. doi:10.1080/10106049.2020.1815863
Roth, M., Oke, T. R., and Emery, W. J. (1989). Satellite-derived urban heat islands from three coastal cities and the utilization of such data in urban climatology. Int. J. Remote Sens. 10 (11), 1699–1720. doi:10.1080/01431168908904002
Stavrakou, T., Müller, J. F., Bauwens, M., Doumbia, T., Elguindi, N., Darras, S., et al. (2021). Atmospheric impacts of COVID-19 on NOx and VOC levels over China based on TROPOMI and IASI satellite data and modeling. Atmosphere 12 (8), 946. doi:10.3390/atmos12080946
Strahler, A. H. (1980). The use of prior probabilities in maximum likelihood classification of remotely sensed data. Remote Sens. Environ. 10 (2), 135–163. doi:10.1016/0034-4257(80)90011-5
Su, W., Liu, C., Hu, Q., Zhao, S., Sun, Y., Wang, W., et al. (2019). Primary and secondary sources of ambient formaldehyde in the yangtze river delta based on ozone mapping and profiler suite (OMPS) observations. Atmos. Chem. Phys. 19 (10), 6717–6736. doi:10.5194/acp-19-6717-2019
Veefkind, J. P., Aben, I., McMullan, K., Förster, H., de Vries, J., Otter, G., et al. (2012). TROPOMI on the ESA Sentinel-5 Precursor: a GMES mission for global observations of the atmospheric composition for climate, air quality and ozone layer applications. Remote Sens. Environ. 120, 70–83. doi:10.1016/j.rse.2011.09.027
Weng, Q., and Yang, S. (2006). Urban air pollution patterns, land use, and thermal landscape: an examination of the linkage using GIS. Environ. Monit. Assess. 117, 463–489. doi:10.1007/s10661-006-0888-9
Wright, N., Newell, K., Chan, K. H., Gilbert, S., Hacker, A., Lu, Y., et al. (2023). Long-term ambient air pollution exposure and cardio-respiratory disease in China: findings from a prospective cohort study. Environ. Health 22 (1), 30–11. doi:10.1186/s12940-023-00978-9
Yang, C., He, X., Yan, F., Yu, L., Bu, K., Yang, J., et al. (2017). Mapping the influence of land use/land cover changes on the urban heat island effect—a case study of Changchun, China. Sustainability 9 (2), 312. doi:10.3390/su9020312
Yuan, F., Sawaya, K. E., Loeffelholz, B. C., and Bauer, M. E. (2005). Land cover classification and change analysis of the Twin Cities (Minnesota) metropolitan area by multitemporal Landsat remote sensing. Remote Sens. Environ. 98 (2–3), 317–328. doi:10.1016/j.rse.2005.08.006
Zarzana, K. J., Selimovic, V., Koss, A. R., Sekimoto, K., Coggon, M. M., Yuan, B., et al. (2018). Primary emissions of glyoxal and methylglyoxal from laboratory measurements of open biomass burning. Atmos. Chem. Phys. 18 (20), 15451–15470. doi:10.5194/acp-18-15451-2018
Zeren Cetin, I., Varol, T., Ozel, H. B., and Sevik, H. (2023). The effects of climate on land use/cover: a case study in Turkey by using remote sensing data. Environ. Sci. Pollut. Res. 30 (3), 5688–5699. doi:10.1007/s11356-022-22566-z
Keywords: LULC, land surface temperature, formaldehyde, nitrogen dioxide, carbon monoxide, tropospheric ozone
Citation: Dhankar S, Singh G and Kumar K (2024) Impacts of urbanization on land use, air quality, and temperature dynamics in Dehradun district of Uttarakhand, India: a comprehensive analysis. Front. Environ. Sci. 12:1324186. doi: 10.3389/fenvs.2024.1324186
Received: 20 October 2023; Accepted: 08 February 2024;
Published: 26 February 2024.
Edited by:
Mario Cunha, University of Porto, PortugalReviewed by:
Sneha Gautam, Karunya Institute of Technology and Sciences, IndiaCopyright © 2024 Dhankar, Singh and Kumar. This is an open-access article distributed under the terms of the Creative Commons Attribution License (CC BY). The use, distribution or reproduction in other forums is permitted, provided the original author(s) and the copyright owner(s) are credited and that the original publication in this journal is cited, in accordance with accepted academic practice. No use, distribution or reproduction is permitted which does not comply with these terms.
*Correspondence: Krishan Kumar, a3Jpc2hhbl9rdW1hckBtYWlsLmpudS5hYy5pbg==
†These authors have contributed equally to this work
Disclaimer: All claims expressed in this article are solely those of the authors and do not necessarily represent those of their affiliated organizations, or those of the publisher, the editors and the reviewers. Any product that may be evaluated in this article or claim that may be made by its manufacturer is not guaranteed or endorsed by the publisher.
Research integrity at Frontiers
Learn more about the work of our research integrity team to safeguard the quality of each article we publish.