 Ying Zhang
 Jinliang Hou
 Weixiao Han
 Peng Dou
94% of researchers rate our articles as excellent or good
Learn more about the work of our research integrity team to safeguard the quality of each article we publish.
Find out more
ORIGINAL RESEARCH article
Front. Environ. Sci. , 27 February 2024
Sec. Environmental Informatics and Remote Sensing
Volume 12 - 2024 | https://doi.org/10.3389/fenvs.2024.1320881
Introduction: The Leaf area index (LAI) of source region of yellow river basin is an important indicator for environmental sustainability. Most studies focus on the trend of LAI in Yellow River Source Region (YRSR) in accordance with both climate change and human actives. However, quantifying the effect of human activities on LAI is difficult but urgently needed. Specifically, Particle Matter 2.5 (PM2.5) can be an indirect indicator of human activities.
Methods: In this study, we explored the potential dependence of LAI on temperature, precipitation, and PM2.5 in different land cover types in YRSR with linear regression and correlation analysis.
Results: Over the period of 2001–2020, the climate in the region has been warming and becoming more humid, leading to overall improvements in vegetation. The mean LAI values varied between seasons, with summer having the highest and winter having the lowest LAI. The analysis of the LAI trends revealed that the mean LAI has been steadily increasing, particularly in the eastern region. The correlation analysis showed a significant positive correlation between annual average LAI and both annual precipitation and temperature, indicating that temperature has a greater impact on vegetation growth. The analysis of land cover types showed that most types exhibited a unimodal trend in LAI throughout the year, except for construction land which had two distinct peaks. Human-induced land cover change had a small impact on the overall increase in LAI. Furthermore, the interannual variation of PM2.5 showed a downward trend, with a strong correlation with the trend of LAI. Additionally, multiple linear regression analysis and residual trend analysis showed that climate factors had the strongest impact on LAI.
Conclusion: The study highlights the spatiotemporal variations of LAI in the YRSR and its correlation with climatic and human factors. The findings suggest that climate change plays a crucial role in the vegetation growth and LAI in the region.
The spatio-temporal analysis of Leaf Area Index (LAI) is of utmost importance in understanding and managing the ecological dynamics of a watershed. LAI is commonly defined as the total single-sided green leaf area per unit horizontal ground area (Baret et al., 2007). Quantifying the drivers of temporal and spatial changes in vegetation is crucial due to its significant role in regulating climate change (Piao et al., 2020; Mota et al., 2021; Shabanov et al., 2021; Yan et al., 2021; Dai et al., 2022; Kobayashi et al., 2023; Pu et al., 2023), land surface modeling (Running et al., 1999; Albergel et al., 2018; Peng et al., 2021; Zhu et al., 2023), and vegetation dynamic monitoring (Iwahashi et al., 2021; Zhao et al., 2021; Abubakar et al., 2022; Amin et al., 2022; Zhang et al., 2022; Bajocco et al., 2022; Caballero et al., 2022). The variation in vegetation structure and function not only affects biodiversity and energy supply but also provides valuable insights into ecological feedback to climatic changes.
It is crucial to monitor the fluctuations in LAI and understand how it responds to both climatic changes and human activities. This knowledge is essential for devising successful strategies to rehabilitate vegetation. On one hand, climatic factors, particularly temperature and precipitation patterns, play a significant role in driving vegetation changes. Both increased temperature and precipitation have an impact on the growing season of vegetation (Ma et al., 2023). Li et al. (2022) have identified that the rise in temperature during spring and autumn is the main cause for the prominent vegetation greening across China during the 1981–2018 period. Additionally, the warming of soil under climate change was driving the LAI increases, while drying was largely responsible for LAI decreases. Ukasha et al. (2022) compared the temporal behaviors of normalized difference vegetation index (NDVI) and LAI and their associations with hydroclimatic variables in the combined Sacramento River and San Joaquin River basins in California. The results show that NDVI peaks earlier than LAI and is more closely correlated with water availability, while LAI is more strongly correlated with mean temperature and atmospheric water demand. A study used satellite data to analyze leaf area index trends in the Yan Mountains over the past four decades, revealing a consistent increase in vegetation density due to human activities such as crop management and afforestation (Guo et al., 2023). The study also found that vegetation growth was influenced by factors such as land surface temperature, soil moisture, precipitation, and air temperature, with varying time lags in their effects throughout the growing season. These findings can inform government policies on ecological protection in mountainous areas and suggested that temperature and precipitation were critical factors in the interannual variability of LAI. Therefore, temperature and precipitation are two essential climate variables that drive vegetation change by providing the necessary water and heat conditions for vegetation growth. Hence, we conduct research on vegetation dynamics and its correlation with climate change using LAI, thereby enhancing our understanding of future regional climate change.
In another hand, quantifiying the effect of human activities on LAI is difficult but urgently needed. It is important to note that the relationship between human activities and climate change is intricate and reciprocal, and they mutually influence each other (Peng et al., 2021; Ma et al., 2023). Consequently, when calculating the correlation coefficient between LAI and influencing factors, there may be some degree of uncertainty due to the potential impact of human activities. Human activities contribute significantly to the production of particulate matter with a diameter of 2.5 μm (PM2.5) or smaller (Bao et al., 2016; Zhou et al., 2019; Li et al., 2024). PM2.5 can come from various sources, including natural sources such as dust and wildfires, as well as human activities. The burning of fossil fuels, such as coal, oil, and gas, in power plants, industries, and vehicles releases pollutants that form PM2.5. Industrial processes, such as manufacturing and construction, also produce fine particles. Additionally, activities like open burning of agricultural waste, cooking with solid fuels, and tobacco smoking can release PM2.5 into the air. The influence of CO2 concentration, nitrogen deposition, and aerosol pollution on vegetation has been increasingly studied. Previous research has focused on the effects of aerosols on crop yields and gross primary productivity, while the impact on vegetation photosynthesis and growth has received less attention (Liu et al., 2023; Ma et al., 2023). PM2.5 affect vegetation by altering the absorption, reflection, and scattering of solar radiation, which in turn affects photosynthesis (Ma et al., 2023). The LAI plays a crucial role in determining the canopy’s ability to absorb solar radiation and therefore affects vegetation growth (Xue et al., 2020). Understanding the relationship between PM2.5 and LAI is important for understanding the sensitivity of vegetation to aerosol radiative forcing and developing strategies to mitigate the effects of climate change on vegetation (Zhang et al., 2020). Most of studies utilized land use change analysis to reflect the influence of human activities on LAI (Mao et al., 2013; Zeng et al., 2017; Zhu et al., 2017; Buitenwerf et al., 2018; Wong et al., 2018; Peng et al., 2021; Zhang et al., 2021; Zhou et al., 2022). Few studies quantifying impacts of human activities on changes of LAI with PM2.5. Therefore, the relationship between PM2.5 and LAI can be used for assessing the influence of human activities on LAI and need to be further studied.
The primary objective of this study was to use LAI data to monitor and analyze the greening trend of vegetation in the Yellow River source region over the past 20 years. Additionally, we aimed to quantify how variations in precipitation, temperature, land cover type and PM2.5 affect LAI. Specifically, our focus was on the following three aspects: 1) we examined the spatial and temporal changes in LAI during four seasons; 2) we analyzed the response of LAI to precipitation and temperature; 3) we analyzed the response of LAI to land use cover change and PM2.5. The remainder of this paper is structured as follows. Section 2 describes the geographic area, remote-sensing-derived LAI data, precipitation data, temperature data, land cover data and PM2.5 data considered in the study and presents the methodology to process and analysis the data. In Section 3, the results of the spatio-temporal variations of the LAI and influence of meteorological and human factors on LAI are presented and discussed. Section 4 discussed the results and the derived conclusions are presented in Section 5. The flowchart of this study was shown in Figure 1.
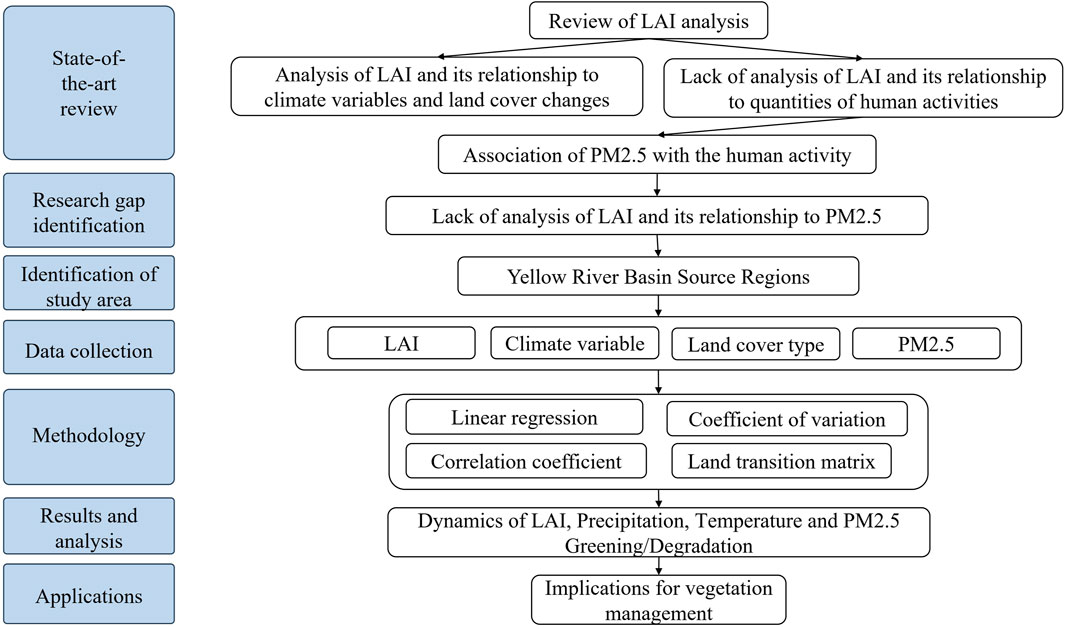
FIGURE 1. The flowchart of the study.
The Yellow River Source Region (YRSR) is located on the eastern edge of the Qinghai-Tibet Plateau and includes 16 county-level administrative units (Figure 2). The total area is approximately 132,658 km2. The region’s topography is dominated by plateaus, mountains, and hills, with elevations ranging from 2,232 to 6,252 m, with an average elevation of 4,029.92 m. The north and east are adjacent to the Gonghe Basin and Ruoergai Basin, with relatively lower terrain, while the central and western regions are mostly mountainous with higher terrain. Rivers and lakes are developed in the research area, with the two large mountain freshwater lakes in the west, and the Longyangxia Reservoir in the north being the most famous. The land cover types in the YRSR are mainly plateau grassland, forest land, and marshland, accounting for more than 80% of the total area (Figure 3). The climate type in the region belongs to the sub-arctic semi-arid and semi-humid type of the Qinghai-Tibet Plateau, with higher temperatures in the east than in the west, and higher precipitation in the southeast than in the northwest. The YRSR has a large diurnal temperature range, with an average annual temperature of around −1.6°C; the annual precipitation is mostly concentrated in summer, with an average accumulated precipitation of 407–582 mm, and the annual accumulated evaporation is 484–584 mm. Overall, the YRSR has a high altitude, low temperature, and developed rivers, lakes, and marsh wetlands, with functions such as water source conservation and supply, soil and water conservation, and regional climate regulation. It is a crucial water source and runoff area in the upper reaches of the Yellow River.
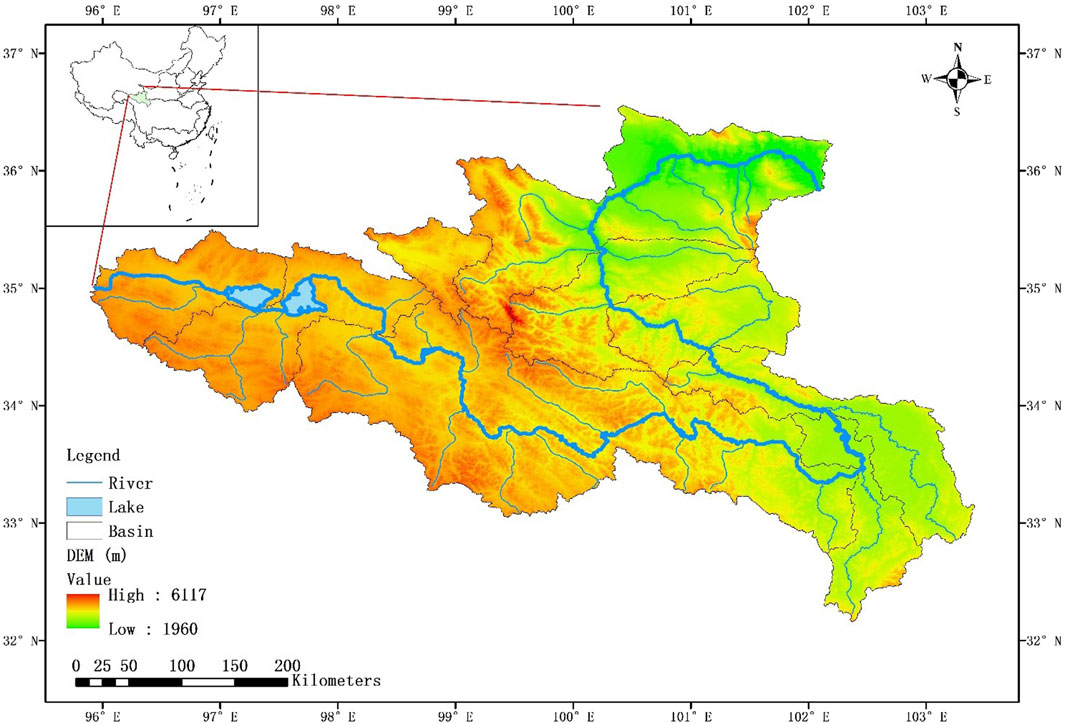
FIGURE 2. The location of the Yellow River source region.
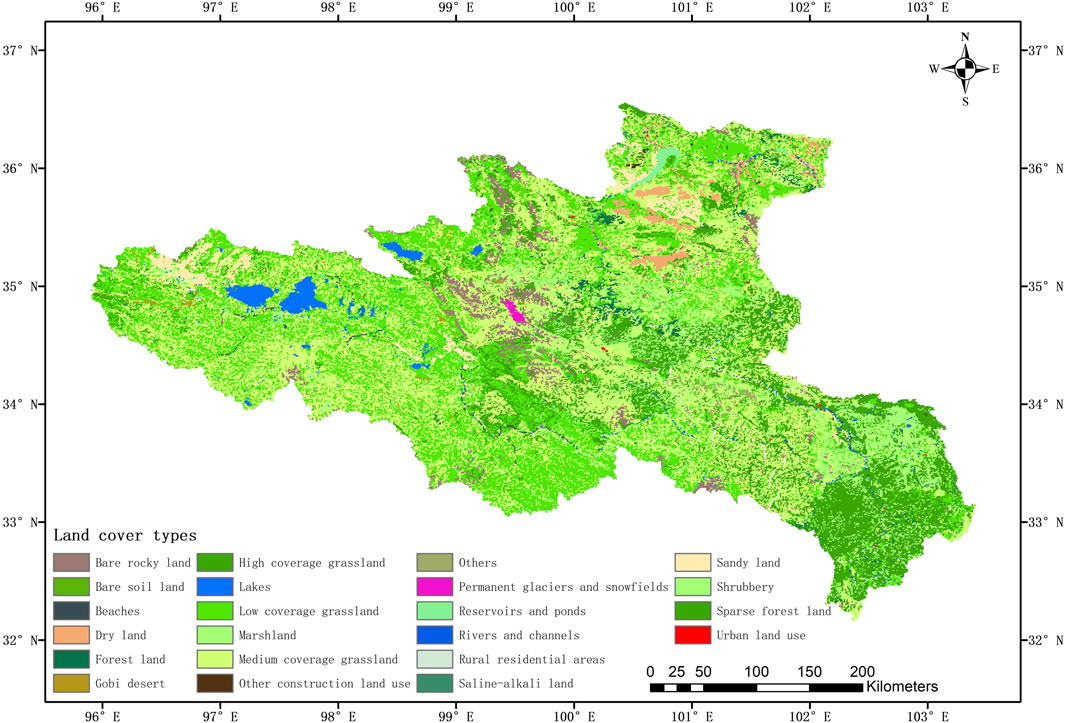
FIGURE 3. Land cover types of the Yellow River source region.
The GIMSS LAI4g product is produced by fusing multiple remote sensing data through a deep learning algorithm (backpropagation neural network, BPNN) (Cao et al., 2023). It can be downloaded through the website https://doi.org/10.5281/zenodo.7649108. The temporal resolution of the product is half-monthly, and the time coverage is from 1982 to 2020, with global spatial coverage and 8 km spatial resolution. The product format is TIFF. Global LAI products, such as VIIRS (Yan et al., 2018), GEOV2 (Baret et al., 2013), GLASS (Xiao et al., 2014; Xiao et al., 2016), and MODIS LAI (Knyazikhin et al., 1998) have been applied for various studies around the word. Most of studies highlight the importance of merging multiple sources data for generating high-resolution LAI products which is an important data foundation for analyzing LAI spatiotemporal characteristics. Cao et al. (2023) used backpropagation neural network (BPNN) and data integration methods to generate a new version of the Global Inventory Modeling and Mapping Studies (GIMMS) LAI product, namely, GIMMS LAI4g, with a time span from 1982 to 2020. The importance of GIMMS LAI4g lies in the use of the latest PKU GIMMS NDVI product and 3.6 million high-quality global Landsat LAI samples to eliminate the effects of satellite orbit drift and sensor degradation and to develop a BPNN model with spatiotemporal consistency. The results showed that compared to its predecessor (GIMMS LAI3g) and two mainstream LAI products (Global Land Surface Satellite [GLASS] LAI and Long-term Global Mapping [GLOBMAP] LAI), GIMMS LAI4g has higher accuracy, with an R2 value of 0.95, an average absolute error of 0.18 m2/m2. It performs well in most vegetation communities in most areas and shows more reasonable global vegetation trends.
For analyzing monthly variations of LAI by land cover types, we utilized the China multi-period land use land cover data set (CNLUCC), which was obtained through visual interpretation of Landsat remote-sensing data. The CNLUCC data set was acquired from the Data Center for Resources and Environmental Sciences, Chinese Academy of Science (http://www.resdc.cn). For analyzing interannual variations of LAI by land cover types, we specifically used long time series land use data from the China land cover dataset (CLCD) on the Google Earth Engine (GEE) platform (Yang and Huang, 2021). This data was downloaded from (https://doi.org/10.5281/zenodo.4417810) and has a spatial resolution of 30 m and a temporal resolution of 1 year. The land cover types in the study area consist of cropland, snow/ice, water, grassland, shrub, forest, barren and wetland. To align with the spatial resolution of LAI, the land cover data was resampled using the nearest neighbor method.
The TMPA (TRMM Multi-satellite Precipitation Analysis) precipitation product used in this study is a global dataset that provides precipitation estimates at a high spatial and temporal resolution. It is derived from a combination of satellite-based precipitation estimates and ground-based rainfall gauge observations. The product covers the period from January 1998 to present and is updated in near-real time. The TMPA precipitation product is based on the TRMM (Tropical Rainfall Measuring Mission) and other satellite-based precipitation estimates, which provide high-quality precipitation information over the entire globe. In addition, the product also incorporates ground-based rainfall gauge observations to improve the accuracy of the estimates. The TMPA precipitation product provides a range of precipitation estimates, including 3-hourly, daily, monthly, and yearly accumulations. The spatial resolution of the product is 0.25° (approximately 25 km) and covers the entire globe. The TMPA precipitation product is widely used in meteorology, hydrology, and climate research, as well as in applications such as flood and drought monitoring, water resource management, and agriculture. It is freely available to the public and can be downloaded from various data centers, including NASA’s Goddard Earth Sciences Data and Information Services Center (GES DISC).
The MODIS (Moderate Resolution Imaging Spectroradiometer) land surface temperature (LST) dataset (MOD11) used in this study is a global dataset that provides daily estimates of land surface temperature. The MODIS LST dataset provides two types of products: daytime and nighttime LST. The MODIS LST dataset is freely available to the public and can be downloaded from various data centers. It is also available through various data analysis tools, such as Google Earth Engine, which allow users to visualize and analyze the data in a user-friendly interface.
ChinaHighPM2.5 dataset is a comprehensive collection of ground-level PM2.5 data for China (Wei et al., 2021). It utilizes artificial intelligence to analyze various sources of big data, such as ground-based measurements, satellite remote sensing, atmospheric reanalysis, and model simulations. By considering the spatial and temporal variations of air pollution, this dataset provides long-term, high-resolution, and high-quality information. Specifically, this dataset covers the entire spatial extent of China with a resolution of 1 km. It includes daily, monthly, and yearly measurements from 2000 to 2022. The dataset has been rigorously validated, achieving a high cross-validation coefficient of determination and low root-mean-square error (RMSE) and mean absolute error (MAE) on a daily basis.
Firstly, the LAI data for YRSR extracted from the GIMSS LAI4g product. Then the 16-day data was scaled to monthly and annual data. Finally, the spatial resolution of the LAI data was resampled into 1 km with the nearest neighbor interpolation method.
The precipitation data was extracted from the TMPA product. Then the 3-hourly data was scaled to monthly and annual data. Finally, the spatial resolution of the precipitation data was resampled into 1 km.
The temperature data was extracted from the MOD11 product. Then the daily data was scaled to monthly and annual data. Finally, the spatial resolution of the temperature data was resampled into 1 km.
The land cover data was extracted and resampled from the CNLUCC and CLCD. The monthly 1 km PM2.5 data was extracted from the ChinaHighPM2.5 product. The codes used for the data processing and data analysis were written in Python and available at http://github.com/hexiayouxi1.
We utilized linear regression to examine the variations in LAI (Leaf Area Index) over the period of 2001–2020 in the YRSR, focusing on interannual and seasonal growth. The regression model’s parameters were determined using the least square method. To assess the significance of the linear trend in LAI, a significance test was conducted using confidence intervals, with p < 0.01 indicating passing the test at a 99% confidence level, and p < 0.05 indicating passing the test at a 95% confidence level. The calculation formula is as follows:
Where Slope is the trend of change, n is the length of the time series, and LAIi is the LAI in the year i. When Slope >0, it means that LAI has an upward trend in n years, and conversely, when Slope <0, it means that LAI has a downward trend. The significance p-value of the trend in LAI was determined by the F-test and calculated according to
Where p is the significance value, t is the number of samples, and k is the number of independent variables. Combining the Slope and significance p-value, the trends of LAI can be classified into five categories according to the theory proposed by Ma et al. (2023).
The multiple linear regression of LAI, precipitation, temperature and PM2.5 was also conducted to analysis the contributions of climate (precipitation and temperature) and human (PM2.5) factors on the trend of LAI.
To distinguish the respective impacts of climate change and human activities on vegetation changes, residual analysis is also employed. In this study, the residuals, which refer to the disparity between the observed and predicted LAI values, are utilized to identify temporal trends. The calculation of LAI residuals is performed on all pixels. By employing multiple linear regression, the most optimal relationship between the average LAI and climatic factors is determined. This relationship is subsequently employed to estimate the predicted LAI. The LAI residual is then computed by subtracting the observed LAI value from the predicted LAI value. The residual trend analysis method entails establishing correlations between the LAI and climatic factors for all pixels. The formula for this analysis is as follows:
The regression coefficients of the correlations between the LAI and the precipitation and temperature are represented by a and b, respectively. The constant regression term is denoted as c. The residual,
Based on the phenological characteristics of vegetation in the study area, we defined March to May as spring, June to August as summer, September to November as autumn, and December to February of the following year as winter. In order to reflect the temporal variation characteristics of LAI, we used the maximum value composite (MVC) method to synthesize LAI on a monthly and annual basis. By extracting the monthly and annual averages, we analyzed the annual variation characteristics of LAI. At the same time, we used the coefficient of variation (CV) to represent the interannual variation of LAI. The CV, also referred to as the relative standard deviation (RSD), is a standardized metric used to measure the dispersion of a probability distribution or frequency distribution. The formulation of CV is as follows:
Where the xi represents the value of LAI for the ith year.
The Pearson correlation coefficient (R) is a commonly used measure to describe the relationship between two variable distributions. It determines the magnitude and direction of the relationship at each data point by assuming that the variables are normally linearly distributed. It is calculated by dividing the covariance of the variables by the product of their standard deviations. The absolute value of the coefficient ranges from 0 to 1, with values closer to 1 indicating a stronger correlation between the data.
Based on this, we analyzed the correlation coefficient between LAI and average temperature, precipitation and PM2.5 from 2001 to 2020, in order to explore the degree and spatial distribution pattern of the correlation between LAI and average temperature, precipitation and PM2.5 over a long time series. We utilized t-tests to assess the significance of these correlations (Cai et al., 2021).
To account for the time delay between changes in LAI and climate (precipitation) and human (PM2.5) factors, we employed the correlation coefficient method to establish the lag period. By calculating the correlation coefficients between LAI and climate and human factors for the current month and the previous 3, 6, 9 and 12 months, we identified the highest correlation coefficients. The month corresponding to the highest correlation coefficient was then considered the actual time lag for the respective LAI responses.
The time series of annual mean and seasonal variation of LAI from 2001 to 2020 in this study area is shown in Figures 4A, B. In the entire basin, due to the low temperature and low precipitation in December, January, February, March, and April, most of the vegetation is in a state of no or few leaves, resulting in a low LAI value, which reaches the lowest point of the year in January. After April, with the gradual increase in temperature and precipitation, vegetation begins to grow, and the LAI shows a gradually increasing trend. After May, the LAI value rises significantly. As it enters the summer season, the sufficient sunlight and abundant precipitation are conducive to vegetation growth, and the LAI reaches the maximum value of the year in July, which is 1.81. After July, the temperature begins to drop, and the vegetation enters the leaf-falling period, resulting in a gradual decrease in LAI. From September, the rate of decrease in LAI is faster, but due to the presence of a large number of sparse vegetation in the downstream area, the LAI gradually stabilizes in November.
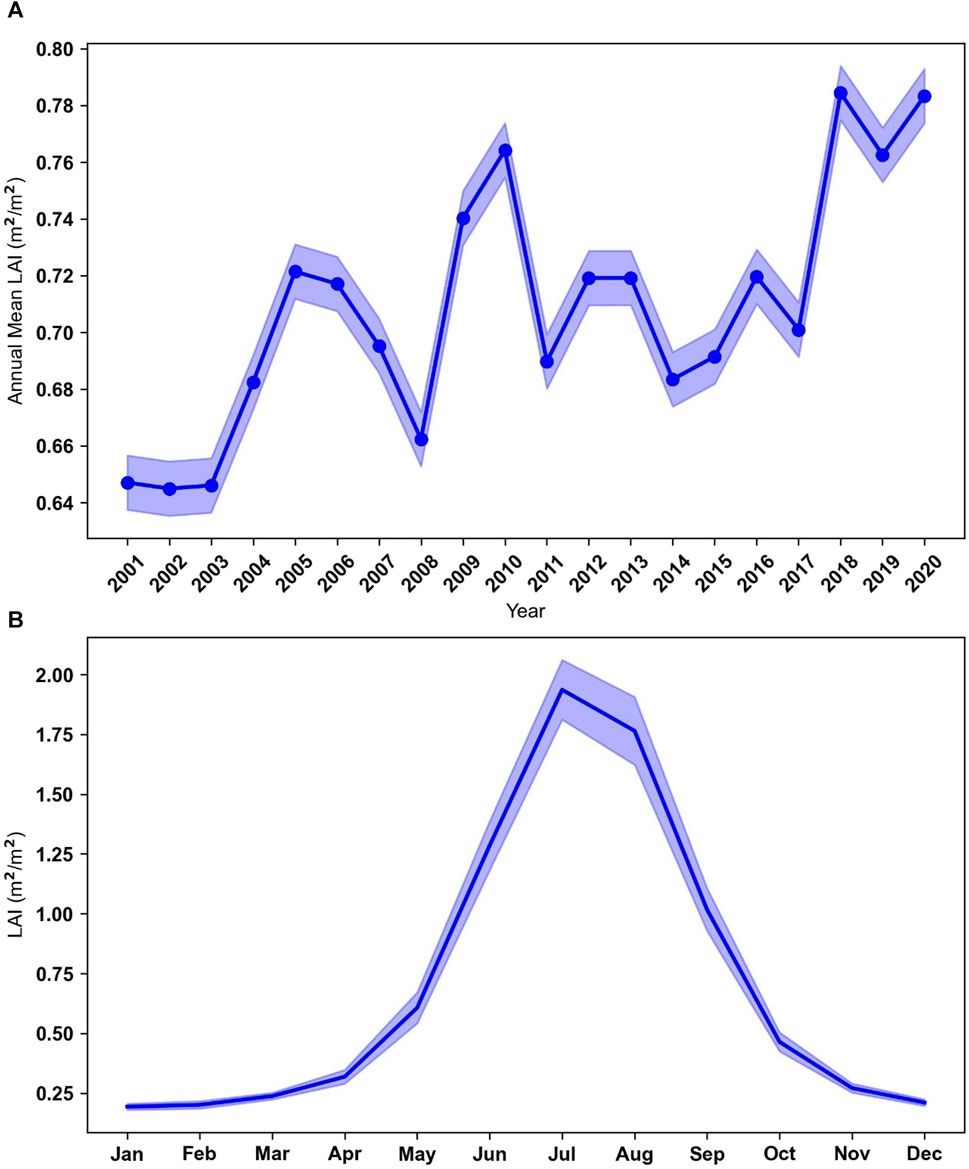
FIGURE 4. (A) Annually mean LAI and (B) seasonal variation from Jan-Dec during 2001–2020 in the Yellow River source region.
In order to further examine the seasonal variation in LAI, we conducted a linear regression analysis on the average LAI for each season (Figure 5). The results revealed that LAI showed an increasing trend throughout all four seasons, however, there were noticeable differences between seasons. The annual growth rate of LAI was calculated to be 0.0051 per year, with a high correlation coefficient of 0.69 and fluctuation range of 0.64–0.78, indicating a strong relationship. Furthermore, the LAI data passed the significance test (p < 0.01), indicating its statistical significance. Typically, the vegetation’s growing season begins in spring and ends in autumn. During this period, vegetation experiences rapid growth in summer, temperatures gradually rise and there is an ample amount of light, leading to acceleration in vegetation growth, resulting in the highest interannual growth rate (0.0043 years−1) of LAI among all seasons. Consequently, the mean LAI in summer usually reaches its peak at 0.7483, with a fluctuation range of 0.6059–0.7483. In winter, temperatures are relatively low, daylight hours are short, and vegetation almost completely stops growing. The mean LAI usually reaches its lowest at 0.0718, with a fluctuation range of 0.0718–0.0906. When spring approaches, temperatures gradually increase, resulting in longer periods of daylight and vegetation entering a growth state. As a result, the mean LAI in spring (0.1587) may slightly increase but remains relatively low. The fluctuation range for LAI during this season was 0.1587 to 0.1288, with an interannual growth rate of 0.0018 years−1. In autumn, temperatures and daylight hours are similar to spring. Consequently, the average LAI (0.2371) and interannual growth rate (0.0018 years−1) with a fluctuating between 0.1874 and 0.2743.
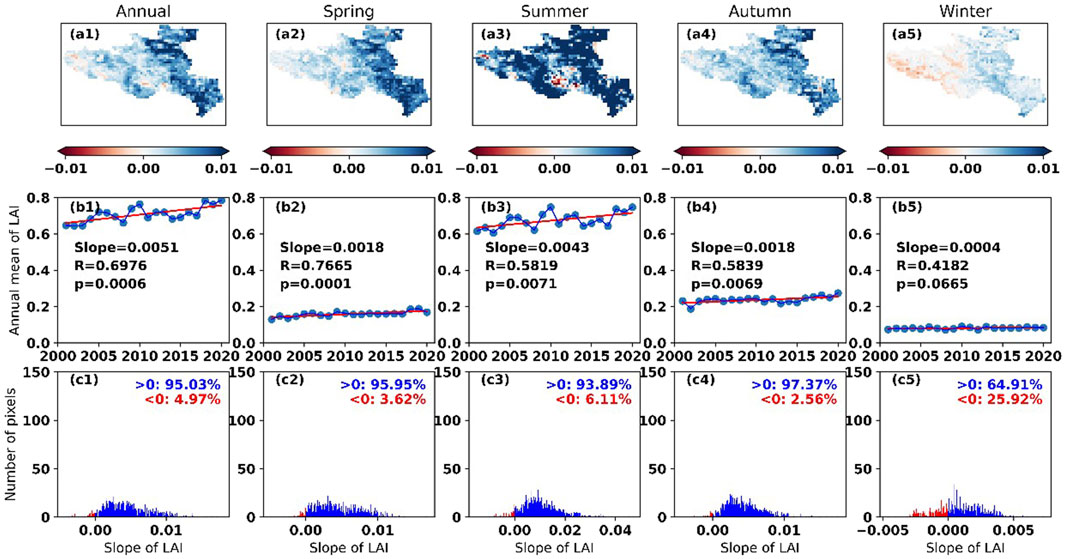
FIGURE 5. (A1–A5) are the slopes of LAI (Leaf Area Index) calculated using linear regression method during the entire year, spring, summer, autumn, and winter from 2001 to 2020, respectively. (B1–B5) are line charts representing the average trends of LAI during the entire year, spring, summer, autumn, and winter from 2001 to 2020, respectively. (C1–C5) are histograms showing the distribution of trends of LAI during the entire year, spring, summer, autumn, and winter from 2001 to 2020 at the pixel scale.
Figure 6 showed the spatio-temporal LAI trends in YRSR from 2001 to 2020. The mean LAI in most parts of YRSR, particularly in the eastern region, has been steadily increasing on an annual basis. The eastern region has experienced the highest growth rate, reaching 0.1 per year, suggesting it has the potential to act as a carbon sink. The area where LAI has improved is significantly larger than the area where it has degraded. Approximately 60.72% of the total area has an extreme (p < 0.01) or significant increase (p < 0.05) in LAI, while only 0.28% of the total area has experienced a significant (p < 0.05) degradation (Figure 6). The areas with degraded LAI are primarily located around lakes. This decline is likely attributed to the replacement of original grassland or wetland with water.
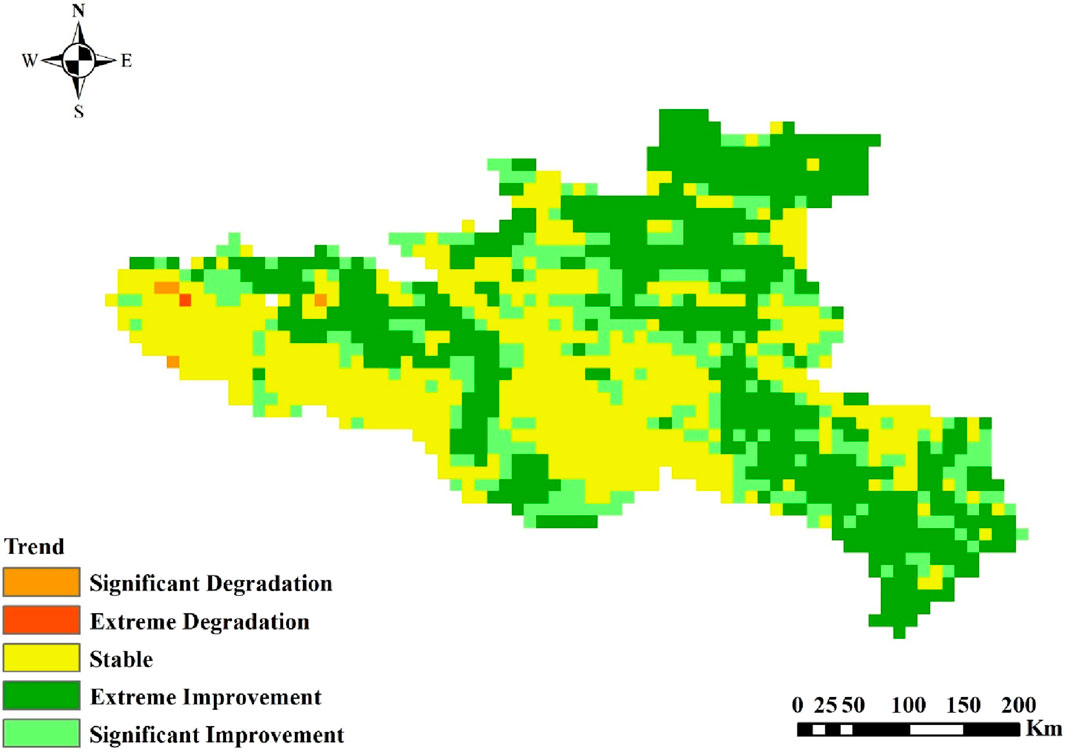
FIGURE 6. Spatial distribution of LAI trend during 2001–2020 in the Yellow River source areas.
The high-value regions of LAI coefficient of variation (CV) were mostly near the northern part of the YRSR, with CV > 1.0 and large inter-annual fluctuations, but a small distribution range (Figure 7). This indicates that there are few areas in the north of the YRSR with large inter-annual fluctuations in LAI. The degree of inter-annual fluctuations in LAI in the southern part of the YRSR is relatively small, with CV values ranging from 0 to 1.
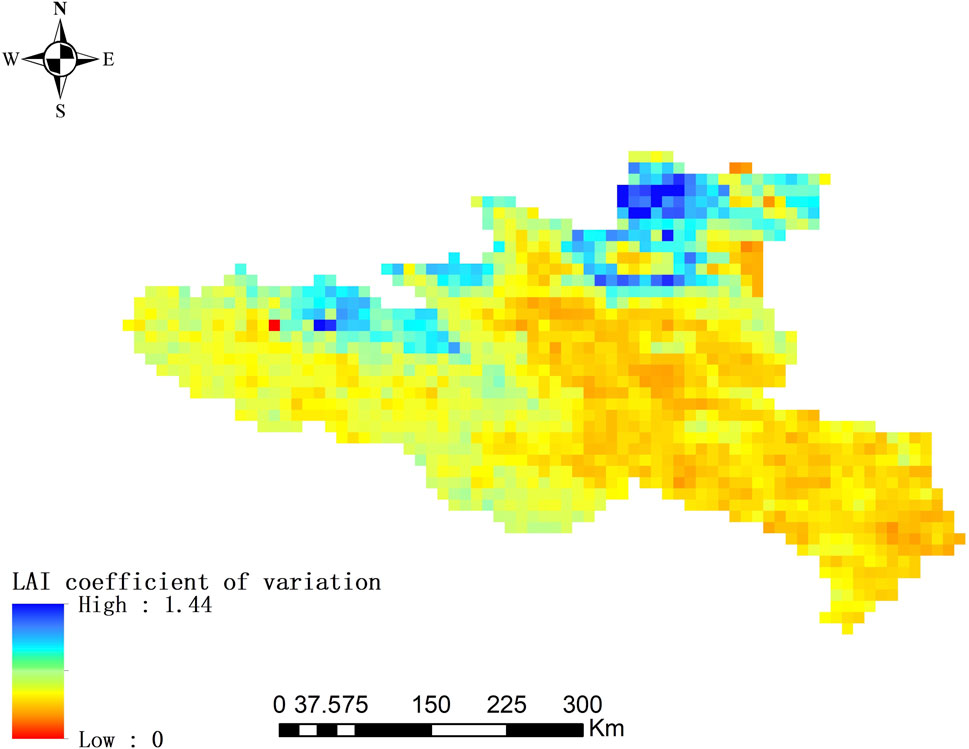
FIGURE 7. Spatial distributions of LAI coefficient of variation during 2001–2020 in the Yellow River source areas.
From Figure 8, it can be seen that LAI gradually increases from April, reaches its maximum value in July, and gradually decreases from September to November, and stabilizes from December to the following March. Combining with the phenological characteristics of vegetation, LAI in the YRSR shows obvious seasonal changes. At the same time, the annual changes in LAI can directly reflect the phenology of vegetation. Starting from April, various vegetation begins to grow gradually. By July, vegetation is in a period of vigorous growth, and LAI reaches its maximum value. In September, vegetation enters the leaf-falling period, and vegetation coverage gradually decreases, and LAI gradually decreases. However, due to different downstream vegetation cover types, sparse vegetation gradually stops growing. In addition, according to Figure 8, the annual changes in the monthly average temperature and precipitation in the YRSR are consistent with the annual changes in LAI. Meteorological elements and temperature have a bell curve trend throughout the year. The average temperature in winter is lower, and the precipitation is less, while the average temperature in summer is higher, and the precipitation is more. The maximum monthly average temperature occurs in July, which is 284.87K (11.72°C), and the minimum occurs in January, which is 259.33K (−13.82°C). The maximum monthly precipitation occurs in August, which is 357 mm, and the minimum occurs in December, which is 15 mm.
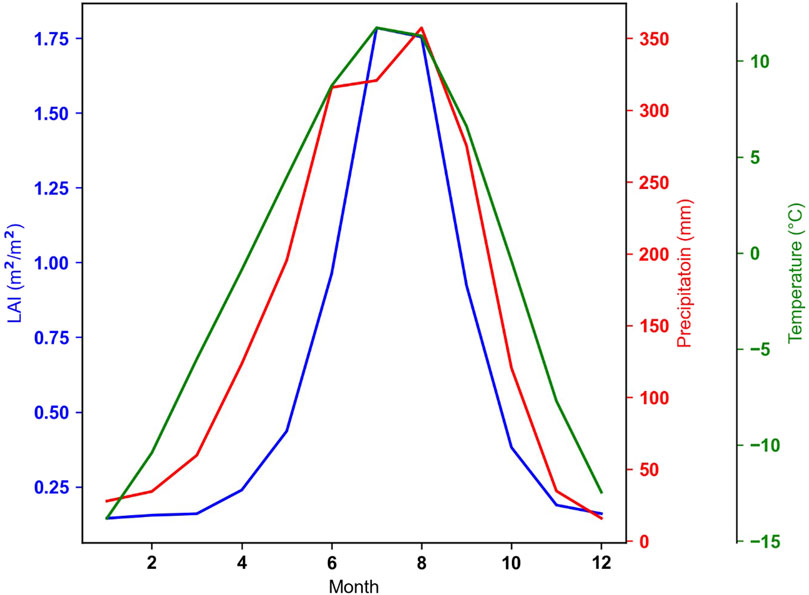
FIGURE 8. Interannual variation trend of LAI and meteorological elements in the Yellow River source region.
The pixel-by-cell correlation analysis of the LAI with the precipitation and temperature in the YRSR from 2001 to 2020 is shown in Figures 9, 10. The correlation coefficients between annual average LAI and annual precipitation in the YRSR were all significant positive (p < 0.05) ranging from 0.23 to 0.86. The correlation coefficients between annual average LAI and annual temperature were all significant positive (p < 0.05), with values ranging from 0.3 to 0.92. From Figures 9, 10, it can be seen that there is high correlation coefficient between the two in most areas, and there are obvious spatial differences. The regions where the annual average LAI and annual precipitation are positively correlated are mainly distributed in the middle reaches of the YRSR, where the vegetation is mainly forests and meadows, the vegetation coverage is high, and the annual average temperature is lower. During the same period, the temperature increases and the precipitation increases, which is conducive to vegetation growth. The regions where the annual average LAI and annual precipitation are slightly correlated are mainly distributed in some parts of the downstream and middle reaches of the YRSR, where the annual precipitation is less. Moreover, according to the principle of correlation analysis, the larger the absolute value of the correlation coefficient, the stronger the correlation between variables, indicating that temperature has a greater impact on vegetation growth.
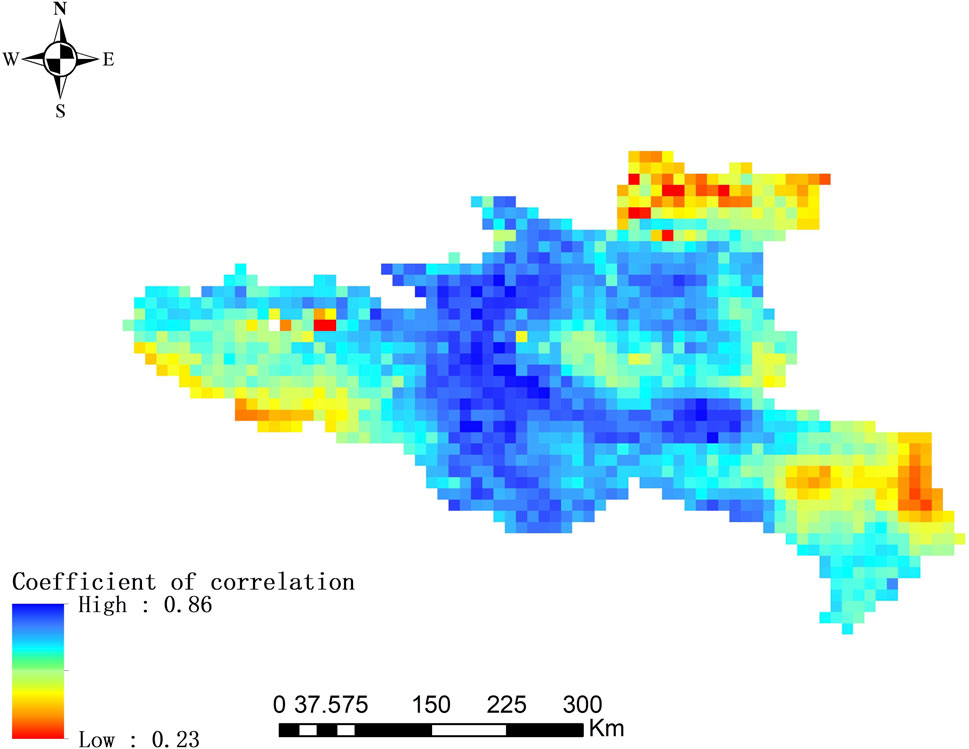
FIGURE 9. Spatial distribution of LAI correlation with precipitation rate in the Yellow River source region.
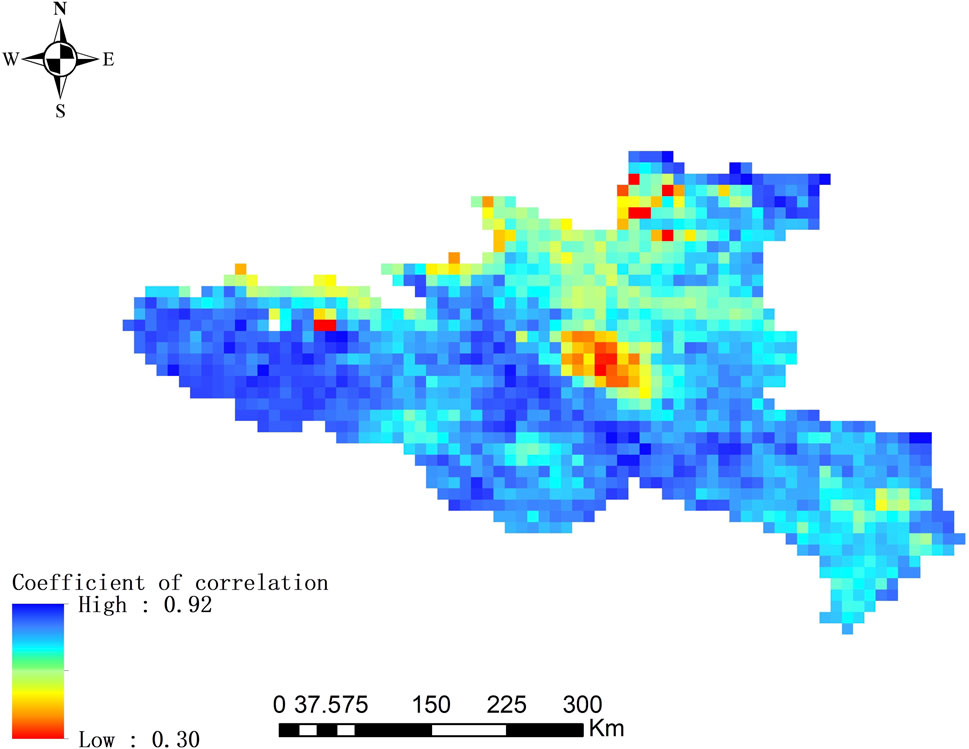
FIGURE 10. Spatial distribution of LAI correlation with temperature in the Yellow River source region.
Figure 10 shows the patterns of the correlation coefficient between annual average LAI and annual average temperature in the YRSR. From the spatial distribution, it can be seen that the regions where the annual average LAI and annual average temperature are positively correlated are extensive, except for the central region, and the positive correlation between the annual average LAI and annual average temperature is more obvious in most regions. Overall, temperature and precipitation in the YRSR have a significant impact on vegetation growth, and the degree of response to vegetation LAI is slightly different between the two.
In certain regions, there can be a time lag between LAI and precipitation. To analyze the correlations between LAI and precipitation, five different time-lag periods were considered. When the lag period was 3 months, the correlation coefficient (R) was −0.18. With a lag period of 6 months, the correlation coefficient increased to −0.68. However, when the lag period was extended to 9 months, the correlation coefficient decreased to 0.02. Interestingly, with a lag period of 12 months, the correlation coefficient significantly increased to 0.819, which is slightly higher than the correlation coefficient for 0-month lag (R = 0.818). This indicates that the highest correlation between LAI and precipitation occurs with a lag period of 12 months.
The average LAI of different land cover types from January to December in the years 2001–2020 is analyzed using CNLUCC data and shown in Figure 11. With the exception of impervious land, crop, forests, shrub, grasslands, barren, and wetland exhibit a unimodal trend of change throughout the year, while the LAI of impervious land shows two distinct peaks. In the YRSR, the LAI of vegetation rapidly increases in April and May, reaches its maximum in July, gradually decreases from August, drops below 1.0 in October, and then the rate of decline slows down. There is no significant change in LAI during the winter.
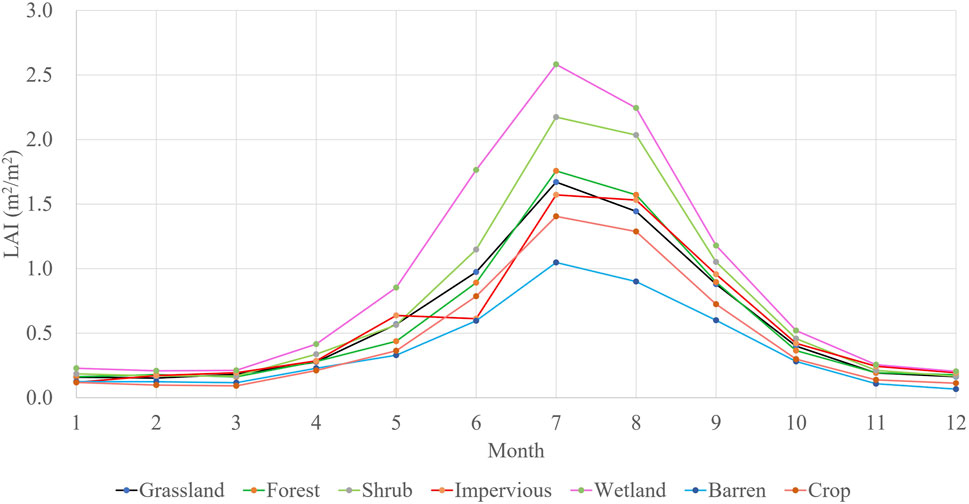
FIGURE 11. Average LAI for January ∼ December by land cover type, 2001–2020 in the Yellow River source areas.
In order to analyzing the changes of land cover on changes of LAI. Long time series of land cover types is needed. However, CNLUCC cannot provide annual land cover types data. According to the classification data of land types from 2001 to 2020, the YRSR includes 21 types of land cover, including paddy fields, forests, shrublands, sparse forests, high coverage grasslands, medium coverage grasslands, low coverage grasslands, beaches, urban land, rural residential areas, sandy areas, deserts, swamps, bare soil, rocky areas, other construction land, and others. Some of land cover types can be combined due to similar LAI trend (Figure 11). Therefore, 21 types of land cover can be represented by eight class land cover types (cropland, snow/ice, water, grassland, shrub, forest, barren and wetland) from CLCD. Therefore, the changes in the annual average LAI values of different land cover types from 2001 to 2020 were analyzed based on CLCD data and shown in Figure 12A. The LAI values of all land cover types show an upward trend, with the highest value found in wetland, followed by shrub and forest. The LAI value of Snow/Ice is the lowest. Overall, there is not much difference in the LAI trend of different land cover types in the YRSR, and the range of fluctuation of the leaf area index is between 0.2 and 1.4. The difference in LAI among land cover types from 2001 to 2020 was as follows: cropland (0.0094 years−1) > snow/ice (0.0085 years−1) >water (0.0054 years−1) > grassland (0.0053 years−1) > shrub (0.0051 years−1) = forest (0.0051 m yr−1) > barren (0.0049 years−1)>wetland (0.0044 years−1). The LAI in snow/ice and water can be seen as a combined uncertainty of the LAI product and land cover product. As the coverages and LAI of these two land cover types are relative low (Figure 12B), they can be ignored in the trend analysis.
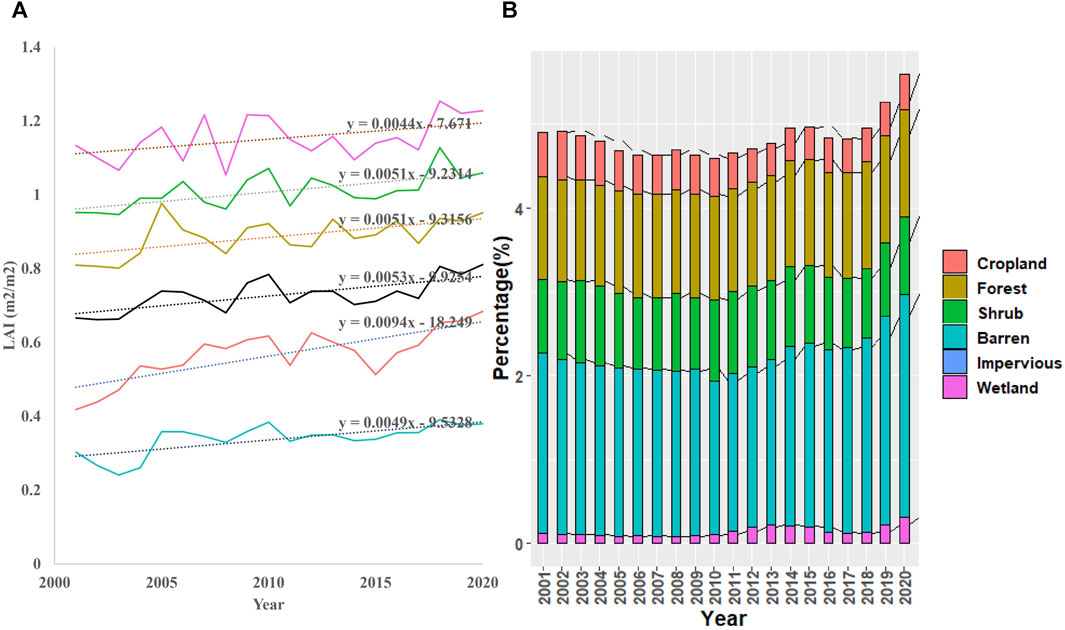
FIGURE 12. (A) Inter-annual changes in LAI of different land cover types from 2001 to 2020, black line indicates grassland and (B) shifts in the proportional coverage of different land cover types from 2001 to 2020. The rest percentage is the proportional coverage of Grassland.
The overall increase in LAI in the YRSR can be partially attributed to changes in the coverage of land cover types, primarily influenced by human land-use management. There was a conversion of approximately 149 km2 from cropland to grassland and forest, resulting in reduction of crop plant from 0.53% in 2001 to 0.43% in 2020 (Figure 13). Concurrently, the total area of forest and shrub increased from 1.22% to 0.85% in 2001 to 1.27% and 0.93% in 2021, representing an increment of around 186 km2. Conversely, there was a conversion of 1,293 km2 from grassland to other vegetation types during the period from 2001 to 2020. The area covered by grassland decreased from 93.5% in 2001 to 92.4% in 2020. Additionally, there was an increase of 0.5% in barren 0.19% in wetland. Through comparing CNLUCC and CLCD, we found that most of the barren of CLCD can be considered as Urban land use in CNLUCC. Therefore, the changes of barren and impervious can be both contributed by human activities. The changes (both of areas and percentage) of land cover types show that the human induced land cover change is small.
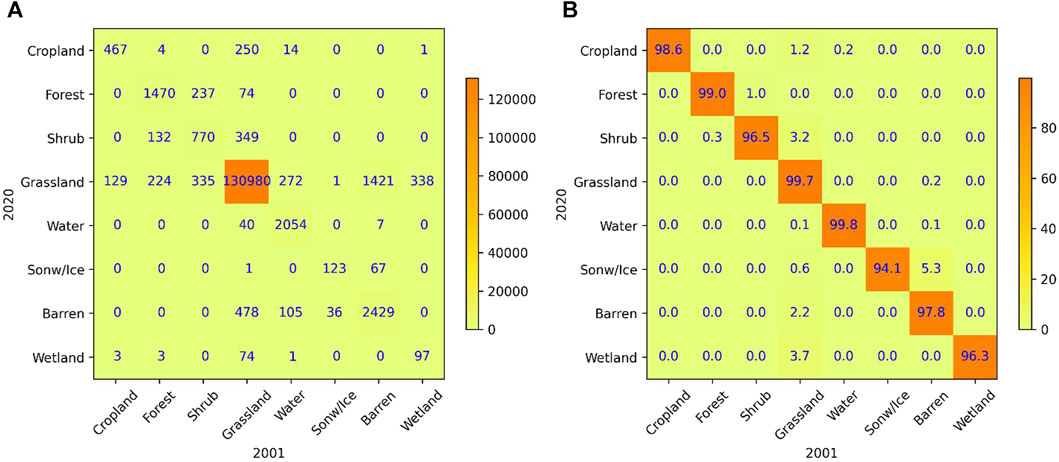
FIGURE 13. (A) Areas and (B) percentage of land transition matrix for 8 land cover types in Yellow River source areas from 2001 to 2020.
The interannual variation of PM2.5 in the YRSR from 2001 to 2020 shows a downward trend, with a range of 16.25 to 38.6 μg/m3 and a multi-year mean of 32.9 μg/m3. The PM2.5 value has generally decreased from 2001 to 2020. Figure 14 shows the spatial distribution of Slope of annual PM2.5 in the YRSR. The Slope were all significant negative (p < 0.05), with values ranging from −0.1 to 0 μg/m3. The annual decrease rate of PM2.5 was calculated to be −0.8214 μg/m3 per year, with a high correlation coefficient of 0.65, indicating a strong relationship. Furthermore, the PM2.5 data passed the significance test (p < 0.05), indicating its statistical significance. Therefore, the trend of LAI is highly correlated to PM2.5. From the spatial distribution, it can be seen that the decrease trend of PM2.5 decreased from north to south in the YRSR.
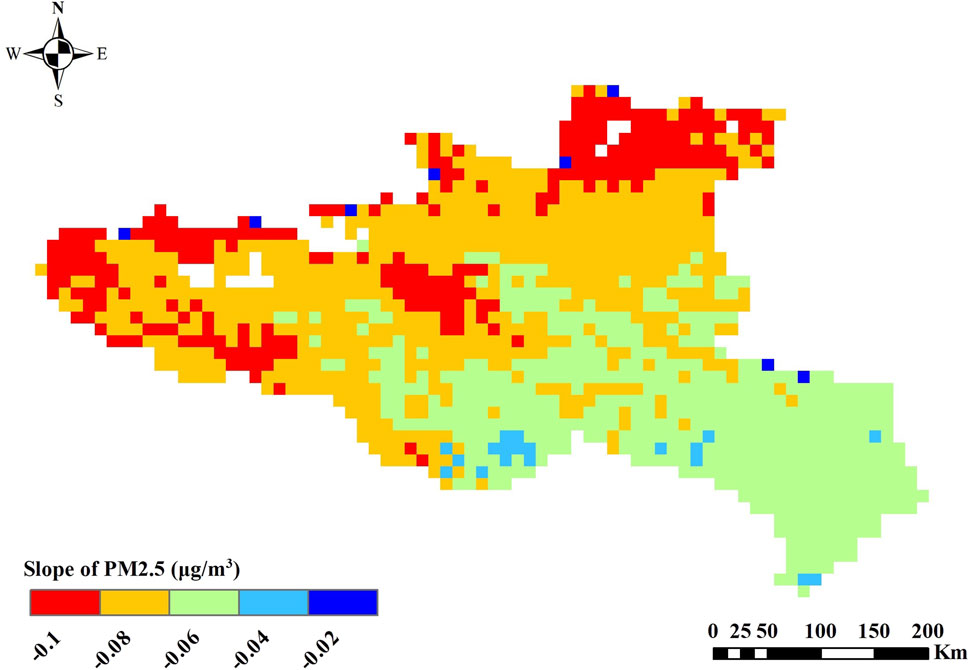
FIGURE 14. Spatial distribution of PM2.5 trend in the Yellow River source region.
Analysis of LAI data revealed a greening trend in the YRSR from 2001 to 2020, which aligns with previous studies on greening trends in China. These studies utilized different LAI datasets and focused on different time periods. Our findings are consistent with studies on vegetation dynamics in Yellow River basin, including parts of the YRSR. However, our study observed a smaller increase (0.0051−yr) in LAI compared to previous studies (Zhang et al., 2022; Qin et al., 2022; Ma et al., 2023), likely due to differences in spatial extent and LAI product uncertainties. While LAI showed an overall increasing trend throughout the year, there were significant fluctuations in different seasons. summer consistently had the highest LAI, while autumn had higher LAI than spring and winter. The spatial distribution of LAI change trends in the YRSR exhibited heterogeneity. Areas with a significant greening trend were primarily located near the Yellow River, the increase in LAI can be explained by changes in air temperature and precipitation.
Furthermore, our study identified an increase in forested areas from 2001 to 2020, with approximately 80 km2 of land transitioning from other vegetation types to forests. This greening trend has been attributed to afforestation efforts and may be influenced by China’s national ecological protection policy (Chen et al., 2020; Piao et al., 2020). The Chinese government has implemented various ecological restoration projects since 2000 to combat deforestation and soil loss (Wang et al., 2020; Pei et al., 2021). The barren land area and LAI both increased from 2001 to 2020. Though the increased barren land may degrade the total LAI trend, the mean LAI (0.793) of 2020 is still higher than that (0.653) of 2001 due the overall increasing trend of LAI for all land cover types and increased areas of shrub and wetland, etc. The mean LAI is calculated through dividing the total LAI (sum of each land cover LAI multiplied its areas) by total land areas. The overall increasing trend of LAI can be attributed to both climate change and human activities.
The variety of vegetation is influenced by both natural climate factors and human activities (Zhu et al., 2016; Chen et al., 2019; Guo et al., 2021). The effects of different meteorological factors on vegetation growth vary significantly based on regional and land cover type differences (Piao et al., 2006). Previous studies have typically focus on climate and land cover factors. Our study discovered that the positive correlation between LAI and meteorological factors differs across regions. Temperature primarily affects the physiological processes of plants, such as photosynthesis and respiration. In general, higher temperatures can enhance the rate of photosynthesis and promote plant growth (Yin et al., 2022). This is particularly true for species adapted to warmer climates (Lu et al., 2020). Therefore, a positive correlation is often observed between LAI and temperature, meaning that as temperature increases, LAI also tends to increase. On the other hand, precipitation directly affects the availability of water for plants (Lu et al., 2020). Sufficient water is crucial for plant growth, and precipitation plays a vital role in providing water to the soil. In regions with higher precipitation, there is generally more water available for plant growth, leading to increased LAI. Therefore, a positive correlation is often observed between LAI and precipitation, meaning that as precipitation increases, LAI also tends to increase. The correlation coefficient between LAI and precipitation, temperature, and PM2.5 in YRSR showed the following differences from 2001 to 2020: temperature (0.84) had the highest correlation, followed by precipitation (0.81), and then PM2.5 (0.65). Additionally, the correlation coefficient between LAI and precipitation decreases closer to the boundary of the region, whereas the correlation coefficient between LAI and temperature decreases towards the center of the region. We believe that this phenomenon occurs because when LAI is positively correlated with temperature, an increase in temperature promotes vegetation growth, while an increase in precipitation leads to a decrease in temperature. Consequently, the correlation distribution between LAI and temperature is inverse to the correlation distribution between LAI and precipitation. On the other hand, when LAI is highly correlated with temperature in the center of the YRSR, an increase in temperature inhibits vegetation growth, but precipitation is conducive to a decrease in temperature, resulting in a positive correlation between LAI and precipitation (Ma et al., 2023).
The multiple linear regression analysis of LAI, precipitation, temperature and PM2.5 showed that temperature had highest coefficient (0.018) with p-value <0.05, followed by PM2.5 (−0.0027) with p-value <0.05 and precipitation (0.00058) with p-value <0.05. The residual trend analysis of LAI, precipitation, temperature showed that the relative role of climate factors in LAI change is 61% and the relative role of human activities in LAI changes is 39% with p-value <0.01. This kind of results indicate temperature influence the LAI most, followed by PM2.5 and precipitation. The temperature is the main restricting factor for vegetation growth in the YRSR. Climate change can alter the timing of plant phenological events such as budburst and leaf senescence, which can impact LAI. For instance, earlier spring phenology due to climate change led to an increase in LAI in a temperate forest (Piao et al., 2020; Gu et al., 2022). The decreased PM2.5 indicate reduced transportation and industrial production by human activities. In this area, strict environmental protection measurements have been implemented to reduce pollution since 2000 due its significant role for the whole Yellow River system, which is the most important fresh water resources for China. These measurements include: strictly control and manage the establishment of new enterprises that have high pollution, high energy consumption, high emissions, and high-water consumption; strictly control the scale of industries such as steel, coal chemical, petrochemical, and non-ferrous metals, and eliminate outdated and excess production capacity in accordance with laws and regulations; prohibit the construction and expansion of chemical industrial parks and chemical projects within a certain range along the main and tributary rivers of the Yellow River. Prohibit unreasonable water demands such as “digging lakes for landscaping”. Moreover, the impact of human-induced land cover change was relatively minimal (Figure 13). However, the impact of reduced human activities on LAI is still lower than that of warming climate in the YRSR. Consequently, it can be concluded that climate change had more significant influence than human activities on LAI.
The restricting factors for vegetation growth in the YRSR can be attributed to a combination of temperature, precipitation, and drought. These factors interact and influence each other, ultimately impacting the overall vegetation productivity. Temperature plays a crucial role in vegetation growth as it affects various physiological processes. Higher temperatures generally promote plant growth by increasing photosynthesis rates and extending the growing season, which is the main restricting factor for vegetation growth in this area. However, extremely high temperatures can have detrimental effects, leading to heat stress and reduced plant productivity. In the YRSR, temperature-driven limitations on vegetation growth may occur during periods of excessive heat, particularly in summer months. Precipitation is another important factor influencing vegetation growth. Sufficient rainfall provides the necessary water supply for plants, supporting their growth and development. Precipitation-driven limitations occur when there is insufficient rainfall to meet the water requirements of vegetation. In the YRSR, where water resources are relatively scarce, precipitation limitations can occur during drier periods, especially in spring and autumn when rainfall is typically lower. Droughts, which are prolonged periods of abnormally low precipitation, can have a severe impact on vegetation growth. Drought-driven limitations occur when the available water is significantly reduced, leading to water stress for plants. During droughts, plants may experience reduced photosynthesis, stunted growth, and even mortality. Droughts can also lead to soil moisture depletion, making it challenging for plants to access water even when precipitation resumes. In the YRSR, droughts can be a significant restricting factor for vegetation growth, especially during periods of prolonged water scarcity. It is important to note that the relationship between temperature, precipitation, and drought in vegetation growth is complex and interconnected. While increased temperature and precipitation generally promote vegetation growth, extreme temperatures and droughts can have adverse effects. Therefore, a comprehensive understanding of the interactions between these factors is crucial for accurately assessing the limiting factors for vegetation growth in the YRSR and their impact on LAI.
There is no time lag effect for correlation coefficient analysis between PM2.5 and LAI, which indicate that they interact with each other in this region. PM2.5 is a significant component of anthropogenic aerosols and is considered a major air pollutant. These fine particles can be emitted directly into the air or can form through chemical reactions of precursor gases. PM2.5 is harmful to human health as it can penetrate deep into the respiratory system, leading to various respiratory and cardiovascular diseases. Similarly, the mechanism of PM2.5 on vegetation was also complex (Diener and Mudu, 2021). According to this mechanism, an increase in PM2.5 generally hinders vegetation growth, leading to a negative correlation between LAI and PM2.5 in the whole of YRSR. Human activities, such as industrial production, transportation, and energy generation, can contribute to the release of pollutants that lead to increased PM2.5 levels. However, it is not solely a measure of the quantity of human activities, as natural sources like dust storms, wildfires, and volcanic eruptions can also contribute to PM2.5 levels. The PM2.5 can also be affected by the LAI. Jin et al. (2014) investigates the impact of tree planting on reducing PM2.5 concentrations in urban street canyons, finding that while tree-free canyons showed declining PM2.5 concentrations with increasing height, canyons with trees had a less pronounced reduction rate and in some cases even increased concentrations at the top, suggesting that tree canopies trap PM2.5, and further analysis determined that canopy density and LAI were significant predictors for reducing PM2.5 concentrations. Therefore, it is imperative to examine and assess the association between PM2.5 and LAI to gain insights into vegetation’s sensitivity to aerosol radiative forcing and offer guidance for the development of adaptation strategies for vegetation in response to climate change.
The aim of this study was to analyze the response of LAI to climate change and human activities, and assess the correlation between PM2.5 and Leaf Area Index (LAI). The findings of this study can be used as a reference for maximizing the value of investment in ecological restoration projects, avoiding costly and simplistic plantings. However, there are certain limitations and uncertainties that may affect the interpretation of the results. Firstly, the data used in this study had inconsistent spatial resolution and projected coordinate systems, requiring resampling, which could introduce errors and affect the accuracy of the results. Secondly, the study focused on the response of vegetation to climate change, land use change, PM2.5 and the correlation between LAI and influencing factor. The relationship between human activities and climate change is complex and bidirectional, leading to uncertainty when calculating the correlation coefficient between LAI and influencing factors. Lastly, the changes in LAI are influenced by multiple factors, and this study only analyzed the correlation with temperature, precipitation, land cover change, and PM2.5, without considering factors such as carbon dioxide concentration, altitude, soil conditions, and topography.
The size of the land matrix does not necessarily determine the impact of human-induced land cover change. Even if the land matrix is small, human activities can still have significant impacts on land cover and its associated ecological and social consequences, such as the small water body areas in the main urban area of Guangzhou played a significant role in enhancing the regional ecological environment and ecosystem service function, which is crucial for improving the overall sustainability (He et al., 2021). Human-induced land cover change, such as deforestation, urbanization, and agricultural expansion, can have far-reaching effects on ecosystems, biodiversity, climate change, and local communities. These impacts can occur regardless of the size of the land matrix. It is important to consider the specific context and scale of land cover change when assessing its impact. Even small-scale land cover changes can have cumulative effects over time, leading to habitat fragmentation, loss of biodiversity, altered water cycles, and other environmental changes. It is crucial to recognize and address the potential consequences of land cover change, regardless of its scale.
Future research should address these uncertainties and incorporate more natural factors and human activities when studying long-term vegetation changes. This will help to uncover the driving mechanisms of vegetation dynamics in YRSR, providing important guidance for climate change adaptation, ecological environment protection, and future environmental decision-making.
This article aimed to analyze the spatiotemporal variations of the leaf area index (LAI) in the Yellow River source region (YRSR) and investigate its correlation with climatic and human factors. The findings revealed that over the 20-year period, the LAI of vegetation in the YRSR exhibited a normal distribution and showed an overall upward trend on an annual scale. Correlation analysis indicated a significant positive relationship between the annual average LAI and both annual precipitation and temperature in the YRSR. Specifically, areas with higher vegetation coverage and lower average temperatures exhibited stronger correlations, suggesting a greater impact of temperature on vegetation growth. Furthermore, the analysis of CNLUCC data revealed that most land cover types displayed a unimodal trend in leaf area index (LAI) fluctuations throughout the year. By examining CLCD data, it was determined that the LAI values of all land cover types in the YRSR exhibited an overall upward trend. Notably, wetland areas showed the highest LAI values, while cropland experienced the highest rate of change in LAI, and wetland areas exhibited the lowest rate of change. This suggests that changes in land cover types, such as a conversion from cropland to grassland and forest, an increase in forest and shrub areas, and a decrease in grassland area, contributed to the overall increase in LAI in the YRSR. However, the impact of human-induced land cover change was relatively small. Additionally, the interannual variation of PM2.5 in the YRSR from 2001 to 2020 demonstrated a downward trend, indicating a strong correlation with the trend of LAI. Multiple linear regression analysis considering climate factors and PM2.5 showed that temperature had the strongest impact on LAI. Additionally, residual trend analysis suggested that changes in LAI could be attributed to both human activities and climate factors, with climate change exerting a more significant influence on LAI than human activities.
The raw data supporting the conclusion of this article will be made available by the authors, without undue reservation.
YZ: Conceptualization, Data curation, Formal Analysis, Investigation, Methodology, Software, Validation, Visualization, Writing–original draft, Writing–review and editing. JH: Conceptualization, Writing–review and editing. WH: Resources, Writing–review and editing. PD: Writing–review and editing. CH: Conceptualization, Funding acquisition, Project administration, Supervision, Writing–review and editing.
The author(s) declare that financial support was received for the research, authorship, and/or publication of this article. This work is supported by National Natural Science Foundation of China (grant number 42130113), the Open Research Program of the International Research Center of Big Data for Sustainable Development Goals, Grant No. CBAS2023ORP04, the Natural Science Foundation of Gansu province, China (Grant No.22JR5RA070 and 22JR5RA060), the Strategic Priority Research Program of the Chinese Academy of Sciences (XDA19040504), and the Basic Research Innovative Groups of Gansu province, China (Grant No.21JR7RA068).
We are grateful for the use of GIMSS LAI4g, TMPA and MODIS LST product in this study. We are appreciative for the usage of the opensource data in this study.
The authors declare that the research was conducted in the absence of any commercial or financial relationships that could be construed as a potential conflict of interest.
All claims expressed in this article are solely those of the authors and do not necessarily represent those of their affiliated organizations, or those of the publisher, the editors and the reviewers. Any product that may be evaluated in this article, or claim that may be made by its manufacturer, is not guaranteed or endorsed by the publisher.
Abubakar, M., Chanzy, A., Pouget, G., Flamain, F., and Courault, D. (2022). Detection of irrigated permanent grasslands with sentinel-2 based on temporal patterns of the leaf area index (LAI). Remote Sens. 14, 3056. doi:10.3390/rs14133056
Albergel, C., Munier, S., Bocher, A., Bonan, B., Zheng, Y. J., Draper, C., et al. (2018). LDAS-monde sequential assimilation of satellite derived observations applied to the contiguous US: an ERA-5 driven reanalysis of the land surface variables. Remote Sens. 10, 1627. doi:10.3390/rs10101627
Amin, E., Belda, S., Pipia, L., Szantoi, Z., El Baroudy, A., Moreno, J., et al. (2022). Multi-season phenology mapping of nile delta croplands using time series of sentinel-2 and Landsat 8 green LAI. Remote Sens. 14, 1812. doi:10.3390/rs14081812
Bajocco, S., Ginaldi, F., Savian, F., Morelli, D., Scaglione, M., Fanchini, D., et al. (2022). On the use of NDVI to estimate LAI in field crops: implementing a conversion equation library. Remote Sens. 14, 3554. doi:10.3390/rs14153554
Bao, C., Chai, P., Lin, H., Zhang, Z., Ye, Z., Gu, M., et al. (2016). Association of PM2.5 pollution with the pattern of human activity: a case study of a developed city in eastern China. J. Air and Waste Manag. Assoc. 66, 1202–1213. doi:10.1080/10962247.2016.1206996
Baret, F., Hagolle, O., Geiger, B., Bicheron, P., Miras, B., Huc, M., et al. (2007). LAI, fAPAR and fCover CYCLOPES global products derived from VEGETATION - Part 1: principles of the algorithm. Remote Sens. Environ. 110, 275–286. doi:10.1016/j.rse.2007.02.018
Baret, F., Weiss, M., Lacaze, R., Camacho, F., Makhmara, H., Pacholcyzk, P., et al. (2013). GEOV1: LAI and FAPAR essential climate variables and FCOVER global time series capitalizing over existing products. Part1: principles of development and production. Remote Sens. Environ. 137, 299–309. doi:10.1016/j.rse.2012.12.027
Buitenwerf, R., Sandel, B., Normand, S., Mimet, A., and Svenning, J.-C. (2018). Land surface greening suggests vigorous woody regrowth throughout European semi-natural vegetation. Glob. Change Biol. 24, 5789–5801. doi:10.1111/gcb.14451
Caballero, G., Pezzola, A., Winschel, C., Casella, A., Angonova, P. S., Orden, L., et al. (2022). Quantifying irrigated winter wheat LAI in Argentina using multiple sentinel-1 incidence angles. Remote Sens. 14, 5867. doi:10.3390/rs14225867
Cai, S. H., Song, X. N., Hu, R. H., and Guo, D. (2021). Ecosystem-Dependent responses of vegetation coverage on the Tibetan plateau to climate factors and their lag periods. Isprs Int. J. Geo-Information 10, 394. doi:10.3390/ijgi10060394
Cao, S., Li, M., Zhu, Z., Zha, J., Zhao, W., Duanmu, Z., et al. (2023). Spatiotemporally consistent global dataset of the GIMMS leaf area index (GIMMS LAI4g) from 1982 to 2020. Earth Syst. Sci. Data Discuss. 2023, 4877–4899. doi:10.5194/essd-15-4877-2023
Chen, J. M., Ju, W. M., Ciais, P., Viovy, N., Liu, R. G., Liu, Y., et al. (2019). Vegetation structural change since 1981 significantly enhanced the terrestrial carbon sink. Nat. Commun. 10, 4259. doi:10.1038/s41467-019-12257-8
Chen, Y. Z., Chen, L. Y., Cheng, Y., Ju, W. M., Chen, H. Y. H., and Ruan, H. H. (2020). Afforestation promotes the enhancement of forest LAI and NPP in China. For. Ecol. Manag. 462, 117990. doi:10.1016/j.foreco.2020.117990
Dai, X., Fan, W., Shan, Y., Gao, Y., Liu, C., Nie, R., et al. (2022). LAI-based phenological changes and climate sensitivity analysis in the three-river headwaters region. Remote Sens. 14, 3748. doi:10.3390/rs14153748
Diener, A., and Mudu, P. (2021). How can vegetation protect us from air pollution? A critical review on green spaces' mitigation abilities for air-borne particles from a public health perspective - with implications for urban planning. Sci. Total Environ. 796, 148605. doi:10.1016/j.scitotenv.2021.148605
Gu, H., Qiao, Y., Xi, Z., Rossi, S., Smith, N. G., Liu, J., et al. (2022). Warming-induced increase in carbon uptake is linked to earlier spring phenology in temperate and boreal forests. Nat. Commun. 13, 3698. doi:10.1038/s41467-022-31496-w
Guo, D., Song, X., Hu, R., Ma, R., Zhang, Y., Gao, L., et al. (2023). Spatio-temporal variation in leaf area index in the Yan Mountains over the past 40 years and its relationship to hydrothermal conditions. Ecol. Indic. 157, 111291. doi:10.1016/j.ecolind.2023.111291
Guo, D., Song, X. N., Hu, R. H., Cai, S. H., Zhu, X. M., and Hao, Y. B. (2021). Grassland type-dependent spatiotemporal characteristics of productivity in Inner Mongolia and its response to climate factors. Sci. Total Environ. 775, 145644. doi:10.1016/j.scitotenv.2021.145644
He, Y., Wang, W., Chen, Y., and Yan, H. (2021). Assessing spatio-temporal patterns and driving force of ecosystem service value in the main urban area of Guangzhou. Sci. Rep. 11, 3027. doi:10.1038/s41598-021-82497-6
Iwahashi, Y., Ye, R., Kobayashi, S., Yagura, K., Hor, S., Soben, K., et al. (2021). Quantification of changes in rice production for 2003-2019 with MODIS LAI data in pursat province, Cambodia. Remote Sens. 13, 1971. doi:10.3390/rs13101971
Jin, S., Guo, J., Wheeler, S., Kan, L., and Che, S. (2014). Evaluation of impacts of trees on PM2.5 dispersion in urban streets. Atmos. Environ. 99, 277–287. doi:10.1016/j.atmosenv.2014.10.002
Knyazikhin, Y., Martonchik, J. V., Myneni, R. B., Diner, D. J., and Running, S. W. (1998). Synergistic algorithm for estimating vegetation canopy leaf area index and fraction of absorbed photosynthetically active radiation from MODIS and MISR data. J. Geophys. Res. Atmos. 103, 32257–32275. doi:10.1029/98jd02462
Kobayashi, T., Kobayashi, H., Yang, W., Murakami, H., Honda, Y., and Nasahara, K. N. (2023). The development of a global LAI and FAPAR product using GCOM-C/SGLI data. Isprs J. Photogrammetry Remote Sens. 202, 479–498. doi:10.1016/j.isprsjprs.2023.07.003
Li, D., Xu, F., Chen, Z., Xie, X., Fan, K., and Zeng, Z. (2024). Fine simulation of PM2.5 combined with NPP-VIIRS night light remote sensing and mobile monitoring data. Sci. total Environ. 914, 169955. doi:10.1016/j.scitotenv.2024.169955
Li, M., Wu, P., Ma, Z., and Liu, J. (2022). Prominent vegetation greening in spring and autumn across China during the 1981-2018 period. Environ. Res. Lett. 17, 124043. doi:10.1088/1748-9326/aca8be
Liu, B. M., Ma, X., Guo, J. P., Li, H., Jin, S. K., Ma, Y. Y., et al. (2023). Estimating hub-height wind speed based on a machine learning algorithm:implications for wind energy assessment. Atmos. Chem. Phys. 23, 3181–3193. doi:10.5194/acp-23-3181-2023
Lu, Q., Jiang, T., Liu, D., and Liu, Z. (2020). The response characteristics of NDVI with different vegetation cover types to temperature and precipitation in China. Ecol. Environ. Sci. 29, 23–34. doi:10.16258/j.cnki.1674-5906.2020.01.003
Ma, Y., Wang, W., Jin, S., Li, H., Liu, B., Gong, W., et al. (2023). Spatiotemporal variation of LAI in different vegetation types and its response to climate change in China from 2001 to 2020. Ecol. Indic. 156, 111101. doi:10.1016/j.ecolind.2023.111101
Mao, J., Shi, X., Thornton, P. E., Hoffman, F. M., Zhu, Z., and Myneni, R. B. (2013). Global latitudinal-asymmetric vegetation growth trends and their driving mechanisms: 1982-2009. Remote Sens. 5, 1484–1497. doi:10.3390/rs5031484
Mota, B., Gobron, N., Morgan, O., Cappucci, F., Lanconelli, C., and Robustelli, M. (2021). Cross-ECV consistency at global scale: LAI and FAPAR changes. Remote Sens. Environ. 263, 112561. doi:10.1016/j.rse.2021.112561
Pei, H. W., Liu, M. Z., Jia, Y. G., Zhang, H. J., Li, Y. L., and Xiao, Y. X. (2021). The trend of vegetation greening and its drivers in the Agro-pastoral ecotone of northern China, 2000-2020. Ecol. Indic. 129, 108004. doi:10.1016/j.ecolind.2021.108004
Peng, J., Jiang, H., Liu, Q., Green, S. M., Quine, T. A., Liu, H., et al. (2021a). Human activity vs climate change: distinguishing dominant drivers on LAI dynamics in karst region of southwest China. Sci. Total Environ. 769, 144297. doi:10.1016/j.scitotenv.2020.144297
Peng, X., Han, W., Ao, J., and Wang, Y. (2021b). Assimilation of LAI derived from UAV multispectral data into the SAFY model to estimate maize yield. Remote Sens. 13, 1094. doi:10.3390/rs13061094
Piao, S. L., Mohammat, A., Fang, J. Y., Cai, Q., and Feng, J. M. (2006). NDVI-based increase in growth of temperate grasslands and its responses to climate changes in China. Glob. Environ. Change-Human Policy Dimensions 16, 340–348. doi:10.1016/j.gloenvcha.2006.02.002
Piao, S. L., Wang, X. H., Park, T., Chen, C., Lian, X., He, Y., et al. (2020). Characteristics, drivers and feedbacks of global greening. Nat. Rev. Earth Environ. 1, 14–27. doi:10.1038/s43017-019-0001-x
Pu, J., Yan, K., Gao, S., Zhang, Y., Park, T., Sun, X., et al. (2023). Improving the MODIS LAI compositing using prior time-series information. Remote Sens. Environ. 287, 113493. doi:10.1016/j.rse.2023.113493
Qin, G., Meng, Z., and Fu, Y. (2022). Drought and water-use efficiency are dominant environmental factors affecting greenness in the Yellow River Basin, China. Sci. Total Environ. 834, 155479. doi:10.1016/j.scitotenv.2022.155479
Running, S. W., Baldocchi, D. D., Turner, D. P., Gower, S. T., Bakwin, P. S., and Hibbard, K. A. (1999). A global terrestrial monitoring network integrating tower fluxes, flask sampling, ecosystem modeling and EOS satellite data. Remote Sens. Environ. 70, 108–127. doi:10.1016/s0034-4257(99)00061-9
Shabanov, N. V., Marshall, G. J., Rees, W. G., Bartalev, S. A., Tutubalina, O. V., and Golubeva, E. I. (2021). Climate-driven phenological changes in the Russian Arctic derived from MODIS LAI time series 2000-2019. Environ. Res. Lett. 16, 084009. doi:10.1088/1748-9326/ac0be2
Shi, S. Y., Yu, J. J., Wang, F., Wang, P., Zhang, Y. C., and Jin, K. (2021). Quantitative contributions of climate change and human activities to vegetation changes over multiple time scales on the Loess Plateau. Sci. Total Environ. 755, 142419. doi:10.1016/j.scitotenv.2020.142419
Ukasha, M., Ramirez, J. A., and Niemann, J. D. (2022). Temporal variations of NDVI and LAI and interactions with hydroclimatic variables in a large and agro-ecologically diverse region. J. Geophys. Research-Biogeosciences 127. doi:10.1029/2021jg006395
Wang, H. Q., Sun, B. P., Yu, X. X., Xin, Z. B., and Jia, G. D. (2020). The driver-pattern-effect connection of vegetation dynamics in the transition area between semi-arid and semi-humid northern China. Catena 194, 104713. doi:10.1016/j.catena.2020.104713
Wei, J., Li, Z., Lyapustin, A., Sun, L., Peng, Y., Xue, W., et al. (2021). Reconstructing 1-km-resolution high-quality PM2.5 data records from 2000 to 2018 in China: spatiotemporal variations and policy implications. Remote Sens. Environ. 252, 112136. doi:10.1016/j.rse.2020.112136
Wong, A. Y. H., Tai, A. P. K., and Ip, Y.-Y. (2018). Attribution and statistical parameterization of the sensitivity of surface ozone to changes in leaf area index based on a chemical transport model. J. Geophys. Research-Atmospheres 123, 1883–1898. doi:10.1002/2017jd027311
Xiao, Z., Liang, S., Wang, J., Chen, P., Yin, X., Zhang, L., et al. (2014). Use of general regression neural networks for generating the GLASS leaf area index product from time-series MODIS surface reflectance. IEEE Trans. Geoscience Remote Sens. 52, 209–223. doi:10.1109/tgrs.2013.2237780
Xiao, Z. Q., Liang, S. L., Wang, J. D., Xiang, Y., Zhao, X., and Song, J. L. (2016). Long-time-series global land surface satellite leaf area index product derived from MODIS and AVHRR surface reflectance. Ieee Trans. Geoscience Remote Sens. 54, 5301–5318. doi:10.1109/tgrs.2016.2560522
Xue, W. H., Zhang, J., Qiao, Y., Wei, J., Lu, T. W., Che, Y. F., et al. (2020). Spatiotemporal variations and relationships of aerosol-radiation-ecosystem productivity over China during 2001-2014. Sci. Total Environ. 741, 140324. doi:10.1016/j.scitotenv.2020.140324
Yan, K., Park, T., Chen, C., Xu, B. D., Song, W. J., Yang, B., et al. (2018). Generating global products of LAI and FPAR from SNPP-VIIRS data: theoretical background and implementation. Ieee Trans. Geoscience Remote Sens. 56, 2119–2137. doi:10.1109/tgrs.2017.2775247
Yan, K., Pu, J., Park, T., Xu, B., Zeng, Y., Yan, G., et al. (2021). Performance stability of the MODIS and VIIRS LAI algorithms inferred from analysis of long time series of products. Remote Sens. Environ. 260, 112438. doi:10.1016/j.rse.2021.112438
Yang, J., and Huang, X. (2021). The 30 m annual land cover dataset and its dynamics in China from 1990 to 2019. Earth Syst. Sci. Data 13, 3907–3925. doi:10.5194/essd-13-3907-2021
Yin, Y. H., Deng, H. Y., and Ma, D. Y. (2022). Complex effects of moisture conditions and temperature enhanced vegetation growth in the Arid/humid transition zone in Northern China. Sci. Total Environ. 805, 150152. doi:10.1016/j.scitotenv.2021.150152
Zeng, Z., Piao, S., Li, L. Z. X., Zhou, L., Ciais, P., Wang, T., et al. (2017). Climate mitigation from vegetation biophysical feedbacks during the past three decades. Nat. Clim. Change 7, 432–436. doi:10.1038/nclimate3299
Zhang, J., Ding, J. H., Zhang, J., Yuan, M. S., Li, P., Xiao, Z. Y., et al. (2020). Effects of increasing aerosol optical depth on the gross primary productivity in China during 2000-2014. Ecol. Indic. 108, 105761. doi:10.1016/j.ecolind.2019.105761
Zhang, W., Luo, G., Chen, C., Ochege, F. U., Hellwich, O., Zheng, H., et al. (2021). Quantifying the contribution of climate change and human activities to biophysical parameters in an arid region. Ecol. Indic. 129, 107996. doi:10.1016/j.ecolind.2021.107996
Zhang, W. Q., Jin, H. A., Li, A. N., Shao, H. Y., Xie, X. Y., Lei, G. B., et al. (2022a). Comprehensive assessment of performances of long time-series LAI, FVC and gpp products over mountainous areas: a case study in the three-River Source region, China. Remote Sens. 14, 61. doi:10.3390/rs14010061
Zhang, X., Cao, Q., Chen, H., Quan, Q., Li, C., Dong, J., et al. (2022b). Effect of vegetation carryover and climate variability on the seasonal growth of vegetation in the upper and middle reaches of the Yellow River Basin. Remote Sens. 14, 5011. doi:10.3390/rs14195011
Zhao, Y., Feng, J., Luo, L., Bai, L., Wan, H., and Ren, H. (2021). Monitoring cropping intensity dynamics across the north China plain from 1982 to 2018 using GLASS LAI products. Remote Sens. 13, 3911. doi:10.3390/rs13193911
Zhou, Y., Li, L., Sun, R., Gong, Z., Bai, M., and Wei, G. (2019). Haze influencing factors: a data envelopment analysis approach. Int. J. Environ. Res. Public Health 16, 914. doi:10.3390/ijerph16060914
Zhou, Y., Li, Y., Li, W., Li, F., and Xin, Q. (2022). Ecological responses to climate change and human activities in the arid and semi-arid regions of xinjiang in China. Remote Sens. 14, 3911. doi:10.3390/rs14163911
Zhu, B., Chen, S., Xu, Z., Ye, Y., Han, C., Lu, P., et al. (2023). The estimation of maize grain protein content and yield by assimilating LAI and LNA, retrieved from canopy remote sensing data, into the DSSAT model. Remote Sens. 15, 2576. doi:10.3390/rs15102576
Zhu, Z., Piao, S., Lian, X., Myneni, R. B., Peng, S., and Yang, H. (2017). Attribution of seasonal leaf area index trends in the northern latitudes with "optimally" integrated ecosystem models. Glob. Change Biol. 23, 4798–4813. doi:10.1111/gcb.13723
Keywords: LAI, Yellow River, remote sensing, multisource data, climate change
Citation: Zhang Y, Hou J, Han W, Dou P and Huang C (2024) Spatio-temporal analysis of LAI using multisource remote sensing data for source region of Yellow River Basin. Front. Environ. Sci. 12:1320881. doi: 10.3389/fenvs.2024.1320881
Received: 13 October 2023; Accepted: 16 February 2024;
Published: 27 February 2024.
Edited by:
Fang Chen, Chinese Academy of Sciences (CAS), ChinaReviewed by:
Abdelazim Negm, Zagazig University, EgyptCopyright © 2024 Zhang, Hou, Han, Dou and Huang. This is an open-access article distributed under the terms of the Creative Commons Attribution License (CC BY). The use, distribution or reproduction in other forums is permitted, provided the original author(s) and the copyright owner(s) are credited and that the original publication in this journal is cited, in accordance with accepted academic practice. No use, distribution or reproduction is permitted which does not comply with these terms.
*Correspondence: Chunlin Huang, aHVhbmdjbEBsemIuYWMuY24=
Disclaimer: All claims expressed in this article are solely those of the authors and do not necessarily represent those of their affiliated organizations, or those of the publisher, the editors and the reviewers. Any product that may be evaluated in this article or claim that may be made by its manufacturer is not guaranteed or endorsed by the publisher.
Research integrity at Frontiers
Learn more about the work of our research integrity team to safeguard the quality of each article we publish.