
94% of researchers rate our articles as excellent or good
Learn more about the work of our research integrity team to safeguard the quality of each article we publish.
Find out more
ORIGINAL RESEARCH article
Front. Environ. Sci., 07 May 2024
Sec. Drylands
Volume 12 - 2024 | https://doi.org/10.3389/fenvs.2024.1319912
 Santanu Kumar Bal1Huchahanumegowdanapalya S. Shivaramu2*Puppala Vijaya Kumar1
 Huggi Lingaraj2Vadakkemethel M. Sandeep1A. V. M. Subba Rao
 Malamal Alickal Sarath Chandran1*Narayanan Manikandan1Matadadoddi N. ThimmegowdaMelekote H. Manjunatha2
 Sadhineni N. Malleswari3
 Arvind Tupe4Gunasekaran Sudhakar5
 Kailash K. Dakhore6Sundararaj Subbulakshmi5
 Paramjit Singh Minhas7Vinod Kumar Singh1Rajbir Singh8
Background: Peninsular India, being completely under the influence of monsoonal climate, suffers crop yield variability due to rainfall distribution-induced soil moisture constraints. Timely and appropriate assessment of this rainfall and soil moisture-induced crop yield variability serves as a key for exemplary relief assistance. Per cent available soil moisture (PASM) is one among several drought declaration indices followed by stakeholders in India for declaration of drought, needs re-evaluation as the existing criteria in unable to capture the yield loss due to ineffective classification of PASM categories. This study attempts to revise the agricultural drought classes by PASM based on relationships established between yield of major rainfed crops of the study region and PASM.
Methods: Analysis of yield variability due to PASM was carried out based on long term observations in experiments conducted at five dry farming locations (Akola, Parbhani, Kovilpatti, Ananthapuramu and Bengaluru) of peninsular India. The average yield for each category of PASM was calculated and tabulated for regression analysis. The PASM versus yield in each group was correlated and regression equations were developed if significant positive correlations were established.
Results: The range of available soil moisture to obtain at least 50 percent of optimum yield in cereals (maize: 26 and finger millet: 52.9 PASM), pulses (pigeon pea: 37.2 PASM), oilseeds (soybean: 26.8 to 30.5, groundnut: 53.8 to 61.7 PASM) and commercial crops (cotton: 26.3 PASM) was 26–61 percent.
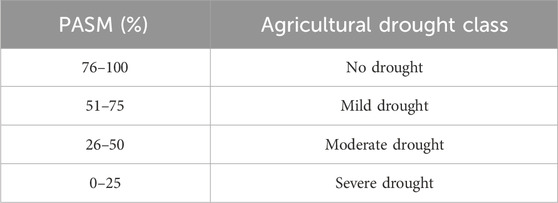
Conclusion: The revised PASM-based drought classes (0–50 severe; 51–75 mild and 76–100 no drought) would help in drought declaration and precise identification of drought-hit areas for meaningful relief assistance. However, there is further investigation is needed to include a soil component for further fine-tuning of the criteria.
One-third of the population of the world lives in regions stressed by water. With the changes in climatic patterns and frequent global warming reporting in recent decades, the hydrological regimes in which crops grow are getting altered and crop growth is affected (McCarthy et al., 2005). Water availability is a significant cause of variability in crop yields in many conditions (Bal et al., 2022; Waseem et al., 2022). Changes in seasonal precipitation, in-season precipitation, and inter-annual variation of precipitation affect the soil water regime. Precipitation is recognized globally as a leading factor affecting, in particular, the yield of rainfed crops (Izaurralde et al., 2003). The Indian sub-continent experiences large-scale drought in some part or the other, almost every year (Zhang et al., 2016). Drought occurs in nearly all climatic zones of the world at one time or another, but this creeping phenomenon mostly affects the tropics and adjoining regions (Khanday and Javed, 2008). Even though, the relationship between soil moisture and rainfall is consistent but non-linear (Douville et al., 2001). In the preview of such variability, the seasonal rainfall variability affects the variability in soil moisture, which influences the wetness/dryness of monsoon season needs to be understood (Douville et al., 2001; Bal et al., 2022). Many past researches on soil moisture as a boundary forcing to the atmospheric precipitation suggested that reduced soil moisture during the monsoonal periods could induce a dry summer condition over a particular region (Namias, 1960). Therefore, the study of soil moisture is imperative to understanding the behavior of the Indian monsoon system. “Drought Declaration” means the beginning of the government’s response to circumstances that reflect a situation of drought. The decision to declare the drought over a designated administrative unit level (District/Taluka/Tehsil/Block/Gram Panchayat) should be directed and made without undue delay by objective criteria so that relief assistance and concessions can be given in time to the citizens affected by drought (Neenu et al., 2013). Five categories of indices are recommended to construct a drought matrix by the Government of India (Anon, 2016). They are rainfall-related indices (rainfall deviation, dry spell, standardized precipitation index), remote sensing-based vegetation indices, crop situation-related indices (area under sowing), soil moisture-based indices (percent available soil moisture, moisture adequacy index) and hydrological indices (reservoir storage index, groundwater drought index, stream-flow drought index).
These drought declaration criteria are general, i.e., independent of crops. But, in many environments, water supply is a major source of variability in crop yields (Ritchie, 1983). Deficit precipitation affects crop yields, especially if rainfall doesn’t occur in time or dry periods occur during critical development stages. Moisture stress during the flowering, pollination, and grain-filling stages is especially harmful to maize (Denmead and Shaw, 1960), soybean (Bharat et al., 2019), wheat (Decker et al., 1986) and sorghum (Machado et al., 2002). In such a situation, available soil moisture is a very relevant indicator of drought, especially in regions fed by rain (Stephens and Lyons, 1998).
Soil-moisture balance technique may be used to measure the soil moisture-based indices, which includes gathering some of the baseline data related to soil properties, climate parameters, and pattern of crop growth (Doorenbos and Pruitt, 1977). Soil moisture balance measures the amount of rainfall accessible to crops depending upon crop water requirement, climatic evaporative demand, and soil water holding capacity (Betts, 2004; Shewale and Shravankumar, 2005). In the latest revision of the Drought Manual (2016), brought out by the Government of India, Percent Available Soil Moisture (PASM) was included as one of the parameters for the drought declaration protocol.
Though the inclusion of PASM has improved the drought declaration protocol, sometimes farmers could not get assistance because of non-declaration of drought even if there was a significant loss in crop yield. Hence, the present study was conducted to fine-tune the relationships between soil moisture availability and with yield of major rainfed crops in various locations of peninsular (central and southern) India to refine the drought categories using PASM. The following research questions were tried to address in the present study 1) Does the existing PASM criteria can precisely capture severe and moderate agricultural drought? 2) If no, how to re-evaluate the criteria and make suitable revision?
Long-term experiments were conducted on predominant rainfed crops at 5 centers of the All India Coordinated Research Project on Agrometeorology (AICRPAM), Indian Council of Agricultural Research, representing different soil and climatic conditions (Figure 1). Brief information on experimental locations and data availability for the study is given in Table 1. The field experiments were conducted in a randomized block design (RBD) with the date of sowings and cultivars as treatments. Among the selected study locations, Akola and Parbhani are located in Vidarbha and Marathwada regions respectively, in Maharashtra state. Cotton, sorghum, soybean, pigeon pea, and other pulses are the main Kharif crops, while wheat, sorghum, and gram are major rabi crops grown in these regions. Soil moisture will be sufficient for short-duration crops, while for long-duration crops like pigeon pea, cotton, etc., the crop suffers from moisture stress during physiological maturity (Ashok, 2013; Parmeshwar et al., 2014) necessitating studies on soil water balance, crop-water relations.

Figure 1. Geographical locations and selected crops of the study area.
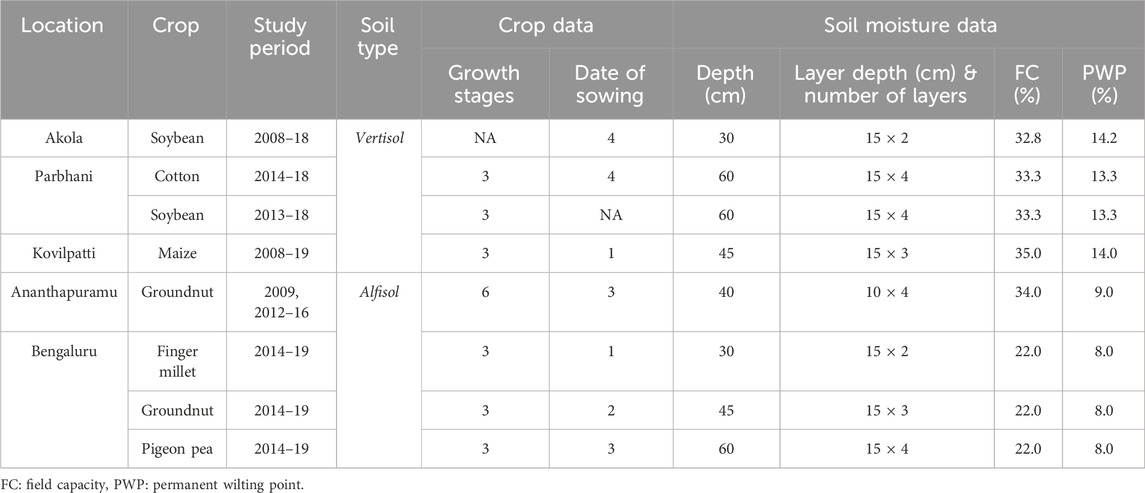
Table 1. Crop and soil dataset availability at the study locations.
Ananthapuramu, being located in the dry plains of southwestern Andhra Pradesh, receives less rain from both Southwest and Northeast monsoons due to obstruction caused by the Western Ghats of Karnataka and Eastern Ghats of Tamil Nadu (Waghaye et al., 2018). The Bengaluru region, classified under the eastern dry zone of Karnataka, receives rainfall in two peaks, one in May and another in September month, making it inconvenient to grow medium to long-duration crops because of improper onset of monsoon and its ill distribution (Sanjeevaiah et al., 2021). Even though the farmers make potential use of available rainfall to grow crops like pigeon pea, groundnut, sunflower, rice, cotton, maize, chillies, sesame, finger millet, and sugarcane, etc. Usually, these crops are sown immediately after the onset of monsoon rainfall, i.e., in the month of June-July. The crops may make full use of available soil moisture at early stages (July-September) to attain vegetative and reproductive stages but, may suffer moisture deficit at late maturity stages due to a decrease in rainfall, leading to loss of yields.
Kovilpatti is situated amid the vertisol belt in the southern agro-climatic zone of Tamil Nadu. It is characterized by the least rainfall-receiving area in the state (Anon, 2020), receiving 646.8 mm of rainfall (29% CV) only 60 mm of which falls during 4 months of monsoon season. 427.7 mm of rain falls during the North-east monsoon period (October—December). The understanding of spatial-temporal heterogeneity in rainfall over the five selected locations helps to understand the interactions between crop and environment (Bal and Minhas, 2017).
The impact of rainfall on soil moisture is related to the change of the soil moisture field, which is dominated by the water-diffusing mechanism, surface run-off during the rainy period, or diffusion through the medium during the rainy period. It is also observed that in these regions the correlation time or opportunity time of rainfall is much smaller, which shrinks the time available for infiltration into the soil, implicating more runoff than that of the soil moisture field (Guhathakurta and Saji, 2013). This gap among the rainfall, runoff, and available soil moisture limits the impact of the rainfall on the soil moisture field variability (Chulsang et al., 1998) thereby affecting the crops and cropping systems of these regions.
All the study locations fall under the typical Indian monsoon climate, characterized by two peaks of rainfall during the South-west monsoon (June to September) and North-east monsoon (October to December) (Parthasarathy et al., 1995; Pulak et al., 2020). Daily rainfall data of these locations during the study period was obtained from automatic weather stations (AWS) located in each center. The mean monthly, South-west monsoon, and annual rainfall along with the coefficient of variation of these locations during the study period are furnished in Figure 2.
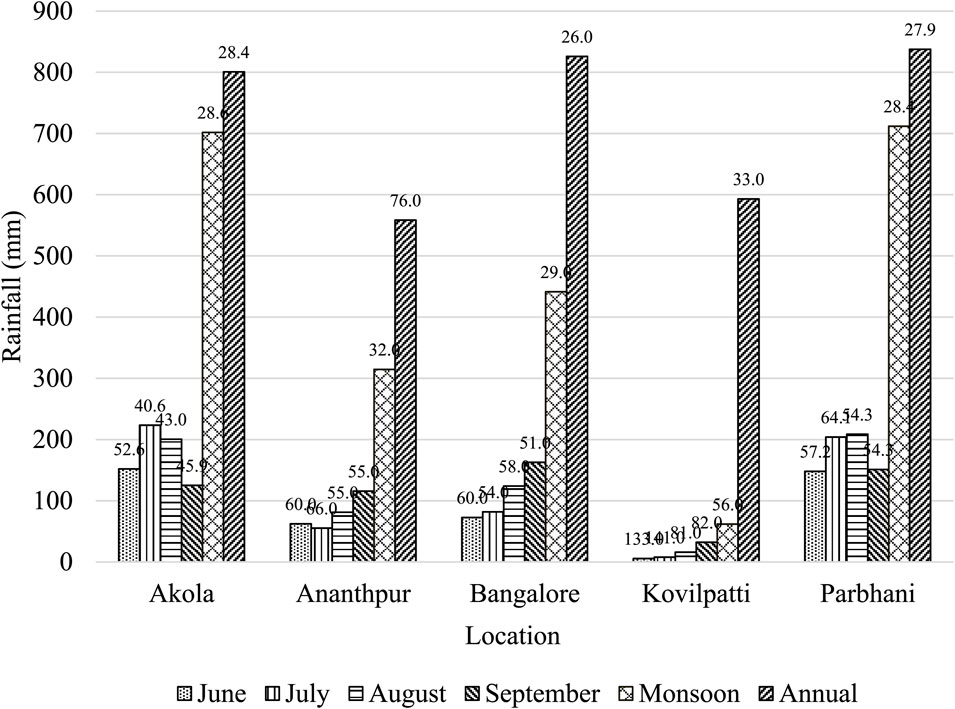
Figure 2. Mean monthly, monsoonal and annual rainfall (average of 30 years; 1989–2019) during monsoon period in different study locations (Values on each bar indicate the coefficient of variation).
The soils of the study locations were classifiable into two broad categories; vertisols (Akola, Parbhani, and Kovilpatti) and alfisols (Anantapuramu and Bengaluru) (Chary et al., 2020). Vertisols of Akola and Parbhani were deep, calcareous, clayey, and very dark greyish brown to dark brown in colour, with low electrical conductivity (EC ⩽ 2 dS m−1), alkaline, and had exchangeable sodium percentage (ESP) less than 5. The soils were characterized by the presence of deep cracks during summer (low rainfall periods) due to the swelling and shrinkage property of the clay in the soil (Balpande et al., 2006) which helps in soaking deeper layers of soil soon after receipt of rainfall. Whereas, vertisols of Kovilpatti were clay loam, alkaline (pH: 8.04) and had low EC (0.45 dS m−1) and not as deep as black cotton soils of the other two vertisols under study (Bharathi et al., 2018). Alfisols of Bengaluru and Ananthapuramu are sandy clay loam in texture, acidic (pH: 5.0–6.5), low in EC (0.09 dS m−1). This soil fails to supply enough moisture despite high clay content (35.8% and 30.0% in Ananthapuramu and Bengaluru, respectively) throughout the crop growth period due to poor infiltration of rainfall because of surface crusting (Bhattacharyya et al., 2005).
Soil moisture is one of the several factors influencing crop growth, and has major a role in maintaining plant-water relationships (Wei et al., 2008). It limits plant transpiration and photosynthesis, with consequent impacts on the water, energy, and biogeochemical cycles. Soil moisture is usually defined as the water contained in the unsaturated soil zone (Hillel, 1998).
In the present study, the soil moisture was calculated on a particular day of the week, following the standard procedure of the gravimetric method (Reynolds, 1970). Soil samples from three representative locations of the experimental field in different layers (Table 1) were drawn. Fresh and oven-dried soil sample weights were recorded and soil moisture content at different layers was worked out using the following formula.
Where, Wf = Fresh weight of the soil sample, Wd = Dry weight of the soil sample.
Next, the volumetric water content (θv) was calculated by multiplying
Rossato et al. (2017) indicated that soil moisture at root zone depth was primarily associated with reducing the impacts of drought on crop yield. Therefore, in the present study, the root zone water content (Wrz) was calculated as the cumulative sum of θv at each depth multiplied by the depth of the soil layer as follows.
Where, θv1, θv2, θv3, and θvn are volumetric water contents at soil depths representing the root zone; d1, d2, d3, and dn represent the thickness of the soil layer sampled.
Percent available soil moisture is a useful indicator for monitoring crop failure because it reflects the amount of water present in the soil that is available for plant uptake. The PASM includes the component of moisture content at field capacity (FC) and permanent wilting point (PWP). The range between field capacity and the permanent wilting point defines the plant-available water, representing the portion of soil moisture that plants can utilize for growth. When the percent available soil moisture drops below a certain threshold, it can indicate that the plants are experiencing water stress, which can ultimately lead to crop failure. To use percent available soil moisture for monitoring crop failure baseline values for each crop type and soil type under normal growing conditions need to be established. This can be done by measuring the percent available soil moisture throughout the growing season when the crop is healthy and growing normally. Once the baseline values are established, the percent available soil moisture can be used to monitor crop failure by comparing the current moisture levels to the established baseline values. If the current moisture levels fall below the baseline values, it can indicate that the plants are experiencing water stress, which can lead to reduced growth, yield, and eventually crop failure.
The PASM is used as one of the impact indicators (triggers) in the declaration of agricultural drought (Anonymous, 2016). As per the drought manual published by the Ministry of Agriculture and Farmers’ Welfare, Government of India, weekly/crop stage-wise PASM was calculated based on observed soil moisture data using the following formula,
Where, SMW = Weekly calculated volumetric soil moisture (vol./vol.) for the current week/crop stage; PWP = Permanent wilting point of soil (vol./vol.); FC = Field capacity of the soil (vol./vol.)
Several historical attempts have been made to relate the influence of weather parameters on soil moisture and its impact on crop yield (Table 2). These include aspects of relating climatic data to the occurrence or non-occurrence of rainfall, onset and duration of dry spells, etc. However, in recent years, due to technological advances in data analytics progress, studies using high-resolution time series data are being carried out in the area of rainfall-induced soil moisture variability (Chen and Zhou, 2021). Based on reviewing previous works, the present study was conducted through measurement of week-wise soil moisture, classifying it into existing drought norms, calculating weighted yield based on the drought severity during the study period, checking for a relationship using correlation, drawing a regression equation and yield estimation using drawn equations.
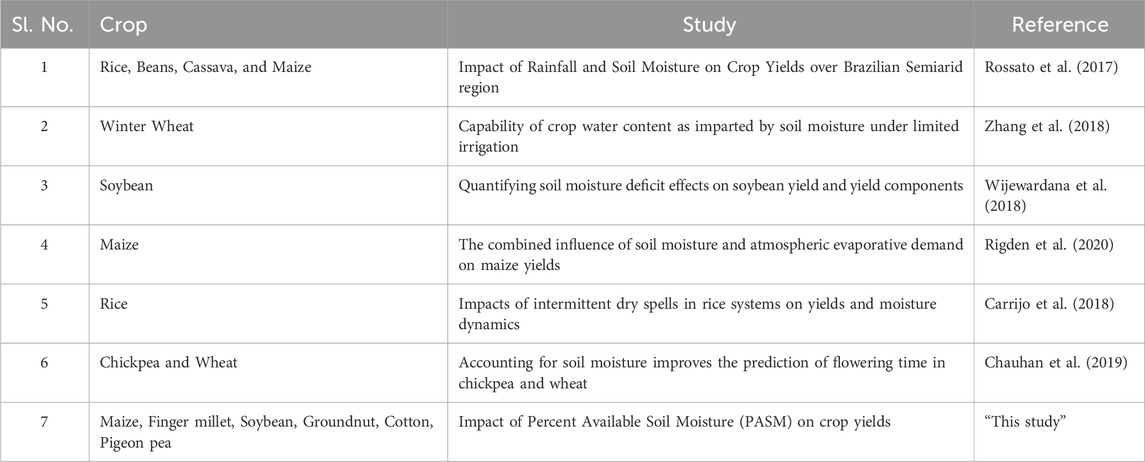
Table 2. Previous studies on assessment of soil moisture-induced yield variability in different crops.
In the present study, crops were grown during the Southwest monsoon period and sown on different dates of sowing. On each date of sowing, weekly soil moisture observations were taken and PASM was calculated based on the existing classification (Anon, 2016).
Since the crops were grown under different dates of sowings during the study period, early sown crops may experience drought at later reproductive or maturity, late sown crops may experience mid-season drought due to erratic onset and cessation of monsoon in the study locations (which is usually June to September). Such data on long-term experiments provide a base to understand crop yield under various drought or moisture stress scenarios at different growth stages of a particular crop. The procedure of arranging weekly/crop stage-wise root zone soil moisture, PASM, and grouping into different drought classes is presented in Table 3.
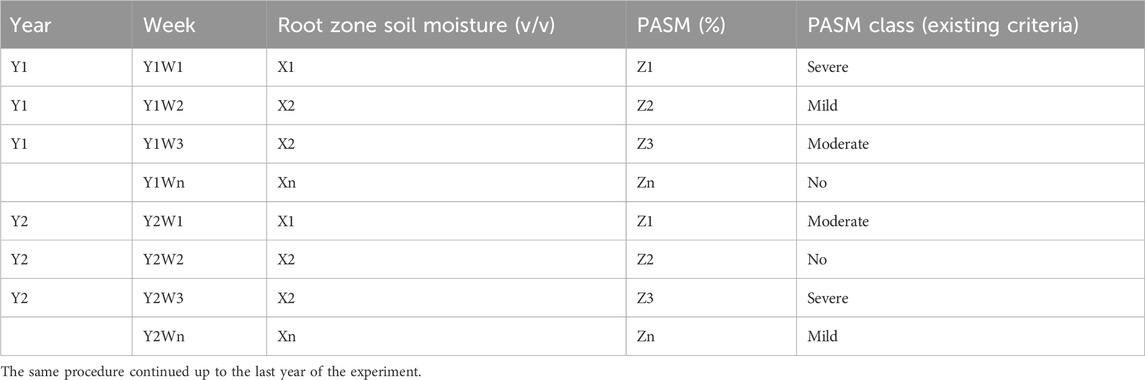
Table 3. Step-wise procedure in calculating weekly root zone soil moisture, PASM, and drought classes.
The methodology to calculate the weighted yield as per the PASM drought classes is provided in Figure 3. In general, the crop yield would decline, if the crop has passed through several severe moisture stress weeks, and vice versa. Several of such severe/moderate/mild and no drought situations along with their yield levels during the study period were averaged to obtain a comprehensive summary of yield and PASM for producing that particular yield. And, this summary provides a way for further correlation and regression analysis.
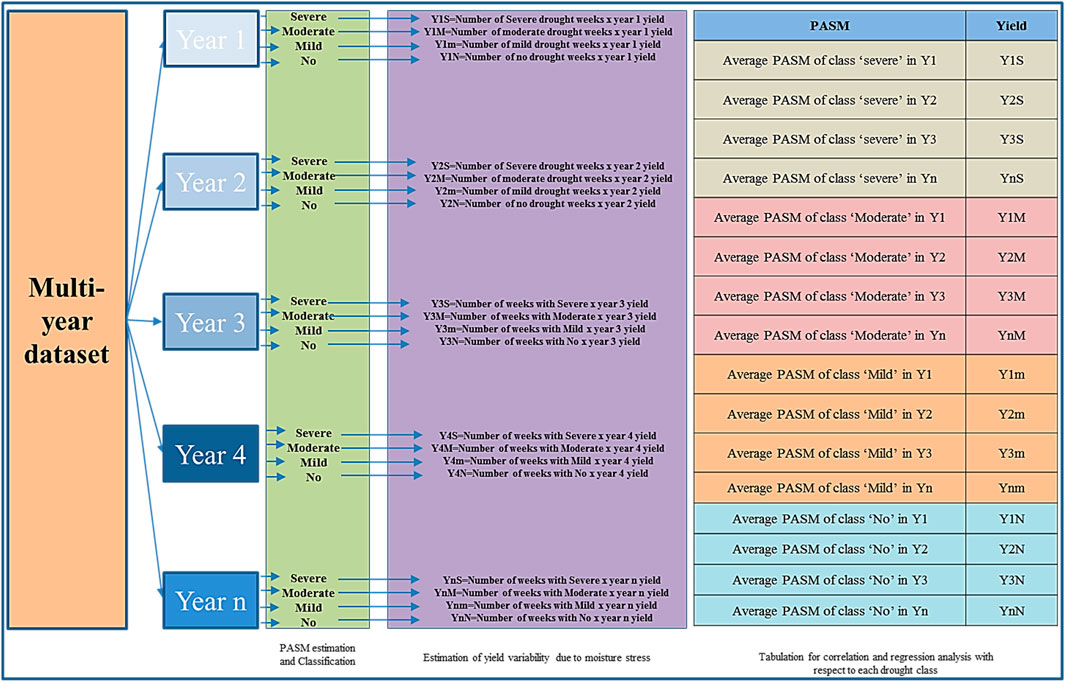
Figure 3. Representation of methodology followed for estimation of crop yield variability due to soil moisture variability.
The average yield and PASM for each group were calculated and tabulated for regression analysis. The PASM versus yield in each group was correlated to check for the relationship if found positively significant, regression equations were developed. Best fitting (estimated by checking R2 value) equations were employed to find the yield of the crop at a particular PASM and PASM required for obtaining 50% of the optimal yield (optimal yield is an average yield of the crop under farmers’ practice and yield of the crop obtained under unlimited resources of experimental fields of a university or institute).
Further, the estimation of the PASM requirement to attain at least 50% of optimal yield using the earlier developed regression equation was carried out to indicate meaningful relief assistance to the farmer under drought situations. i.e., if a farmer gets at least 50% of yield, he will be able to meet the expenses of the cost of cultivation. Hence, the PASM-yield relationship establishment in individual crops lays a scientific base for the fixation of PASM criteria for individual crops for timely and appropriate drought declaration and thereby meaningful drought relief assistance.
It is important to quantify the uncertainty in the yield of crops associated with crop yields with the new categories of PASM. Uncertainty (confidence intervals) for the predictor, i.e., PASM using the developed regression was calculated by using the formula
Where, Statistic is our PASM range, Reliability Factor = 1.96 (for 95% confidence intervals), and standard error is the ratio of standard deviation (δ) and square root of number of observations (n).
Moisture deficiency in soil and consequent water stress to plants, causing the reduction in biomass production and yield is referred to as agricultural drought. Thus, the assessment of soil moisture conditions and the estimation of the effects of soil moisture deficit on crop productivity is relevant and provides important information associated with a decline in agricultural yield (Barbosa et al., 2015). Therefore, the assessment of rainfall and soil moisture in a particular region is crucial to understanding the variability in these areas and to support actions to mitigate the effects of water scarcity (Badel et al., 2013).
Correlations between PASM and crop yield of individual crops revealed that there was a significant positive correlation between these two parameters in each crop (Table 4). The magnitude of the mean linear relationship across the dates of sowing was up to 0.98 in maize and as low as 0.66 in soybean. Cotton yield at Parbhani showed a significant relationship with soil moisture in all the dates of sowing. Except during D4, Pigeon pea at Bangalore also had a significant correlation with soil moisture during other sowing dates.
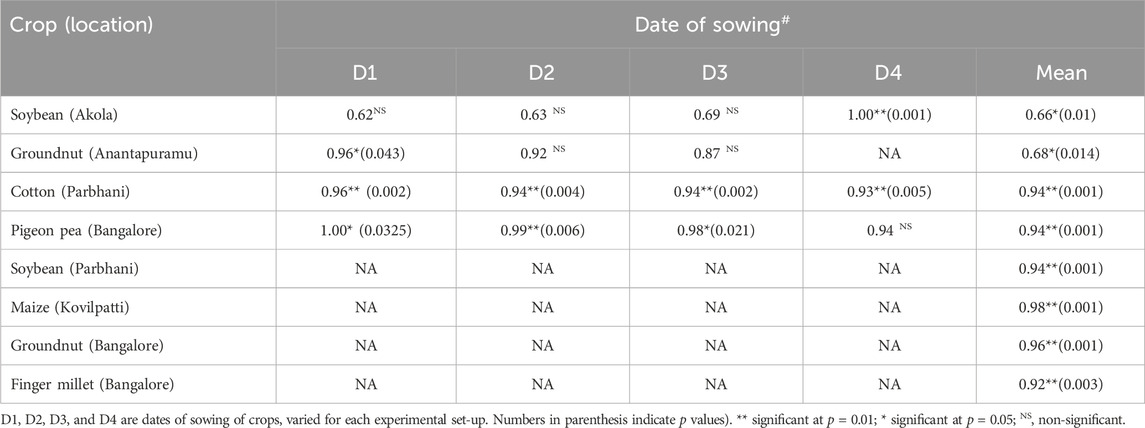
Table 4. Correlation between PASM and crop yields under different sowing dates at study locations.
As stated earlier, the objective of this work was to investigate the relationship between PASM with the yield of cereals (maize, finger millet), pulse (pigeon pea), oilseeds (soybean and groundnut) and commercial crop (cotton) in the semi-arid region of peninsular India. The soil moisture had a higher correlation to crop yields over most of the study locations, which was consistent with the fact that the crop yield is solely dependent on rainfall as a source of moisture (to build up soil moisture) in these regions (Sonia et al., 2010).
Experiments carried out at Kovilpatti indicated that the PASM and yields were positively correlated (0.98) (Table 3). The effect of low soil moisture during the reproductive stage was more as compared to vegetative and maturity stages, i.e., severe drought during the reproductive stage has produced 3209 kg/ha yield as compared to that produced due to drought in vegetative and maturity stages (3385 and 3216 kg/ha, respectively) (Figure 4; Supplementary Table S1).
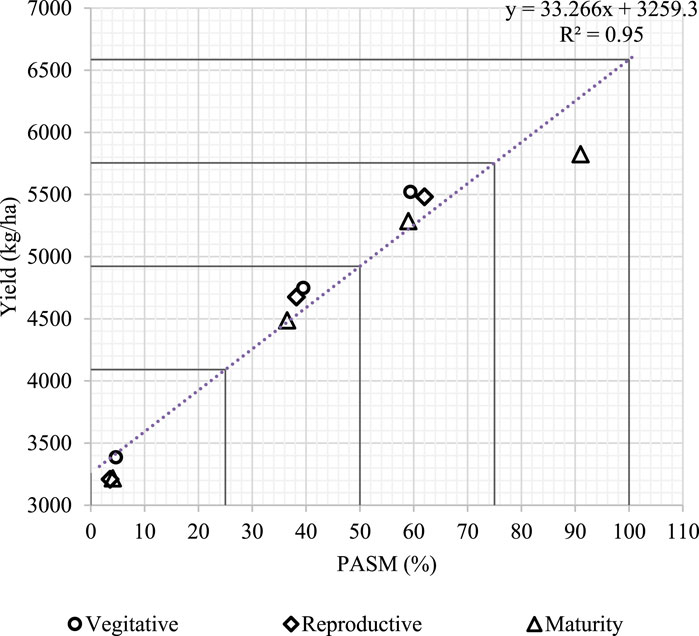
Figure 4. Yield variability in maize with respect to PASM in different growth stages at Kovilpatti.
The finger millet crop is hardy and resistant to flood, drought, pests, and disease and is mainly grown in drylands of south India, whenever rainfall is not sufficient enough to cultivate other major crops. It is raised as a sequence crop of paddy, based on residual moisture. Even though it is a drought resistant crop, soil moisture variability during different growth stages majorly decides its yield levels. The results of this study showed that finger millet yield had a significant positive correlation with soil moisture (0.92) (Table 3). The yield of the crop was as low as 0 kg/ha under severe drought (20% PASM) to 4236 kg/ha under no drought situations (100% PASM) (Figure 5).
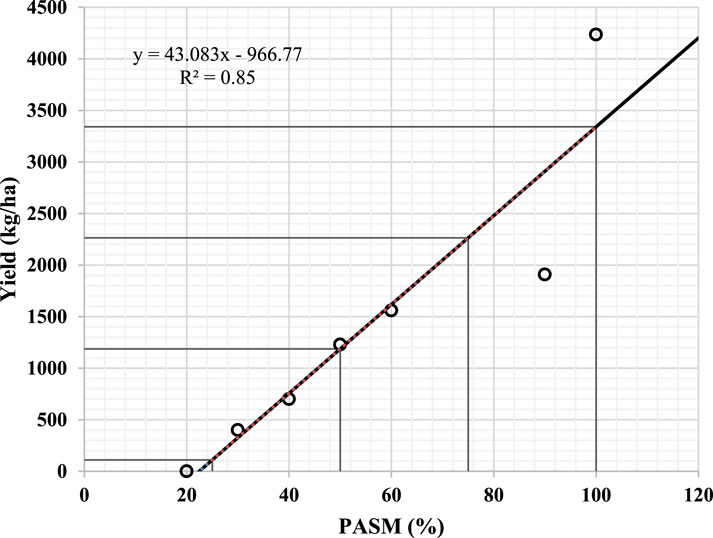
Figure 5. Yield variability in finger millet in response to PASM at Bengaluru.
The soil moisture availability at different growth stages has influenced the yield of soybean at Parbhani (Supplementary Table S2). The yield variation due to available soil moisture at different stages ranged from 135 to 1803 kg/ha. The effect of low moisture availability at the vegetative and reproductive stages was greater than the effect in the maturity stage (Figure 6). For example, a severe drought at the vegetative and reproductive stages of the crop produced only 135 and 178 kg/ha yield, respectively. However, the yield was 405 kg/ha even though the crop suffered from a severe drought during maturity.
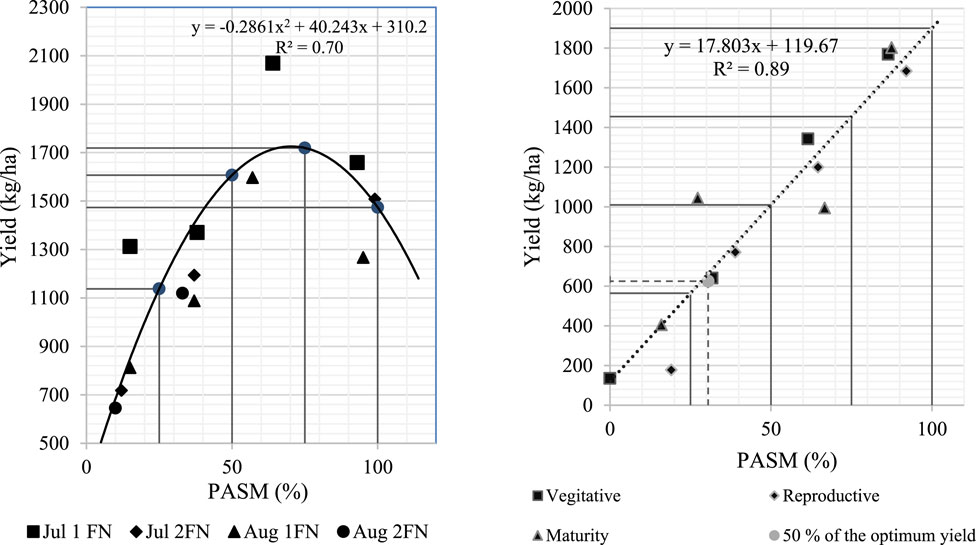
Figure 6. Per cent soil moisture availability and yield variability in soybean (left: Akola, right: Parbhani) in different sowing windows and growth stages.
Correlation between PASM and yield under different sowing windows at Akola showed yield increases with delay in sowing, i.e., the magnitude of relation was as low as 0.62 for the crop sown in the first week of July and 1.0 in the last week of July (Table 3). As the crop is sensitive to moisture stress, a dry spell phase of 2 weeks during the mid-vegetative stage caused a 56 percent yield reduction while 39 per cent yield reduction was observed at any of the crop stages.
The groundnut yield variability due to available soil moisture at different stages was in the range of 399–1999 kg/ha at Ananthapuramu. The effect of low moisture availability at the emergence, vegetative, pegging, and pod development stages is higher as compared to that at flowering and pod maturity stages (Figure 7; Supplementary Table S3). At Ananthapuramu, the relationship between soil moisture and PASM was polynomial, and due to severe moisture deficit at emergence, vegetative, pegging, and pod development stages, groundnut productivity was 399, 766, 867, and 661 kg/ha yield, respectively. However, even though the crop suffered severe drought during the flowering and maturity stages, it could achieve higher yields of 1147 and 970 kg/ha, respectively.
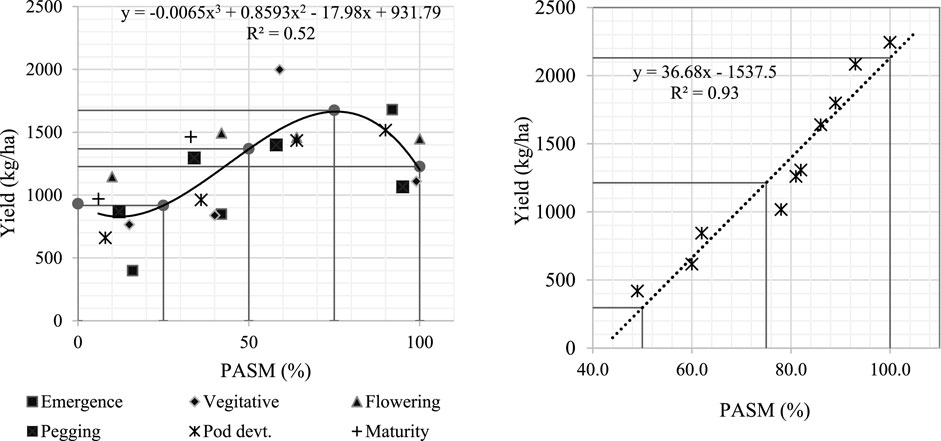
Figure 7. Per cent soil moisture availability and yield variability in groundnut at Ananthapuramu (left) and Bangalore (right).
While, in Bengaluru, a correlation up to the extent of 93 percent was observed (Table 3). This indicates the impact of higher available soil moisture on pod yield, as evidenced by the significant positive correlation between soil moisture content at different stages with pod yield. The correlation was more significant during the later stages of the crop.
Cotton being one of the major commercially cultivated crops in the drylands of India gets affected by both intra and inter-seasonal droughts. The most discernible response due to soil moisture deficit across different stages of the crop is a reduction in plant stature and other growth parameters. Correlation between PASM and cotton lint yield was positive, i.e. 0.96 and 0.93 (Table 3) in early (June 2FN) and late sown (August 1FN) conditions, respectively indicating a strong relationship between them (Figure 8).
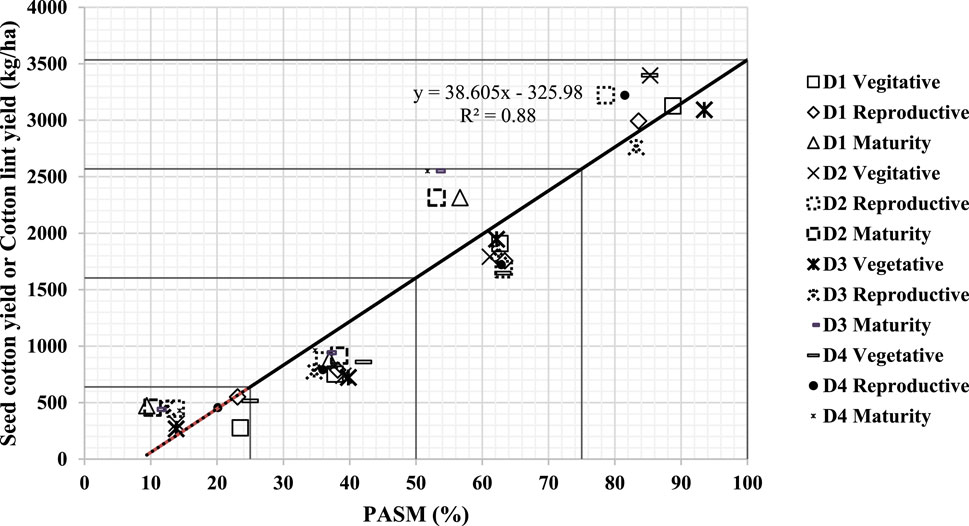
Figure 8. Yield variability in cotton with available soil moisture at different growth stages at Parbhani (D1: June 2FN, D2: July 1FN, D3: July 2FN and D4: August 1FN).
Drought in different crop stages showed varied impacts on cotton yield sown under different sowing windows (Supplementary Table S4). In each sowing window (June 2FN, July 1FN, and July 2FN), a severe drought at the vegetative stage produced lower lint yields (277, 315, and 267 kg/ha lint yield) as compared to other two growth stages. Further, there was a non-significant improvement in lint yield under severe drought both at reproductive and maturity stages since these stages coincide with the high rainfall period (July) of the region.
In the case of late sown conditions (August), the lowest lint yield was recorded due to severe drought at the maturity stage (428 kg/ha) as compared to vegetative (514 kg/ha) and reproductive stages (456 kg/ha).
Pigeon pea being a long-duration and deep-rooted dryland crop, can extract moisture from the deeper soil layers. PASM and yield relationship in pigeon pea indicated that the percent increase in yield was high with the increase in PASM as a single factor above 50% PASM (Supplementary Table S5). Hence, with PASM values of 45 percent, the crop can yield only 50 percent of the optimum yield. A PASM of less than 15 will lead to complete crop failure. In addition to that, from Figure 9, the estimated pigeon pea seed yield was around 1000 kg/ha when the PASM was 50, the yield levels were as low as 266 kg/ha when the PASM was 25.
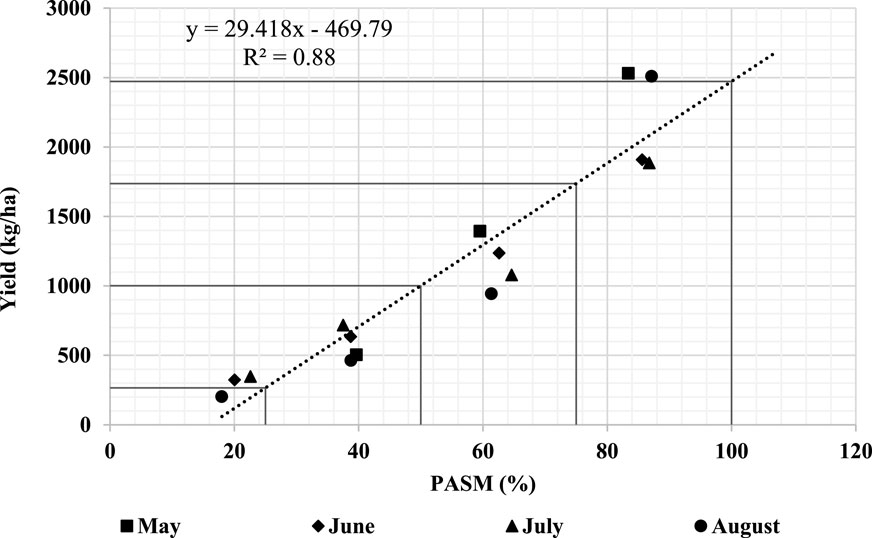
Figure 9. Yield variability in pigeon pea with PASM under 4 sowing windows at Bangalore.
The PASM values in different stages of pigeon pea crop over all the sowing windows indicated that severe drought (<25 PASM) during the pod filling stage has produced an average of 20% of the yield, while an average of 43% of the yield was obtained due to severe drought during the flowering stage.
Based on long-term experiments conducted at five locations over the years, regression equations were developed between the PASM and crop yields (Supplementary Table S6). These relationships can be used to estimate the soil moisture required to obtain at least 50% of the optimum yields. It can be perceivable that some crops even require 26 PASM to produce at least 50% of the normal yield. In crops like pigeon pea and groundnut, the levels was found to be 37 and 62, respectively.
The uncertainties for computed PASM ranges viz., severe (0–50 PASM), mild (51–75 PASM) and no drought (76–100 PASM) situation ranged between 0.22 and 4.14, 0.32% to 3.60%, and 0.49%–6.88%, respectively (Table 5).
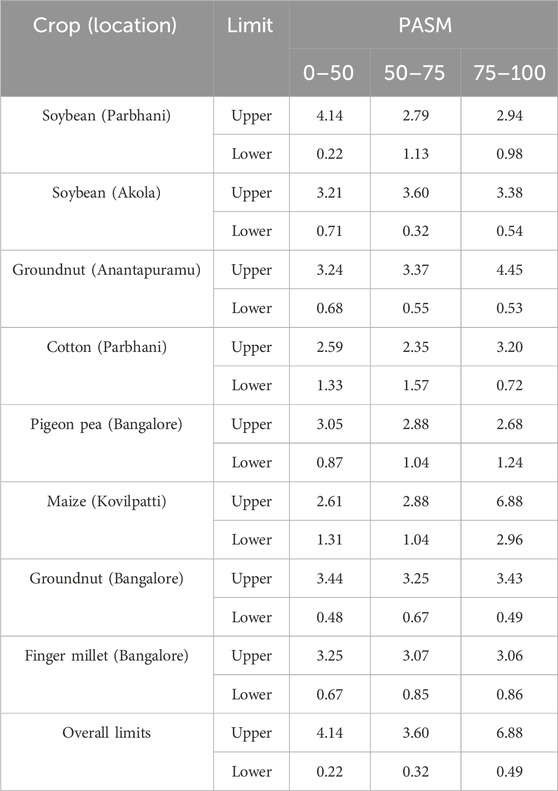
Table 5. Uncertainties (in per cent) in crop yields associated with the new categories of PASM.
Correlation between PASM and crop yields under different sowing dates was found to vary with crops and locations. This is because the sensitivity of crops to soil moisture deficit varies from crop to crop and also with stages. Further, the soil water regime is affected by changes in seasonal soil moisture availability, and inter-annual variation of the same due to respective variability in the precipitation (Izaurralde et al., 2003). The higher correlation between crop yield and PASM was due to the dependence of the crop entirely on rainfall to fulfill its water requirements (Rossato et al., 2017). This higher correlation was associated with periods of drought in peninsular India, caused by high seasonal and inter-annual variability of rainfall during the study period. Previous studies on the relationship between vegetation indices (NDVI) and root zone soil moisture (RZSM) in African regions indicated the existence of positive relationships and the association varied with geographic location and lag, which implies that an increase in soil moisture due to the ENSO could promote vegetation greenness (Sazib and Bolten, 2020).
Maize is highly susceptible to atmospheric stresses during the initial stages of reproduction viz., silking, and blistering. Water and heat stress can significantly limit the ability of maize to properly pollinate (Robel et al., 2019). During subsequent reproductive stages, the maize kernels are still small, but water constitutes about 85% of the kernel mass, which is the highest over the growing cycle. During milk, dough, and dent stages, the kernel size significantly increases; however, the amount of water decreases to about 55% of the kernel mass, further dropping to 30% by maturity. Stress during the late reproductive stages, affects dry matter accumulation (Iliana et al., 2017). Soil moisture stress during the vegetative stage will register a lower impact on maize yield compared to stress during the early reproductive stages. Rohit et al. (2020) reported a 13.5% average reduction in maize yield when the stress occurred during the vegetative stage while a 53% reduction in yield occurred with the stress during the reproductive stage. However, prolonged drought during the vegetative stage can also affect the yield significantly as reported by Eck (1986). He observed that yield reduction in maize was 23% for a two-week-long water stress period during the reproductive stage compared to 46% when the stress continued for 4 weeks during the vegetative period.
The drastic yield reduction due to severe drought was evident in the present study. Similar results of soil moisture effect on yield variability were recorded by Muhammad and Azam (2007) indicating a significant effect (p < 0.028) of drought on finger millet yield.
The yield was not drastically reduced even under a severe drought during the maturity stage. This may be due to the well-established root system (Comas et al., 2013) as well as lower water requirement by the crop at the maturity stage compared to the previous stages. Differences in correlation coefficients were mainly due to the soil properties of this region. In typical black cotton soils at Akola, most of the first rainfall received was infiltrated into deeper layers of the soils through widely opened cracks in the previous summer. The rainfall analysis also indicated that there was higher rainfall in July (223.3 mm with 40.6% CV) facilitating better soil moisture availability (Staton, 2020). In regions like central India, variabilities in soybean yield to a significant extent were recorded by Mohanty et al. (2015), and a decrease in yield up to 96 per cent was recorded due to heavy rainfall during flower initiation to maximal pod stage.
In Anantapur, the yield levels after 75 percent of PASM declined mainly due to heavy soil type and excessive rainfall during the later stages of the crop, making poor pod development (Kumar et al., 2012). However, the overall soil moisture content during the total crop period was also significantly and positively correlated with pod yield (Guled et al., 2013) in Bangalore.
In Parbhani, both at reproductive and maturity stages coincide with the high rainfall period (July), resulting in improved lint yield even under severe drought. Another reason may be the deeper roots of cotton could have accessed soil moisture from the deeper layers of typical vertisols of the region under moisture stress situations.
In the case of late sown conditions (August), the lowest lint yield was recorded due to severe drought at the maturity stage (428 kg/ha) as compared to vegetative (514 kg/ha) and reproductive stages (456 kg/ha). Under late sown conditions, the higher utilization of available soil moisture during the early stages of crop growth led to lesser soil moisture availability during the reproductive stage. This along with severe drought at the maturity stage, caused lesser lint yield. Pettigrew (2004) also reported that in cotton, no severe impact of moisture deficit on any of the growth parameters was observed in early sown cotton. However, in the late-sown crops, a severe moisture deficit stress developed and impacted most of the growth and yield parameters.
As optimum moisture at the flowering and pod filling stage is crucial for achieving the potential yield, moisture stress at these stages affected its yield. Pigeon pea seed yield was reduced to 37% due to moisture stress at the flowering and pod-filling stages and not significantly affected by stress at the pod-filling stage alone (Lopez et al., 1996). Earlier research also indicated that the productivity of pigeon pea was more influenced by soil depth vis-à-vis moisture availability, i.e., the seed yield of pigeon pea was higher by 46–66 percent due to abundant soil moisture in 20–40 cm soil depths over other lower soil depths (Subbareddy et al., 2001; Kovac et al., 2005).
A PASM of 58 resulted in 50% of the normal yield in finger millet. Similarly, in Pigeon pea, crop yield was abysmally low (8%–18% of the normal) at a PASM of 25 and in groundnut, a PASM of 50 resulted in 41% of the normal yield (Shivaramu et al., 2022).
A comparison of the yield of crops under study at 25% and 50% PASM was made and the result is presented in Table 6. This table provides a comparison of crop yields at different levels of Probability of Available Soil Moisture (PASM), showing how the yield changes as PASM increases from 25% to 50%. It also highlights the percentage of yield reduction at these different PASM levels compared to the optimum yield for each crop. At 25% PASM (ranging from 24% in soybean to 100% in groundnut), significant yield losses were observed, rendering it difficult for farmers to achieve minimal returns to cover cultivation costs. This scenario mirrors conditions akin to a severe drought, prompting the government to occasionally declare a state of very severe drought. Increasing PASM to 50% would result in reduced crop yield losses ranging from 0% to 45% (with groundnut exhibiting an 88% loss, indicating its heightened water requirement). Lower PASM levels, such as 25%, generally result in significant reductions in crop yields across most of the studied crops. As PASM levels increase to 50%, there is an observable improvement in crop yields for most crops, though some crops still experience notable reductions compared to their optimum yields.
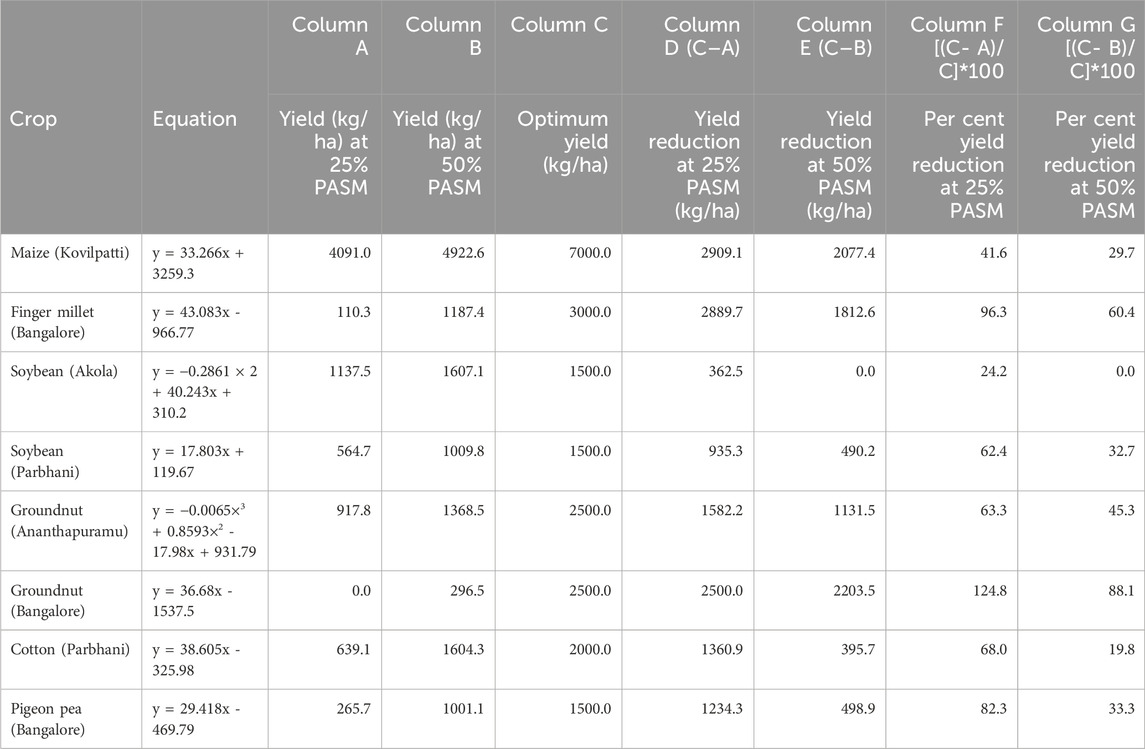
Table 6. Comparison of yield of crops at 25% and 50% PASM.
Different crops exhibit varying degrees of sensitivity to PASM levels. Crops like maize and cotton show substantial yield reductions at 25% PASM, but these reductions lessen as PASM increases to 50%. Conversely, crops like finger millet and groundnut in Bangalore show extreme yield losses even at 50% PASM. The analysis suggests that for optimal yields, PASM levels closer to or exceeding 50% are generally preferable for most crops. These findings underscore the classification of a PASM range of up to 50% as indicative of severe drought.
The study was conducted in 5 locations representing two broader soil types involving 6 major rainfed crops. It is a well-known fact that the percent available soil moisture varies depending on soil type, climate, and other environmental factors. However, Percent available soil moisture and soil type are two important factors that are closely related and can have a significant impact on plant growth and crop yield. Soil type refers to the physical and chemical properties of the soil, including its texture, structure, and nutrient content. Different soil types have varying water-holding capacities and drainage properties, which can affect the percent available soil moisture (Wang et al., 2019). A study assessed the soil moisture regimes in sandy soils of Nigeria and their impact on crop production. The results showed that sandy soils had a low water holding capacity, resulting in low available soil moisture, which negatively impacted crop growth and yield (Fashae and Akintoye, 2019). In his study, a comparative analysis has not been done to see how the yield level of a single crop under different soils under different available soil moisture impacts the crop yield.
The study revealed that the yield was significantly influenced by the per cent Available Soil Moisture (PASM) for six different crops. The PASM for obtaining 50% of optimum yield in cereals (maize: 26% and finger millet: 52.9%), pulses (pigeon pea: 37.2%), oilseeds (soybean: 26.8%–30.5%, groundnut: 53.8%–61.7%) and commercial crops (cotton: 26.3%) ranged from 26 to 61 per cent. The criteria followed for considering <25 PASM as severe drought as per the Drought Manual 2016 of the Govt. of India needs to be modified given the findings of the present study.
The PASM, though an important criterion for drought declaration, its applicability was overlooked due to a lack of understanding of its effect on individual crops at many locations led to unscientific drought declaration vis-a-vis its efficient management so far in the country. The present study highlighted the crop performance especially yield variation at different soil moisture levels and crop stages. The following amendments are put forth based on the findings of this study and they are; 0–50 PASM as severe, 51–75 as mild, and 76–100 as no drought situation. This study indicates the need to re-look into the drought declaration norms presently followed for these crops. The same criteria which are closer to the actual field conditions may be followed by planners of the country to assess and declare the agricultural drought. This study has only considered the relation between weekly/crop stage-wise PASM and crop yield and there are other factors viz., biotic and abiotic factors also which affect crop performance. But, in dryland ecosystems, soil moisture availability is the most dominant factor affecting crop performance. Therefore, the outcome of this study signifies the inclusion of PASM as one of the factors for agricultural drought assessment in India.
The original contributions presented in the study are included in the article/Supplementary Material, further inquiries can be directed to the corresponding authors.
SB: Conceptualization, Methodology, Writing–original draft. HS: Conceptualization, Writing–original draft. PV: Conceptualization, Writing–review and editing. HL: Investigation, Writing–review and editing, Software. VS: Formal Analysis, Writing–review and editing, Visualization. AS: Resources, Writing–review and editing. MS: Methodology, Visualization, Writing–original draft. NM: Resources, Writing–review and editing. MT: Data curation, Formal Analysis, Writing–review and editing. MM: Validation, Writing–review and editing. SM: Formal Analysis, Writing–review and editing. AT: Formal Analysis, Writing–review and editing. GS: Formal Analysis, Writing–review and editing. KD: Formal Analysis, Writing–review and editing. SS: Formal Analysis, Investigation, Writing–review and editing. PM: Writing–review and editing. VS: Supervision, Writing–review and editing. RS: Supervision, Writing–review and editing.
The author(s) declare that financial support was received for the research, authorship, and/or publication of this article. This study was funded by AICRP on Agrometeorology, ICAR-CRIDA, Hyderabad, India.
The authors declare that the research was conducted in the absence of any commercial or financial relationships that could be construed as a potential conflict of interest.
All claims expressed in this article are solely those of the authors and do not necessarily represent those of their affiliated organizations, or those of the publisher, the editors and the reviewers. Any product that may be evaluated in this article, or claim that may be made by its manufacturer, is not guaranteed or endorsed by the publisher.
The Supplementary Material for this article can be found online at: https://www.frontiersin.org/articles/10.3389/fenvs.2024.1319912/full#supplementary-material
Anonymous (2016). Manual for drought management. New Delhi: Department of Agriculture, Cooperation & Farmers Welfare, Ministry of Agriculture & Farmers Welfare Government of India, 37–39.
Anonymous (2018). Amendment in the manual of drought management. New Delhi: Department of Agriculture, Cooperation & Farmers Welfare, Ministry of Agriculture & Farmers Welfare Government of India, 14. Available at: http://www.ksndmc.org/DroughtManagement/AmendmentManual%20for%20Drought%20Management%202016.pdf.
Anonymous (2020). Observed rainfall variability and changes over Tamil Nadu state. Meteorol. Monogr., 1–25. IMD – 2020, New Delhi.
Ashok, S. (2013). Environment and crop water requirement in districts of Maharashtra. International e-publication, international science congress association, 78–85.
Badel, M. E., Sarobol, E., and Degewione, A. (2013). Impact of soil moisture depletion levels at different growth stages on growth, evapotranspiration and biomass yield of bread wheat grown under semi-arid condition. Agric. Sci. Eng. Technol. Res. 3, 26–34.
Bal, S. K., and Minhas, P. S. (2017). “Atmospheric stressors: challenges and coping strategies,” in Abiotic stress management for resilient agriculture. Editor P. S. Minhas (Springer Nature Singapore), 9–50.
Bal, S. K., Sandeep, V. M., Vijaya Kumar, P., Subba Rao, A. V. M., Pramod, V. P., Srinivasa Rao, Ch., et al. (2022). Assessing impact of dry spells on the principal rainfed crops in major dryland regions of India. Agric. For. Meteorol. 313, 108768. doi:10.1016/j.agrformet.2021.108768
Balpande, S. S., Deshpande, S. B., and Pal, D. K. (2006). Factors and processes of soil degradation in vertisols of the Purna Valley, Maharashira, India. Land Degrad. Dev. 7, 313–324. doi:10.1002/(sici)1099-145x(199612)7:4<313::aid-ldr236>3.0.co;2-#
Barbosa, H. A., Kumar, T. L., and Silva, L. R. M. (2015). Recent trends in vegetation dynamics in the South America and their relationship to rainfall. Nat. Hazards 77 (2), 883–899. doi:10.1007/s11069-015-1635-8
Betts, A. K. (2004). Understanding hydrometeorology using global models. B. Am. Meteorol. Soc. 85 (11), 1673–1688. doi:10.1175/bams-85-11-1673
Bharat, S. A., Syam, D., Lewis, A. G., Murali, D., Jim, J. W., Seema, S., et al. (2019). Winter cover crops effect on soil moisture and soybean growth and yield under different tillage systems. Soil Tillage Res. 195, 167–187. doi:10.1016/j.still.2019.104430
Bharathi, G., Joseph, M., Velayutham, A., and Baskar, K. (2018). Plant geometry, macro and micro nutrients on growth and growth analysis of dual-purpose sorghum under rainfed vertisol condition. Int. J. Adv. Agril. Sci. Tech. 5 (7), 61–74.
Bhattacharyya, T., Pal, D. K., Chandran, P., and Ray, S. K. (2005). Landuse, clay mineral type and organic carbon content in alfisols of tropical India. Clay Res. 24 (2), 105–122.
Carrijo, D. R., Akbar, N., Reis, A. F., Li, C., Gaudin, A. C., Parikh, S. J., et al. (2018). Impacts of variable soil drying in alternate wetting and drying rice systems on yields, grain arsenic concentration and soil moisture dynamics. Field Crops Res. 222, 101–110. doi:10.1016/j.fcr.2018.02.026
Chary, G. R., Gopinath, K. A., Bhaskar, S., Prabhakar, M., Chaudhari, S. K., and Narsimlu, B. (2020). Resilient crops and cropping systems to cope with weather aberrations in rainfed agriculture. CRIDA-NICRA Bull., 3–4.
Chauhan, Y. S., Ryan, M., Chandra, S., and Sadras, V. O. (2019). Accounting for soil moisture improves prediction of flowering time in chickpea and wheat. Sci. Rep. 9, 7510. doi:10.1038/s41598-019-43848-6
Chen, X., Zhou, Q., Li, Y., and Yin, G. (2021). Temporal and Spatial variations of soil moisture over Xinjiang based on multiple GLDAS datasets. Front. Earth Sci. 9, 393. doi:10.3389/feart.2021.654848
Chulsang, Y., Juan, B. V., and Gerald, R. N. (1998). Evaluation of the impact of rainfall on soil moisture variability. Adv. Water Resour. 21, 315–384. doi:10.1016/S0309-1708(97)00002-X
Comas, L. H., Becker, S. R., Cruz, V. M. V., Byrne, P. F., and Dierig, D. A. (2013). Root traits contributing to plant productivity under drought. Front. Plant Sci. 4, 442. doi:10.3389/fpls.2013.00442
Decker, W. L., Jones, V. K., and Achutuni, R. (1986). The impact of climatic change from increased atmospheric carbon dioxide on American agriculture. DOE/NBB-0077, Dep. Atmos. Sci., Univ. Mo. Columbia, MO.
Denmead, O. T., and Shaw, R. H. (1960). The effects of soil moisture stress at different stages of growth on the development and yield of corn. Agron. J. 52, 272–274. doi:10.2134/agronj1960.00021962005200050010x
Doorenbos, J., and Pruitt, W. O. (1977). “Guidelines for predicting crop water requirements,” in FAO lrrig. Drain. Pap. 24, food and agric (Rome, Italy: Organization of the United Nations), 193.
Douville, H., Chauvin, F., and Broqua, H. (2001). Influence of soil moisture on the Asian and African monsoons. Part I: mean monsoon and daily precipitation. J. Clim. 14 (11), 2381–2403. doi:10.1175/1520-0442(2001)014<2381:iosmot>2.0.co;2
Eck, H. V. (1986). Effects of water deficits on yield, yield components, and water use efficiency of irrigated Corn. Agron. J. 78 (6), 1035–1040. doi:10.2134/agronj1986.00021962007800060020x
Fashae, O. A., and Akintoye, H. A. (2019). Assessment of soil moisture regimes in sandy soils of Nigeria for crop production. Agric. For. Meteorol. 271, 57–67.
Guhathakurta, P., and Saji, E. (2013). Detecting changes in rainfall pattern and seasonality index vis-à-vis increasing water scarcity in Maharashtra. J. Earth Syst. Sci. 122 (3), 639–649. doi:10.1007/s12040-013-0294-y
Guled, P. M., Shekh, A. M., Patel, H. R., and Pandey, V. (2013). Effect of soil moisture, evapotranspiration, stress degree days on pod yield of groundnut (Arachis hypogaea L). J. Agrometeorol. 15 (2), 135–137. doi:10.54386/jam.v15i2.1460
Hillel, D. (1998) Defining the soil moisture. Environmental soil physics. San Diego: Academic Press, 771.
Iliana, E. M., John, D. B., Wade, T. C., Martha, C. A., Christopher, R. H., David, M. J., et al. (2017). Inter-comparison of soil moisture, evaporative stress, and vegetation indices for estimating corn and soybean yields over the U.S. J. Appl. Earth Obs. Remote Sens. 21 (1), 1–16. doi:10.1109/JSTARS.2016.2639338
Islam, M. S., Siddique, M. R., and Hamid, A. (1999). Drought stress effects on photosynthetic rate and leaf gas exchange of wheat. Bot. Bull. Acad. Sin. 40, 141–145.
Izaurralde, R. C., Thomson, A. M., Rosenberg, N. J., and Xiaoxia, H. (2003). Climate change impacts on agriculture and soil carbon sequestration potential in the Huang-Hai Plain of China. Agric. Ecosyst. Environ. 114 (4), 195–209. doi:10.1016/j.agee.2005.11.001
Khanday, M. Y., and Javed, A. (2008). Impact of climate change on land use or land cover using remote sensing and GIS in Chopal watershed, Guna, Madhya Pradesh (India). J. Environ. Res. Dev. 2, 568–579.
Kovac, K., Macak, M., and Svancarkova, M. (2005). The effect of soil conservation tillage on soil moisture dynamics under single cropping and crop rotation. Plant Soil Environ. 51 (3), 124–130. doi:10.17221/3564-pse
Kumar, U., Singh, P., and Boote, K. J. (2012). Effect of climate change factors on processes of crop growth and development and yield of groundnut (Arachis hypogaea L.). Adv. Agron. 116, 41–69. doi:10.1016/b978-0-12-394277-7.00002-6
Laszlo, M. (2009). Climate change: precipitation and plant nutrition interactions on potato (Solanum tuberosum L.) yield in north-eastern Hungary. EGU General Assem. Conf. Abstr., 1398.
Lopez, F. B., Johansen, C., and Chauhan, Y. S. (1996). Effects of timing of drought stress on phenology, yield and yield components of short-duration pigeon pea. J. Agron. Crop Sci. 177, 311–320. doi:10.1111/j.1439-037x.1996.tb00251.x
Machado, S., Bynum, E. D., Archer, T. L., Bordovsky, J., Rosenow, D. T., Peterson, C., et al. (2002). Spatial and temporal variability of sorghum grain yield: influence of soil, water, pests, and diseases relationships. Precis. Agric. 3, 389–406. doi:10.1023/a:1021597023005
Maqsood, M., and Ali, S. A. (2007). Effects of drought on growth, development, radiation use efficiency and yield of finger millet (Eleucine coracana). Pak. J. Bot. 39 (1), 123–134.
McCarthy, J. J., Cox, C. M., Andersen, O. B., Lemoine, F. G. R., Chinn, D. S., et al. (2005). Resolving mass flux at high spatial and temporal resolution using GRACE intersatellite measurements. Geophys. Res. Lett. 32, 403–410. doi:10.1029/2004gl021908
Mohanty, M., Sinha, N. K., Lenka, S., Hati, K. M., Somasundaram, J., Saha, R., et al. (2015). “Climate change impacts on rainfed soybean yield of central India: management strategies through simulation modelling,” in Climate change modelling, planning and policy for agriculture (New Delhi: Springer), 39–44.
Namias, J. (1960). Factors in the initiation, perpetuation and termination of drought. Extr. Publ. No. 51, I.A.S.H. Comm. Surf. waters, 81–94.
Neenu, S., Biswas, A. K., and Subba Rao, A. (2013). Impact of climatic factors on crop production - a review. Agri. Rev. 34 (2), 97–106.
Parmeshwar, D. U., Yutaka, I., Anthony, S. K., and Sudhindra, N. P. (2014). Drought impacts and adaptation strategies for agriculture and rural livelihood in the Maharashtra state of India. Open Agric. J. (8), 41–47. doi:10.2174/1874331501408010041
Parthasarathy, B., Munot, A. A., and Kothawale, D. R. (1995). “Monthly and seasonal rainfall series for all-India homogeneous regions and meteorological subdivisions: 1871–1994,” in IITM research report-065, Indian institute of tropical meteorology.
Pettigrew, W. T. (2004). Physiological consequences of moisture deficit stress in cotton. Crop Sci. 44 (4), 1265–1272. doi:10.2135/cropsci2004.1265
Pulak, G., Sakharam, S., Preetha, M., Ashwini, K., Neha, S., and Advani, S. C. (2020). Observed rainfall variability and changes over Andhra Pradesh state. Meteorol. Monogr., 1–25. IMD – 2020.
Reynolds, S. G. (1970). The gravimetric method of soil moisture determination Part III an examination of factors influencing soil moisture variability. J. Hydrol. 11 (3), 288–300. doi:10.1016/0022-1694(70)90068-5
Rigden, A. J., Mueller, N. vD., Holbrook, N. M., Pillai, N., and Huybers, P. (2020). Combined influence of soil moisture and atmospheric evaporative demand is important for accurately predicting US maize yields. Nat. Food 2, 127–133. doi:10.1038/s43016-020-0028-7
Robel, A., Abraham, W. M., and Tilahun, H. (2019). Effect of moisture stress on maize (zea mays L.) yield and water productivity. Int. J. Environ. Sci. Nat. Res. 16, 83–87. doi:10.19080/ijesnr.2019.16.555945
Rohit, P., Mohanty, M., Nishant, K. S., Gupta, S. C., Somasundaram, J., Chaudhary, R. S., et al. (2020). Potential impact of future climate change on maize (Zea mays L.) under rainfed condition in central India. J. Agrometeorol. 22 (1), 18–23. doi:10.54386/jam.v22i1.117
Rossato, L., Alvalá, R. C., Marengo, J. A., Zeri, M., Cunha, A. P., Pires, L., et al. (2017). Impact of soil moisture on crop yields over Brazilian semiarid. Front. Environ. Sci. 5, 73. doi:10.3389/fenvs.2017.00073
Sanjeevaiah, S. H., Rudrappa, K. S., Lakshminarasappa, M. T., Huggi, L., Hanumanthaiah, M. M., Venkatappa, S. D., et al. (2021). Understanding the temporal variability of rainfall for estimating agro-climatic onset of cropping season over south interior Karnataka, India. Agronomy 11 (6), 1135. doi:10.3390/agronomy11061135
Sazib, N., and Bolten, J. D. (2020). Assessing the impact of ENSO on agriculture over Africa using earth observation data. Front. Sustain. Food Syst. 188. doi:10.3389/fsufs.2020.509914
Schenk, H. J., and Jackson, R. B. (2005). Mapping the global distribution of deep roots in relation to climate and soil characteristics. Geoderma 126 (1-2), 129–140. doi:10.1016/j.geoderma.2004.11.018
Shewale, M. P., and Kumar, S. (2005). Climatological features of drought incidences in India. Meteorol. Monogr. Climatol. (IMD) No. 21/2005, 1–24.
Shivaramu, H. S., Manjunatha, M. H., Huggi, L., Bal, S. K., Kumar, P. V., Padmashri, H. S., et al. (2022). Soil moisture induced yield variability in major crops of Karnataka. Indian J. Agric. Sci. 92 (7), 836–841. doi:10.56093/ijas.v92i7.104382
Sonia, I. S., Thierry, C., Edouard, L. D., Martin, H., Eric, B. J., Irene, L., et al. (2010). Investigating soil moisture–climate interactions in a changing climate: a review. Earth-Sci. Rev. 99, 125–161. doi:10.1016/j.earscirev.2010.02.004
Staton, M. (2020). “Moisture stress and high temperature effects on soybean yields,” in Annual reports. Michigan State University Extension. pp-1-25.
Stephens, D. J., and Lyons, T. J. (1998). Rainfall-yield relationships across the Australian Wheat belt. Aust. J. Agric. Res. 49, 211–224. doi:10.1071/a96139
Subbareddy, G., Maruthi, V., and Vanaja, M. (2001). Effect of soil depth on productivity of sorghum (Sorghum bicolor) and pigeon pea (Cajanus cajan) in sole and intercropping systems. Indian J. Agric. Sci. 71 (8), 510–515.
Tanin, Y. (1983) “Estimation of wheat production with meteorological parameters, XXIII,” in World meteorology day agricultural meteorology seminar bulletin, 23–25.
Waghaye, A. M., Rajwade, Y. A., Randhe, R. D., and Kumari, N. (2018). Trend analysis and change point detection of rainfall of Andhra Pradesh and Telangana, India. J. Agrometeorol. 20 (2), 160–163. doi:10.54386/jam.v20i2.532
Wang, Y., Chen, X., Yang, G., and Chen, Y. (2019). Effects of soil texture and soil organic matter on soil water retention and availability. J. Hydrol. 575, 1268–1276.
Waseem, M., Khurshid, T., Abbas, A., Ahmad, I., and Javed, Z. (2022). Impact of meteorological drought on agriculture production at different scales in Punjab, Pakistan. J. Water Clim. Chang. 13 (1), 113–124. doi:10.2166/wcc.2021.244
Wei, J., Dickinson, R. E., and Chen, H. (2008). A negative soil moisture–precipitation relationship and its causes. J. Hydrometeorol. 9, 1364–1376. doi:10.1175/2008jhm955.1
Wijewardana, C., Reddy, K. R., Alsajri, F. A., Irby, J. T., Krutz, J., and Golden, B. (2018). Quantifying soil moisture deficit effects on soybean yield and yield component distribution patterns. Irrig. Sci. 36, 241–255. doi:10.1007/s00271-018-0580-1
Keywords: soil moisture, drought declaration, rainfed, dryland farming, PASM
Citation: Bal SK, Shivaramu HS, Vijaya Kumar P, Lingaraj H, Sandeep VM, Subba Rao AVM, Sarath Chandran MA, Manikandan N, Thimmegowda MN, Manjunatha MH, Malleswari SN, Tupe A, Sudhakar G, Dakhore KK, Subbulakshmi S, Minhas PS, Singh VK and Singh R (2024) Re-evaluating soil moisture-based drought criteria for rainfed crops in peninsular India. Front. Environ. Sci. 12:1319912. doi: 10.3389/fenvs.2024.1319912
Received: 11 October 2023; Accepted: 18 April 2024;
Published: 07 May 2024.
Edited by:
Martin Siegert, University of Exeter, United KingdomReviewed by:
Adnan Abbas, Nanjing University of Information Science and Technology, ChinaCopyright © 2024 Bal, Shivaramu, Vijaya Kumar, Lingaraj, Sandeep, Subba Rao, Sarath Chandran, Manikandan, Thimmegowda, Manjunatha, Malleswari, Tupe, Sudhakar, Dakhore, Subbulakshmi, Minhas, Singh and Singh. This is an open-access article distributed under the terms of the Creative Commons Attribution License (CC BY). The use, distribution or reproduction in other forums is permitted, provided the original author(s) and the copyright owner(s) are credited and that the original publication in this journal is cited, in accordance with accepted academic practice. No use, distribution or reproduction is permitted which does not comply with these terms.
*Correspondence: Malamal Alickal Sarath Chandran, c2FyYXRoYWdyaUBnbWFpbC5jb20=; Huchahanumegowdanapalya S. Shivaramu, aHNzcmFtdUBnbWFpbC5jb20=
Disclaimer: All claims expressed in this article are solely those of the authors and do not necessarily represent those of their affiliated organizations, or those of the publisher, the editors and the reviewers. Any product that may be evaluated in this article or claim that may be made by its manufacturer is not guaranteed or endorsed by the publisher.
Research integrity at Frontiers
Learn more about the work of our research integrity team to safeguard the quality of each article we publish.