 Siqing Wang
 Li Ma
Li Ma Liping Yang
 Xinyuan Long
 Chao Guan
 Changming Zhao
 Ning Chen
- 1State Key Laboratory of Herbage Improvement and Grassland Agro-ecosystems, College of Ecology, Lanzhou University, Lanzhou, Gansu, China
- 2Yuzhong Mountain Ecosystems Observation and Research Station, Lanzhou University, Lanzhou, Gansu, China
- 3State Key Laboratory of Environmental Criteria and Risk Assessment, National State Environmental Protection Key Laboratory of Ecological Continental Processes and Functions Assessment, Chinese Research Academy of Environmental Sciences, Beijing, China
Desertification in the context of global change and intensified anthropogenic activities poses a huge challenge to the sustainable development of the Earth’s systems, including the Qinghai Lake Basin, which is located in the Tibetan Plateau. However, we know little about desertification in the Qinghai Lake Basin, which is an urgent and important issue. To that end, this study used the enhanced vegetation index (EVI) and the albedo data from MODIS satellites to explore this issue. Results based on vegetation cover (FVC) calculated from EVI indicated that desertification in the Qinghai Lake Basin had reversed over the last 20 years, and the heavily desertified areas were concentrated along the northwestern to northern basin boundaries and on the sandy eastern shore of Qinghai Lake. More interestingly, we found that the relationship between albedo and EVI showed a “V” shape instead of the traditional monotonic trapezoid, which may be related to multiple factors such as soil moisture, soil type, and spatial scale of sampling. This study unfolds the spatial and temporal distribution of desertification in the Qinghai Lake Basin quantitatively and emphasizes the threshold of the desertification process revealed in the EVI-albedo feature space, which sheds light on the monitoring of desertification in alpine areas.
1 Introduction
Desertification is a type of land degradation mainly caused by climate and human activities in drylands (Xu et al., 2011). It poses a major threat to achieving global sustainable development (Li et al., 2021). Desertified lands cover 35% of the world’s terrestrial land area, and about 20% of the world’s population is affected by desertification (Huang et al., 2020). By the end of the century, the risk of desertification is predicted to increase in Africa, North America, China, and northern India (Huang et al., 2020), potentially threatening ecological security and leading to declining land productivity and inadequate food supplies (Wang et al., 2008; Stringer et al., 2009). Intensified drought stress under climate change may cause abrupt changes in ecosystem structure and functioning, further increasing the risk of desertification (Berdugo et al., 2021; Sun et al., 2023).
Up to now, desertification studies have focused primarily on warm drylands such as tropical, temperate, and Mediterranean drylands (Benassi et al., 2020; Dastorani, 2022; Han et al., 2023; Kadri and Nasrallah, 2023). However, desertification in alpine areas such as the Tibetan Plateau remains largely unknown (Li et al., 2020). Due to the unique topography, soil texture, climate, lifestyle, and population density, desertification characteristics and trends in alpine areas differ from those in the warm drylands (Li et al., 2023; Ye et al., 2023). For example, desertification in alpine areas may be dominated by temperature, that is, freeze-thaw, whereas in warm drylands, it is largely dominated by precipitation and wind (Li et al., 2021; Liu et al., 2023). Additionally, alpine meadows maintain sufficient soil moisture, resulting in the widespread occurrence of light desertification (Guo et al., 2022). Thus, quantifying desertification in alpine areas is very important and necessary.
This study takes the Qinghai Lake Basin as an example. It is located in the northeast of the Tibetan Plateau, China, and covers an area of nearly 0.3 million km2 (Wang et al., 2022). It serves as an ecological barrier to the Tibetan Plateau and also an effective buffer against the wind and sand brought by the northern deserts and the Gobi. Since the start of the 21st century, desertification in the Qinghai Lake Basin has been relatively stable, partly due to the implementation of conservation policies such as returning farmland to grassland and replacing livestock grazing with fenced fields (Wang et al., 2013). However, climate change and human activities have degraded the lakeshore grasslands into sandy areas that are moving 7 km per year from the edge of the lake (Yu et al., 2022b). Therefore, it is crucial to understand the status of desertification in the Qinghai Lake Basin (Wang et al., 2013). At present, related studies focus on two main fields: 1) applicable indicators for monitoring desertification in the basin (e.g., vegetation cover, vegetation index, and albedo) (Yu et al., 2022a); and 2) a simplified explanation of the mechanisms driving desertification (Dong et al., 2017). However, it is difficult to explain the desertification status of the basin because of nonlinear desertification processes (Hu et al., 2022). Thus, the desertification process of the Qinghai Lake Basin over the long term and across its vastness remains unclear.
Overall, this study explored the desertification issue in the Qinghai Lake Basin using both EVI-informed vegetation cover and albedo-EVI feature space-based approaches. EVI was chosen instead of a normalized difference vegetation index (NDVI) because EVI performs better in areas with high vegetation cover (Venter et al., 2020; Petrosillo et al., 2021). Through the study, we aim to determine the spatial and temporal distribution of desertification in the Qinghai Lake Basin over the past 20 years. This will provide a case study and an insight into investigating desertification in other alpine areas.
2 Materials and methods
2.1 Research area
The Qinghai Lake Basin is located in the northeastern part of the Qinghai–Tibet Plateau (36°15′N∼38°20′N, 97°35′E∼101°20′E), with a total area of approximately 29,664 km2 and an elevation of 3,242∼5,279 m (Figure 1). The basin is endorheic (Cui and Li, 2015), oval in boundary, and tilts from northwest to southeast, with erosional tectonic, accumulation, and wind accumulation landforms in the ring belt (Zhang J. et al., 2022). Its climate is classified as semi-arid and highland continental, with an average annual temperature of −1.1°C∼4.0°C, annual precipitation of 300∼450 mm, and potential annual evaporation of 930 mm (Zhang et al., 2019). Sandy and chestnut-calcium soils are dominant, with saline soils covering a smaller area. In the western areas, where annual precipitation is lower, there are large amounts of calcareous black soils and submerged black soils (FAO-90 soil classification system). With increasing elevation, the vegetation type changes from sparse grassland (<3,350 m) to alpine habitat-tolerant shrubs and meadows (3,350∼4,000 m), and finally to alpine talus vegetation (>4,000 m), with NDVI values increasing and then decreasing (Liu et al., 2017; Fu et al., 2020).
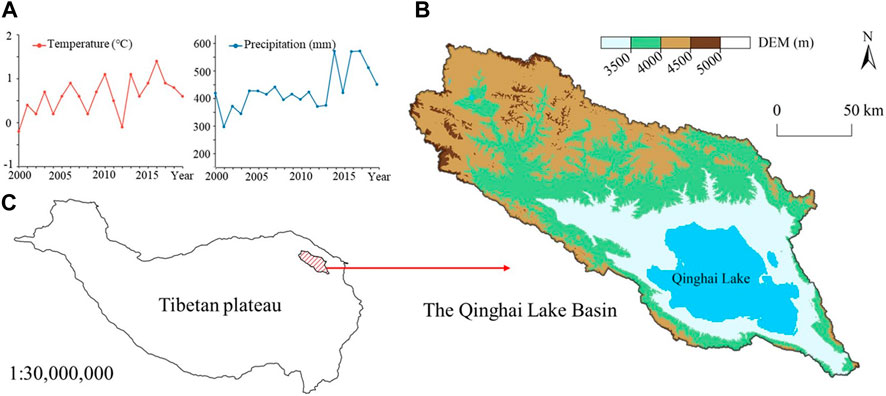
FIGURE 1. (A) Mean annual temperature and precipitation in the Qinghai Lake Basin, (B) Elevation and outline of the Qinghai Lake Basin, and (C) Relative location of the basin in the Tibetan Plateau.
2.2 Data analysis
EVI and albedo information were obtained from MODIS data from January 2001 to December 2020. The study area covers a geographical area of h25v05 and h26v05 in the sinusoidal Earth projection system. The obtained HDF data were reprojected, stitched, and processed using MRT software provided by NASA and transformed into remote sensing images with a coordinate type of WGS-84-UTM-ZONE-47. In addition, we downloaded land cover type data from MODIS, DEM data from SRTM, and soil type data from the Harmonized World Soil Database (HWSD). All the data were resampled to a spatial resolution of 500 m. Please refer to Table 1 for more details.

TABLE 1. Research data and data sources.
2.2.1 Desertification monitoring method based on vegetation cover
Fractional vegetation cover (FVC), calculated from EVI, was taken as an indicator of desertification to reflect spatial variation in plant communities (Abalori et al., 2022; Feng et al., 2022). EVI was first calculated from the DN values multiplied by a scaling factor of 0.0001 according to Eq. 1. We used the maximum value composition (MVC) method to extract the maximum value of EVI information for each image pixel to compensate for the interference of solar elevation angle, clouds, atmosphere, and other related factors according to Eq. 2. EVIi represents the EVI value of the ith year (month); EVIij represents the EVI value of the corresponding jth month (day) of the ith year (month).
Areas with buildings, permanent snow cover, and water could significantly interfere with the assessment of full bare ground pixels and full vegetation cover pixels and were excluded. MCD12Q1-land cover type data from MODIS was used for that purpose. We used the mask to crop 20 years of EVI-Max raster images year by year and calculated the vegetation cover (FVC) based on the dichotomous image segmentation, according to Eq. 3. Finally, the desertification difference index (DDI) was obtained based on the negative correlation between the vegetation state and the desertification state (Hilker et al., 2013), Eq. 4. To get a clearer understanding of the desertification characteristics in the Qinghai Lake Basin, we graded the intensity of desertification (Table 2) (Wang et al., 2013; Zhou et al., 2023) and calculated the interannual change rate (P) using Eq. 5. Here, S2 represents the area of desertification in the following year, and S1 represents the area in the former year.

TABLE 2. Land desertification intensity grading index in the Qinghai Lake Basin.
2.2.2 Desertification monitoring method based on albedo-EVI feature space
The albedo-EVI feature space can reflect desertification information more comprehensively, especially in terms of radiation flux and surface hydrothermal conditions, which can improve desertification monitoring accuracy to 88% and provide clearer ecological connotations (Guo et al., 2022). As desertification progresses, EVI decreases and albedo increases, resulting in a negative regression line across the albedo-EVI feature space. Therefore, a DDIEA index based on EVI-albedo can be obtained, as shown in Eq. 6 (Wei et al., 2018), which can distinguish different degrees of desertified land types and further indicate the process of desertification (Zhang et al., 2023).
In this study, albedo and EVI data were obtained for the years 2000, 2005, 2010, 2015, and 2020. The minimum albedo values within each year were extracted for each pixel according to Eq. 7. Then, EVI and albedo were normalized and reflected in the feature space to observe the two-dimensional response and the similarities and differences of interannual trend changes in the Qinghai Lake Basin using Eqs 8, 9.
3 Results
3.1 Desertification monitoring based on vegetation cover
Using vegetation cover data to monitor the desertification process on an interannual scale reveals an increasing trend of non-desertification and light desertification in the Qinghai Lake Basin between 2001 and 2020, increasing by 14.20% and 17.25%, respectively. Although the areas of moderate, severe, and extreme desertification increased from 2010 to 2015, they decreased by degrees of 2.06%, 29.53%, and 16.40%, respectively, in a 20-year period from 2001 to 2020. In other words, desertification in the Qinghai Lake Basin has been reversed to a certain extent (Table 3).
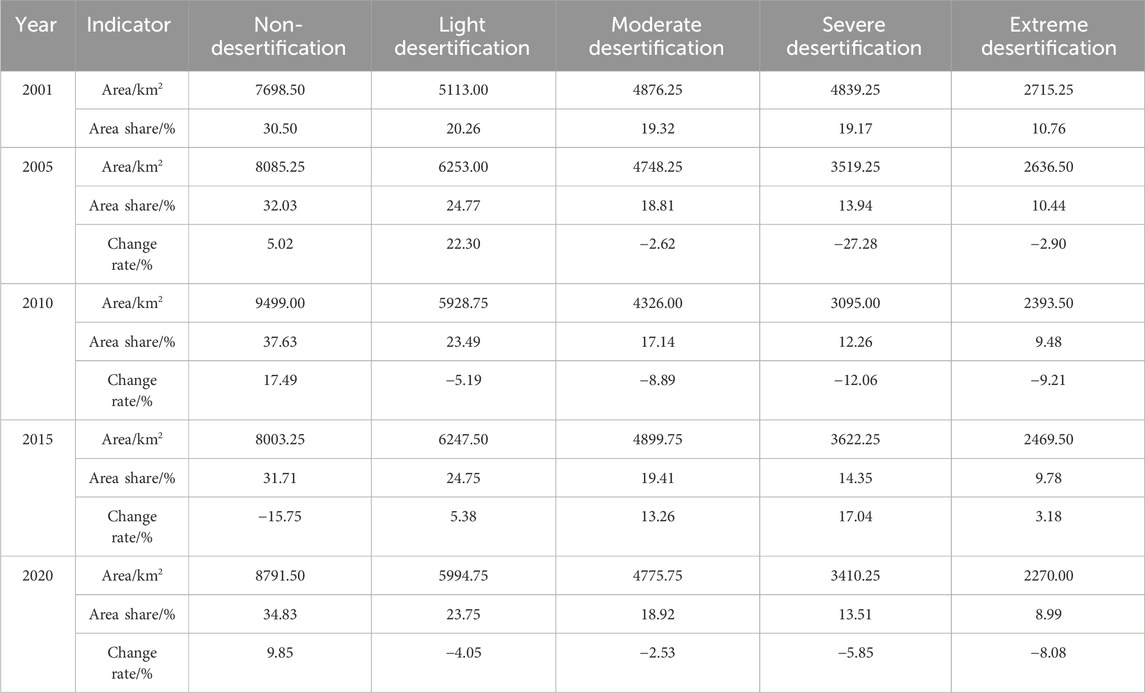
TABLE 3. Land area and dynamics of desertification in the Qinghai Lake Basin, 2001–2020.
More specifically, extreme desertification (Table 3) was concentrated in the northwestern part of the basin and the eastern shore of Qinghai Lake (Figure 2). Severe desertification was observed at the peripheries and the northern boundary of the basin. Moderate desertification was more widespread than severe or extreme desertification, mainly in the south-central part of the basin, and was less widespread in the northern and south-eastern corners of Qinghai Lake. The smallest and most scattered area was the light desertification, which could be seen sporadically in the middle of the basin. Compared to the four types of desertification areas above, the non-desertification land had the largest area and could be divided into two spatial parts. The larger part was located in the central and western parts of the basin, while the smaller part stretched narrowly from the southern shore of Qinghai Lake to the northwest. Temporally, the pattern of desertification did not change much on a 20-year scale. Areas with reversed desertification were concentrated in the northwestern and central parts of the basin. The desertification in the northwestern part of the Qinghai Lake Basin gradually reverted from extreme to severe desertification, and the central area improved along the trend of “moderate desertification—light desertification—non-desertification.” It should be noted that the sandy land on the eastern side of Qinghai Lake showed serious degradation, moving from severe to extreme desertification and expanding further eastward.

FIGURE 2. Desertification classification of the Qinghai Lake Basin, 2001–2020.
3.2 Desertification monitoring based on albedo-EVI feature space
The albedo-EVI relationship showed that the slope of the fitted curves was greater than 0, and the Pearson correlation coefficients were in the range of 0.042∼0.382, which is contrary to the prediction of a classical negative correlation. Different times and sampling methods did not significantly alter the results (Table 4). However, the albedo-EVI samples from the Qinghai Lake Basin were not characterized by a simple monotonically increasing trend, as observed in all pixels and random sampling results from 2005 to 2015 (Figure 3).
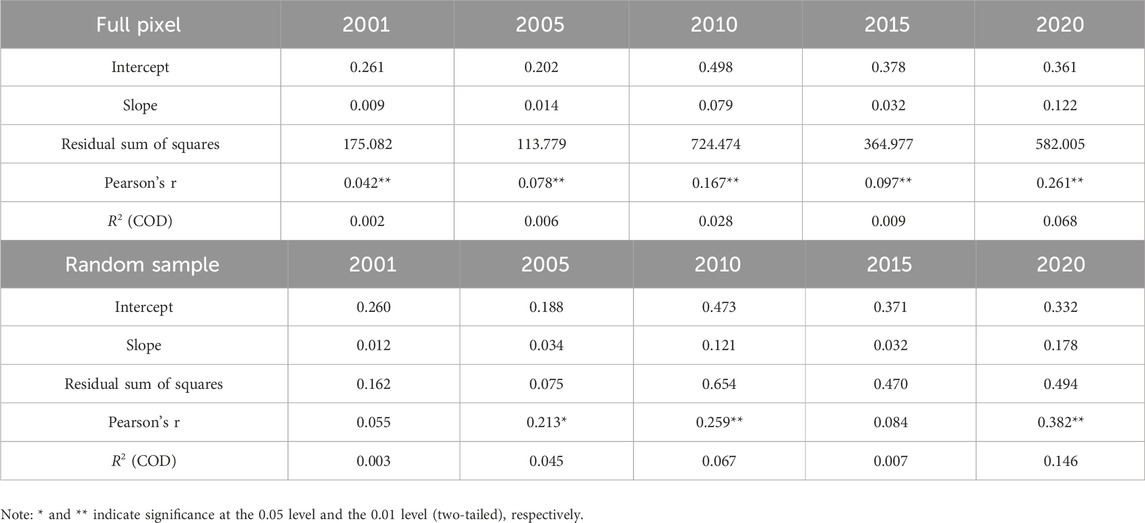
TABLE 4. Results of spatial construction of albedo-EVI features in the Qinghai Lake Basin, 2001–2020.
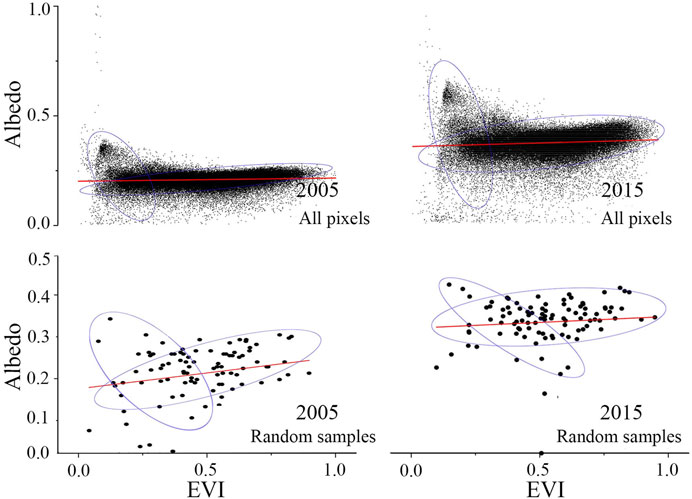
FIGURE 3. Spatial albedo-EVI characteristics in the Qinghai Lake Basin in 2005 and 2015.
Was this a coincidence or a more general regularity? We further tested the data for 5 years and were surprised to find that the albedo-EVI feature space consisted of an intriguing pattern—negative and positive relationships before and after a specific EVI threshold, respectively (Figure 4). In other words, the relationship between albedo and EVI was negatively correlated in bare ground and low vegetation areas (a-b). However, once a certain threshold (b) was crossed, the relationship reversed to be positive in the medium and high vegetation areas (b-c), albeit with a weaker trend (Figure 5). Therefore, the classical trapezoidal albedo-EVI feature space may no longer be suitable for describing the desertification of the Qinghai Lake Basin, although it may still be valid in the left quadrant of the feature space.
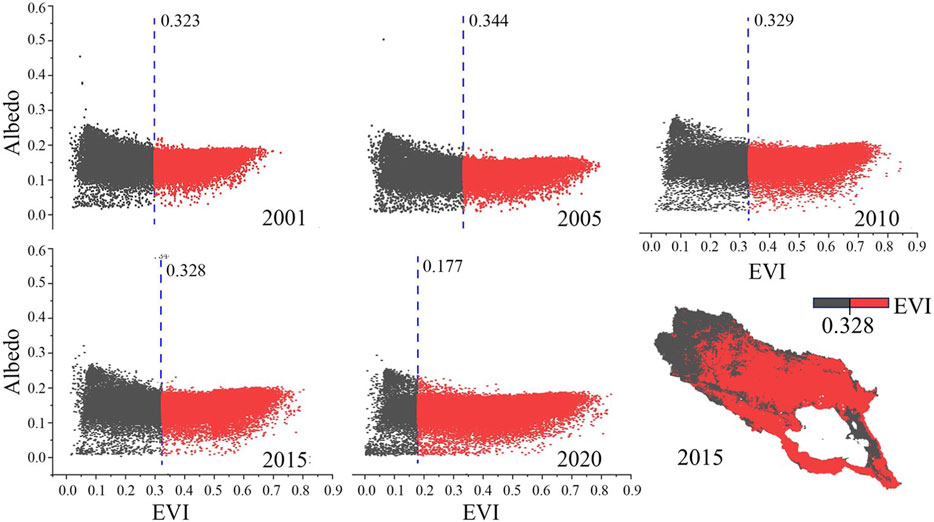
FIGURE 4. Results of quadratic regression fits. The gray and red parts represent the negative and positive correlations between EVI and albedo, respectively. The blue dashed line indicates the turning point of the quadratic function fit. Taking 2015 as an example, the spatial distribution of data points on either side of the EVI value around 0.328 is shown in the basin map.
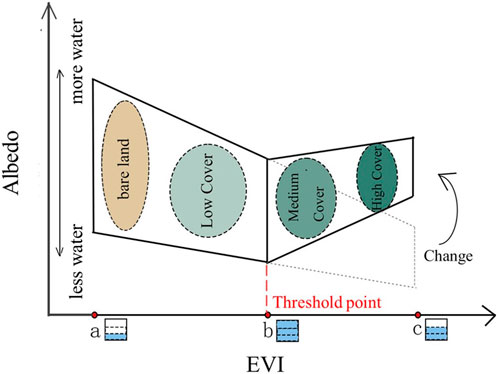
FIGURE 5. Albedo-EVI feature space of the Qinghai Lake Basin. The dashed lines indicate the distribution of the classical trapezoidal feature space in the medium- and high-vegetation cover areas, while the solid lines indicate the distribution of the V-shaped feature space in the Qinghai Lake Basin. Labels a, b, and c mark the EVI at different gradients, and label b marks a threshold. The adjacent boxes represent the corresponding soil moisture under different vegetation indices, and the oval areas represent the change in vegetation cover.
We additionally fitted linear, quadratic, and cubic equations to the data and found that the quadratic equation was optimal, confirming the V-shaped relationship. Taking the lowest value between the positive and negative albedo-EVI relationships, a threshold of around 0.33 was obtained, except for 0.117 in 2020 (Figure 4).
4 Discussion
4.1 Spatial and temporal evolution of desertification in the Qinghai Lake Basin
Over the past two decades, the desertification process in the Qinghai Lake Basin has slowed significantly. The temporal evolution is divided into three distinct phases: an ecological turnaround period from 2000 to 2010, a desertification acceleration period from 2010 to 2015, and a desertification recovery period from 2015 to 2020. Since the beginning of the 21st century, the climate of the basin has warmed significantly and become more humid, creating favorable conditions for vegetation growth (Zhou et al., 2023). However, human activities such as overgrazing and deforestation led to rapid desertification (Wang et al., 2013). By the end of 2014, the livestock population had reached 2,375,200 head. Mismanagement has significantly reduced the production and reproductive capacity of the pastures, which has directly led to a decrease in the stability of the original vegetation community structure in the basin (Sun et al., 2021). From 2010 to 2015, temperature and precipitation in the Qinghai Lake Basin fluctuated dramatically, especially between 2014 and 2015, when the mean annual temperature increased by 0.3°C and the mean annual precipitation decreased by 150.6 mm (Figure 1). Since 2015, Qinghai province has prioritized ecosystem protection, resulting in comprehensive environmental improvements in the southern foothills of the Qilian Mountains and the Yangtze-Yellow River headwaters.
At the spatial scale, desertification was low in the central parts of the basin and high in the east, consistent with the west-to-east transport of atmospheric water vapor fluxes in the Qinghai Lake Basin (Fan et al., 2021). From the perspective of tourism, the popularity of “Qinghai Lake culture” attracted tourists, thereby intensifying the desertification rate of sandy areas on the eastern side of Qinghai Lake (Xiong et al., 2018; Zhang Z. et al., 2022).
4.2 V-shaped albedo-EVI feature space
The relationship between albedo and EVI exhibits a V-shaped pattern, with a decrease followed by an increase along the EVI gradient. It has been suggested that the Qinghai-Tibet Plateau is very sensitive to surface albedo variations (You et al., 2021). A variety of factors influence albedo, in particular, vegetation cover, surface roughness, topsoil moisture content, air temperature, and solar elevation angle (Sun et al., 2020). For instance, as vegetation cover increases from zero to low values, increasing EVI is accompanied by a decrease in bare surface area and an increase in surface roughness, eventually leading to a decrease in albedo. This is consistent with the monotonic trapezoidal eigenspace explanation. In regions with medium to high vegetation cover, other factors may also play an important role.
First, previous studies have shown that vegetation cover in the Qinghai Lake Basin increases and then decreases with an increasing elevation gradient (sparse grassland at the low elevation → alpine-tolerant shrubs and meadows at the middle elevation → alpine talus at the high elevation) (Fu et al., 2020). The middle elevation region has a warmer and drier environment than the high elevation, which contributes to the surface evapotranspiration process and results in lower soil water content in the middle elevation regions (Liu et al., 2017). Given that incident flux is constant, drier soils tend to increase reflected flux at the surface and thus increase albedo. Therefore, the variation in albedo is only influenced by the vegetation index and by soil moisture. Furthermore, the unique permafrost landscape of the Qinghai–Tibet Plateau amplifies the effect of soil moisture on albedo (Liu et al., 2021). So, a positive albedo-EVI correlation in the middle-high EVI occurs.
Second, spatial extent may be another important factor contributing to the non-monotonic trend. Zeng et al. (2006) studied desertification processes in the Yellow River headwaters, selecting one of the typical small areas (with different land cover types) rather than the region as a whole. Although local sampling is highly representative of regional desertification monitoring, it may not be efficient for large-scale desertification assessment (Liu et al., 2014). The entire Qinghai Lake Basin, which has a much larger spatial extent and contains wider ranges of albedo and vegetation index, is considered in this study. This may be a reason why the V-shaped feature space was observed here and differed from the classically significant negative correlation trend.
Third, soil color may play a role. According to the HWSD-FAO-90 soil classification data (Figure 6), from the medium vegetation to the high vegetation cover areas within the Qinghai Lake Basin, the soil type transitions from calcareous black soils (Chernozems) and submerged black soils (gleysols) to chestnut calcareous soils (kastanozems) and solonchaks (Figure 6). As the soil becomes lighter in color, its reflectivity increases, causing the surface albedo to reverse. In contrast, in the Yellow River headwater area, strong winds and dust storms have blown away the topsoil, particularly in the north, where sands and mobile dunes are widespread, possibly leading to the emergence of a linear negative albedo-EVI correlation (Zeng et al., 2006).

FIGURE 6. Soil classification of the Qinghai Lake Basin.
Finally, EVI was chosen as the vegetation index instead of NDVI. EVI is narrower than NDVI in the red and near-infrared bands and includes the blue band, which can effectively mitigate the effect of atmospheric aerosol saturation and improve the sensitivity of monitoring in areas with thick vegetation cover (Guo et al., 2020). In other words, EVI is more suitable for monitoring desertification in areas where the vegetation index is in the range [0, 1], especially in areas with high vegetation cover (Wang et al., 2003). Another point needing attention is that EVI directly reflects the greenness of vegetation (Li et al., 2019). During the process of decreasing EVI (as shown in Figure 5, c → a), despite the weakening of vegetation greenness, it is very likely that the vegetation density did not change significantly after the threshold point b was reached (John et al., 2015; Li and Song, 2021). Thus, we would like to suggest that these areas should be considered non-desertification areas. In other words, the turning point in the EVI-albedo feature space can be taken as a threshold to classify desertification vs. non-desertification in alpine regions. This point requires further study. Additionally, we identified an EVI threshold point of 0.33 in the Qinghai Lake Basin.
5 Conclusion
This study clarified the spatial and temporal evolution patterns of desertification in the Qinghai Lake Basin. It was found that the basin showed an inverse trend of desertification in general. Between 2001 and 2020, the trend of land fragmentation increased at all levels of desertification. In terms of spatial distribution, the degree of desertification was serious in the northwestern part of the basin, the northern border, and the eastern shore of Qinghai Lake. Conversely, the degree of desertification was lowest in the central and southern parts of the basin. More interestingly, we found a V-shaped albedo-EVI feature space, which is contrary to the classical understanding. This sheds light on desertification monitoring: As the scale of study areas expands and the heterogeneity of environmental conditions increases, V-shaped feature spaces may become more common, and the threshold point may change to varying degrees. Therefore, in future desertification monitoring, we need to consider the possibility of a V-shaped feature space instead of using the trapezoidal feature space as the scientific paradigm. Of course, it cannot be taken for granted that the V-shaped feature space is applicable to all desertification areas. The existence of a threshold point in the EVI-albedo feature space poses great potential to be taken as a landmark to identify desertification in alpine regions. Further evaluations are necessary.
Data availability statement
Publicly available datasets were analyzed in this study. These data can be found at: http://ladsweb.nascom.nasa.gov/.
Author contributions
SW: writing–original draft and writing–review and editing. LM: data curation and writing–original draft. LY: methodology and writing–original draft. XL: formal analysis, methodology, and writing–review and editing. CG: formal analysis and writing–review and editing. CZ: resources and writing–review and editing. NC: formal analysis, methodology, resources, supervision, validation, and writing–review and editing.
Funding
The authors declare that financial support was received for the research, authorship, and/or publication of this article. We appreciate the support from the Natural Science Foundation of China (no. 32271620), Fundamental Research Funds for the Central Universities (lzujbky-2021-ey16, lzujbky-2023-eyt01), and the National Key Research and Development Program of China (2023YFF0805603).
Acknowledgments
The authors are grateful to Yanxiang Jin of Qinghai Normal University for providing effective suggestions on the evolution of desertification dynamics and to Lele Zhang of Qinghai Normal University for providing guidance on the specificity of albedo and soil moisture in the Qinghai Lake Basin. The language and writing of this paper have been improved using ChatGPT v3.5.
Conflict of interest
The authors declare that the research was conducted in the absence of any commercial or financial relationships that could be construed as a potential conflict of interest.
Publisher’s note
All claims expressed in this article are solely those of the authors and do not necessarily represent those of their affiliated organizations, or those of the publisher, the editors, and the reviewers. Any product that may be evaluated in this article, or claim that may be made by its manufacturer, is not guaranteed or endorsed by the publisher.
References
Abalori, T. A., Cao, W., Weobong, C.A.-A., Li, W., Wang, S., and Deng, X. (2022). Spatial vegetation patch patterns and their relation to environmental factors in the alpine grasslands of the qilian Mountains. Sustainability 14 (11), 6738. doi:10.3390/su14116738
Benassi, F., Cividino, S., Cudlin, P., Alhuseen, A., Lamonica, G. R., and Salvati, L. (2020). Population trends and desertification risk in a Mediterranean region, 1861-2017. Land Use Policy 95, 104626. doi:10.1016/j.landusepol.2020.104626
Berdugo, M., Vidiella, B., Sole, R. V., and Maestre, F. T. (2021). Ecological mechanisms underlying aridity thresholds in globaldrylands. Funct. Ecol. 00, 4–23. doi:10.1111/1365-2435.13962
Cui, B., and Li, X. (2015). Stable isotopes reveal sources of precipitation in the Qinghai Lake Basin of the northeastern Tibetan Plateau. Sci. Total Environ. 527-528, 26–37. doi:10.1016/j.scitotenv.2015.04.105
Dastorani, M. (2022). Application of fuzzy-AHP method for desertification assessment in Sabzevar area of Iran. Nat. Hazards 112 (1), 187–205. doi:10.1007/s11069-021-05177-8
Dong, Z., Hu, G., Qian, G., Lu, J., Zhang, Z., Luo, W., et al. (2017). High-Altitude aeolian research on the Tibetan plateau. Rev. Geophys. 55 (4), 864–901. doi:10.1002/2017rg000585
Fan, C., Song, C., Li, W., Liu, K., Cheng, J., Fu, C., et al. (2021). What drives the rapid water-level recovery of the largest lake (Qinghai Lake) of China over the past half century? J. Hydrology 593, 125921. doi:10.1016/j.jhydrol.2020.125921
Feng, Y., Wang, S., Zhao, M., and Zhou, L. (2022). Monitoring of land desertification changes in urat front banner from 2010 to 2020 based on remote sensing data. Water 14 (11), 1777. doi:10.3390/w14111777
Fu, J., Cao, G., and Guo, W. (2020). Changes of growing season NDVI at different elevations, slopes, slope aspects and its relationship with meteorological factors in the southern slope of the Qilian Mountains, China from 1998 to 201. Chin. J. Appl. Ecol. 31 (4), 1203–1212. doi:10.13287/j.1001-9332.202004.018
Guo, B., Wei, C., Yu, Y., Liu, Y., Li, J., Meng, C., et al. (2022). The dominant influencing factors of desertification changes in the source region of Yellow River: climate change or human activity? Sci. Total Environ. 813, 152512. doi:10.1016/j.scitotenv.2021.152512
Guo, B., Zang, W., Luo, W., Wen, Y., Yang, F., Han, B., et al. (2020). Detection model of soil salinization information in the Yellow River Delta based on feature space models with typical surface parameters derived from Landsat8 OLI image. Geomatics, Nat. Hazards Risk 11 (1), 288–300. doi:10.1080/19475705.2020.1721573
Han, J., Han, L., Sun, G., Mu, H., Zhang, Z., Wang, X., et al. (2023). Optimal scale selection and an object-oriented method used for measuring and monitoring the extent of land desertification. Sustainability 15 (7), 5619. doi:10.3390/su15075619
Hilker, T., Natsagdorj, E., Waring, R. H., Lyapustin, A., and Wang, Y. (2013). Satellite observed widespread decline in Mongolian grasslands largely due to overgrazing. Glob. Change Biol. 20 (2), 418–428. doi:10.1111/gcb.12365
Hu, Y., Wang, H., Jia, H., Pen, M., Liu, N., Wei, J., et al. (2022). Ecological niche and interspecific association of plant communities in alpine desertification grasslands: a case study of Qinghai Lake Basin. Plants 11 (20), 2724. doi:10.3390/plants11202724
Huang, J., Zhang, G., Zhang, Y., Guan, X., Wei, Y., and Guo, R. (2020). Global desertification vulnerability to climate change and human activities. Land Degrad. Dev 31 (11), 1380–1391. doi:10.1002/ldr.3556
John, R., Chen, J., Kim, Y., Ou-yang, Z.-t., Xiao, J., Park, H., et al. (2015). Differentiating anthropogenic modification and precipitation-driven change on vegetation productivity on the Mongolian Plateau. Landsc. Ecol. 31 (3), 547–566. doi:10.1007/s10980-015-0261-x
Kadri, C. B., and Nasrallah, Y. (2023). GIS-based AHP technique for assessment of desertification in western highlands of Algeria. J. Geovisualization Spatial Analysis 7 (2), 18. doi:10.1007/s41651-023-00147-z
Li, J., Yao, Q., Zhou, N., Li, F., et al. (2020). Modern aeolian desertification on the Tibetan Plateau under climate change. Land Degrad. Dev. 32 (5), 1908–1916. doi:10.1002/ldr.3862
Li, C., Fu, B., Wang, S., Stringer, L. C., Wang, Y., Li, Z., et al. (2021). Drivers and impacts of changes in China's drylands. Nat. Rev. Earth Environ. 2 (12), 858–873. doi:10.1038/s43017-021-00226-z
Li, H., and Song, W. (2021). Spatiotemporal distribution and influencing factors of ecosystem vulnerability on Qinghai-Tibet Plateau. Int. J. Environ. Res. Public Health 18 (12), 6508. doi:10.3390/ijerph18126508
Li, W., Zheng, T. D., Cheng, X. P., and He, S. Q. (2023). Changes in functional traits and diversity of typical alpine grasslands after a short-term trampling disturbance. Front. Ecol. Evol. 11, 1154911. doi:10.3389/fevo.2023.1154911
Li, X., Li, Y., Chen, A., Gao, M., Slette, I. J., and Piao, S. (2019). The impact of the 2009/2010 drought on vegetation growth and terrestrial carbon balance in Southwest China. Agric. For. Meteorology 269-270, 239–248. doi:10.1016/j.agrformet.2019.01.036
Liu, l., Li, X., Jiang, Z., Wei, J., and Nan, M. (2017). Variation in soil water content along different altitude gradients in the Qinghai Lake Watershed. Resour. Sci. 39 (2), 263–275. doi:10.18402/resci.2017.02.09
Liu, S., Wang, T., Kang, W., and David, M. (2014). Several challenges in monitoring and assessing desertification. Environ. Earth Sci. 73 (11), 7561–7570. doi:10.1007/s12665-014-3926-x
Liu, W., Xie, C., Zhao, L., Li, R., Liu, G., Wang, W., et al. (2021). Rapid expansion of lakes in the endorheic basin on the Qinghai-Tibet Plateau since 2000 and its potential drivers. Catena 197, 104942. doi:10.1016/j.catena.2020.104942
Liu, Z., Ma, L., Liu, T., Qiao, Z., and Chen, Y. (2023). Influence of Key climate factors on desertification in inner Mongolia. Atmosphere 14 (9), 1404. doi:10.3390/atmos14091404
Petrosillo, I., Valente, D., Mulder, C., Li, B.-L., Jones, K. B., and Zurlini, G. (2021). The resilient recurrent behavior of mediterranean semi-arid complex adaptive landscapes. Land 10 (3), 296. doi:10.3390/land10030296
Stringer, L. C., Dyer, J. C., Reed, M. S., Dougill, A. J., Twyman, C., and Mkwambisi, D. (2009). Adaptations to climate change, drought and desertification: local insights to enhance policy in southern Africa. Environ. Sci. Policy 12 (7), 748–765. doi:10.1016/j.envsci.2009.04.002
Sun, C., Feng, X., Fu, B., and Ma, S. (2023). Desertification vulnerability under accelerated dryland expansion. Land Degrad. Dev. 34 (7), 1991–2004. doi:10.1002/ldr.4584
Sun, J., Fu, B., Zhao, W., Liu, S., Liu, G., Zhou, H., et al. (2021). Optimizing grazing exclusion practices to achieve Goal 15 of the sustainable development goals in the Tibetan Plateau. Sci. Bull. 66 (15), 1493–1496. doi:10.1016/j.scib.2021.03.014
Sun, L., Zhao, L., Li, R., and Xiao, Y. (2020). Seasonal changes and major influencing factors of surface albedo in the permafrost regions of the Qinghai-Tibet Plateau hinterland, China. Mt. Res. 38 (1), 9–18. doi:10.16089/j.cnki.1008-2786.000486
Venter, Z. S., Scott, S. L., Desmet, P. G., and Hoffman, M. T. (2020). Application of Landsat-derived vegetation trends over South Africa: potential for monitoring land degradation and restoration. Ecol. Indic. 113, 106206. doi:10.1016/j.ecolind.2020.106206
Wang, H., Long, H., Li, X., and Yu, F. (2013). Evaluation of changes in ecological security in China’s Qinghai Lake Basin from 2000 to 2013 and the relationship to land use and climate change. Environ. Earth Sci. 72 (2), 341–354. doi:10.1007/s12665-013-2955-1
Wang, H., Qi, Y., Lian, X., Zhang, J., Yang, R., and Zhang, M. (2022). Effects of climate change and land use/cover change on the volume of the Qinghai Lake in China. J. Arid Land 14 (3), 245–261. doi:10.1007/s40333-022-0062-4
Wang, X., Chen, F., Hasi, E., and Li, J. (2008). Desertification in China: an assessment. Earth-Science Rev. 88 (3-4), 188–206. doi:10.1016/j.earscirev.2008.02.001
Wang, Z., Liu, C., and Huete, A. (2003). From AVHRR-NDVI to MODIS-EVI: advances in vegetation index research. Acta Ecol. Sin. 23 (5), 979–987.
Wei, H., Wang, J., Cheng, K., Li, G., Ochir, A., Davaasuren, D., et al. (2018). Desertification information extraction based on feature space combinations on the Mongolian plateau. Remote Sens. 10 (10), 1614. doi:10.3390/rs10101614
Xiong, X., Zhang, K., Chen, X., Shi, H., Luo, Z., and Wu, C. (2018). Sources and distribution of microplastics in China's largest inland lake - Qinghai Lake. Environ. Pollut. 235, 899–906. doi:10.1016/j.envpol.2017.12.081
Xu, D., Li, C., Zhuang, D., and Pan, J. (2011). Assessment of the relative role of climate change and human activities in desertification: a review. J. Geogr. Sci. 21 (5), 926–936. doi:10.1007/s11442-011-0890-1
Ye, C., Wang, S., Wang, Y., Zhou, T., and Li, R. (2023). Impacts of human pressure and climate on biodiversity–multifunctionality relationships on the Qinghai–Tibetan Plateau. Front. Plant Sci. 14, 1106035. doi:10.3389/fpls.2023.1106035
You, Q., Cai, Z., Pepin, N., Chen, D., Ahrens, B., Jiang, Z., et al. (2021). Warming amplification over the arctic Pole and third Pole: trends, mechanisms and consequences. Earth-Science Rev. 217, 103625. doi:10.1016/j.earscirev.2021.103625
Yu, W., Yao, X., Shao, L., Liu, J., Shen, Y., and Zhang, H. (2022a). Classification of desertification on the north bank of Qinghai Lake. Comput. Mater. Continua 72 (1), 695–711. doi:10.32604/cmc.2022.023191
Yu, W., Zhu, M., Shao, L., Shen, Y., Liu, H., Chen, T., et al. (2022b). Characteristics of desertification change in Lake Basin area in gangcha county. Comput. Mater. Continua 73 (2), 3771–3793. doi:10.32604/cmc.2022.027094
Zeng, Y., Xang, N., Feng, Z., and Xu, H. (2006). Study on Albedo-NDVI feature space and desertification remote sensing monitoring index. Sci. Geogr. Sin. 26 (1), 75–81.
Zhang, J., Liu, Q., Yang, L., Cheng, H., Cai, Y., and Long, H. (2022a). Regional hydroclimates regulate the Holocene aeolian accumulation processes of the Qinghai Lake basin on the northeastern Tibetan plateau. Catena 210, 105866. doi:10.1016/j.catena.2021.105866
Zhang, M., Song, Y., and Dong, H. (2019). Hydrological trend of Qinghai Lake over the last 60 years: driven by climate variations or human activities? J. Water Clim. Change 10 (3), 524–534. doi:10.2166/wcc.2018.033
Zhang, X., Han, L., Li, L., and Bai, Z. (2023). Analysis of desertification and the driving factors over the Loess Plateau. Geocarto Int. 38 (1), 2290175. doi:10.1080/10106049.2023.2290175
Zhang, Z., Liu, Y., Li, Y., Wang, X., Li, H., Yang, H., et al. (2022b). Lake ecosystem health assessment using a novel hybrid decision-making framework in the Nam Co, Qinghai-Tibet Plateau. Sci. Total Environ. 808, 152087–152119. doi:10.1016/j.scitotenv.2021.152087
Keywords: Qinghai Lake Basin, desertification, spatial and temporal dynamics, albedo-EVI feature space, remote sensing, vegetation coverage
Citation: Wang S, Ma L, Yang L, Long X, Guan C, Zhao C and Chen N (2024) Quantifying desertification in the Qinghai Lake Basin. Front. Environ. Sci. 12:1309757. doi: 10.3389/fenvs.2024.1309757
Received: 13 October 2023; Accepted: 20 February 2024;
Published: 07 March 2024.
Edited by:
Michael Cosh, Agricultural Research Service (USDA), United StatesReviewed by:
Xiankun Yang, Guangzhou University, ChinaZahn Munch, Stellenbosch University, South Africa
Copyright © 2024 Wang, Ma, Yang, Long, Guan, Zhao and Chen. This is an open-access article distributed under the terms of the Creative Commons Attribution License (CC BY). The use, distribution or reproduction in other forums is permitted, provided the original author(s) and the copyright owner(s) are credited and that the original publication in this journal is cited, in accordance with accepted academic practice. No use, distribution or reproduction is permitted which does not comply with these terms.
*Correspondence: Ning Chen, Y25AbHp1LmVkdS5jbg==
†ORCID: Ning Chen, orcid.org/0000-0002-1779-915X