 Jiping Liu
 Baolong Chen
 Meng Zhang
94% of researchers rate our articles as excellent or good
Learn more about the work of our research integrity team to safeguard the quality of each article we publish.
Find out more
ORIGINAL RESEARCH article
Front. Environ. Sci., 19 January 2024
Sec. Land Use Dynamics
Volume 12 - 2024 | https://doi.org/10.3389/fenvs.2024.1302896
This article is part of the Research TopicWatershed Environmental Changes and Adaptive Management for SustainabilityView all 9 articles
To address the ecological security issues in the Songnen Plain, this study constructs the ecological security pattern by using the Multi-Criteria Evaluation Method, Minimum Cumulative Resistance (MCR) model, and Circuit Connectivity Model. Results show that: 1) The ecological source areas were 66, 52, and 56 blocks in 2000, 2010, and 2020 respectively, which are composed mainly of forests, water bodies, and wetlands. The distribution of resistance values of the ecological resistance surface shows a gradually increases trend from the source areas to the outward surrounding regions. The high and low value areas are more dispersed, consisting with the overall spatial distribution; 2) The numbers of ecological corridors show a temporal declining trend from 178 in 2000 to 159 in 2020 with a reduction of 645.46 km in total length. Node areas are mainly distributed in the southwestern and central-eastern regions and its number decreased from 232 in 2000 to 229 in 2020. The sizes of obstacle areas are 74029.52 km2, 70203.72 km2, and 75529.72 km2 in the three periods; 3) The size of important ecological source areas has decreased by 5779.16 km2, the area of medium ecological source areas has increased by 11466.44 km2, and the area of general ecological source areas has increased by 9509.16 km2. The areas being classified as ecological conservation, ecological enhancement, ecological restoration, and ecological control are 30346.68 km2, 8480.56 km2, 51473.92 km2, and 122047.48 km2, respectively. The multiple spatial pattern optimization strategies are proposed based on the identified ecological source areas, corridors, node points, and other comprehensive ecological security patterns. It not only provides practical reference for the ecological restoration and ecological protection in the Songnen Plain, but also can be used for the ecological security pattern investigations in other study regions in the world.
The Songnen Plain, an ecological ‘red line’ protected area in China, plays a crucial role in the ecological development of the Northeast region (Li, et al., 2019). With the deterioration of the natural environment and the impacts of human activities, many ecological problems, such as intensified soil erosion (Wood, et al., 2018), reduced habitat areas (Sallustio, et al., 2017), and a sharp decline in biodiversity (Cetin, et al., 2019), have become common. The ecological environment has become extremely fragile, featured by escalating salinization, grassland degradation, and continuous reduction in wetland areas. The emergence of these ecological issues poses a contradiction between economic development and ecological preservation (Cai, et al., 2023). Therefore, establishing a comprehensive ecological security pattern in this area and proposing rational protection strategies are important in ensuring the coordinated development of the economy and ecology in the Songnen Plain region (Ye, et al., 2018).
There are numerous studies in the literature investigating diverse facets of ecological security, which include but are not limited to landscape ecological planning, pattern optimization, ecological risk assessment, and the intricacies of ecosystem dynamics. Reflecting these research content and distinctive attributes, the central focus is on the stability and sustainability of ecosystems, particularly regarding their security in natural or semi-natural states (Fu, et al., 2001; Ye, et al., 2018). The ecological security framework serves as a crucial and fundamental assurance for achieving ecological safety (Yu, 1999). It refers to the presence of a potential spatial pattern within a landscape’s ecological system (Lee, et al., 2014). The formulation of ecological security patterns are important in the rejuvenation and reconfiguration of pivotal ecological elements. Equally vital is its role in upholding the stability of ecological processes (Zhang, et al., 2017). Furthermore, it plays a pivotal role in safeguarding the comprehensiveness and effectiveness of ecosystem functions (Zhang, et al., 2022a). Chinese scholars have predominantly engaged in micro-scale research into the geographical conditions and ecological processes of various administrative units, while foreign scholars have primarily focused on urban-rural boundary planning, natural conservation, and the support of ecosystem services when addressing ecological security pattern. They emphasize regulated management of ecosystems, aiming to ensure the sustainable provision of ecosystem services and enhance human wellbeing within regional development (Kong and Yin, 2008; Yin, et al., 2016; Peng, et al., 2017; Shi, et al., 2019; Liu, et al., 2022). These diverse spatial scale researches, ranging from macro-level investigations of natural resources to micro-level examinations of geographical conditions and ecological processes within administrative units, significantly enriches the conceptual depth of ecological security pattern. The prevailing method for establishing ecological security patterns adheres to the fundamental model of “source identification - construction of resistance surfaces - extraction of corridors” (Peng, et al., 2018a). Ecological source sites carry exceptional significance in upholding the stability and security of ecosystem functions, representing a critical factor in the construction process. Identifying source sites employs qualitative and quantitative methodologies (Wang, et al., 2019). Tailored to specific study domains and contexts, distinct evaluation indices and factors are selected, coalescing into a comprehensive evaluation system for source site identification (Chen, et al., 2017; Zhang, et al., 2019; Zhang, et al., 2021). Ecological resistance is affected and modified by both natural and human influences (Zhang, et al., 2017). Resistance factors include land cover and related disturbance factors. In the selection of resistance factors, considerations extend beyond diverse land use categories to encompass topographical features and distances, thus culminating in a holistic resistance surface (Zhang, et al., 2022b). Ecological corridors serve as indispensable conduits linking ecological source sites (Peng, et al., 2018b). The primary methods for identifying ecological corridors primarily include graph theory (Zhang, et al., 2021), gravity models, hydrological analysis, the minimum cumulative resistance model (MCR) (Wei, et al., 2022a; Zhang, et al., 2022a), and circuit theory (Peng, et al., 2017). Circuit theory perceives species migration as akin to the erratic movement of charges in an electrical circuit. This concept prevents the animals from knowing the surrounding landscape features in advance and is more in line with the animals themselves. Consequently, the ecological corridor structures identified through circuit theory exhibit greater alignment with real-world conditions (Zhang, et al., 2021).
In recent years, the optimization of the ecological security pattern focuses on ecological restoration (Peng, et al., 2017). The concept of zoning for ecological restoration primarily stems from ecological zoning, where zoning is a prerequisite for carrying out ecological restoration (Xu, et al., 2023). With the ecosystem as the research focus, the primary goal is to enhance ecological functionality (Gao and Yang, 2015). The issues, such as conflicting ecological elements within ecosystems, have become prominent and Chinese ecological restoration places more emphasis on the integrity of ecological processes, aiming for holistic coordination and governance of ecological space from multiple perspectives (Gao and Yang, 2015; Chen, et al., 2023a; Xu, et al., 2023). Current researches on ecological restoration zones often focus on indicators from natural ecology and social development to construct a comprehensive evaluation system (Liu, et al., 2021). The research topic on the Chinese ecological security patterns is still in the early stage (Wei, et al., 2022b) with limited mechanistic studies (Zhang, et al., 2021), even covering a wide range of categories. Methods used for constructing the ecological security patterns should be further strengthened on the formations, evolutions, and predictions of the patterns. Since ecological restoration is a long-term and dynamic process, changes in certain elements of the ecological security patterns will result in alterations. Therefore, relying solely on the elements of the ecological security patterns from a single year makes it difficult to reflect key issues in ecological restoration. The aim of this research is to explore the relationships among different elements during the construction of a security pattern based on the ecological security patterns of both “past and present” periods. We optimize the ecological security pattern of the Songnen Plain and propose relevant protection strategies. This study breaks away from the previous static approach to researching ecological security patterns. It provides a foundation for local governments or departments to balance the relationship between environmental protection and economic development. We offer data support for the future sustainable development of the Songnen Plain and suggest corresponding governance measures within the context of scientific research.
The Songnen Plain, which is in the central part of the Northeast region of China, is chosen for this study. It is located in between the Xiao Hinggan Mountains and the Changbai Mountain Range with the Songliao Watershed to its south. This region is a vast alluvial plain formed by the alluvial action of the Songhua River and the Nen River. Geographically, it spans from 43°36′N to 49°26′N and from 121°21′E to 128°18′E (Figure 1) within the administrative divisions of Jilin Province and Heilongjiang Province.
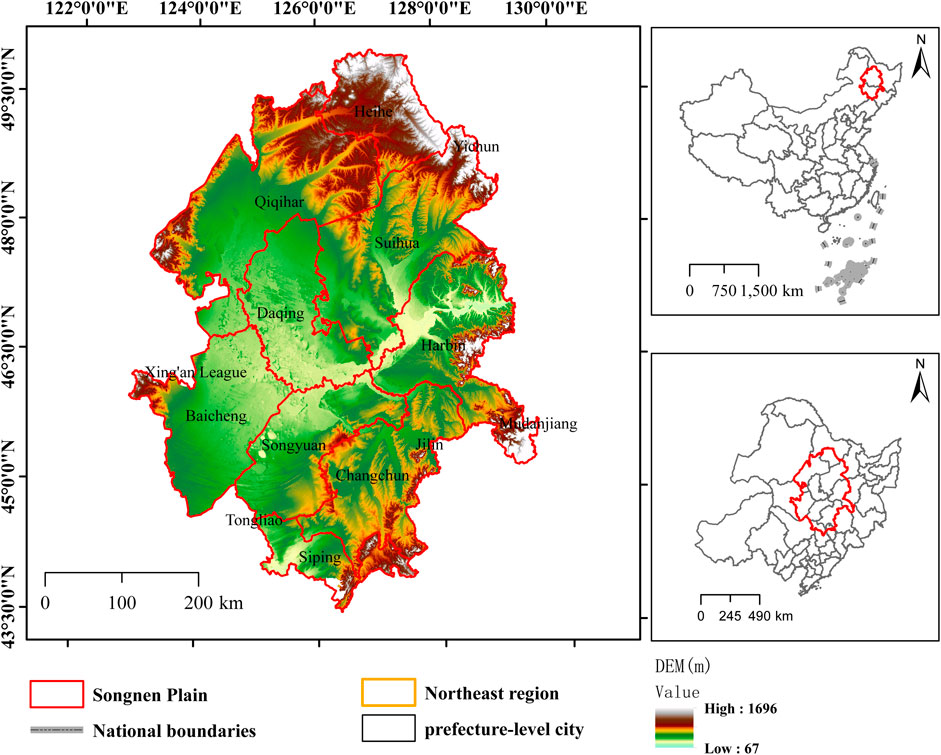
FIGURE 1. Location of the study region and DEM distribution in the Songnen Plain.
It is a mid-latitude region and experiences a temperate monsoon climate. The average annual temperature ranges between −4°C and 10°C with July being the warmest month and January the coldest. Annual precipitation ranges from 350 to 1000 mm/yr, with the majority of rainfall occurring between June and September. The annual rainfall also shows a spatial pattern decreasing from southeast to northwest. Overall, the terrain is flat and is part of the Songliao Fault Depression (Sun, et al., 2013). The region has a well-developed water system with a dense network of rivers. The Songhua River is the largest river system within China’s Heilongjiang province (Wang, et al., 2019). Its northern branch, the Nen River, stretches a total length of 1370 km, flowing from north to south through the western part of Heilongjiang Province and meeting the San Cha River in Zhenlai County, Jilin Province (Zhang, et al., 2018). The study region has a rich variety of soils, with black soil prevalent in the eastern area and black calcareous soil extending from the north to the south in the central area. Meadow soil is found across the entire plain with a high content of humus. The grassland in the area are mainly meadow steppes with prevalent plant communities, such as reeds and alkali grass, because of their strong tolerance to saline-alkaline conditions. The wetland area of the Songnen Plain covers approximately 14.7% of the national total wetland area, primarily distributed in the low-lying areas within the research region (Sun, et al., 2013). The saline-alkali land accounts for roughly 4.9% of the total area, with severe cases primarily being located in the western region of the Songnen Plain (Wang and Li, 2018).
The land use data is interpreted from Landsat remote sensing data, which is publicly released by the United States Geological Survey (USGS). This data undergoes preprocessing and interpretation to categorize different land classes into cultivated land, forested areas, grasslands, water bodies, wetlands, saline-alkali lands, built-up areas, and unused or non-utilized lands (Figure 2). Other data are shown in Table 1.
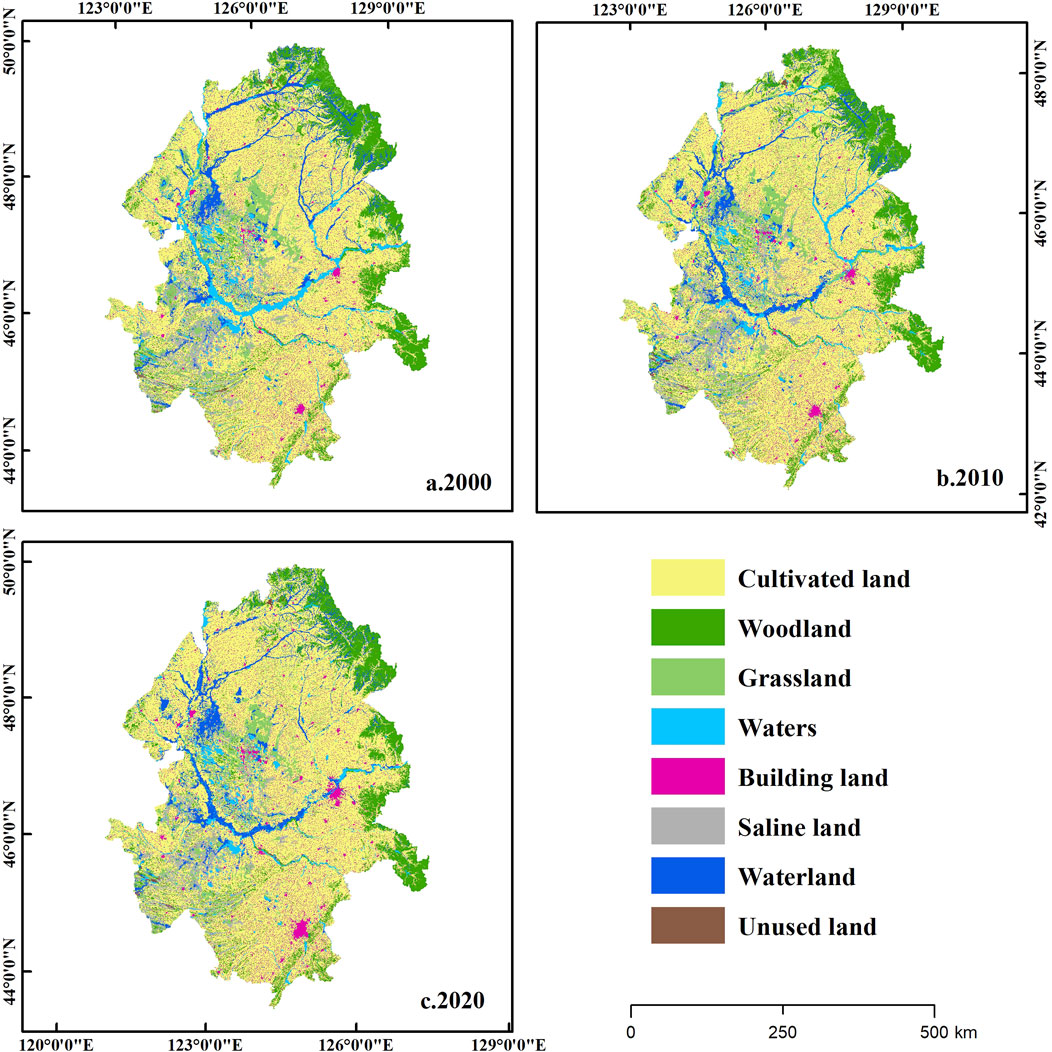
FIGURE 2. Land use type maps of in 2000, 2010 and 2020.
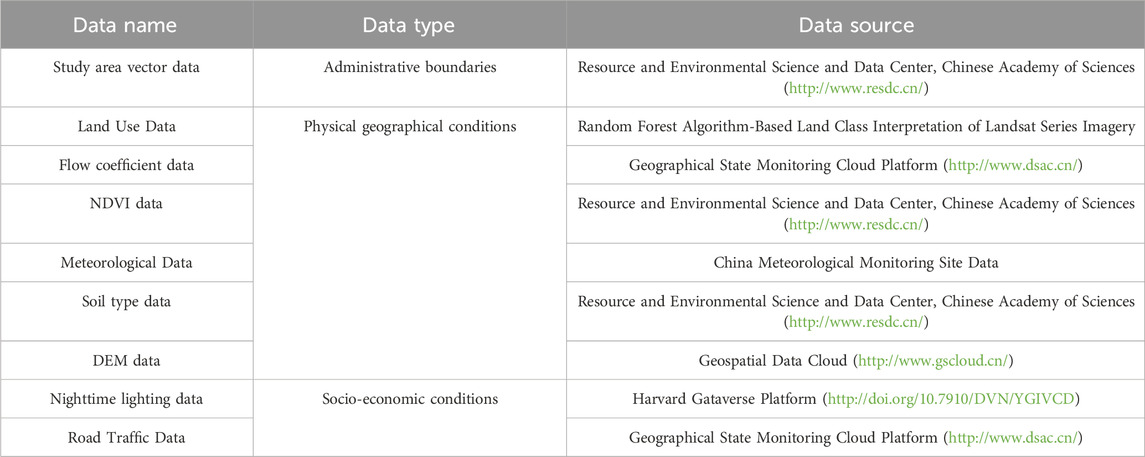
TABLE 1. Datasets used in this study.
The effectiveness of the index system is crucial for identifying ecological source areas. Due to varying interpretations of ecological security and the different environmental safety issues faced by each region, the selection of indicators differs based on the actual conditions of the research areas (Peng, et al., 2017). In this study, ecological importance was analyzed based on biodiversity service values, water resource security, soil conservation (Zhang, et al., 2022b), and the intrinsic significance of ecological land within the region (Yang, et al., 2013). A multi-factor comprehensive assessment was utilized to select “ecological source points.”
Drawing from Xie et al.'s equivalent factor method (2015) for the assessment of biodiversity service functions in the evaluation of ecosystem service values, the equivalent values of biodiversity service for various land classes were obtained, as shown in Table 2.
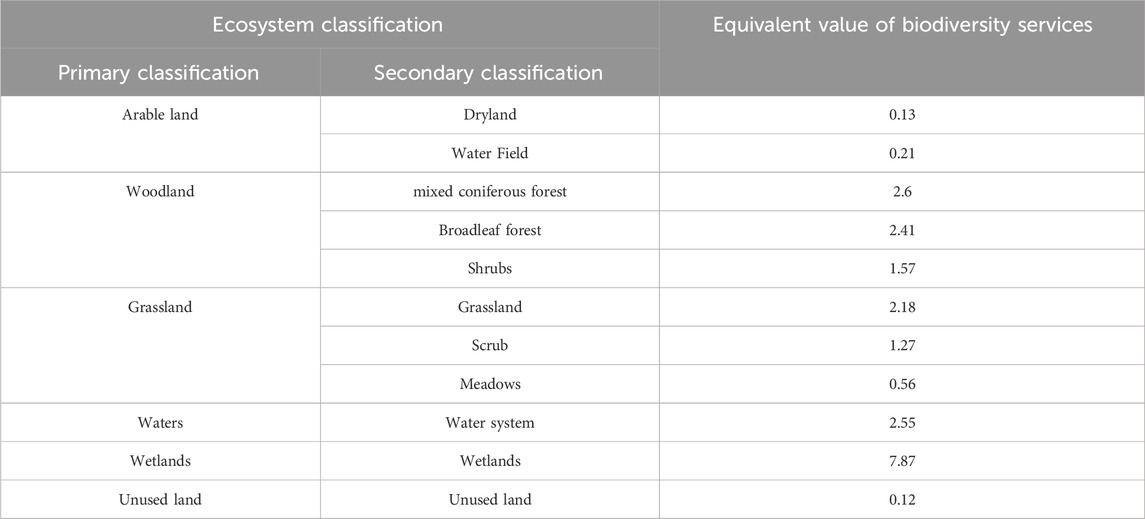
TABLE 2. Biodiversity service value equivalence factors for the Songnen Plain.
The Normalized Difference Vegetation Index (NDVI) exhibits a correlation and a proportional relationship with ecosystem service values (Xie et al., 2015). Using a formula that adjusts the biodiversity service equivalents of different land use types based on the NDVI, it is possible to compensate for the subjective drawbacks of the equivalent factor method. The calculation formula is as follows:
Where DL represents the adjusted biodiversity service equivalent of raster i; NDVIi denotes the annual mean NDVI value of raster i; NDVIt signifies the mean NDVI value of land use type t corresponding to raster i; and DL0 represents the biodiversity service value equivalent of land use type t corresponding to raster i.
Based on existing researches (Xiang, et al., 2011; Wei, et al., 2022b) and the actual hydrological conditions of the study area, a reasonable index system has been constructed, as shown in Table 3.
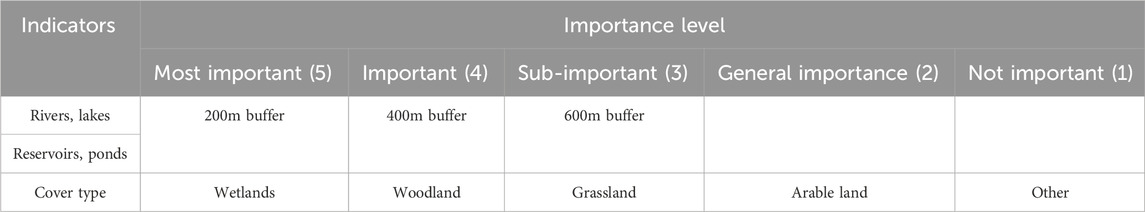
TABLE 3. Songnen plain water security evaluation index system.
Soil conservation reflects the level of regional erosion control and the maintenance of ecological security. An assessment of the study area’s soil conservation capacity is conducted by utilizing a modified Revised universal Soil Loss Equation (RUSLE model) (Zhang, et al., 2017). The calculation formula is as follows:
Where A is the predicted soil retention, A0 is the potential soil erosion, A1 is the soil retention, R is the rainfall erosion factor; K is the soil erodibility factor; L is the slope length factor; S is the slope factor; C is the vegetation cover factor; and P is the soil retention measure factor.
1 C factor reflects the intervention of vegetation and management measures on soil erosion, primarily comprising both the natural ecosystem and human activities. Meanwhile, P denotes the ratio of soil erosion, with the values for C and P in the study area established based on the existing researches (Zhang, et al., 2016; Chen, et al., 2017; Tian, et al., 2021), as outlined in Table 4.
2 K factor represents the soil erodibility, which primarily is used to analyze the degree of erosion for different types of soil. The values for K are adopted from the research of Shi et al. (2019). DEM (Digital Elevation Model) data is used to extract terrain factors L and S. The calculation formula for the LS (length-slope) factor is based on the method proposed by Yang and collaborators (Yang, et al., 2006).

TABLE 4. C and p values for different land use types.
Where θ is the slope value, λ is the slope length, and m is the slope length index.
3 Rainfall is the primary driving factor leading to soil erosion, which is calculated with the following formula:
Where Pa is the average monthly rainfall (mm).
The ecological patches for meeting human demands for ecosystem service needs represent the potential for human ecological demand (Wolff, et al., 2015; Tian, et al., 2019). Nighttime light Intensity is a good representation of the intensity and range of human activities (Chen, et al., 2021). Referring to the research of Zhang, C. X. and others (Zhang, et al., 2022a), the demand aggregation intensity for different ecological lands is computed with the kernel density analysis method. The calculation formula is as follows:
Where: Ri is the ecological demand value of raster i; Pi is the kernel density value of raster i; Di is the shortest distance between raster i and the adjacent demand.
The Minimum Cumulative Resistance model, also known as the MCR model (Tian, et al., 2019), refers to the total resistance that a species overcomes from a ‘source’ area through various resistance units to reach its destination (Dai, et al., 2021). Primarily used in ecological studies, it is now a key research model in the study of ecological security patterns (Wei, et al., 2022a).
The formula for MCR is as follows:
Where MCR is the minimum cumulative resistance value, f is the value of the minimum resistance of a grid as a function of the distance to any other grid, Dij can be regarded as the actual distance of species from grid j to grid i, and Ri represents the resistance coefficient of grid i to species movement.
The ecological resistances are categorized into different respective levels and assigned specific numerical values. The Analytic Hierarchy Process (AHP) is employed to calculate the appropriate weight values for each ecological resistance factor. The final consistency test for these weights resulted in a consistency ratio of CR = 0.061, passing the consistency test (Table 5).

TABLE 5. Rankings and weights of ecological resistance factors in the Songnen Plain.
The Circuit Theory Connectivity Model treats landscapes as conductive surfaces and species as charges moving randomly in a circuit. Employing graph theory, It categorizes landscape types beneficial for species migration and diffusion as low resistance, while hindering landscape types are viewed as high resistance (Song and Qin, 2016; Zhang, et al., 2022b). Figure 3 illustrates a landscape circuit being composed of grids. White grids represent species habitats or protected area patches with zero resistance values, black grids indicate obstructing the species through barrier patches with infinite resistance values, and grey grids denote landscape types with finite resistance values (McRae et al., 2012). Ecological source sites are treated as zero-resistance grids, with each grid representing a node. When the entire ecological environment is viewed as an electrical circuit network, Kirchhoff’s circuit laws are used to calculate current and voltage (Song and Qin, 2016).

FIGURE 3. Raster landscape circuit representation.
Circuit theory is effective in assessing the least-cost paths to determine ecological corridors (Lin, et al., 2016; Wang, et al., 2023). Initially, using the Linkage Pathway, it computes the cost-weighted distances of each grid unit in the ecological resistance surface to the source sites by identifying the minimum cumulative movement path between these source sites. Ultimately, this minimum-cost distance path is considered an ecological corridor (Wei, et al., 2022b). Ecological bottlenecks represent areas with the highest cumulative current values, which are identified by assigning 1A current to individual pixels while grounding other nodes and iteratively computing resistance values in the circuit (Li, et al., 2021). Barrier areas enhance connectivity between ecological source sites, and cause resistance values to decrease as these barrier zones experience notable ecological restoration (Song and Qin, 2016). Analyzing the obstacles in corridors determines the hindrances animals face in interregional migration processes.
The areas of ecological source are important in maintaining the stability and integrity of ecosystems and meeting human ecological needs, among other aspects (Chen, et al., 2016). The selection of ecological source areas involves in not only the regional intrinsic ecological environment but also the distributions of human activities impacts on the strength and weakness of ecological demand functions in area region (Zhang, et al., 2022b). In this study, a coupled analysis of natural and socioeconomic factors was conducted, using an assessment of the ecosystem importance and residential ecological needs to comprehensively identify the source areas (Zhang, et al., 2021).
Ecological restoration zoning is a prerequisite for conducting ecological restoration (Gao and Yang, 2015). Ecological restoration is a long-term, dynamic process where changes in certain elements of the ecological security pattern can lead to significant alterations (Peng, et al., 2018a).
Where: EPS represents the Ecological Restoration Zoning Index; R stands for the value of grid i in the ecological resistance surface; Rmin is the minimum value of the ecological resistance surface; Rmax is the maximum value of the ecological resistance surface; Gi denotes the improvement coefficient value for grid i in the improvement area; Gmin is the minimum improvement coefficient value in the improvement area; Gmax is the maximum improvement coefficient value in the improvement area; and n stands for the number of years.
The importance of the ecosystem is based on the level of ecological services provided within a region. The selection of patches with the highest service values is crucial for accurately identifying the ecological source areas by evaluating the ecological service values of various patches (Peng, et al., 2018a). Considering the ecological quality characteristics of the Songnen Plain in different periods, the assessment was conducted based on factors, such as biodiversity, water resource security, soil conservation, and residential ecological needs. The land classification in our study region was categorized into levels of “the most important”, important, moderately important, generally important, and unimportant by using the natural break method and represented using the numeric scale of 5, 4, 3, 2, and 1 (Figure 4).
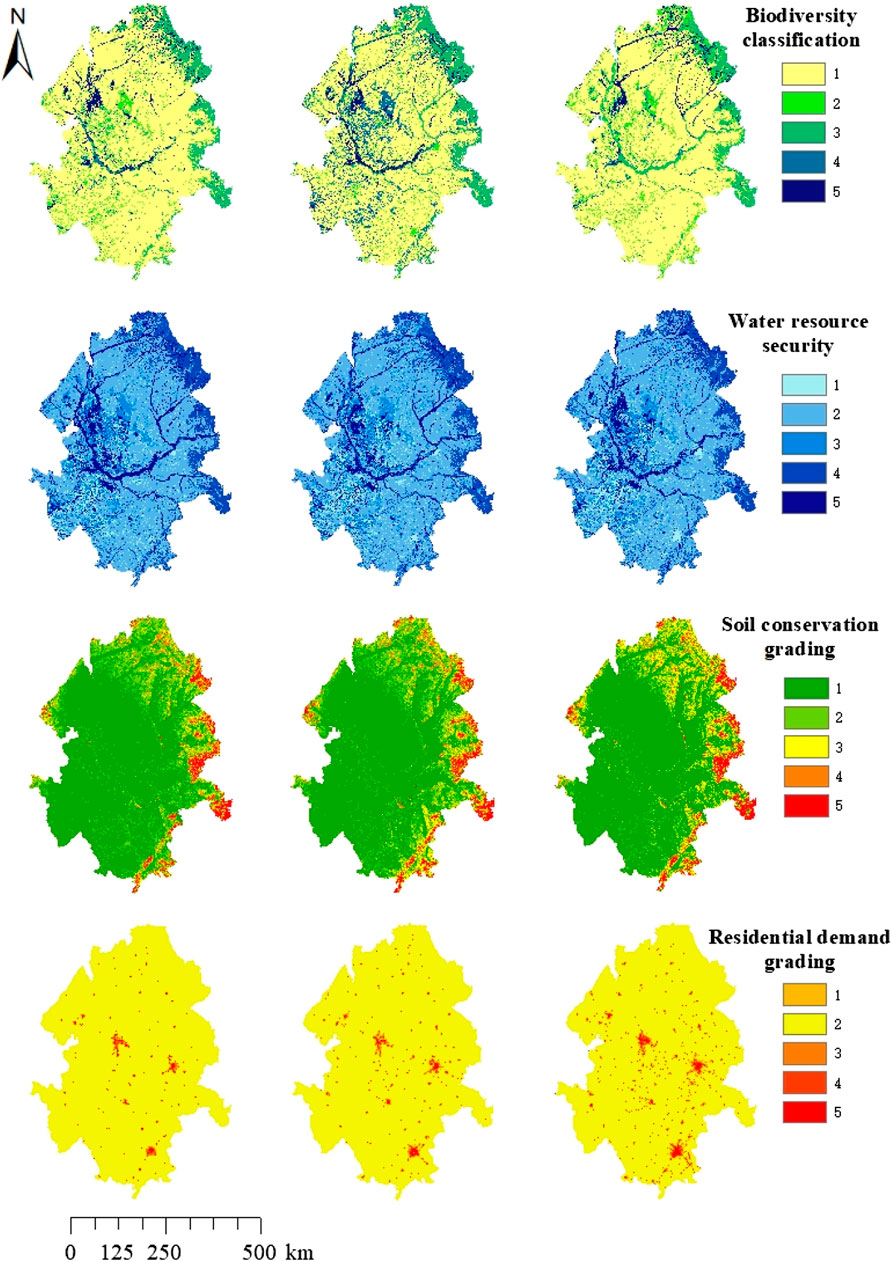
FIGURE 4. Importance’s of ecosystem services.
The areas with “the most important”, and “important” for biodiversity protection were 13,464.56 km2, 16,041.40 km2, and 15,237.04 km2 in 2000, 2010, and 2020, respectively. These were concentrated in the northeast river confluence region and in the western nature reserves, which are characterized by abundant forest cover from the Xiao Hinggan Mountains with higher-quality natural environments. The western region serves as a habitat for species with higher biodiversity service values. After 2010, the central region became into an area with high biodiversity service values due to flooding event in 2000, which then degraded the ecological service values near the Nen River.
In terms of water resource safety, the arears of “the most important” and “important” were 29,079.68 km2, 55,578.80 km2, and 54,693.12 km2 in 2000, 2010, and 2020, respectively. These areas are primarily located in the central and northeastern portions of the study area, including wetlands, forests, lakes, rivers, and surrounding habitat patches. Key river streams, such as the Nen River, Nemor River, Hulan River, and Songhua River were notable, which are surrounded by forests and marshlands. The most important water resource protection areas demonstrated a decreasing trend from 2000 to 2020 due to water flow interruptions in various rivers and deforestation in the Xiao Hinggan Mountains because of reduced water retention and increased irrigation demands.
The total areas of “the most important” and “important” soil conservation accounted for 2.27%, 2.89%, and 3.99% in 2000, 2010 and 2020, respectively. They are located in the Xiao Hinggan Mountains in the east the Changbai Mountains, the western Da Hinggan Mountains residual ranges, and the Songliao Divide. These areas are fragmented due to the prevalence of swamp soil, meadow soil, and wind-blown sand soil in the Songnen Plain. They experience erosion and dissolution and are characterized with thin layers, coarse quality, severe soil sandification, and salinization. The elevated terrains and substantial rainfall together lead to soil erosion. Predominant forested lands are crucial for water retention and soil conservation.
Areas of “the most important” and “important” for ecological demands mainly exist in urban cores, such as Songyuan, Siping, Changchun, and Harbin. These highly populated areas result in an increasing ecological demand as the regional economic growth, as well as urban constructions and transport links from the city centre to surrounding regions.
The weigh values of 0.3, 0.3, 0.2, and 0.2 are assigned to the biodiversity service value, water resource security, soil conservation, and resident ecological demand, respectively, based on a previous study (Ye, et al., 2018). A comprehensive score was achieved by weight-averaging these four factors. The reclassified comprehensive assessment was categorized into five levels by using the natural break method. Based on existing researches (Chen, et al., 2016; Cai, et al., 2023) and considering the actual conditions of the area, eco-sites being larger than 20 km2 were then selected as the most crucial or important ecological areas to establish the ecosystem source sites for the years 2000, 2010, and 2020 (Figure 5).
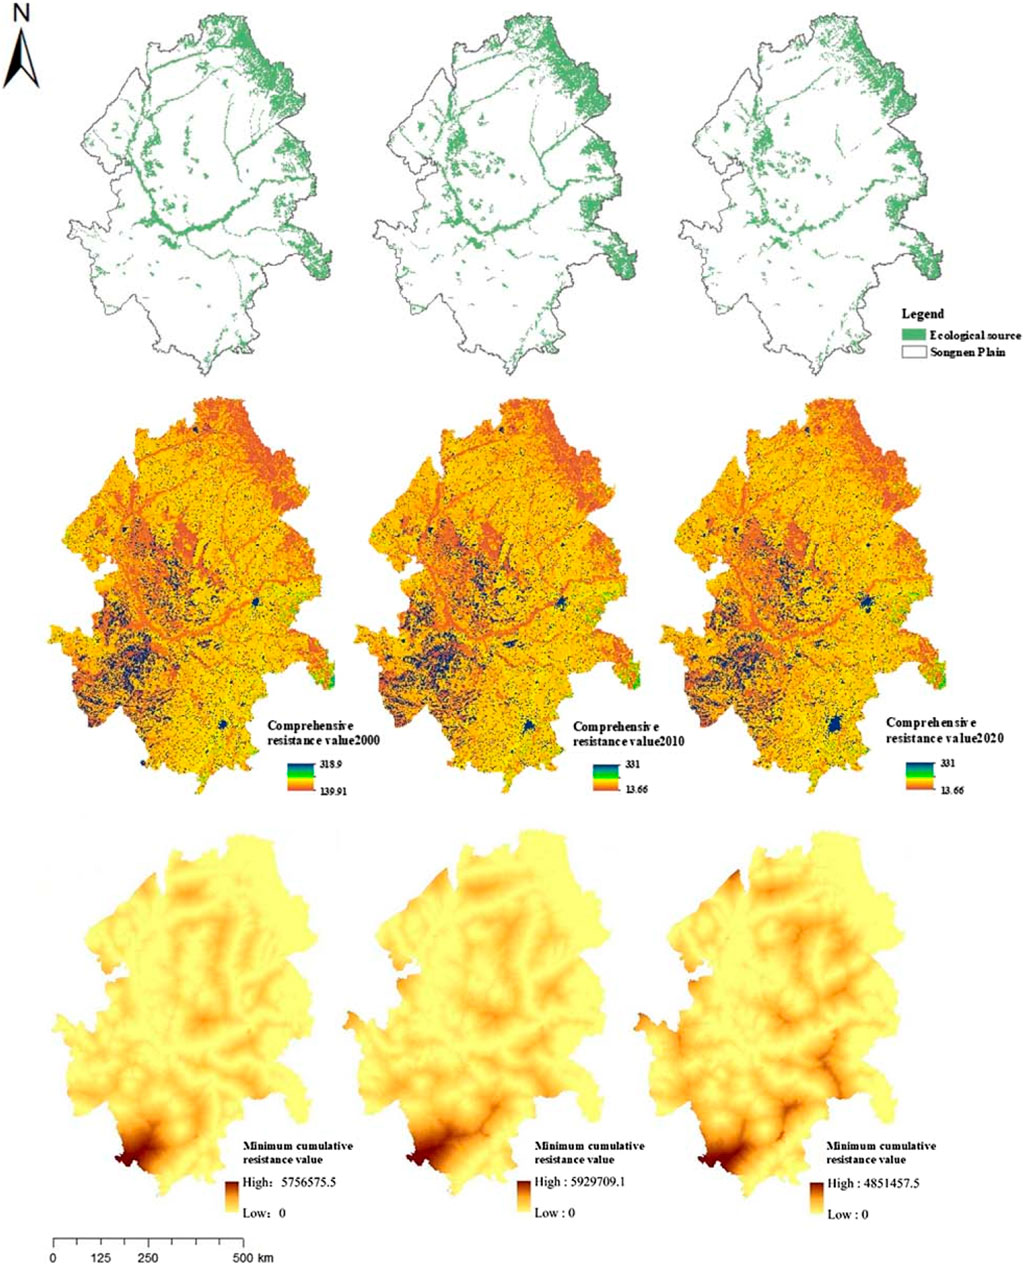
FIGURE 5. Ecological sources and resistance surfaces.
The ecosystem source sites are primarily located near rivers, lakes, natural reserves, and in the areas with higher vegetation cover, dense forests, water bodies, wetlands, and a small amount of farmland and grassland. The numbers and areas of these sites showed a declining trend from 2000 to 2010, then by an increasing trend from 2010 to 2020. During the period from 2000 to 2010, The expansions of urban and transportation areas from 2000 to 2010 resulted in a decline in the numbers and areas of eco-sites. However, the counter-measurements to balance economic development and ecological conservation between 2010 and 2020 led to an increase in the numbers and areas of eco-sites.
The individual resistance factor derived from the assessments resulted in six single-factor resistance surfaces. These surfaces were then spatially combined according to their respective weights to produce the composite resistance surface. Areas with lower composite resistance values were situated around lakes, rivers, important wetlands, and high-altitude forested regions. In contrast, regions with higher resistance values were primarily associated with saline-alkali lands, urban and rural development zones, and primary transportation areas.
The MCR model was employed to calculate the minimum cumulative cost distance from each grid within the eco-sites to the nearest cost grid unit, generating the ecological resistance surface.
The distribution of ecological resistance values is normally centred on the eco-sites, gradually increasing as they extended outward, and showing a considerable difference between high and low-value areas (Li, et al., 2021). The southwestern region was highlighted as a high-resistance area in 2000, while the central-southern regions emerged as areas with relatively high resistance in 2010 and 2020. Overall, the high-value ecological resistance areas are transformed from a dispersed layout in 2000 to a concentrated contiguous pattern in 2020, mainly concentrated around areas such as Shuangliao, Siping, and Changchun at the convergence of agricultural production and urban development. These densely populated regions with frequent activity exhibited weak ecological protections and resistances to species migration in the surrounding areas. The identified high resistance areas in the Minimum Cumulative Resistance of Eco-sites aligned with previous studies, particularly in the Changchun and Siping regions (Wang, et al., 2023). Low-resistance areas were more widespread, mainly located in the northeastern and central scattered regions of the study region with forests, farmland, and sporadically distributed grasslands. They are usually characterized by higher elevation and better ecological environments with relatively less interference from human activities, ensuring more stable ecosystem service functionality.
The ecological corridor serves as a crucial pathway for species migration and information exchange between ecological source sites, offering lower resistance during migration. This region facilitates species migration due to its favourable ecological quality. The resistance parameters in an electrical circuit are regarded as inversely proportional to habitat quality (Peng, et al., 2018b). Pairing each period ecological source sites results in a distribution map of ecological corridors (Figure 6). Simulating ecological flow at a spatial scale, the electric current path follows the direction of ecological flow by iteratively calculating the current input for different ecological source sites, and constructing an ecological network current map (Figure 6).
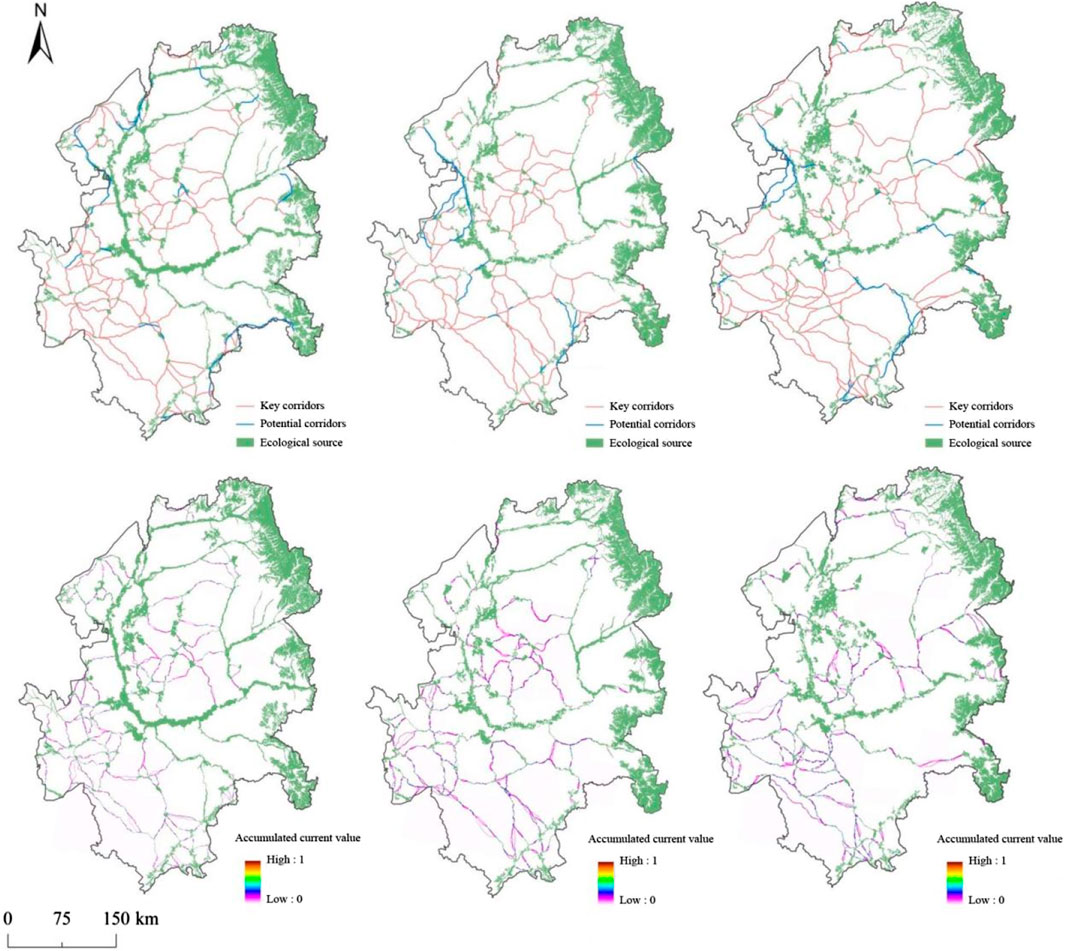
FIGURE 6. Ecological corridor distributions and ecological network current diagram.
There were 153 key ecological corridors with a total length of 5262.19 km and 25 potential corridors with a total length of 2567.99 km in 2000. The corresponding numbers changed to 120 key ecological corridors with a total length of 5455.13 km and 22 potential corridors totaling 2310.01 km in 2010, and 134 key ecological corridors with a total length of 6235.11 km and 25 potential corridors with a total length of 2240.53 km in 2020. Overall, the quantity of ecological corridors in the study area shows a decreasing trend from 2000 to 2010 and then an increasing trend from 2010 to 2020. Accelerated urban development processes have caused some disruptions in connectivity between ecological source sites, posing a threat to regional ecological security. However, ecological governance measures from 2010 to 2020 showed a recover of the numbers of ecological corridors.
The moderate-length key corridors range from 20–70 km throughout the study period in the region, mainly concentrated in the central-western and southwestern areas. The numbers of these corridors decreased from 77 in 2000 to 51 in 2010 and then increased to 64 in 2020, showing consistent with the overall trend of ecological corridor changes. The short-length key corridors under 20 km displayed a decreasing trend and were sparsely distributed in the study area. Long-length key corridors over 70 km exhibited an increasing trend, primarily located in the southern part of the research area. The growing number indicated that these distant corridors are connected with source sites, enhancing the complexity of species migration and the time needed. Corridors being greater than 70 km are primarily connected the western and southeastern areas, traversing from the Jilin to Heilongjiang provinces, overlapping with key corridors and upholding the overall ecological security layout.
Confluence regions are mainly situated in the southwest and central-east areas, showing better connectivity, while fewer confluence points are observed in the southern area, indicating relatively poorer landscape connectivity. These regions mainly comprise of farmland, forests, and grasslands. It has significant impact on landscape connectivity so that a hot-spot for conservation efforts in the future. In 2000, There were 232 confluence points in the study area in 2000, decreasing to 202 in 2010, then rising to 229 in 2020, mirroring the temporal variability of the corridors, i.e., a decline trend followed by an increasing trend.
The obstacle area is a crucial region, affecting animal migration and ecological recovery. Restoring and improving these areas can enhance landscape connectivity between ecological source sites and reduce ecological resistance for animals during the migration process. The Barrier Mapper tool is used to identify obstacle areas within existing ecological corridors, and to determine the restoration significance levels of ecological obstacle areas based on spatial distribution characteristics and improvement coefficients (Figure 7).
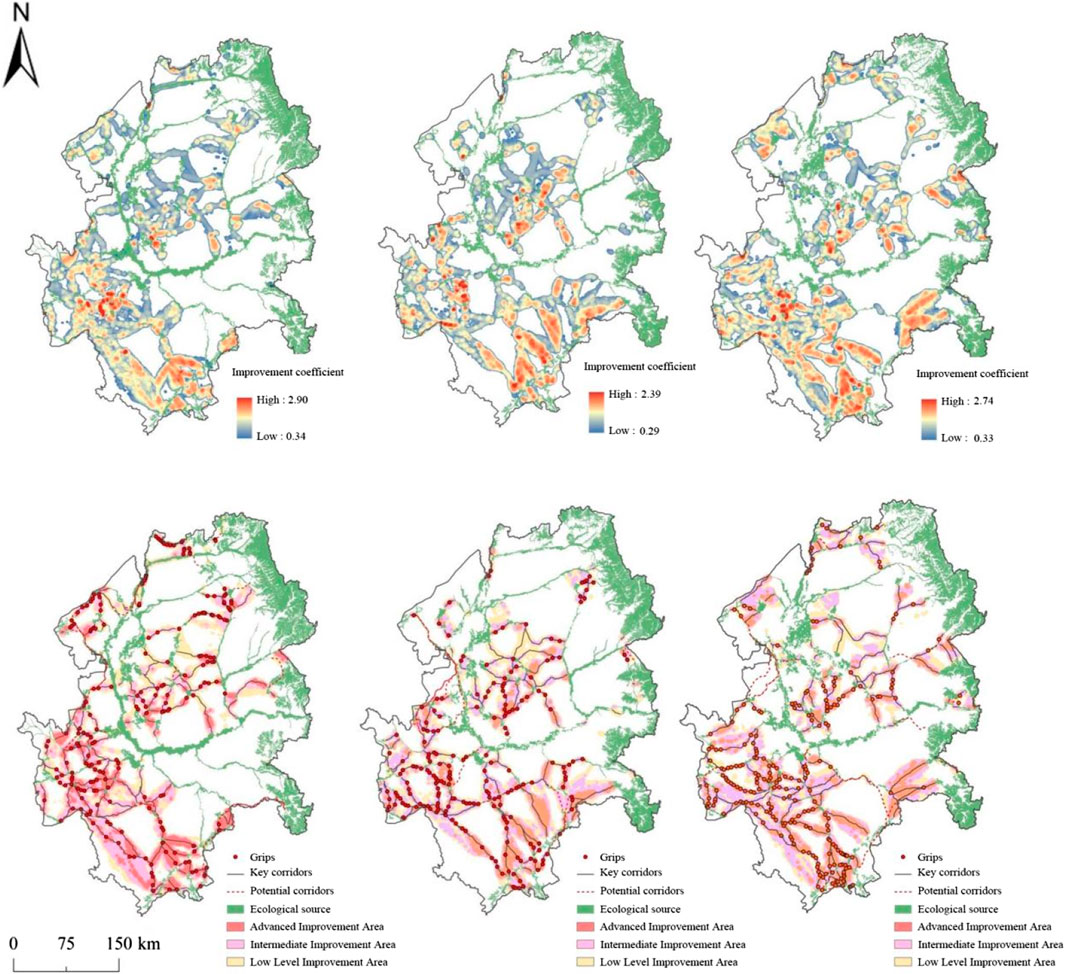
FIGURE 7. Importance levels of ecological barrier area restoration.
The natural breakpoint method was used to categorize the obstacle areas to define the range of improvement zones into Advanced Improvement Areas, Intermediate Improvement Areas, and Low-Level Improvement Areas. The Advanced Improvement Area represents the focal restoration zones within or around source sites in the research area. The Intermediate Improvement Area links urban centres to suburban and rural areas, aiding resource connectivity between regions. Meanwhile, the Low-Level Improvement Area acts as a transitional zone between the remaining ecological land and ecological source areas, contributing to the protection of the surroundings of these source sites.
The relationships among various ecological elements from 2000, 2010, and 2020 show: 1) an initial decline trend and then an increasing trend of the areas and quantities of ecological source sites; 2) a growth rate of 5.67% in the area of high ecological resistance from scattered distribution to a concentrated, contiguous pattern; 3) a fluctuation in the numbers of ecological corridors, initially decreasing and then increasing in a branching patterns; 4) a decrease and a subsequent increase in the number of nodal points, shifting from scattered to a denser distribution; and 5) an overall decreasing and then increasing trend in the total area of improvement zones. Notably, the area of the Advanced Improvement Area is on the rise and becomes into more concentrated after an initial dispersion.
The ecological source sites play a crucial role in the connectivity of the regional ecological network. The natural breakpoint method was used to classify the ecological source sites into general, moderate, and important ecological source areas depending on their importance in connecting the ecological network in the Songnen Plain for 2000, 2010, and 2020. Six groups of ecological governance scopes were delineated as shown in Figures 8, 9.
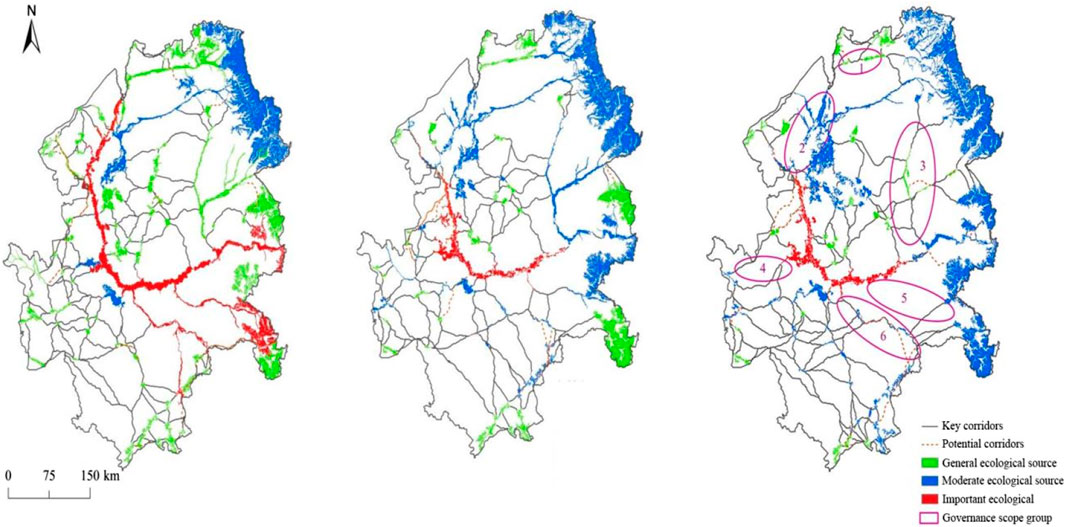
FIGURE 8. Ecological source classifications.
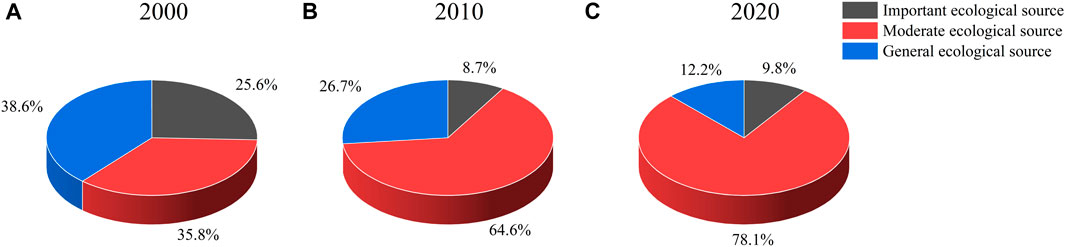
FIGURE 9. Proportion of important ecological source areas.
The total areas of important ecological source sites were 8743.92 km2, 2629.28 km2, and 2964.76 km2 in 2000, 2010, and 2020, respectively. These important ecological source sites were primarily located in the central region of the Songnen Plain, near the Nen River basin. The expansion of ecological source site areas resulted in from a rise in floodwater levels in most wetlands and others being submerged in 2000. The total areas of moderate ecological source sites were 12227.56 km2, 19409.12 km2, and 23694.00 km2 in 2000, 2010, and 2020, respectively. It is primarily situated in the eastern regions of the Songnen Plain. The moderate ecological source sites in the Xiao Hinggan Mountains residual area had a larger area and density. The areas of moderate ecological source sites near the Zhalong Wetland increased with time, contributing to landscape connectivity.
The general ecological source sites, with areas of 13197.08 km2, 8017.88 km2, and 3687.92 km2 in 2000, 2010, and 2020, respectively, were dispersed across the central, southeast, and northwest areas of the Songnen Plain, gradually evolving toward fragmentation. Although the contribution of general ecological source sites to the overall landscape connectivity of the Songnen Plain is relatively lower, they serve as vital foundation to facilitate the exchange of regional ecological elements.
The delineated governance scope groups highlighted the gradual disappearance of high-importance ecological source sites due to changes in the ecological environment and human interference and its potential impacts on the sustainable development of ecological security. The first scope group in the Nen River basin emphasized the protection and restoration of wetlands along the river, including counter-measurements like environmental isolation zones, water quality monitoring, afforestation, and water treatment measures. The second scope group is located in the Zhalong National Nature Reserve, focusing on wetland protection, such as the classifications of ecological source sites, inclusion of wetlands in ecological protection redlines, and prohibition of pollution facilities. The third scope group in the Hulan River section aims to improve water conditions by raising irrigation engineering standards, expanding water sources, enhancing water scheduling, and constructing small-scale water storage facilities to increase habitat environments. The fourth scope group in the Tao’er River basin is planned to better allocate water resources, to reduce water usage, and to promote water-saving agriculture. The fifth scope group in the Lalin River basin concentrates on new ecological corridor belts, encompassing green corridor belts and water quality improvement projects. Finally, the sixth scope group in the Songhua River basin aims to maintain the integrity of the ecological environment by controlling construction activities, enhancing greening levels, and widening corridor widths.
The ecological resistance areas, and barrier zones, regions other than the ecological source areas were categorized into three levels by using the natural breakpoint method and their ecological source areas. The zoning results are the ecological restoration area, ecological control area, and ecological improvement area (Figure 10).
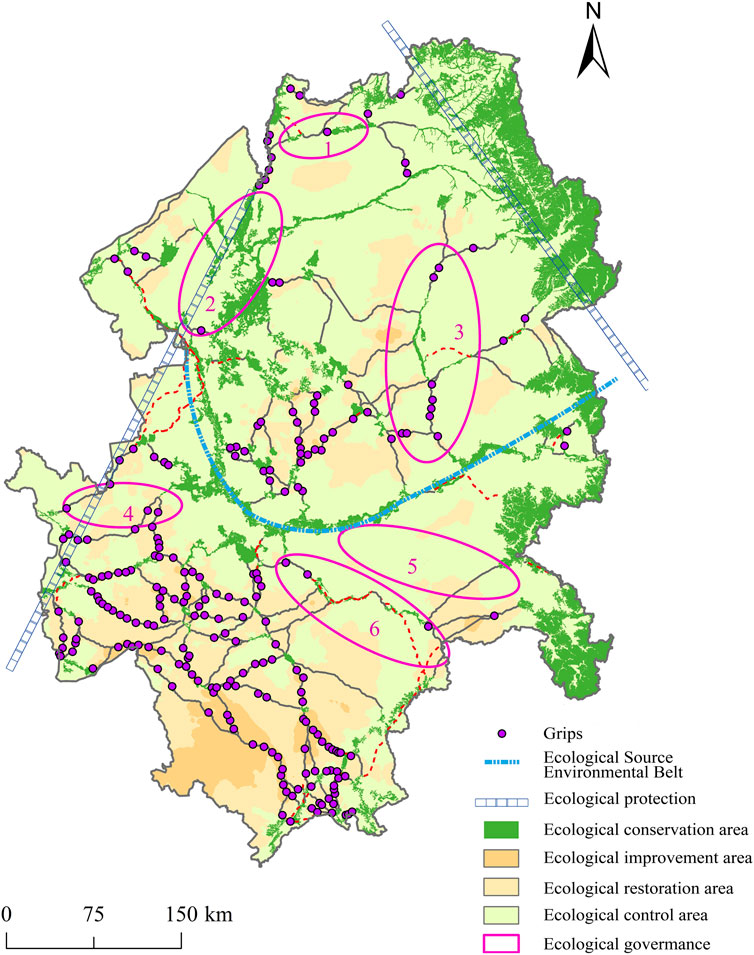
FIGURE 10. Ecological restoration zonings.
The various levels of ecological restoration sub-regions were established by utility attributes, such as ecological source sites, ecological corridors, nodal points, and the distribution of ecological governance scope groups. This led to proposing an “Ecological Security Pattern of One Belt, Two Screens, Four Zones, Six Groups, and Multiple Nodes.” The “One Belt” refers to the Nen River ecological source area belt. The “Two Screens” encompass the forest water conservation screen in the northeast and the windbreak and sand fixation ecological screen in the southwest. The “Four Zones” include conservation, enhancement, restoration, and control functions. The “Six Groups” primarily focus on ecological corridors and water systems, combined with corridor nodes to ensure the stability of the ecological pattern.
Compared to Ju L.F. and others who constructed resistance surfaces from the perspective of landscape structure in their study of Ganzi Tibetan Autonomous Prefecture (Ju, et al., 2023), and Chen Z.J. and others who assessed the spatial heterogeneity of He Xi Corridor Tianzhu County based on single-period data (Chen, et al., 2023b), this study takes a different approach. Ecological restoration is a long-term dynamic process, so we choose to grade multiple resistance factors to construct resistance surfaces. We analyze the ecological patterns across multiple periods, allowing for the delineation of specific recommendations for local ecological governance. This study proposed an optimization of the “One Belt, Two Screens, Four Zones, Six Groups, and Multiple Nodes” ecological security pattern based on numerous existing studies in the literature on the ecological security patterns (Wei, et al., 2022b; Wang, et al., 2022; Liu, et al., 2023) and the natural conditions and relevant policies in the Songnen Plain research area.
1) One Belt refers to the ecological source area belt of the Nen River, which serves as a hub for ecological exchanges between the north and south of the study region. Protecting this belt area requires monitoring sewage discharge outlets for water quality safety. Measurements to control sewage discharge levels and regular monitoring of water quality in the basin are essential. An ecological protection buffer zone near water source areas is also crucial. In addition, combating desertification problems might involve in creating sand-fixation forests on both sides of the basin. It demands collaborative inter-provincial governance between Jilin and Heilongjiang to strengthen the collective capacity for conservation and protection.
2) Two Screens involve the forest belt in the northeast, primarily on the ecological source area in the northeast forest region. It plays a crucial role in water conservation and maintaining biodiversity., Natural Forest resources need nurturing and degraded forests must be restored to protect the habitat in the Lesser Khingan Range. It is imperative to strengthen the forest ecosystem, to enhance water conservation, and to establish a network for protecting biodiversity. The other screen refers to the windbreak and sand fixation ecological screen in the southwest to protect the ecological barriers in the Mohe and Zhalong national nature reserves. This screen should address land salinization and desertification issues, expedite wetland degradation control, implement ecological water diversion, and enhance regional ecological stability.
3) Four Zones refers to conservation, enhancement, restoration, and control functions. The ecological conservation zone is where the ecological source is located and needs further improvement. Areas outside the conservation zone should be designated with ecological red-lines to restrict polluting projects and facilities, banning human activities and focusing on natural recovery. The development should be limited in the ecological enhancement zone to protect environmental and to promote green economy industries to tackle water pollution problems. The ecological restoration zone is a key for regional ecological engineering to address severe salt-alkali areas, such as implementing a “reducing alkali for rice cultivation” project. The ecological control zone is usually arable land and then extensive development of ecological agriculture is required to focus on the protection and management of black soil in the main farmland areas.
4) Due to the deterioration of riverine environments and discontinuity, the fragmentation of ecological source areas, and the transformation of original ecological source areas into ecological corridors, the ecological governance scope groups largely revolve around multiple water systems and ecological corridors. They offer significant ecosystem service functions. For managing the environmental flow disruption, river-lake connectivity projects should be started. Establishment of wetland parks around the perimeter is essential to address the shrinking source areas and to improve the ecological connectivity of the surrounding area. Treating areas where source areas have transformed into corridors involves in implementing ecological corridor management projects, establishing ecological buffer zones around the corridor periphery, and expanding the corridor width to enhance its capacity for regional connectivity. It could involve in establishing green protective belts on either side of the roads to address on how transportation infrastructure obstructs ecological corridors.
5) The higher the number of junction points on the ecological corridor, the greater the disruption to the corridor connectivity. The southern ecological junction points in the study region are quite dense, mainly in the western area of Jilin Province. This region is highly affected by desertification and salinization, making a concentrated and obstructive distribution. It could alleviate the issue with implementation of ecological governance measurements and increase of the usability of ecological lands near the junction areas. The southeastern junction areas are mainly in the central part of Jilin Province, where dense road networks and numerous roads intersect ecological corridors, resulting in an increased junction point. It could significantly improve corridor connectivity by introducing green protection belts in areas with roads crossing the junction points. Junction areas in the central part, near wetlands and water bodies, could restore the affected junction areas by managing river flow disruptions and increasing wetland areas, consequently, restoring the connectivity of the central ecological network.
Through the collection and analysis of land use, environmental, and basic geographical data, this study revealed the spatiotemporal changes in land use in the Songnen Plain from 2000 to 2020., An ecological security pattern for the Songnen Plain was established and optimized by using the multi-criteria evaluation method (MCR) model and circuit theory. This approach demonstrates a degree of innovation and reference value. However, there are some limitations that can be improved with further investigations. A few potential future research are:
1) Selection of patch areas as ecological source areas referenced to other geographically related research findings, which are valuable as references. Nevertheless, it overlooked the suitability of the ecological environment in the research area under objective factors. Existing studies (Ye, et al., 2018; Cai, et al., 2023) have discussed these suitable thresholds and made related recommendations, but a comprehensive theoretical pattern has yet to be established.
2) While considering factors of resistance surfaces, the paper accounted for social factors beyond natural elements in constructing resistance surfaces, which is reasonable. However, the assignment of resistance values for each influencing factor is currently based on expert scoring. Although the selected resistance factors are representative and realistic for the study area, they still contain subjectivity due to uncertainty of these scores.
3) This study utilizes nighttime light data to depict the ecological demands of residential areas, providing objectivity and practicality. However, there are limitations in using nighttime light data to capture rural activities. In the future, these limitations could be addressed by integrating data from multiple sources, including satellite imagery, social media data, mobile signal data, and local statistical data. By incorporating these diverse datasets, we can overcome the shortcomings of nighttime light data in illustrating human activities in rural areas. Furthermore, the use of visible light and infrared technologies to analyze rural light sources and agricultural activities can offer more detailed insights into human activities in rural regions. This integrated approach will contribute to a more nuanced and accurate understanding of rural dynamics, beyond what can be captured by nighttime light data alone.
4) We also aspire to enhance the forward-looking dimension of our research by incorporating predictive models to forecast future patterns. This proactive approach will advance our study and contribute to its overall depth. Exploring ecological patterns from multiple scales, including a microscopic perspective on soil types, will be a focal point for constructing security patterns in the future. Subsequently, we will implement practical and feasible restoration measures to assess the viability and effectiveness of the proposed strategies. This comprehensive methodology ensures that our research not only deepens the understanding of current issues but also establishes a foundation for forward-looking and impactful ecological studies.
The comprehensive evaluation method based on the assessment of the importance of the ecosystem and the residential ecological demands were used in this study to identify the ecological source areas in the Sognen Plain. The least cumulative resistance model was used to build the ecological resistance surfaces and utilizes relevant methods from circuit theory to discern ecological corridors, nodal points, and barriers. It proposed several spatial pattern optimization strategies for the Songnen Plain. The conclusions were drawn as follows:
1) There was a decreasing trend from 2000 to 2010 followed by an increasing trend from 2010 to 2020 for the areas of ecological source regions. These areas were primarily located near rivers, lakes, natural reserves, and regions with high vegetation coverage. The resistance values of the ecological resistance surfaces extended gradually from the ecological source to outward surrounding regions and increased over time. During the 2000–2020 period, the spatial distributions of high-resistance ecological zones varied from initially being scattered to gradually becoming concentrated and contiguous.
2) From 2000 to 2020, The number of ecological corridors and nodal points exhibited a similar temporal variability, i.e., a decreasing trend from 2000 to 2010 and an increasing trend from 2010 to 2020. It indicates a certain degree of fluctuation in the connectivity of the landscape in the region over the research period. The total number of critical ecological corridors has decreased by 19 but an increase in total length by 969.92 km. The potential ecological corridors remained unchanged in number and experienced an increase in total length by 327.46 km. These corridors predominantly pass through forested areas, water bodies, and areas with lower internal resistance in towns. The nodal points have decreased from 232 in 2000 to 209 in 2010, then rose again to 229 in 2020. The areas of barriers showed a decreasing trend initially but increased later, reaching 75,529.72 km2 by 2020.
3) The tailored protective measurements were established based on the constructed ecological security patterns in various regions. Multiple spatial pattern optimization strategies were proposed, which include but are not limited to: the Nen River Ecological Source Area Belt serves as an essential ecological protection and regulatory belt for the region; the Xiao Hinggan Mountains Ecological Barrier and the southwestern wind-resistant and sand-fixing ecological screen should maintain the stability of regional ecological functions; the ecological function grading zone, ecological source, corridor protection group, and regional ecological nodal points are fragmented regions caused by social factors. These optimization strategies provide a reference for regional sustainable development and planning control for the Songnen Plain.
The original contributions presented in the study are included in the article/Supplementary material, further inquiries can be directed to the corresponding author.
JL: Conceptualization, Data curation, Writing–original draft. BC: Conceptualization, Methodology, Writing–review and editing. MZ: Data curation, Methodology, Writing–review and editing. DW: Project administration, Supervision, Writing–review and editing. XL: Software, Supervision, Writing–review and editing.
The author(s) declare financial support was received for the research, authorship, and/or publication of this article. This work was supported by the Jilin Provincial Science and Technology Department Project (20230508029RC) and the Jilin Province Foreign Expert Project (L202322).
The authors declare that the research was conducted in the absence of any commercial or financial relationships that could be construed as a potential conflict of interest.
All claims expressed in this article are solely those of the authors and do not necessarily represent those of their affiliated organizations, or those of the publisher, the editors and the reviewers. Any product that may be evaluated in this article, or claim that may be made by its manufacturer, is not guaranteed or endorsed by the publisher.
Cai, L., Liang, J. L., Guo, Z. H., Ouyang, Y. R., Yang, M., and Dai, J. J. (2023). Evaluation of the coordination between marine ecological environment protection and marine economic development in China. Environ. Sci. Pollut. Res. 30 (11), 31524–31532. doi:10.1007/s11356-022-24376-9
Cetin, M., Adiguzel, F., Gungor, S., Kaya, E., and Sancar, M. C. (2019). Evaluation of thermal climatic region areas in terms of building density in urban management and planning for Burdur, Turkey. Air Qual. Atmos. Health 12 (9), 1103–1112. doi:10.1007/s11869-019-00727-3
Chen, L. D., Zhou, W. Q., Han, L. J., and Sun, R. H. (2016). Developing key technologies for establishiing ecological security patterns at the Beijing-Tianjin-Hebei urban megaregion. Acta Ecol. Sinca 36 (22), 7125–7129. doi:10.5846/stxb201610142085
Chen, X., Peng, J., Liu, Y. X., Yang, Y., and Li, G. C. (2017). Constructing ecological security patterns in Yunfu city based on the frame work of importance-sensitivity-connectivity. Geogr. Res. 36 (03), 471–484. doi:10.11821/dlyj201703006
Chen, X. Q., Kang, B. Y., Li, M. Y., Du, Z. B., Zhang, L., and Li, H. Y. (2023a). Identification of priority areas for territorial ecological conservation and restoration based on ecological networks: a case study of Tianjin City, 146. China: Ecological Indicators.
Chen, Z., Chen, H., Yang, M., Wang, X., Jiang, Y., and Zhang, W. (2023b). Heterogeneity and optimization of ecological security pattern on a mountain town: a case of Tianzhu County in the Hexi Corridor, China. Front. Environ. Sci. 10. doi:10.3389/fenvs.2022.1106379
Chen, Z. Q., Yu, B. L., Yang, C. S., Zhou, Y. Y., Yao, S. J., Qian, X. J., et al. (2021). An extended time series (2000-2018) of global NPP-VIIRS-like nighttime light data from a cross-sensor calibration. Earth Syst. Sci. Data 13 (3), 889–906. doi:10.5194/essd-13-889-2021
Dai, L., Liu, Y. B., and Luo, X. Y. (2021). Integrating the MCR and DOI models to construct an ecological security network for the urban agglomeration around Poyang Lake, China. Sci. Total Environ., 754. doi:10.1016/j.scitotenv.2020.141868
Fu, B. J., Liu, S. L., and Ma, K. M. (2001). The contents and methods of integrated ecosystem assessment(IEA). Acta Ecol. Sin. 11, 1885–1892. doi:10.3321/j.issn:1000-0933.2001.11.020
Gao, J. X., and Yang, Z. P. (2015). Restoration of ecological functions: goal and orientation of ecological restoration in China. J. Ecol. Rural Environ. 31 (01), 1–6. doi:10.3772/j.issn.1673-4831.2015.01.001
Ju, L., Liu, Y., Yang, J., Xiang, M., Xiang, Q., Hu, W., et al. (2023). Construction of nature reserves' ecological security pattern based on landscape ecological risk assessment: a case study of garze Tibetan autonomous prefecture, China. Sustainability 15 (11), 8707. doi:10.3390/su15118707
Kong, F. H., and Yin, H. W. (2008). Developing green space ecological network in Jinan City. Acta Ecol. Sin. (04), 1711–1719.
Lee, J. W., Noh, H. J., Lee, Y., Kwon, Y. S., Kim, C. H., and Yoo, J. C. (2014). Spatial patterns, ecological niches, and interspecific competition of avian brood parasites: inferring from a case study of Korea. Ecol. Evol. 4 (18), 3689–3702. doi:10.1002/ece3.1209
Li, B., Huang, F., Qin, L. J., Qi, H., and Sun, N. (2019). Spatio-temporal variations of carbon use efficiency in natural terrestrial ecosystems and the relationship with climatic factors in the Songnen Plain, China. Remote Sens. 11 (21), 2513. doi:10.3390/rs11212513
Li, T., Gong, Y. B., Ge, J. Z., Qi, Z. X., and Xie, S. B. (2021). Construction of urban landscape ecological security pattern based on circuit theory:A case study of Hengyang City, Hunan Province,China. Chin. J. Appl. Ecol. 32 (07), 2555–2564. doi:10.13287/j.1001-9332.202107.020
Lin, Q., Mao, J. Y., Wu, J. S., Li, W. F., and Yang, J. (2016). Ecological security pattern analysis based on InVEST and least-cost path model: a case study of dongguan water village. Sustainability 8 (2), 172. doi:10.3390/su8020172
Liu, C. L., Li, W. L., Xu, J., Zhou, H., Li, C., and Wang, W. (2022). Global trends and characteristics of ecological security research in the early 21st century: a literature review and bibliometric analysis. Ecol. Indic. 137, 108734. doi:10.1016/j.ecolind.2022.108734
Liu, L., Song, W., Zhang, Y. J., Han, Z., Li, H., Yang, D. Z., et al. (2021). Zoning of ecological restoration in the qilian mountain area, China. Int. J. Environ. Res. Public Health 18 (23), 12417. doi:10.3390/ijerph182312417
Liu, Q. H., Sun, Y. J., Mei, Y., Jian, Z., Pan, F., and Zhang, L. (2023). Construction and analysis of ecological security pattern of qingdao based on MSPA and MCR models. Pol. J. Environ. Stud. 32 (1), 155–169. doi:10.15244/pjoes/153431
McRae, B. H., Hall, S. A., Beier, P., and Theobald, D. M. (2012). Where to restore ecological connectivity? Detecting barriers and quantifying restoration benefits. PLoS One 7, e52604. doi:10.1371/journal.pone.0052604
Peng, J., Li, H. L., Liu, Y. X., Hu, Y. N., and Yang, Y. (2018a). Identification and optimization of ecological security pattern in Xiong'an New Area. Acta Geogr. Sin. 73 (04), 701–710. doi:10.11821/dlxb201804009
Peng, J., Yang, Y., Liu, Y. X., Hu, Y. N., Du, Y. Y., Meersmans, J., et al. (2018b). Linking ecosystem services and circuit theory to identify ecological security patterns. Sci. Total Environ. 644, 781–790. doi:10.1016/j.scitotenv.2018.06.292
Peng, J., Zhao, H. J., Liu, Y. X., and Wu, J. S. (2017). Research progress and prospect on regional ecological security pattern construction. Geogr. Res. 36 (03), 407–419. doi:10.11821/dlyj201703001
Sallustio, L., De Toni, A., Strollo, A., Di Febbraro, M., Gissi, E., Casella, L., et al. (2017). Assessing habitat quality in relation to the spatial distribution of protected areas in Italy. J. Environ. Manag. 201, 129–137. doi:10.1016/j.jenvman.2017.06.031
Shi, F. N., Liu, S. L., An, Y., and Sun, Y. X. (2019). Biodiversity conservation of mountains-rivers-forests-farmlands-lakes-grasslands using an ecological network:A case study on the Zuoyoujiang river basin in Guangxi Province, China. Acta Ecol. Sin. 39 (23), 8930–8938. doi:10.5846/stxb201905311144
Song, L. L., and Qin, M. Z. (2016). Identification of ecological corridors and its importance by integrating circuit theory. Chin. J. Appl. Ecol. 27 (10), 3344–3352. doi:10.13287/j.1001-9332.201610.035
Sun, Y. H., Chen, Y. B., Li, X. S., Sun, J. G., and Fu, X. F. (2013). Evolutionary sequence of faults and the formation of inversion structural belts in the northern Songliao Basin. Petroleum Explor. Dev. 40 (3), 296–304. doi:10.1016/s1876-3804(13)60036-1
Tian, P., Zhu, Z. L., Yue, Q. M., He, Y., Zhang, Z. Y., Hao, F. H., et al. (2021). Soil erosion assessment by RUSLE with improved P factor and its validation: case study on mountainous and hilly areas of Hubei Province, China. Int. Soil Water Conservation Res. 9 (3), 433–444. doi:10.1016/j.iswcr.2021.04.007
Tian, Y. N., Zhang, M. H., Xu, D. F., and Zhang, S. W. (2019). Landscape ecological security patterns in an ecological city, based on source-sink theory. Acta Ecol. Sin. 39 (07), 2311–2321. doi:10.5846/stxb201803310719
Wang, X. K., Xie, X. Q., Wang, Z. F., Lin, H., Liu, Y., Xie, H. L., et al. (2022). Construction and optimization of an ecological security pattern based on the MCR model: a case study of the minjiang River basin in eastern China. Int. J. Environ. Res. Public Health 19 (14), 8370. doi:10.3390/ijerph19148370
Wang, Y., Zhang, L., and Song, Y. H. (2023). Study on the construction of the ecological security pattern of the lancang River basin (yunnan section) based on InVEST-MSPA-circuit theory. Sustainability 15 (1), 477. doi:10.3390/su15010477
Wang, Y. Y., Jin, X. B., Shen, C. Z., Bao, G. Y., Liu, J., and Zhou, Y. K. (2019). Establishment of an ecological security pattern in the eastern developed regions: a case study of the Sunan District. Acta Ecol. Sin. 39 (07), 2298–2310. doi:10.5846/stxb201802050308
Wang, Z. Y., and Li, L. J. (2018). Determination of land salinization causes via land cover and hydrological process change detection in a typical part of Songnen Plain. J. Geogr. Sci. 28 (8), 1099–1112. doi:10.1007/s11442-018-1544-3
Wei, H., Zhu, H., Chen, J., Jiao, H. Y., Li, P. H., and Xiong, L. Y. (2022a). Construction and optimization of ecological security pattern in the loess plateau of China based on the minimum cumulative resistance (MCR) model. Remote Sens. 14 (22), 5906. doi:10.3390/rs14225906
Wei, J. B., Zheng, H., Cheng, Y. L., and Wang, Y. (2022b). Advances in research of ecological security patterns, based on CiteSpace. Ecol. Environ. Sci. 31 (04), 835–844. doi:10.16258/j.cnki.1674-5906.2022.04.022
Wolff, S., Schulp, C. J. E., and Verburg, P. H. (2015). Mapping ecosystem services demand: a review of current research and future perspectives. Ecol. Indic. 55, 159–171. doi:10.1016/j.ecolind.2015.03.016
Wood, S. L. R., Jones, S. K., Johnson, J. A., Brauman, K. A., Chaplin-Kramer, R., Fremier, A., et al. (2018). Distilling the role of ecosystem services in the sustainable development goals. Ecosyst. Serv. 29, 70–82. doi:10.1016/j.ecoser.2017.10.010
Xiang, B., Ren, H. L., Ma, G. W., Li, Y. H., Yuan, X. Z., Xie, Q., et al. (2011). Assessment of ecosystem service importance in cheng-yu economic zone. Res. Environ. Sci. 24 (07), 722–730. doi:10.13198/j.res.2011.07.14.xiangb.007
Xie, G. D., Zhang, C. X., Zhang, L. M., Chen, W. H., and Li, M. S. (2015). Improvement of the evaluation method for ecosystem service value based on per unit area. J. Nat. Resour. 30, 1243–1254. doi:10.11849/zrzyxb.2015.08.001
Xu, J., Xu, D. W., and Qu, C. (2023). Construction of ecological security pattern and identification of ecological restoration zones in the city of Changchun, China. Int. J. Environ. Res. Public Health 20 (1), 289. doi:10.3390/ijerph20010289
Yang, Q. K., Luo, W. Q., Ma, H. B., and Liang, W. (2006). NDVI extraction of regional soil erosion based on remote sensing. Res. Soil Water Conservation (05), 267–268+271. doi:10.3969/j.issn.1005-3409.2006.05.085
Yang, X. C., Yue, W. Z., and Gao, D. W. (2013). Spatial improvement of human population distribution based on multi-sensor remote-sensing data: an input for exposure assessment. Int. J. Remote Sens. 34 (15), 5569–5583. doi:10.1080/01431161.2013.792970
Ye, X., Zou, C. X., Liu, G. H., Lin, N. F., and Xu, M. J. (2018). Main research contents and advances in the ecological security pattern. Acta Ecol. Sin. 38 (10), 3382–3392. doi:10.5846/stxb201701110083
Yin, H. W., Kong, F. H., Hu, Y. M., James, P., Xu, F., and Yu, L. J. (2016). Assessing growth scenarios for their landscape ecological security impact using the SLEUTH urban growth model. J. Urban Plan. Dev. 142 (2). doi:10.1061/(asce)up.1943-5444.0000297
Yu, K. J. (1999). Landscape ecological security patterns in biological conservation. Acta Ecol. Sin. (01), 10–17. doi:10.3321/j.issn:1000-0933.1999.01.0025
Zhang, C. X., Jia, C., Gao, H. G., and Shen, S. G. (2022b). Ecological security pattern construction in hilly areas based on spca and MCR: a case study of nanchong city, China. Sustainability 14 (18), 11368. doi:10.3390/su141811368
Zhang, D. Y., Qu, L. P., and Zhang, J. H. (2019). Ecological security pattern construction method based on the perspective of ecological supply and demand: a case study of Yangtze River Delta. Acta Ecol. Sin. 39 (20), 7525–7537. doi:10.5846/stxb201808301854
Zhang, D. Y., Zheng, G. C., Zheng, S. F., Guan, W. B., Zhao, W. J., and Jia, X. B. (2018). Assessing water quality of Nen River, the neighboring section of three provinces, using multivariate statistical analysis. J. Water Supply Res. Technology-Aqua 67 (8), 779–789. doi:10.2166/aqua.2018.050
Zhang, J. X., Cao, Y. M., Ding, F. S., Wu, J., and Chang, I. S. (2022a). Regional ecological security pattern construction based on ecological barriers: a case study of the bohai bay terrestrial ecosystem. Sustainability 14 (9), 5384. doi:10.3390/su14095384
Zhang, L., Bai, K. Z., Wang, M. J., and Karthikeyan, R. (2016). Basin-scale spatial soil erosion variability: pingshuo opencast mine site in Shanxi Province, Loess Plateau of China. Nat. Hazards 80 (2), 1213–1230. doi:10.1007/s11069-015-2019-9
Zhang, L. Q., Peng, J., Liu, Y. X., and Wu, J. S. (2017). Coupling ecosystem services supply and human ecological demand to identify landscape ecological security pattern: a case study in Beijing-Tianjin-Hebei region, China. Urban Ecosyst. 20 (3), 701–714. doi:10.1007/s11252-016-0629-y
Keywords: ecological security patterns, songnen plain, circuit theory, optimization strategy, ecological restoration zoning
Citation: Liu J, Chen B, Zhang M, Wan D and Liu X (2024) Construction and optimization of ecological security patterns in the songnen plain. Front. Environ. Sci. 12:1302896. doi: 10.3389/fenvs.2024.1302896
Received: 27 September 2023; Accepted: 08 January 2024;
Published: 19 January 2024.
Edited by:
Pan Yang, Guangdong University of Technology, ChinaReviewed by:
Xiang Zhang, Wuhan University, ChinaCopyright © 2024 Liu, Chen, Zhang, Wan and Liu. This is an open-access article distributed under the terms of the Creative Commons Attribution License (CC BY). The use, distribution or reproduction in other forums is permitted, provided the original author(s) and the copyright owner(s) are credited and that the original publication in this journal is cited, in accordance with accepted academic practice. No use, distribution or reproduction is permitted which does not comply with these terms.
*Correspondence: Jiping Liu, bGpwQGpsbnUuZWR1LmNu
Disclaimer: All claims expressed in this article are solely those of the authors and do not necessarily represent those of their affiliated organizations, or those of the publisher, the editors and the reviewers. Any product that may be evaluated in this article or claim that may be made by its manufacturer is not guaranteed or endorsed by the publisher.
Research integrity at Frontiers
Learn more about the work of our research integrity team to safeguard the quality of each article we publish.