- 1Department of Silviculture, Faculty of Forestry and Environment, IPB University, Bogor, Indonesia
- 2World Agroforestry (ICRAF), Indonesia Country Program, Bogor, Indonesia
Cacao (Theobroma cacao) is a commodity that plays an important role in supporting economic and social development. However, cacao production can also be a major contributor to carbon emissions, which has stimulated various efforts toward sustainable cacao farm management. There remains a gap in knowledge regarding the links between carbon stocks and carbon footprints, which can serve as indicators of environment “friendliness.” In this study, we investigated carbon stocks and carbon footprints in two cacao cultivation systems, agroforests and monocultural systems, and the biophysical aspects (biotic and abiotic factors) that might contribute to the variability of carbon levels. System inventories, soil samples, and farmer interviews identified the characteristics and management practices of two cacao production systems. Results show that cacao agroforests accumulated more carbon stocks than cacao monocultures, 134.4 Mg C ha−1 and 104.7 Mg C ha−1, respectively, while cacao monocultural systems had higher carbon footprints than cacao agroforests, 1914.4 kg CO2e ha−1 and 932.1 ± 251.6 kg CO2e ha−1, respectively. Canopy cover, tree density, and soil organic carbon were the biophysical aspects that showed a significantly positive correlation with carbon stock levels, while canopy cover had a significantly negative correlation with carbon footprint levels. These results suggest that cacao agroforests are more climate-friendly management systems due to their ability to maintain high carbon stock levels while producing low carbon footprints.
1 Introduction
Cacao (Theobroma cacao) is a very popular cash crop and is a main agricultural commodity in many tropical countries (Hartemink, 2005). Cacao cultivation has become widespread in humid and sub-humid tropics and plays an important role in social and economic development (Pohlan and Pérez, 2010). In Indonesia, cacao is a priority crop, contributing significantly to the national economy as the third most important export commodity after oil palm (Elaeis guineensis) and rubber (Hevea brasiliensis). In all cacao-producing regions of Indonesia, agroforest systems are cultivated and managed by smallholders. Cacao agroforest (CAF) systems are characterized by their tree component. In the understory, the agroforest systems are dominated by cacao with the upper canopy comprised of a variety of tree species including forest remnants, secondary growth, planted timber, fruit, and nitrogen-fixing species. Food-producing tree species are commonly planted in smallholder cacao systems, with two-thirds of these trees being native forest species. Cacao trees can also be intercropped with other cash or food crops. Food crops, like maize (Zea mays), sweet potato (Ipomoea batatas), malanga (Xanthosoma spp.), and cucumber (Cucumis sativus), are often associated with cacao during the early years of its growth (Atangana et al., 2014).
The high diversity of tree species implies that CAF systems can be more environmentally friendly in terms of carbon (C) storage (Schroth et al., 2015). Environment friendliness is one indicator of sustainability related to the impact of commodity production on the climate. There are two measures of environmental friendliness that are discussed among scientists, C footprints and the standing C stocks. A C footprint is the amount of greenhouse gases (GHGs) emitted from the production of a commodity. Agricultural inputs, such as fertilizer, pesticides, and fossil fuels, as well as on-farm processing, are common variables that influence the level of the C footprints (Hillier et al., 2011; van Rikxoort et al., 2014). Another factor, which has the capacity to restrict and even decrease the size of the C footprint, is the C stock (Schroth et al., 2015). Carbon stocks are the total C sequestered in the C pools (in Mg C ha−1) of a production system. The carbon stock of a land use system is considered an indicator of climate friendliness, mitigating global heating (van Rikxoort et al., 2014).
Cacao agroforests, with a diversity of shade trees and shade cover, often have high C stocks and low C footprints. A number of tree species of the remnant forest are maintained as shade cover on cacao farms, allowing higher biodiversity and providing continuous ecosystem services. A recent study found that various levels of shade cover and biodiversity can enhance the C stock by increasing the biomass (Dawoe et al., 2016). Shade cover and biodiversity provide many environmental benefits, such as natural pest control (Wielgoss et al., 2012) and minimization of soil erosion and nutrient leaching (Rice and Greenberg, 2000); these benefits can lead to a reduced need for agricultural inputs. Compared to these mixed systems, cacao monocultural or “full-sun” systems (cacao systems with limited or no shade trees) have high early production due to the greater density of cacao trees. However, the negative impact of monocultural systems on climate is higher due to the intense use of fertilizers, pesticides, and other chemical inputs (Schneider et al., 2017). High agrochemical inputs produce a greater C footprint and higher GHG emissions (IPCC and penman, 2003).
In this study, we conducted field research on cacao agroforests and monocultural systems with the objectives of 1) measuring the rate of the C stock and C footprint in the two cacao cultivation systems; 2) determining the contribution of biophysical aspects to the C stocks and C footprints; and 3) describing the impact of both systems on environmentally friendly management.
2 Materials and methods
2.1 Research site
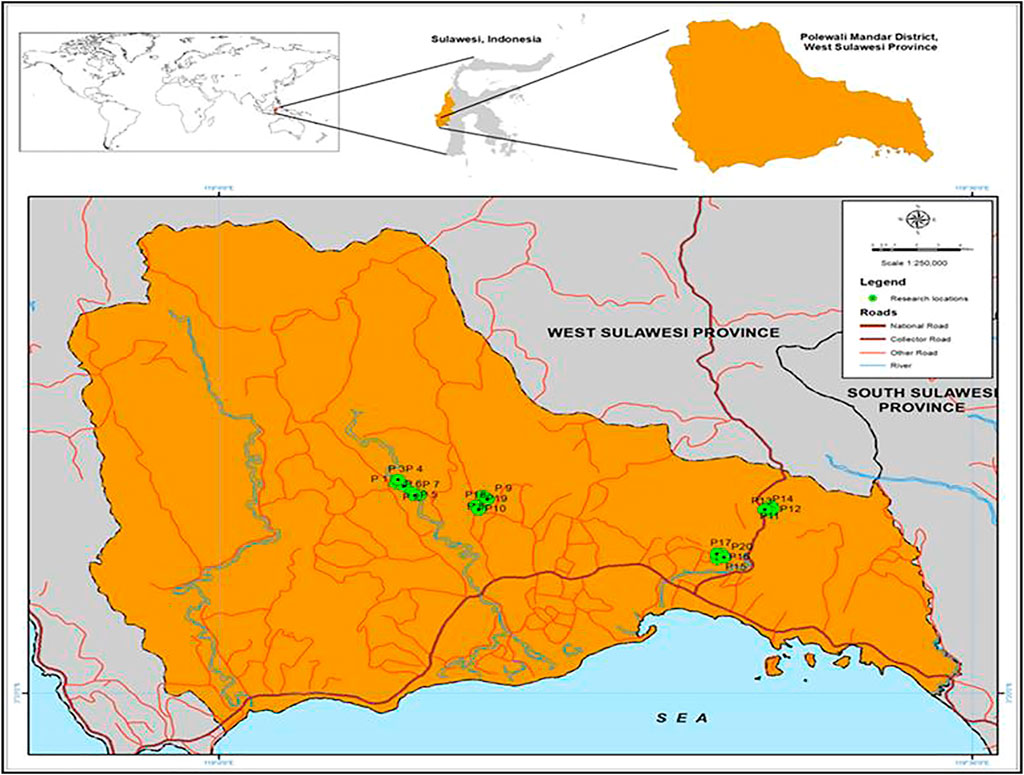
This research was conducted in Polewali Mandar district, West Sulawesi Province, Indonesia, which is the main cacao production area in the province. Polewali Mandar is characterized by hills (49.65%) and flat-to-undulating landscapes (44.41%), with some mountainous topography (5.94%). More than half of Polewali Mandar (59.38% of the total area) has an elevation of 12–100 m above sea level, and the remaining area (40.62%) has an elevation of 100–480 m above sea level. A map of the study area is presented in Figure 1.
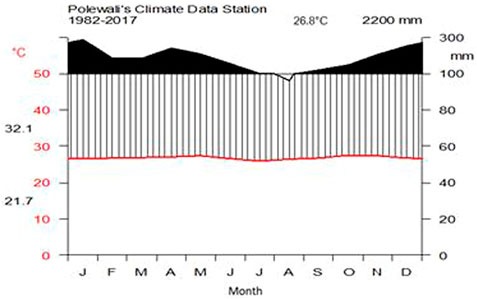
The climate in Polewali Mandar is classified as tropical humid with two rainy seasons, December–January and April–May. The driest period is August. The mean annual precipitation and temperature between 1982 and 2017 were 2,200 mm and 26.8°C, respectively. The average monthly variation in precipitation and temperature is illustrated in Figure 2.
2.2 Site selection and data collection
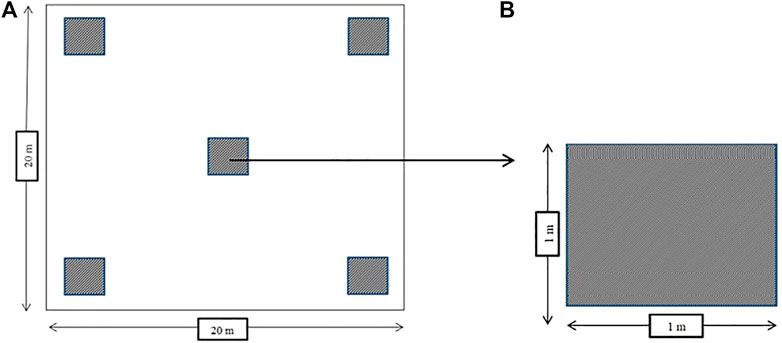
Four villages in Polewali Mandar were purposively selected based on cacao production being the main land use and a main source of household income, with both CAF and monocultural systems being practiced and community members being committed to the study. Here, 10 CAF and 10 cacao monocultural farms were randomly selected in each of the four villages. The CAF systems selected in this study were cacao plantations integrated with fruit and timber trees with cacao trees less than 50% of the total tree population. On average, the system featured 10 multi-stratum tree species (range 6–13 species) per farm, such as Paraserianthes falcataria, Gmelina arborea, Mangifera indica, and Durio zibethinus, and other commodity species. Meanwhile, the cacao monocultural systems selected in this study were plantations dominated by cacao trees, with only 1–4 shade tree species comprising a small portion of the total system (see Janudianto et al., 2014). In these monocultural systems, shade tree species were dominated by Gliricidia sepium, Leucaena leucocephala, and Musa spp. On the selected farms, interviews were conducted to collect information regarding farm operations: farm history, management practices—including on-farm supply chains (fertilizer, pesticide, fuel use, and all inputs)—yields, and management problems. The interview typically took 2 hours with the actual farm owners. After finishing the interview, field observation was conducted to identify more information related to the farm. A field inventory was implemented on each farm using a sampling plot to collect biomass data. Sampling plots were 20 m by 20 m squares, consisting of core and subplots as recommended by Abou Rajab et al. (2016). The plot design used in this study is presented in Figure 3.
In the core plots, data were collected to estimate above- and below-ground C stocks. The local and botanical names of all trees in the core plots were recorded. Diameter at breast height (DBH) was measured at 130 cm above the ground of all trees with a DBH of more than 5 cm. In the core plot, the necromass of all deadwood and fallen branches was calculated by measuring the length and diameter of each deadwood and branch. Inside the core plot, five subplots were developed. Each subplot was 1 m by 1 m and randomly distributed in the plot. All of the litter and herbaceous plants inside each subplot were collected. “Herbaceous plants” refer to all non-woody and grass plants growing in the understory. Litter and herbaceous plants were weighed and put into plastic (100 g) bags to be analyzed for C stocks. To estimate belowground C stocks, C from the soil and roots was considered. We directly calculated the soil organic content, while the soil inorganic content was excluded. Soil samples were collected from three subplots at depths of 0–10 cm, 10–20 cm, and 20–30 cm. To calculate the soil organic C stock, soil bulk density was considered. The soil and bulk density samples were collected by pressing sample rings into the soil after all herbaceous plants and litter had been removed. Soil samples were analyzed in the laboratory. The root C stock was estimated using a shoot and root ratio. Some biophysical aspects—such as light intensity, shade, soil type and fertility, annual temperatures, and precipitation—were also documented.
2.3 Carbon stock calculations
The C estimations were categorized as C stock and C footprint. The C stock included calculations for each C pool, while the C footprint calculation was based on total emissions from the system. In this study, we considered all C stocks at the farm level. Based on the IPCC and Penman’s (2003) study, the C stock is pooled separately into aboveground (tree stand, deadwood, litter, and herbaceous) and belowground biomass (root and soil). Aboveground biomass from the tree stands and necromass were estimated using a non-destructive method and allometric equations (Hairiah et al., 2001). To estimate the tree biomass, we used Yuliasmara et al.’s (2009) method for cacao trees (Eq. 1), Arifin’s (2001) method for Coffea sp. (Eq. 2) and Musa sp. (Eq. 3). For necromass, we used the formula (Eq. 4) developed by Hairiah et al. (2001). In cases where an allometric equation was not available for a specific species, we used the general allometric equation (Eq. 5) developed by Brown (1997).
In the equations, Y is the biomass, D is the diameter at breast height (DBH), h is the length of the deadwood, s is the bulk density, and 40 is a constant. ABG is the aboveground biomass. The litter and herbaceous biomass were destructively harvested at the ground level and calculated using the formula developed by Hairiah et al. (2001), i.e.,
Fresh weight for each component of the sample litter and herbaceous plants was measured separately on-site. Then, we randomly selected representative subsamples of stems, branches, leaves, and roots to measure their fresh weight. The subsamples were taken to the laboratory and oven-dried at 75°C to a constant weight. The dry weight (biomass) for each component was calculated according to Eq. 6.
The belowground C stock (soil organic carbon, SOC) was calculated using the Walkley–Black method (Walkley and Black, 1934). The soil sample and bulk density values were used to extrapolate the SOC to a per hectare (Mg C ha−1) value. The formula used was developed by Nair et al. (2009).
where CC is the organic carbon content, SD is the soil depth, BD is the bulk density, and 10,000 m2 is the number of square meters per ha. The belowground C stock in the form of root biomass was calculated using the 25% shoot-to-root ratio as reported by Cairns et al. (1997). Biomass was converted to C stock by assuming a C content of 50% (IPCC and Penman, 2003).
2.4 Carbon footprint calculations
A questionnaire was developed to collect information regarding farm management practices, including the on-farm supply chain (fertilizer, pesticide, and fuel use). Based on the field data collection, the agricultural inputs considered in this study were mineral and organic fertilizer, pesticides, and fossil fuels for farm operations and transportation. All of the data were analyzed using the Cool Farm Tool software version 2.0 beta and converted into C emissions (CO2e). The software combines several established empirical models for GHG emissions to give a single overall estimate based on current and previous farming practices (Hillier et al., 2011). The model includes several sub-models that break down the overall GHG emissions by farm management practices. GHG emissions from the production and distribution of a range of fertilizer types were taken from the Ecoinvent database (Frischknecht et al., 2007). For nitrous oxide (N2O) and nitric oxide (NO) emissions from fertilizer application, the study used the multivariate empirical model of Bouwman et al. (2002), which is based on a global dataset of over 800 sites. The formula used was
where factor classes are fertilizer type x fertilizer application rate, crop type, soil texture, soil organic C, soil drainage, soil pH, soil cation exchange capacity, climate type, and application method. The model for ammonia (NH3) emissions was slightly different from that given in FAO/IFA (2001),
where FA is the amount of fertilizer applied. Factors were determined by statistical analysis. NO and NH3 emissions were converted to N2O by the factor 0.01 as given in IPCC (2006). Leaching was assumed to occur at a rate of 0.3 N applied for a moist climate zone only; the conversion factor to N2O of 0.01 was also employed. Emissions of CO2 from urea application or liming were also accounted for using IPCC emission factors of 0.20 and 0.12 (IPCC, 2006), respectively. For emissions from pesticide application, the system used sources from the work of Audsley (1997), which produced averages of around 14.7, 18.4, 20.9, and 28.1 kg CO2 equivalent per hectare for fungicide, growth regulator, herbicide, and insecticide, respectively. We excluded fuel use by machinery because the typical farming system in the study area does not use machinery. Fossil fuel use for transportation and distribution of fertilizer, herbicide, and fungicide was considered by the system and calculated according to the Ecoinvent database.
2.5 Biophysical aspects
During the field inventory, biophysical aspects were analyzed. The biophysical aspects considered in this study were biotic and abiotic factors that might contribute to the level of C. Biophysical data regarding canopy cover, tree diversity, tree density, SOC, applied fertilizer, and light intensity were collected. Canopy cover data were collected using the hemispheric photography method and were collected from 16 positions within each core plot using a digital camera, and then, the data were analyzed using ImageJ software (Ishida, 2004). Tree diversity and density data were collected from the inventory in each plot. Tree diversity data were then analyzed using the Shannon–Wiener (H’) index (Smith, 1990). Applied fertilizer data were collected during the interview process with each farmer. Soil organic carbon data were collected using the same process used with the C stock calculation. Light intensity was analyzed using a lux meter (LX-113S) (Fairbairn, 1958).
2.6 Statistical analysis
The data obtained from the C stocks, C footprints, and some of the biophysical variables were analyzed using R statistical software (R studio version 3.4.3). Data exploration was conducted using descriptive statistics, such as minimum and maximum values, mean, range, and even boxplot to observe and view the distribution of the data. The significance of each measured parameter was tested by Student’s t-test to perform a pairwise comparison of means. Correlation analysis was also performed to establish trends and relationships between the biophysical aspects, C stocks, and C footprints, as well as the productivity and sustainability of the cacao farm.
3 Results and discussion
3.1 Farm characteristics and biophysical aspects
The cacao plantations in this study were owned by smallholders, with the majority of farm sizes ranging from 0.25–2 ha. There were differences in biophysical aspects and farm characteristics, such as canopy cover, light intensity, tree density, the area under cacao, tree density, mineral fertilizer use, and annual cacao yield, between the monocultural and agroforest systems. The results indicate that variation between farms could have been reduced by including soil parameters, plantation age, and other biophysical and management characteristics as farm selection criteria. Reducing the variation could have revealed significant statistical differences in C storage and C footprints between cacao agroforests and cacao monoculture (CM) farms.
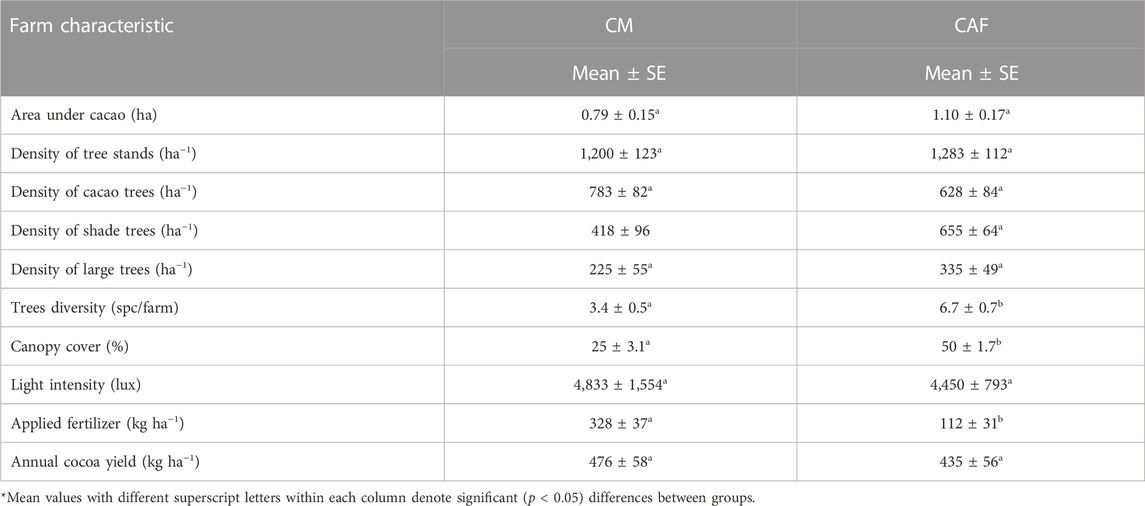
The agroforest systems had a greater proportion of canopy cover (50% and p < 0.05) and tree density (1,283 ha−1) compared to the monocultural systems. However, agroforests had a lower level of light intensity (4,833.6), as shown in Table 1. Light intensity was closely related to the canopy cover. The greater the canopy cover, the lower the light intensity. The amount of natural light penetrating the understory is affected by the presence of shade trees (Manaker, 1996). The amount of light reaching the leaves decreases as sunlight passes downward through the canopy; thus, leaves on the upper part of the canopy tend to shade and reflect light away from the lower canopies (Chapman and Carter, 1976). According to Nair (2010), cacao is a species that requires shade, especially in the early phase of growth. The proportion of canopy cover and light intensity may affect the growth and development of cacao trees and, thus, affect yields. The use of shade trees may have a negative impact due to competition for light, water, and nutrients (Asare et al., 2019). However, their advantage in conserving and restoring land can contribute to stable long-term production (Beer et al., 1998).
In this study, cacao tree density and fertilizer application rates had a curious influence on the level of cacao production. Cacao monocultural systems had 9.5% higher yields than agroforest systems, 476 kg ha−1 compared to 435 kg ha−1, respectively; however, the difference is not statistically significant. On a per tree basis, cacao yields were similar between the two production systems, 0.61 kg/tree (476 kg/783 trees) in monoculture systems and 0.69 kg/tree in agroforests (435 kg/628 trees)—see Table 1. So, while monocultural systems had more cacao trees per hectare and received higher fertilizer application rates, they did not have significantly higher yields. This implies that nutrient availability did not limit cacao productivity at the study site. Differences in farm characteristics and biophysical aspects between cacao monocultures and agroforests may be more relevant indicators of the sustainability of cacao farming. Long-term stable yields of cacao are not guaranteed by monocultural systems and high rates of fertilizer application. Other studies show that such systems can be more susceptible to pest attack due to the absence of insect and bird predators of those pests and the greater abundance of cacao trees (Bentley et al., 2004; Tscharntke et al., 2011; Wielgoss et al., 2012). Farmers’ experience at the study site confirms this condition.
To ensure sustainable yields, the sustainability of ecosystem functions and biophysical aspects need to be considered. Effendy (2015) argued that there are two main elements that determine the productivity of a cacao farm, namely, the provision of nutrients and the management of the cacao trees. The control of cacao tree growth and density, as well as an increase in light penetration, is necessary to promote incremental increases in fruit production (Vernon and Sunderam, 1972). Studies have shown that appropriate shading levels can lead to adequate photosynthetic rates, growth, and profitable fruit yields. Shading can also reduce the effects of unfavorable ecological factors, such as low soil fertility, wind velocity, and excessive evapotranspiration (Miyaji et al., 1997). Multi-stratum plantations can maintain and enhance soil fertility with a subsequent increase in nutrient availability for the cacao crop (Isaac et al., 2007).
Additionally, cacao shade systems provide greater levels of biodiversity and other ecosystem services (food provision, water supply and regulation, plant and animal habitat, genetic diversity, pollination, pest control, and climate regulation), benefiting both farm families and broader society (Schroth and Harvey, 2007; De Beenhouwer et al., 2013; Vaast and Somarriba, 2014). Research in coffee (Coffea sp) and cacao systems have shown that shade trees play a key role in regulating humidity and temperature fluctuations (Beer et al., 1998) and in reducing the overall vulnerability of these systems (Lin et al., 2008).
3.2 Carbon stocks
Total C stocks per farm in this study ranged from 53 to 195 Mg C ha−1, with an average of 134.4 Mg C ha−1 in agroforest systems and 104.7 Mg C ha−1 in monocultural systems (Figure 4). Most of the C stock in agroforest systems accumulated in aboveground biomass (52.48% of the total stock), including 45.16% and 6.62% stored in the trees and necromass, respectively, with the remaining <1.5% accumulated in the litter and herbaceous plants. Most of the belowground C stock (47.54% of the total stock) in the agroforest systems accumulated in the soil (36.24%) with the remaining (11.31%) in the root biomass. By contrast, in monocultural systems, most of the C stocks accumulated below ground (52.24% of the total stock), specifically in the soil (40.88%) and roots (11.37%). The aboveground biomass of monocultural systems (47.68% of the total stock) accumulated in the tree stands (45.56%), necromass (1.15%), and litter and herbaceous plants (<1%).
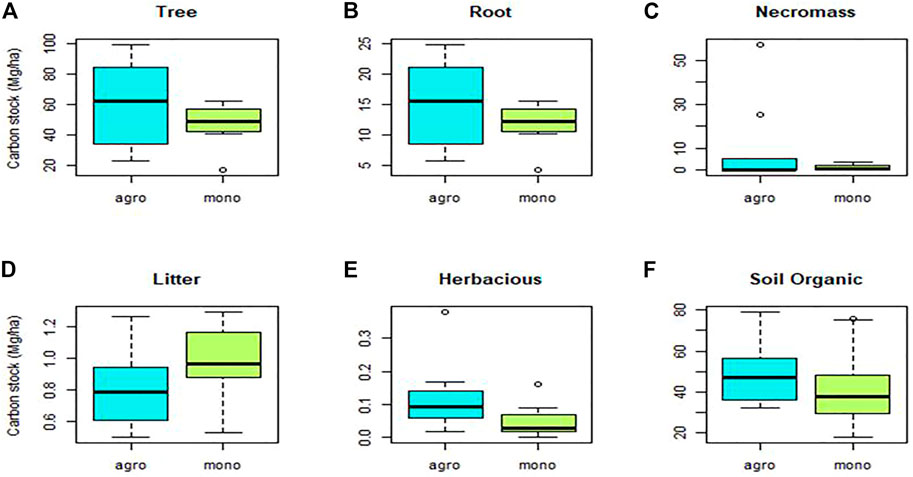
Average C stocks for trees, necromass, litter, herbaceous plants, soil, and roots in agroforest systems were 60.7, 8.9, 0.82, 0.11, 48.7, and 15.2 Mg C ha−1, respectively, while in monocultural systems, the respective C stocks were 47.7, 1.2, 0.97, 0.05, 42.8, and 11.9 Mg C ha−1. The data are shown in Figure 5. Statistically, C stocks were not found to be significantly different between monocultural and agroforest systems in our study. This could be a result of the high variability in the C stocks of the systems attributed to the differences in age, structure, and management practices of cacao systems included in the site. Albrecht and Kandji (2003) also document the impact of the variation in smallholder practices and systems on C stocks and statistical analysis. The C stocks in our study were in the range of those reported by Silatsa et al. (2017) in Central Cameroon, which was 92.1 for mature and 144.5 Mg C ha−1 for old cacao trees. In our study, aboveground C stocks in agroforest systems were higher than the 49 Mg C ha−1 and 46 Mg C ha−1 reported for shaded cacao systems in Central America (Somarriba et al., 2013) and intensified cacao agroforests in Southern Bahia, Brazil (Schroth et al., 2015), but lower than the 100 Mg C ha−1 for cacao multishade systems as reported by Abou Rajab et al. (2016). These levels of C stocks in the monocultural and agroforest systems were similar to those reported by Roshetko et al. (2007) in smallholders’ coffee and rubber (H. brasiliensis) systems. At the maximum of age 25+ years, rubber and coffee systems can store 190 and 100 Mg C ha−1, respectively. These smallholder tree commodity systems are relevant to this study since Indonesia is a center for smallholder rubber, coffee, and cacao production.
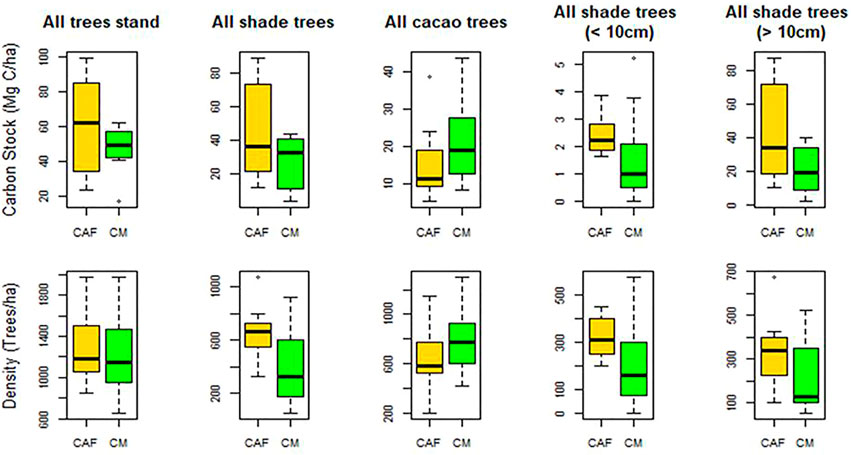
Tree density is an essential factor for C accumulation since most of the C stock in the CAF and CM systems is stored in the tree and root components, 56.47% and 56.93% of the total C stocks, respectively. The greatest proportion of C stocks is accounted for by the tree and their diameter size (Dawoe et al., 2016). The higher C stocks in the CAF system were contributed by the diversity of the shade trees (Figure 6). Somarriba et al. (2013) also revealed that the larger proportion of C stocks in most cacao agroforests is stored in the shade trees. The proportion of shade trees in the system and the density of the trees influence the C stock. The trend shows a clear increase in the C stock with increased tree density. The C stocks from the shade trees’ category in agroforest and monocultural systems were 45.4 and 27 Mg ha−1, respectively, with tree densities of 655 to 418 trees ha−1. The trend is the opposite for C stocks in the cacao tree category, where monocultural systems had higher C stocks and tree densities (Figure 6).
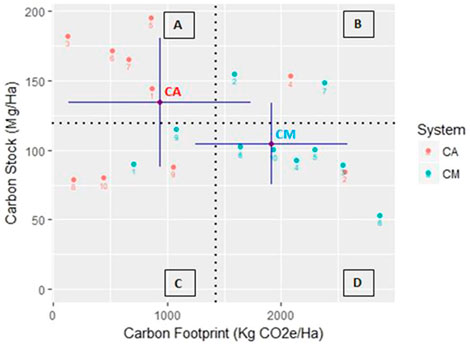
FIGURE 6. Relationship between the carbon stocks and footprints in the two systems. The dashed lines show the median of carbon stocks and footprints, respectively, dividing the fields into four quadrants of the most desirable (A), least desirable (D), and intermediate (B, C) climate impact for CAF and CM systems.
The CAF systems tended to have trees with bigger diameters, contributing to higher C stocks. The graph in Figure 6 shows that the number of shade trees with diameters bigger than 10 cm were twice as common in agroforest systems compared to monocultural systems, greatly contributing to the higher C stocks. According to Albrecht and Kandji (2003), a strategy for on-farm C storage is agroforest systems that integrate annual crops to facilitate the growth of tree components, the most important source of biomass and C stocks.
3.3 Carbon footprints
The main source of C footprints in this study was from fertilizer inputs, accounting for 96.7% and 95.5% of the total in CAF and monocultural systems, respectively. Fuel and pesticide use accounted for the balance of the C footprint in systems (Table 2). The total C footprints generated in the monocultural and agroforest systems reached 1,914.4 kg CO2e ha−1 or 4.47 kg CO2e kg−1 of cacao beans and 932.1 kg CO2e ha−1 or 2.18 kg CO2e kg−1 of cacao beans (p < 0.05), respectively. Emissions from fertilizer and fuel use were significantly higher in monocultural systems, while agroforest systems had higher emissions from pesticide use (p > 0.436) (Table 2). Referring to the total C footprint produced, the monocultural systems were significantly higher than that of the agroforest systems, producing more than twice the C footprint. The level of C footprints produced by monocultural systems in this study was greater than that of intensive cacao production under the Cabruca system in Southern Bahia, Brazil, as reported by Schroth et al. (2016). The C footprint averaged 0.36 kg CO2e kg−1 of cacao beans varying from 0 to 1.76 kg CO2e kg−1 of cacao beans. The study revealed that the highest emission was observed at low-to-medium yields where excessive levels of fertilizers were applied by farmers in effort to increase production. The level of C footprints varied depending on farm management practices and conditions. Excessive levels of fertilizer use did not secure high yields. Many factors such as soil condition, poor management, and the condition of cacao trees affected the yield response to fertilizer application. These factors also contribute to the variations in C stocks and C footprints.
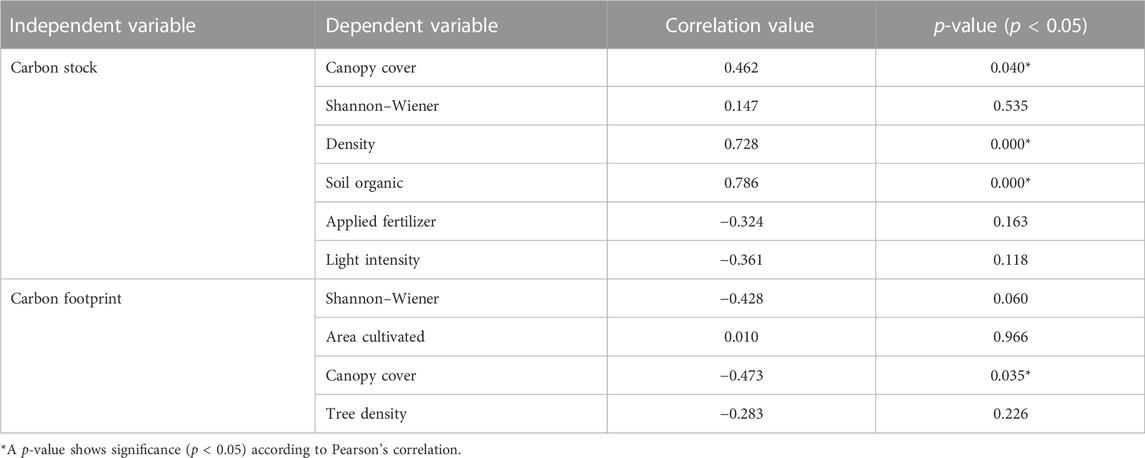
Bivariate Pearson correlation analysis indicated that all the biophysical parameters tested were significantly related to the C stocks except for the Shannon–Wiener index, applied fertilizer, and light intensity. Only canopy openness had a significant relationship to the carbon footprint values. The correlation value varied independently related to the parameters tested (Table 3).
The relationship between shade, tree density, and soil organic values showed a significantly positive correlation to C stocks while canopy openness had a significantly negative correlation to the C footprints. These results indicate that biophysical aspects can contribute to climate-friendly cacao management systems. The diverse understory may contribute to the higher C stocks and the low level of C footprints. The increase in shade levels and density of trees may influence the biomass, producing high C stock levels. Several authors emphasize that shade trees influence C stocks (Steffan-Dewenter et al., 2007; Tscharntke et al., 2011; Schroth et al., 2016). Studies by Oke and Olatiilu (2011), for instance, report that shade trees stored up to 65% of the total tree C in cacao systems in Nigeria and Cameroon.
The present study also shows that shade has a negative significant correlation to the C footprint levels, with increasing shade levels linked to decreasing C footprints. The canopy level may contribute not only to soil accumulation but also nutrients. The greatest contributor to the C footprint in this study was fertilizer use. By increasing the shade level, the C footprint level can be reduced. Studies by Beer et al. (1998) and Fassbender et al. (1991) indicated the role of shade trees in cacao and coffee systems to reduce soil erosion and nutrient leaching from the impact of raindrops, improve soil structure, increase soil nitrogen content, and enhance nutrient retention.
3.4 The implications of each system for climate friendliness and generation of livelihoods
Agriculture is the dominant source of livelihood in Polewali Mandar, with cacao production being the main agricultural activity for the farmers in this study. Local farmers often convert traditional cacao agroforest systems to monocultural systems by decreasing the number and species of shade trees. This intensification pattern is financially favorable in the short term but risky in terms of ecological and livelihood sustainability. Monocultural systems may have greater cacao productivity in the short term but comparatively lower long-term prospects for smallholders (Rice and Greenberg, 2000; Tscharntke et al., 2011; Mithofer et al., 2017). Our study indicates that the monocultural systems have 9.5% higher cacao yields compared to agroforest systems; however, this difference is not statistically significant (Table 1). This high yield was influenced by the density of cacao trees and management practices featuring more inputs. Consequently, there was more income from the cacao yields but a higher capital burden for agricultural inputs. Armengot et al. (2016) also reported that cacao monocultures required more agricultural inputs than agroforests. Monocultural systems tend to produce high C footprints as a result of the intensive use of inputs. Therefore, it is considered less climate friendly. Our results indicate that cacao monocultures are less desirable regarding climate friendliness and potential threats to the environment. Comparatively, cacao agroforest systems have lower C footprints and higher C stocks (Figure 4).
There was a momentous difference between cacao monocultural and agroforest systems regarding climate friendliness and generation of livelihoods. Our data suggest that there are possible pathways for carbon-friendly intensification in cacao agroforest systems through lower C footprints and higher C stocks. The cacao agroforest systems are gradually established under sustainable land use guidelines that meet biological, ecological, and economic objectives. This approach also maintains other valuable crops, which contribute to improving smallholders’ livelihoods (Schroth et al., 2015; Mithofer et al., 2017). A study conducted by Schroth et al. (2016) reported that cacao intensification under tree canopies with shade levels of 20%–90% (called the Cabruca system) is compatible with climate friendliness and increases productivity. The productivity of Cabruca systems (Southern Bahia, Brazil) can be doubled through the proper use of mineral and organic fertilizer, while also maintaining low input-related C footprints.
The diverse shade tree and companion tree species that exist in cacao agroforests have certain benefits for the ecosystem. Tscharntke et al. (2011) claimed that shade trees have environmental, social, and economic values as well as play an important role in reducing household vulnerability to climatic stress and food insecurity. Products obtained from shade trees include firewood, medicine, resins, honey, fiber, and construction materials, all of which can provide alternative sources of income in both the short and long terms, thus delivering farm income variability throughout the year and providing resiliency to declines in cacao prices (Steffan-Dewenter et al., 2007; Tscharntke et al., 2011; Somarriba et al., 2013). This high potential of cacao agroforests offers opportunities to improve income generation at the household and even community level. It is necessary to recognize the importance of these diverse systems as sources of biodiversity conservation, reduced emissions, and climate change resilience. Our findings confirm that livelihoods are positively impacted by the conservation of plant biodiversity that can simultaneously serve as alternative sources of products and income. Even when cacao agroforests are not the main generator of income, they are still suitable for securing local culture and tradition.
4 Conclusion
The cacao farms in our study varied greatly in characteristics and biophysical aspects, depending on the management practices and site conditions. Nonetheless, results suggest that cacao production systems vary extensively in their contribution to climate change in terms of both C storage and C footprint. Cacao agroforests, with characteristically lower agricultural inputs and higher densities of shade trees and biodiversity, can play an important role in storing greater C stocks. Their shade trees and other environmental services also contribute to a lower need for agricultural inputs, such as mineral and organic fertilizers, resulting in lower C footprints. Our study shows that cacao agroforests store larger C stocks than monocultural systems, (134.43 Mg ha−1 compared to 104.7 Mg C ha−1, respectively) and have lower C footprints (932.1 CO2e ha−1 compared to 1,914.4 kg CO2e ha−1, respectively). Consequently, cacao agroforest systems are considered more climate friendly.
Cacao production systems cannot achieve zero emissions since the use of some agrochemical inputs is common. Nevertheless, there are some practices that help reduce emissions during the production process. The efficient use of agricultural inputs, in accordance with expert recommendations, especially regarding fertilizer application, can reduce emissions, the waste of fertilizers, and input costs. The study found that the application of chemical fertilizer varied greatly at the farm level and directly affected C footprints. Most farmers applied fertilizers inappropriately, many often exceeding recommended application rates.
To complement this study, further research should be conducted to fully understand the potential of climate-friendly smallholder cacao production systems under different climatic conditions and management practices. Understanding the impacts of farm management options on C stocks and C footprints could enhance cacao production, improve farmer livelihoods, and reduce GHG emissions. All this information would be useful for advancing the development of an environmentally friendly cacao industry.
Data availability statement
The raw data supporting the conclusion of this article will be made available by the authors, without undue reservation.
Author contributions
All authors contributed to the development of the research concept; TM contributed to the data analysis; data curation and review were performed by IS and NW; JR contributed to the sampling and experimental design; original draft was written by TM and IS; and writing, review and editing was performed by all authors.
Funding
The authors acknowledge the financial support provided by the Australia–Indonesia Centre. This project is part of a collaboration between IPB University, Hasanuddin University, and the University of Sydney under the auspices of the Australia–Indonesia Centre, exploring the topic of sustainability and profitability of cacao-based farming systems in Indonesia. Financial support was also received from the Program of Higher Education Endowment Fund/Dana Abadi Perguruan Tinggi (DAPT) Year 2022, managed by IPB University.
Acknowledgments
The authors thank the cacao farmers and all the staff from the International Centre for Applied Finance and Economics for their support in organizing the project and preparing the fieldwork. Additionally, they thank Robert Finlayson (ICRAF, Southeast Asia Regional Program) for editorial contribution to the final version of the manuscript.
Conflict of interest
The authors declare that the research was conducted in the absence of any commercial or financial relationships that could be construed as a potential conflict of interest.
Publisher’s note
All claims expressed in this article are solely those of the authors and do not necessarily represent those of their affiliated organizations, or those of the publisher, the editors, and the reviewers. Any product that may be evaluated in this article, or claim that may be made by its manufacturer, is not guaranteed or endorsed by the publisher.
References
Abou Rajab, Y., Leuschner, C., Barus, H., Tjoa, A., and Hertel, D. (2016). Cacao cultivation under diverse shade tree cover allows high carbon storage and sequestration without yield losses. PLOS ONE 11 (2), e0149949. doi:10.1371/journal.pone.0149949
Albrecht, A., and Kandji, S. T. (2003). Carbon sequestration in tropical agroforestry systems. Agric. Ecosyst. Environ. 99 (1–3), 15–27. doi:10.1016/S0167-8809(03)00138-5
Arifin, J. (2001). Estimation of carbon stock in the different land-use system in ngantang, malang. Thesis. Indonesian: Brawijaya University.
Armengot, L., Barbieri, P., Andres, C., Milz, J., and Schneider, M. (2016). Cacao agroforestry systems have higher return on labor compared to full-sun monocultures. Agron. Sustain. Dev. 36 (4), 70. doi:10.1007/s13593-016-0406-6
Asare, R., Bo, M., Rebecca, A. A., Gilbert, A., and Anders, R. (2019). On-farm cocoa yields increase with canopy cover of shade trees in two agro-ecological zones in Ghana. Clim. Dev. 11 (5), 435–445. doi:10.1080/17565529.2018.1442805
Atangana, A., Khasa, D., Chang, S., and Degrande, A. (2014). Tropical agroforestry. Netherlands: Springer. doi:10.1007/978-94-007-7723-1
Audsley, E. (1997). Harmonisation of environmental life cycle assessment for agriculture. Final report, concerted action AIR3-CT94-2028. Brussels: European Commision, 139.
Beer, J., Muschler, R., Kass, D., and Somarriba, E. (1998). “Shade management in coffee and cacao plantations,” in Directions in tropical agroforestry research. Editors P. K. R. Nair, and C. R. Latt (Netherlands: Springer), 53, 139–164. doi:10.1007/978-94-015-9008-2_6
Bentley, J. W., Boa, E., and Stonehouse, J. (2004). Neighbor trees: Shade, intercropping, and cacao in Ecuador. Hum. Ecol. 32, 241–270. doi:10.1023/b:huec.0000019759.46526.4d
Bouwman, A. F., Boumans, L. J. M., and Batjes, N. H. (2002). Emissions of N2O and NO from fertilized fields: Summary of available measurement data. Glob. Biogeochem. Cycles 16 (4), 6–1.
Brown, S. (1997). Estimating biomass and biomass change of tropical forests: A primer. Rome, Italy: Food and Agriculture Organization of the United Nations.
Cairns, M., Brown, S., Helme, E. H., and Baumgardner, G. A. (1997). Root biomass allocation in the world's upland forests. Oeclogia 111 (1), 1–11. doi:10.1007/s004420050201
Chapman, S. R., and Carter, L. P. (1976). Crop production: Principles and practices. San Francisco: W.H. Freeman and Company, 146–163.
Dawoe, E., Asante, W., Acheampong, E., and Bosu, P. (2016). Shade tree diversity and aboveground carbon stocks in theobroma cacao agroforestry systems: Implications for REDD+ implementation in a west african cacao landscape. Carbon Balance Manag. 11 (1), 17. doi:10.1186/s13021-016-0061-x
De Beenhouwer, M., Aerts, R., and Honnay, O. (2013). A global meta-analysis of the biodiversity and ecosystem service benefits of coffee and cacao agroforestry. Agric. Ecosyst. Environ. 175, 1–7. doi:10.1016/j.agee.2013.05.003
Effendy, (2015). Application of side-grafting technology to increase cocoa productivity: Case study in sigi regency, Indonesia. J. Appl. Sci. 15 (4), 715–718. doi:10.3923/jas.2015.715.718
Fairbairn, W. A. (1958). Method of light intensity measurement in forest stands: II. The use of light measurement instruments in the field. Int. J. For. Res. 31, 155–162. doi:10.1093/forestry/31.2.155
Fassbender, H. W., Beer, J., Heuveldop, J., Imbach, A., Enriquez, G., and Bonnemann, A. (1991). Ten year balances of organic matter and nutrients in agroforestry systems at CATIE, Costa Rica. For. Ecol. Manag. 45 (1–4), 173–183. doi:10.1016/0378-1127(91)90215-H
Frischknecht, R., Jungbluth, N., Althaus, H.-J., Doka, G., Dones, R., Heck, T., et al. (2007). Overview and methodology. Ecoinvent report No. 1. Dübendorf, Switzerland: Swiss Centre for Life Cycle Inventories.
Hairiah, K., Sitompul, S. M., Noordwijk, M. V., and Cheryl, P. (2001). Methods for sampling carbon stocks above and below ground. ASB lecture note 4B. Bogor, Indonesia. Uttar Pradesh: International Centre for Research in Agroforestry.
Hartemink, A. E. (2005). Nutrient stocks, nutrient cycling, and soil changes in cocoa ecosystems: A review. Adv. Agron. 86, 227–253. doi:10.1016/S0065-
Hillier, J., Walter, C., Malin, D., Garcia-Suarez, T., Mila-i-Canals, L., and Smith, P. (2011). A farm-focused calculator for emissions from crop and livestock production. Environ. Model. Softw. 26 (9), 1070–1078. doi:10.1016/j.envsoft.2011.03.014
IPCC (2006). Interngovermental panel on climate change (IPCC). Tokyo, Japan: Institute for Global Environmental Strategies.Revised good practice guidelines for greenhouse gas inventories
Isaac, M. E., Timmer, V. R., and Quashie-Sam, S. J. (2007). Shade tree effects in an 8-year-old cocoa agroforestry system: Biomass and nutrient diagnosis of theobroma cacao by vector analysis. Nutrient Cycl. Agroecosyst. 78, 155–165. doi:10.1007/s10705-006-9081-3
Ishida, M. (2004). Automatic thresholding for digital hemispherical photography. Can. J. For. Res. 34, 2208–2216. doi:10.1139/x04-103
Janudianto, J., Roshetko, J. M., and Mahrizal, J. (2014). “Cacao agroforestry system (CAS): Improving productivity and profitability of smallholder cacao in Sulawesi. Bogor. Indonesia. World agroforestry Centre (ICRAF) Southeast Asia regional office.” In Presentation at World Agroforestry Congress, India, February 9–14, 2014.
Lin, B. B., Perfecto, I., and Vandermeer, J. (2008). Synergies between agricultural intensification and climate change could create surprising vulnerabilities for crops. BioScience 58 (9), 847–854. doi:10.1641/B580911
Manaker, G. H. (1996). Interior plantscapes: Installation, maintenance, and management. Engelwood Cliffs, NJ: Prentice Hall.
Mithofer, D., Roshetko, J. M., Donovan, J. A., Nathalie, N. E., Robiglio, V., Wau, D., et al. (2017). Unpacking ‘sustainable’ cocoa: Do sustainability standards, development projects and policies address producer concerns in Indonesia, Cameroon, and Peru? Int. J. Biodivers. Sci. Ecosyst. Serv. Manag. 13 (1), 444–469. doi:10.1080/21513732.2018.1432691
Miyaji, K. I., Silva, W. S., and Alvim, P. T. (1997). Productivity of leaves of a tropical tree, theobroma cacao, grown under shading, in relation to leaf age and light conditions within the canopy. New Phytol. 137, 463–472. doi:10.1046/j.1469-8137.1997.00841.x
Nair, K. P. P. (2010). The agronomy and economy of important tree crops of the developing world. Amsterdam, Netherlands: Elsevier. 131–181.
Nair, P. K. R., Mohan Kumar, B., and Nair, V. D. (2009). Agroforestry as a strategy for carbon sequestration. J. Plant Nutr. Soil Sci. 172 (1), 10–23. doi:10.1002/jpln.200800030
Oke, D., and Olatiilu, A. (2011). Carbon storage in agroecosystems: A case study of the cocoa based agroforestry in ogbese forest reserve, ekiti state, Nigeria. J. Environ. Prot. 02 (08), 1069–1075. doi:10.4236/jep.2011.28123
IPCC Penman, J. (2003). “IPPC national greenhouse gas inventories programme,” in Good practice guidance for land use, land-use change and forestry (Bert Bolin: The Intergovernmental Panel on Climate Change).
Pohlan, H. A. J., and Pérez, V. D. (2010). “Growth and production of cacao. Soils, plant growth, and crop production,” in Encyclopedia of life support systems (EOLSS) (Paris France: UNESCO).
Rice, R. A., and Greenberg, R. (2000). Cacao cultivation and the conservation of biological diversity. Ambio A J. Hum. Environ. 29, 167–173. doi:10.1579/0044-7447-29.3.167
Roshetko, J. M., Lasco, R. D., and Angeles, M. S. D. (2007). Smallholder agroforestry systems for carbon storage. Mitig. Adapt. Strategies Glob. Change 12 (2), 219–242. doi:10.1007/s11027-005-9010-9
Schneider, M., Andres, C., Trujillo, G., Alcon, F., Amurrio, P., Perez, E., et al. (2017). Cocoa and total system yields of organic and conventional agroforestry vs. Monoculture systems in a long-term field trial in Bolivia. Exp. Agric. 53 (3), 351–374. doi:10.1017/S0014479716000417
Schroth, G., Bede, L. C., Paiva, A. O., Cassano, C. R., Amorim, A. M., Faria, D., et al. (2015). Contribution of agroforests to landscape carbon storage. Mitig. Adapt. Strategies Glob. Change 20 (7), 1175–1190. doi:10.1007/s11027-013-9530-7
Schroth, G., and Harvey, C. A. (2007). Biodiversity conservation in cocoa production landscapes: An overview. Biodivers. Conservation 16, 2237–2244. doi:10.1007/s10531-007-9195-1
Schroth, G., Jeusset, A., Gomes, A. D., Florence, C. T., Coelho, N. A. P., Fariah, D., et al. (2016). Climate friendliness of cocoa agroforests is compatible with productivity increase. Mitig. Adapt. Strategies Glob. Change 21, 67–80. doi:10.1007/s11027-014-9570-7
Silatsa, F. B. T., Yemefack, M., Ewane-Nonga, N., Kemga, A., and Hanna, R. (2017). Modeling carbon stock Dynamics under fallow and cocoa agroforest systems in the shifting agricultural landscape of Central Cameroon. Agrofor. Syst. 91 (5), 993–1006. doi:10.1007/s10457-016-9973-4
Smith, R. L. (1990). Elements of ecology. 2nd edition. New York: West Virginia University Harper & Row.
Somarriba, E., Cerda, R., Orozco, L., Cifuentes, M., Dávila, H., Espin, T., et al. (2013). Carbon stocks and cocoa yields in agroforestry systems of central America. Agric. Ecosyst. Environ. 173, 46–57. doi:10.1016/j.agee.2013.04.013
Steffan-Dewenter, I., Kessler, M., Barkmann, J., Bos, M. M., Buchori, D., Erasmi, S., et al. (2007). Tradeoffs between income, biodiversity, and ecosystem functioning during tropical rainforest conversion and agroforestry intensification. Proc. Natl. Acad. Sci. U. S. A. 104, 4973–4978. doi:10.1073/pnas.0608409104
Tscharntke, T., Clough, Y., Bhagwat, S. A., Buchori, D., Faust, H., Hertel, D., et al. (2011). Multifunctional shade-tree management in tropical agroforestry landscapes — a review: Multifunctional shade-tree management. J. Appl. Ecol. 48 (3), 619–629. doi:10.1111/j.1365-2664.2010.01939.x
Vaast, P., and Somarriba, E. (2014). Tradeoffs between crop intensification and ecosystem services: The role of agroforestry in cocoa cultivation. Agrofor. Syst. 88, 947–956. doi:10.1007/s10457-014-9762-x
van Rikxoort, H., Schroth, G., Läderach, P., and Rodríguez-Sánchez, B. (2014). Carbon footprints and carbon stocks reveal climate-friendly coffee production. Agron. Sustain. Dev. 34 (4), 887–897. doi:10.1007/s13593-014-0223-8
Vernon, A. J., and Sundaram, S. (1972). “Current cocoa research,” in Proc. 4th int. Cocoa res. Conf. (St. Augustine: Trinidad and Tobago), 689–693.
Walkley, A., and Black, I. A. (1934). An examination of Degtjareff method for determining organic carbon in soils: Effect of variation in digestion condition and inorganic soil constituents. Soil Sci. 63, 251–263. doi:10.1097/00010694-194704000-00001
Wielgoss, A., Clough, Y., Fiala, B., Rumede, A., and Tscharntke, T. (2012). A minor pest reduces yield losses by a major pest: Plant-mediated herbivore interactions in Indonesian cacao: Indirect interaction between cacao pests. J. Appl. Ecol. 49 (2), 465–473. doi:10.1111/j.1365-2664.2012.02122.x
Keywords: cacao agroforest, climate friendliness, green intensification, on-farm biodiversity, sustainable livelihood
Citation: Miharza T, Wijayanto N, Roshetko JM and Siregar IZ (2023) Carbon stocks and footprints of smallholder cacao systems in Polewali Mandar, West Sulawesi. Front. Environ. Sci. 11:680984. doi: 10.3389/fenvs.2023.680984
Received: 16 March 2021; Accepted: 10 April 2023;
Published: 03 July 2023.
Edited by:
Vimala D. Nair, University of Florida, United StatesReviewed by:
Goetz Schroth, United Nations Development Programme (UNDP), MozambiqueMartin Yemefack, International Institute of Tropical Agriculture, Cameroon
Copyright © 2023 Miharza, Wijayanto, Roshetko and Siregar. This is an open-access article distributed under the terms of the Creative Commons Attribution License (CC BY). The use, distribution or reproduction in other forums is permitted, provided the original author(s) and the copyright owner(s) are credited and that the original publication in this journal is cited, in accordance with accepted academic practice. No use, distribution or reproduction is permitted which does not comply with these terms.
*Correspondence: Iskandar Zulkarnaen Siregar, c2lyZWdhckBhcHBzLmlwYi5hYy5pZA==
 Try Miharza1
 James M. Roshetko
 Iskandar Zulkarnaen Siregar