 Kaiguo Zhou1
 Zihuan Guan
 Yunzhi Lu
94% of researchers rate our articles as excellent or good
Learn more about the work of our research integrity team to safeguard the quality of each article we publish.
Find out more
ORIGINAL RESEARCH article
Front. Environ. Sci. , 07 December 2023
Sec. Environmental Economics and Management
Volume 11 - 2023 | https://doi.org/10.3389/fenvs.2023.1332224
This article is part of the Research Topic Digital Governance, Ecological Resilience and Resident Well-Being View all 7 articles
Green innovation has been the crucial and fundamental channel for efficient emission reduction and high-quality realization of the “Dual Carbon” goals. This paper provides novel evidence for the industry-level effect of Emission Trading Scheme (ETS) on green innovation. Specifically, adopting the supply chain Stackelberg model and the multi-period DID model, we demonstrate both theoretically and empirically that the ETS has an overall significant promotion effect on green innovation both in compliance and non-compliance industries. Surprisingly, the promotion effect in non-compliance industries will be stronger, forced by the costs pass-through from up-stream compliance industries. Furthermore, we also find that the carbon price level can amplify the positive effect of the ETS on industry green innovation in the short run, while the price volatility weakens the effect of the ETS in the long run. Our findings shed light on the inherent effects of ETS on green innovation and suggest that policymakers should stabilize the carbon prices so as to encourage green innovation.
The “Dual Carbon” goals are environmental targets set by the China government to address both carbon dioxide (CO2) emissions and carbon intensity. Specifically, China government pledges to achieve two following objectives simultaneously, known as Carbon Emission Peak and Carbon Neutrality. The former is to cap its total CO2 emission at a certain level by 2035 and reduce them gradually, while the latter is to balance the amount of carbon emissions and removal or offsetting. To neutralize the carbon emissions, China government emphasizes the role of “green innovation,” which provides new environment-friendly technology to the manufacturing industries. The ultimate goal of green innovation is to strengthen the environmental protection through new technologies, promote the recycling and efficient utilization of resources, improve production efficiency, and finally accelerate the transformation to high-quality economic development. Compared with emission reduction through production cuts, green technology upgrading can better promote long-term sustainable, non-recurring, high-quality carbon reduction and emission reduction. Therefore, green innovation is the necessary way and fundamental guarantee for efficient emission reduction and high-quality realization of the “Dual Carbon” goals.
The emissions trading scheme (ETS) has been shown to be an effective market-oriented instrument for carbon neutrality and reduction in greenhouse gas emissions (Du M. et al., 2023). Generally speaking, ETS can reveal the cost of CO2 emission via continuous trading, which helps firms accurately estimate the return of green innovation. Hence, ETS can, to some extent, encourage firms to carry out green innovation. Admittedly, there is a growing body of related studies testing this hypothesis, but most of them mainly focus on the regional (Yao et al., 2021; Zhao et al., 2023a) or firm-level (Wang et al., 2022; Liu and Liu, 2023). Literatures have not yet paid attention to the impact of the ETS on the wider industry-level green innovation. Compared to firm-level innovation, industry-level green innovation includes more information about the technological breakthroughs by the firm and the utilization of the out-source technologies from the universities and the research institutes, which can comprehensively reflect the technological level. Moreover, unlike regional or firm-level studies, the industry-level green innovation is subjected to interdependence between up-stream and down-stream industries, which is known as “supply chain network.” Hence, it is not trivial to assert what effects of the ETS program should have on different industries because the up-stream firms could pass the regulatory costs onto down-stream firms.
Therefore, we exploit the pilot program of Guangdong provincial carbon market to investigate this issue. Compared to other surrounding regions, Guangdong provincial carbon market has following advantages.1 On the supply side, the carbon market in Guangdong has a longer history, and has already developed more matured mechanisms such as auction and trading for the participants. This, in turn, strengthens the incentives of firms to engage in the management of carbon assets, and fosters a more liquid market for revealing carbon prices. On the demand side, Guangdong has the largest and strongest manufacturing sector in China. Given its first place of gross regional products (GRP) in China, Guangdong also witnesses huge amount of carbon emissions to the atmosphere, which is ranking fourth in the country. Hence, there’s a high demand for firms in Guangdong to curb their carbon emission costs in the near future. In addition, the high-quality carbon emissions data also facilitates the opacity of trading systems. The MRV (Monitoring, Reporting and Verification) mechanism in the Guangdong pilot market requires the firms to submit consistent carbon emissions data to the regulator on a daily basis, which improves the information quality of ETS.
How does the green innovation look like in Guangdong then? We measure the green innovation by the number of green patent applications, and illustrate its dynamics in Figure 1, where the dark (light) curve represents compliant (non-compliant) industries. Starting from 2006, we observe a slow but steady increasing trend in green innovation. However, this may be due to the patent application subsidy program issued by the Guangdong government since 2007. This subsidy program is not targeted at specified patents, which is reason why we do not observe difference in both kinds of industries. However, after the first launch of the ETS in 2013 (the vertical dashed line), the difference in green innovation starts to be significant. Interestingly, we find that the increase in non-compliance industries is higher than that of compliance industries. In this paper, we try to theoretically and empirically investigate the inherent explanation for this observation.
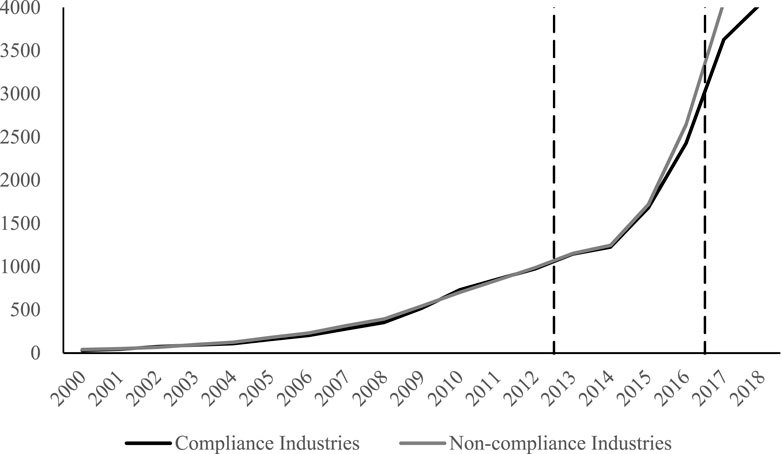
FIGURE 1. Industry-level green patent applications (in logarithm) in Guangdong Province. Note: The vertical dotted lines indicate when the two batches of compliance industries were included in the Guangdong pilot ETS, i.e., 2013 and 2017.
We first provide a Stackelberg model to explain the firm’s green innovation decisions, which incorporates the influence mechanism of the ETS on the green innovation level of compliance industries and non-compliance industries. To simplify our analysis, we assume that compliance industries are up-stream industries providing intermediate good (such as steels, electricity, etc.) as inputs in the production of down-stream industries (such as textile, fabricated metals, electronic machinary, etc.), which is assumed to be non-compliance industries. Our theoretical model shows that, while the regulation on carbon emissions has ambiguous effects on the green innovation of compliance industries, it will increase the price of such intermediate good to pass the cost onto down-stream industries. Thus, the down-stream industries have greater incentives to adopt the green technology to reduce the dependence on such products. Hence, our model hypothesizes that the green innovation will be stronger in non-compliance industries. In what follows, we label this hypothesis the “cost pass-through mechanism.”
Then we test our hypothesis empirically using the industry-level data of Guangdong province. Specifically, we treat the introduction of ETS as a quasi-experiment and examine the effects on industry-level green innovation. The empirical result shows that the ETS effectively improves the green innovation level of compliance industries and non-compliance industries, and the promotion effect on green innovation of non-compliance industries is relatively stronger. This is inline with our theoretical hypothesis about cost pass-through in the supply chain. This difference in policy effects stems from the cost pass-through mechanism, whereby non-compliance industries have stronger incentives to carry out green innovation and adopt recycling technologies instead of purchasing upstream products due to the pressure of emission costs from upstream compliance industries. Further analysis demonstrates that, carbon price and its volatility have significant moderating effects on the effects of the ETS. A smooth increase in carbon price helps to amplify the effects of the ETS in promoting industry-level green innovation.
Our contributions to the extant literature are threefold. First, we provide an explanation in theory for the introduction of ETS on industry-level green innovation from the perspective of supply chain network. Unlike the extant literature, we find that down-stream industries will enhance their green innovation in response of the rising costs from up-stream industries induced by the regulation on carbon emissions. This helps scholars to better understand the inherent mechanism of environmental regulations on the different industries. Second, we disentangle the casual effects of ETS on up-stream and down-stream industries separately from the complicated supply chain network. Our empirical results support this cost pass-through mechanism, providing new evidence of spillover effects of ETS on green innovation via supply chains. The last contribution is that we add to the extant literature by emphasizing the new role of stable carbon prices on enhancing green innovation. Just as other types of innovation, green innovation is a long-run process, which requires smooth cash flows. The volatility of carbon prices will reduce the accuracy of firm’s estimation of future market value of carbon assets and thus is detrimental to persistent green innovation.
The remains of this paper are organized as follows. Section 2 provides a theoretical model to investigate how the ETS affect green innovation, and develop three research hypotheses through the model as well as reviewing some related literature. Section 3 is our research methodology, and the empirical results are discussed in Sections 4, 5 concludes.
Following Julien (2018) and Wang et al. (2021), we conduct a theoretical study based on the supply chain Stackelberg model and introduce the emission coefficient decision-making behaviors of representative firms to represent the industry’s green technology innovation. We focus on three scenarios, namely the unconstrained scenario, the rewarding policies constrained scenario, and the carbon trading system constrained scenario, respectively. China’s climate policy has gone through three phases of “pollution prevention and resource conservation - energy saving and emission reduction - low carbon transition”.2 From the beginning of the 21st century to 2010, the “energy saving and emission reduction” was emphasized, and the rewarding and subsidy policies were the main force to motivate various economic entities to reduce emissions.3 Since 2010, the “low-carbon transition” was emphasized (Du et al., 2022; Liao et al., 2023), and the market-oriented means such as the ETS were designed to economically constrain the emission behavior of economic entities. Therefore, comparing with the unconstrained environment, we focus on the differences on the influence of green innovation in the industry of these two types of policies, i.e., the rewarding policies and the ETS.
Specifically, the model consists of an upstream manufacturing industry that supplies primary products to the downstream industry, and a downstream industry that produces and sells final products. The downstream industry makes production decisions based on the demand for the final product and purchases the corresponding amounts of primary product from the upstream, while the upstream industry makes pricing decisions for the primary products based on the demand for the final products. The upstream industry has market power, acting as the leader in the supply chain, while the downstream industry is the follower. Practically, the industries regulated by the ETS are often in the upstream, with relatively higher emissions. Assume that the upstream industry is a high-emission industry, which would be listed as a compliance industry after the launch of the ETS.4 The downstream industry is assumed to have a relatively low level of carbon emissions. Therefore, it is assumed that the upstream industry has a higher emission coefficient.
First, consider the unconstrained scenario (labeled with N). A representative firm in the upstream industry (Firm 1) faces production costs
A representative firm in the downstream industry (Firm 2) purchases primary products from a representative firm in the upstream industry (Firm 1) to produce final products. Assume that Firm 2 faces primary product procurement costs
Solve this supply chain Stackelberg system by backward induction. The optimal sales price of the upstream representative firm (Firm 1) is shown in Eq. 3, and the optimal output of the downstream representative firm (Firm 2) is shown in Eq. 4:
Obviously, in the unconstrained situation, the emission coefficients of the upstream and downstream representative firms have no influence on their decision-making behaviors, such as price and output. This suggests that without institutional constraints, there is no incentive for both upstream and downstream industries to take the initiative to carry out green innovations in order to reduce their emission coefficients.
In this section, the rewarding policies constraint scenario is considered (labeled with J). Under an reward-based policy, the representative firms in both industries would be rewarded with a certain amount of money after reducing their emission coefficients. Assume that the representative firm
where
Equations 5, 6 form the Stackelberg model of the supply chain under the rewarding policies constraint scenario. The optimal sales price and the optimal emission coefficient of the upstream representative firm (Firm 1) are shown in Eqs 7, 8. The optimal output and the optimal emission coefficient of the downstream representative firm (Firm 2) are shown in Eqs 9, 10:
In terms of operation decisions, the rewarding policy has no effect on the optimal operation decisions of both upstream and downstream industries. Compared with the unconstrained scenario, the optimal sales price decision of upstream representative firm and the optimal production decision of downstream representative firm remain unchanged under the rewarding policies constraint scenario.
In terms of green innovation decisions, the rewarding policy can promote green innovation and reduce the emission coefficient in both upstream and downstream industries. The promotion effect depends on the proportion of the reward amount to the R&D cost. Meanwhile, the promotion effect is stronger for the upstream industry (i.e., compliance industry). On the one hand, the promotion effect of rewarding policies on green innovation in the industry is highly dependent on the reward amount, and the industry’s operation decisions are not influenced by green innovation decisions, so the industry lacks independent incentives for green innovation (Shao et al., 2021; Xia et al., 2022). On the other hand, the rewarding policy has a stronger promotion effect on green innovation in compliance industry. But when the production costs
This result shows that rewarding policies can promote green innovation in the industry, but their effect is mainly determined by the magnitude of rewards. It is difficult to effectively stimulate the industry to carry out green innovation independently and spontaneously. It is also difficult to efficiently guide the social capital to invest in green production technology transformation with government input. Therefore, the effects of rewarding policies are likely to be limited by the scale of government input.
Finally, consider the ETS constraints scenario (labeled with Y). After the launch of the ETS, the upstream industry has to pay additional emission costs. In order to reduce the additional emission costs, the upstream industry makes the decision of emission coefficient and reduces the expenditure of emission costs through green innovation. Under the constraint of the ETS, the profit optimization problem of the representative firm in upstream industry is shown in Eq. 11:
where
Downstream industry does not have to pay additional emission costs, but under the influence of technological upgrading in the upstream industry, it also makes decision on emission coefficient to adjust its reliance on primary products through green technology innovation. The downstream industry carries out green innovation to reduce the purchase of primary products and the related costs by enhancing the recycling of raw materials. It is assumed that the inventory value obtained by the downstream industry through raw material recycling is the product of the inventory value coefficient and the reduction in the demand for primary products per unit of final product, i.e.,
Equations 11, 12 form the Stackelberg model of supply chain under the ETS constraint. The optimal sales price and the optimal emission coefficient of the upstream representative firm are shown in Eqs 13, 14.5 The optimal output and the optimal emission coefficient of the downstream representative firm are shown in Eqs 15, 16:
In terms of the upstream industry’s sales price decision, as shown in Eq. 13, the optimal sales price is higher under the ETS constraints compared with the unconstrained scenario. The higher the optimal adjusted emission coefficient, the higher the optimal sales price. On the one hand, this indicates that the additional emission costs to be paid by the upstream industry will be partially transferred to the downstream industry, which increases the cost of the downstream industry purchasing the upstream primary products. On the other hand, it also indicates that the green innovation of the upstream industry can reduce the impact of the above cost passthrough mechanism on the downstream procurement cost.
In terms of the downstream industry output decision, as shown in Eq. 15, the optimal final product output in the ETS constraint scenario is less than that in the unconstrained scenario. The higher the optimal emission coefficient of the upstream industry, the less the optimal output of the downstream final product. On the one hand, this suggests that the above upstream cost passthrough mechanism will increase downstream procurement costs and reduce downstream output levels. On the other hand, it also indicates that the green innovation of the upstream industry effectively reduces the negative impact of the cost passthrough mechanism on downstream production, which helps improve the production stability of the downstream industry. The upstream industry carries out green innovation and reduces the emission coefficient, effectively controlling the increase in the selling price of primary products and ensuring the smooth operation of the supply chain.
In terms of green innovation decisions in upstream and downstream industries, as shown in Eqs 14, 16, under the ETS constraint, it is difficult to determine the degree of reduction of the emission coefficient of the upstream industry, while that of the downstream industry is significantly observed. For the upstream industry, it is difficult to theoretically examine the effect of the ETS on the reduction of the emission coefficient. The function form is complicated, with a variety of parameters involved in the function. The upstream industry is assumed as the compliance industry. Therefore, it is found that there is a strong uncertainty in the effect of the ETS on green innovation in compliance industries.
For the downstream industry, the ETS can effectively reduce the emission coefficient. The reduction degree
Furthermore, compare the degree of green innovation in compliance and non-compliance industries. The condition
Relevant literatures have found that, the impact of the ETS on green innovation is still controversial. At the firm level, some studies have found that the carbon trading system can effectively promote green innovation in compliance firms (Borghesi et al., 2015; Wang et al., 2022; Liu and Liu, 2023). Mo et al. (2016) and Lin and Tan (2021) both theoretically find that the ETS effectively promote green technology investment. However, Chen et al. (2021) finds that the ETS pilot markets in China reduce the proportion of firms’ green patents, indicating a negative effect on firms’ green innovation. At the regional level, some studies have found that the ETS only has a positive effect on green innovation in some regions (Yao et al., 2021; Zhao et al., 2023a), and even a short-term negative effect in some regions (Zhang et al., 2022). In addition, Du et al. (2021) finds that China’s ETS effectively promotes the level of green innovation in the pilot regions, but has a negative effect on the green innovation in their neighboring regions.
Previous studies have not focused on the effect of the ETS on green innovation in the industry level yet, especially considering the transmissions effect among supply chain. Considering the transmissions effect among supply chain, the existing literatures mainly focus on the effect of the ETS on emission reduction (Zakeri et al., 2015), corporate competitiveness (Wang et al., 2018), and raw materials purchasing strategies (Ma et al., 2018). The effect of the ETS on the industry-level green innovation and its mechanism among the supply chain have not been studied. Yu et al. (2022) adopts the Chinese listed companies’ sample and finds that, the ETS effectively promotes green innovation in downstream firms, but inhibits green innovation in upstream firms. However, their findings are mixed with disturbing factors such as the implementation differences of the ETS pilots within different regions, which may lead to the misjudgment of policy effects. Based on the existing literatures, combined with the theoretical results Eqs 14, 16, we propose Hypothesis 1.
Hypothesis 1. The ETS can effectively promote industry green innovation, and the effect on non-compliance industry would be stronger than that on compliance industry.
Further, we consider the internal mechanism for the ETS promoting green innovation in different type of industries. The theoretical results reveal that, the heterogeneous promotion effects on compliance and non-compliance industries stem from the cost passthrough mechanism. Under the ETS constraint, the compliance industry pays additional emission costs, part of which will be passed on to the non-compliance industry (Eq. 13). In response to this cost pressure, the non-compliance industry reduces its reliance on the primary products from the compliance industry (Eq. 15) by carrying out green innovation and enhancing recycling capacity (Eq. 16), which aims to reduce the operating costs. The compliance industry tries to avoid a decrease in the demand for its primary products (Eq. 15), carrying out green innovation in order to mitigate the increase in the price of primary products (Eq. 13), which will alleviate the cost pressure on the non-compliance industry. Under this mechanism, the non-compliance industry has a stronger incentive to carry out green innovation aiming to reduce production costs, which means that green innovation may help reduce the operating costs of the non-compliance industry. If the level of green innovation is low in the non-compliance industry, the incentive for green innovation in the compliance industry would be subsequently lower. Then the non-compliance industry would be subject to a more severe cost passthrough and rising operating costs.
Cost passthrough phenomenon are found in a large body of theoretical literatures concerning the policy effects of the ETS in various aspects (Demailly and Quirion, 2008; Chaabane et al., 2012). Some literatures even directly introduce cost passthrough mechanism into the theoretical models (Wang et al., 2018). Recent studies have begun to measure the extent of cost passthrough and its impact on social welfare. Marin et al. (2018) finds that the EU ETS raises price markups by about 1.5%–3.2%. Ju and Fujikawa (2019) find that after the launch of China’s national ETS in 2021, the regulated power sector passes the additional emission costs to various manufacturing industries, with a higher degree of cost passthrough to carbon trading pilot regions. They find that the cost passthrough leads to carbon emissions leakage from the pilot regions to non-pilot regions, with higher profits and higher household consumption levels in non-pilot regions. However, the existing literatures have not yet focused on innovation activities under the cost passthrough mechanism. Therefore, combining the theoretical model and related literatures, we propose Hypothesis 2.
Hypothesis 2. The ETS reduces operating costs in non-compliance industries by promoting green innovation.
Further consider the influence of market performances in the ETS on the ETS promotion effect. The theoretical results show that the degree of green innovation in compliance industry is affected by the carbon price and its volatility (Eq. 13). The representative firm anticipates the level of emission costs based on their expectations of the future carbon price, and thus adjusts the operation and innovation decisions.
The recent literatures have likewise found a similar phenomenon. It is found that the carbon price and the volatility have significant impacts on carbon emission reductions (Li et al., 2017; Wu, 2022), firms’ total factor productivity (Wu and Wang, 2022), financial market performances (Knight, 2011; Adekoya et al., 2021; Zhao et al., 2023b), macroeconomic development (Lin and Jia, 2019) and many other aspects. Among them, some literatures have found a positive effect of carbon price on green innovation (Cui et al., 2014). However, the effect of carbon price volatility on innovation, especially on green innovation, is controversial. Some literatures argue that higher volatility promotes firm innovation (Weber and Neuhoff, 2010; Lv and Bai, 2021). A number of literatures, however, find that the carbon price stability can effectively promote innovation, especially green innovation (Zakeri et al., 2015; Venmans, 2016; Yao et al., 2021; Yu et al., 2022). Combining the theoretical results (Eq. 13), we examine the moderating effect of carbon price and its volatility on the ETS promotion effect in industry-level green innovation. We propose Hypothesis 3.
Hypothesis 3. There is a moderating effect of carbon price and its volatility on the effectiveness of the ETS in promoting green innovation in compliance industries.
Based on the theoretical study by the supply chain Stackelberg model, we find that the ETS has a heterogeneous promotion effect on the green innovation of compliance industries and non-compliance industries. The promotion effect of the ETS on green innovation of compliance industries is difficult to determine, while that of non-compliance industries is more obvious. To verify Hypothesis 1, we adopt a multi-period DID model, and simultaneously examine the treatment effects on the experimental group and the control group, empirically testing the effects of the ETS on green innovation in the two types of industries. We adopt Eq. 17 to verify Hypothesis 1:
where
Some literatures point out the lag in the impact of policy implementation on the level of innovation, especially patent output (Chu et al., 2019). Therefore, in order to systematically and comprehensively test the comprehensive impact of the ETS on industry green innovation, we separately consider the lead period
Further, the mechanism underlying the heterogeneous policy effects is examined. The theoretical results reveal that the heterogeneous promotion effect of the ETS on green innovation between compliance and non-compliance industries stems from the cost passthrough mechanism. The ETS requires the compliance industries to pay additional emission costs, part of which would be passed onto the non-compliance industries. Under the pressure of the rising costs, the non-compliance industries are forced to reduce their reliance on primary products from the compliance industries, by carrying out green innovation to enhance the recycling capacity. Under this mechanism, the non-compliance industries have stronger incentives to carry out green innovation aimed at reducing production costs, which means that green innovation may help reduce the cost ratio of the non-compliance industry. If the level of green innovation is low in the non-compliance industries, the incentives for green innovation in the compliance industries would be subsequently lower, and then the non-compliance industries would be subject to a more severe cost passthrough and increasing ratios. To verify this cost passthrough mechanism, we also adopt the multi-period DID model to test Hypothesis 2, empirically testing the moderating effect of green innovation on the effect of the ETS on the cost ratio of the two types of industries. We use Eq. 18 to verify Hypothesis 2:
where
Finally, we examine the differences in the effects of the ETS on the promotion of green innovation under different environments. We conduct a heterogeneity analysis based on the perspective of the market performances of the ETS. The theoretical results reveal that, after the launch of the ETS, the green innovation decisions of non-compliance industries are not affected by the market performances, while that of compliance industries would be affected by the performances. We focus on the two factors of the market performances, carbon price and its volatility, respectively. We empirically test the moderating effect of carbon price and its volatility on the impact of the ETS on promoting green innovation in industries. We adopt Eq. 19 to verify Hypothesis 3:
where
In order to accurately and comprehensively examine the effect of the ETS on the level of green innovation in the industry, we use data from the Guangdong pilot ETS during 2000–2018, covering 40 manufacturing industries in Guangdong Province. The Guangdong pilot ETS is highly representative and high-quality developed among China’s ETS pilot regions. Summarizing the successes and potential problems in Guangdong, can provide an important reference for the development and improvement of national and regional pilot markets. Our sample covers the whole process of China’s climate policy from international commitments, administrative management to market-based management tools, and excludes the impact of COVID-19 shock on China’s manufacturing industry production and operation. Therefore, our sample can comprehensively reflect the effect of the ETS on the industry-level green innovation. Supplementary Table S1 shows the data sources and descriptions about the variables.
Table 1 shows the statistical characteristics of the variables. In terms of the green innovation, the average value of green patent applications (in logarithm) is more than 4.5, but the average value of the share of green patent applications is only about 16.6%. This suggests that, there are more green patent applications in various industries in Guangdong Province, but there is still a large potential for improvement compared to non-green patents. In terms of the performances of the emission trading market, the carbon price was at a relatively low level. The volatility was not high in general, but severe fluctuations occurred in some years. In terms of the cost ratio, the average is about 81.8%, indicating that the cost burdens of industries in Guangdong Province are generally high.
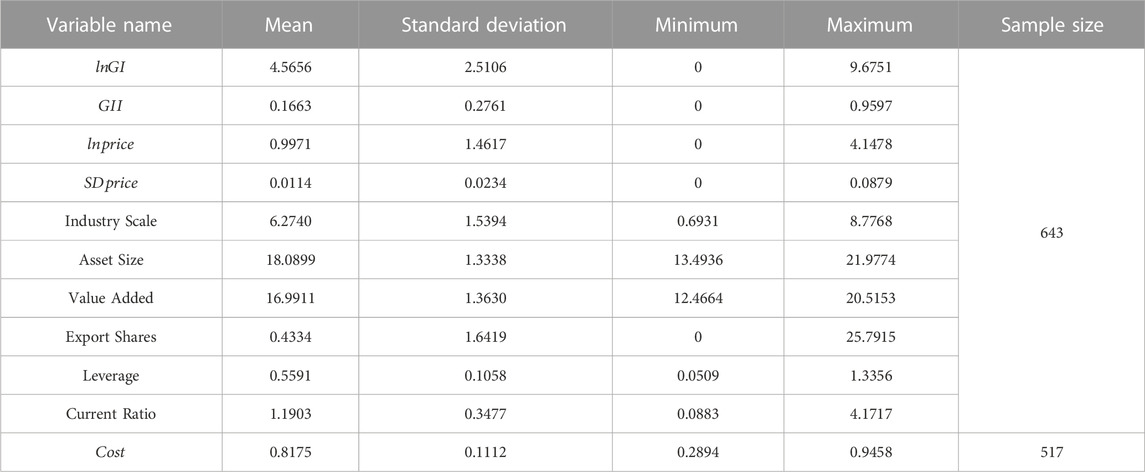
TABLE 1. Statistical characteristics of the variables.
The theoretical results show that, the effect of the ETS on green innovation in compliance industry is difficult to confirm, while an obvious promotion effect in non-compliance industry can be observed. The promotion effect on green innovation in non-compliance industry is relatively stronger. We consider the possible lag in treatment effect, and use the multi-period DID model (Eq. 17a) to verify Hypothesis 1. Figure 1 shows that, the sample data satisfy the parallel trend assumption, so the multi-period DID model is applicable to the sample data. Table 2 shows the empirical results when the number of green patent applications
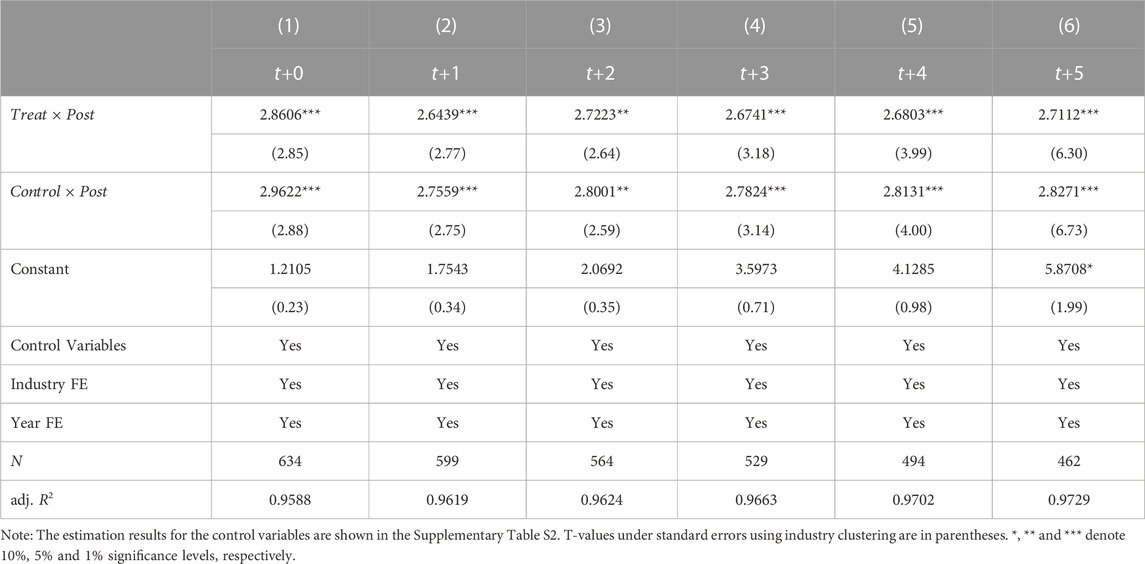
TABLE 2. Effect of the ETS on green patent applications (
The results show that the ETS can significantly and consistently increase the number of green patent applications in both compliance and non-compliance industries, with a stronger promotion in non-compliance industries. After the launch of the ETS, the number of green patent applications in compliance industry will increase by about 267%∼286%, while that in non-compliance industry will increase by about 276%∼296%. Moreover, in any leading period
Table 3 illustrates the results when share of green patent applications
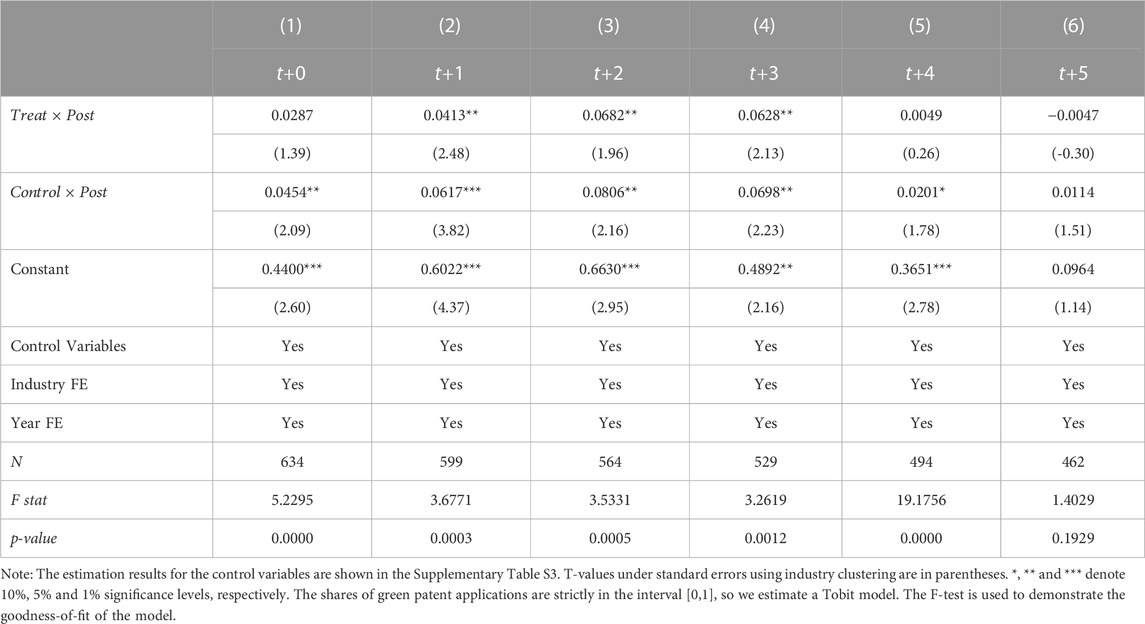
TABLE 3. Effect of the ETS on the share of green patent applications (
The theoretical results reveal that, considering the upstream and downstream transmission in the supply chain, there is a strong uncertainty in the promotion effect of carbon trading system on green innovation in compliance industries, while the promotion effect in the corresponding downstream industries is more deterministic. Therefore, we construct several sub-samples, each of which includes one compliance industry and its corresponding downstream non-compliance industries. We judge the corresponding downstream industries of each compliance industry according to the 2012 Guangdong input-output table.7 If the proportion of the intermediate inputs of an industry from the compliance industry
We conduct DID model tests for each sub-sample, respectively. Supplementary Table S5 shows the empirical results when green patent applications
Supplementary Table S6 illustrates the empirical results when the share of green patent applications
After considering the industry correspondence among the supply chain, the results are still consistent with the baseline conclusions and the theoretical results. The ETS effectively promotes green innovation in compliance industries and has a stronger effect in non-compliance industries.
A large body of literatures have found that there are significant differences between different types of patents, which may be affected differently by the ETS (Du et al., 2021; Wang et al., 2022). Invention patents refer to “new technical solutions for products, methods or their improvements”, which can protect not only the products, but also the manufacturing processes. Utility model patents refer to “new practical technical solutions for the shapes, structures or their combinations of the products,” focusing on the protection of the physical products.8 Therefore, we test the robustness of the baseline conclusions by examining the effect of the ETS on different types of green innovations, respectively.
Supplementary Table S7 shows the empirical results considering the type of invention patents. The results show that the stronger promotion effect of the ETS on green innovation in non-compliance industries still exists. On the one hand, the ETS effectively increases the number of green patent applications of the invention patents in both compliance and non-compliance industries, while the promotion effect is stronger in non-compliance industries. On the other hand, the ETS fails to increase the share of green patent applications of invention patents in compliance industries, while it can still increase that in non-compliance industries.
Supplementary Table S8 shows the empirical results considering the type of utility model patents. In terms of the number of patent applications, the ETS effectively increases the number of green patent applications of utility models in both compliance and non-compliance industries, with a stronger promotion effect in non-compliance industries. However, in terms of the share of patent applications, a stronger promotion effect of the ETS in compliance industries is observed. This is due to the fact that utility model patents focus on the protection of specific products, which deviates from the recycling goals of green innovation in the non-compliance industries. The non-compliance industries conduct green innovation aiming to enhance recycling capacity and to produce existing final products with fewer primary products. Therefore, green innovation in the non-compliance industries focuses on invention patent types to protect its recycling technology and related processes.
Taken together, the baseline conclusion still holds after considering different patent types. The ETS can effectively promote green innovation in both compliance and non-compliance industries, with a stronger promotion effect in non-compliance industries, especially in the field of green invention patents.
Some literatures find the continuity of innovation, a phenomenon that the accumulation of prior innovation outputs can contribute to future outputs (Fassio et al., 2019). We adopt a system GMM model to control the endogeneity problem caused by the continuity of patent applications, as shown in Eq. 20. The estimation results are shown in Supplementary Table S9.
The results show that, after considering endogeneity, the ETS still has a significant promotion effect on the green innovation in both compliance and non-compliance industries, with a stronger effect in non-compliance industries. The promotion effect is still persistent, but the duration of the treatment effect is shortened to the current year and the next year. The results suggest that the baseline conclusion still holds after considering endogeneity issues.
Some literatures point out that, there may be the phenomenon of a small number of high-value patents (Chemmanur and Tian, 2018). The number of patents may be difficult to effectively reflect the technological improvements and breakthroughs. Therefore, we introduce the value of the green patents (
Equation 17a is estimated to examine the effect of the ETS on the value of the green patents, and the results are shown in Table 4. The results show that the ETS significantly increases the value of green patents in both compliance and non-compliance industries, and the promotion effect in non-compliance industries is relatively stronger. Moreover, the promotion effect of the ETS on industry-level green innovation is still sustainable to a certain extent. The results suggest that, after considering the value of patents as the proxy for green innovation, the baseline conclusions still hold.
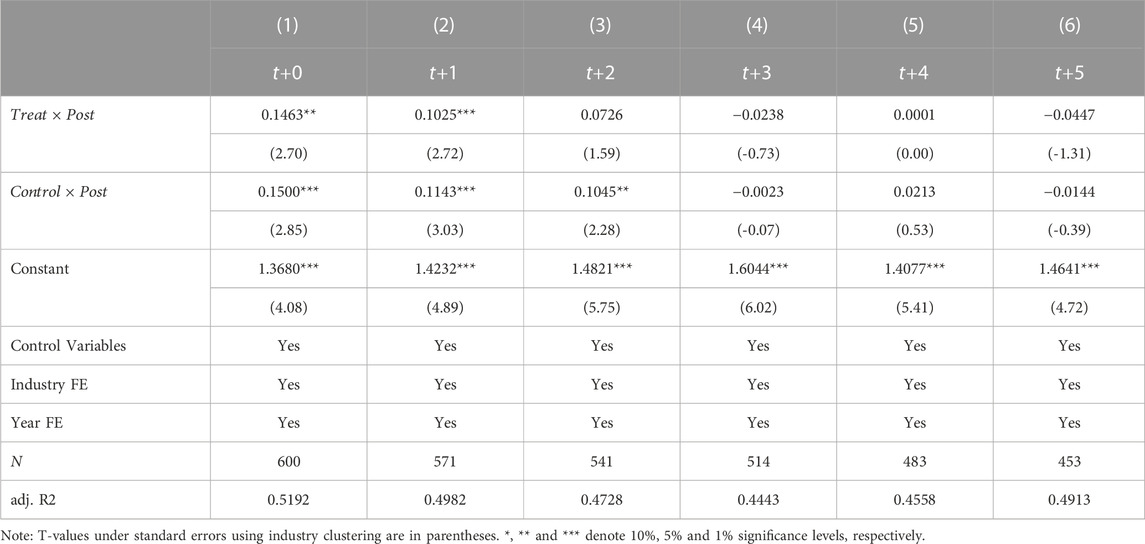
TABLE 4. Effect of the ETS on the value of green patent applications (lnGIV) in compliance and non-compliance industries.
Theoretical results reveal that, under the cost passthrough mechanism, the ETS has a relatively stronger promotion effect in non-compliance industries. Forced by the supply passthrough from compliance industries, non-compliance industries have stronger incentives to carry out green innovation, in order to avoid a significant increase in operating costs. Therefore, after the launch of the ETS, the non-compliance industries with higher level of green innovation may realize a reduction in their operating costs. For Hypothesis 2, we adopt Eq. 18 to test the moderating effect of green innovation on the effect of the ETS on the industry cost ratios. The results are shown in Supplementary Table S10.
The results show that green innovation effectively reduce the cost ratios of non-compliance industries after the launch of the ETS. Under different proxy variables for green innovation, the coefficients of
The theoretical results reveal that the promotion effect of the ETS on green innovation in compliance industries is affected by the market performances in the ETS, while that in non-compliance industries is not affected by these factors. We focus on the two types of the market performances, carbon price and its volatility. The moderating effect of the carbon price and its volatility on the ETS promotion effect on industry-level green innovation is examined by estimating Eq. 19. The results are shown in Supplementary Table S11.
The results show that, compared to the non-compliance industries, the market performances of the ETS, especially the carbon price volatility, have more significant moderating effects on the effectiveness of the ETS in promoting green innovation in the compliance industries. In terms of carbon price, higher carbon price only promotes the green patent applications in both industries in the short term, with a more persistent effect in compliance industries. The ETS promotion effect on the share of green patent applications is not affected by the carbon price. In terms of carbon price volatility, lower volatility can continuously increase the number of green patent applications in both industries, and continuously increase the share of green patent applications in compliance industries.
These results suggest that, the promotion effect of the ETS on industry-level green innovation can be improved under a steadily rising carbon price. A smooth and orderly market helps to continuously incentivize green innovation in the industry. Severe price fluctuations are difficult to send stable price signals to the firms, which will inhibit their decisions on green innovation. The volatility and the uncertainty of carbon price will inhibit the incentives of the firms for green innovation, reducing the level of green innovation in the industry.
In this paper, we theoretically and empirically investigate the effects of ETS on industry-level green innovation. We first establish a Stackelberg-type model incorporating supply chain network to illustrate the cost pass-through mechanism of the ETS on the industry-level green innovation. Then, we empirically testing the above mechanism in the Guangdong pilot market, a highly representative ETS market in China. We find that the ETS effectively promotes green innovation in both compliance industries and non-compliance industries, with a relatively stronger effect in non-compliance industries. The mechanism analysis show that the compliance industries will pass the regulatory costs onto non-compliance industries through the supply chain network. Hence, the non-compliance industries aim to reduce the burden from compliance industries through green innovation. Furthermore, our paper identifies the moderating effect of the market performances on the impact of the ETS on green innovation. The increase in carbon prices amplifies the promotion effect of the ETS on the green innovation in compliance industries in the short term, while its volatility continuously inhibits the promotion effect of the ETS.
The policy implications of the results are as follows:
First, the policymaker should encourage the up-stream and down-stream technological coordination and cooperation along the supply chain, and thus strengthen the transmission effect of the ETS in promoting industry-level green innovation. The ETS incentivizes industries to carry out green innovation independently, in which the green innovation incentives of the up-stream industry originate from the product substitution effect of the down-stream innovation on recycling technology. Strengthening up-stream and down-stream technological coordination and cooperation in the supply chain not only shows the direction of development in recycling technology to own-stream industries, but also helps the upstream industries explore new technology to reduce the price of intermediate goods. This leads to an improvement of the green production capacity in both the up-stream and the down-stream.
Secondly, it is crucial to foster a consistently rising market expectation of carbon pricing, thereby incentivizing businesses to engage in sustained green innovation and enhance their green production efficiency over the long term. Prolonged green innovation efforts play a pivotal role in striking an equilibrium between emissions reduction and economic development, which is foundational for the successful attainment of the “Dual Carbon” goals with a strong emphasis on quality. The establishment of a stable market expectation of an incrementally increasing carbon price serves as the bedrock for the effective promotion of industry-level green innovation through the Emission Trading Scheme (ETS). To achieve this, it is imperative to design a well-structured and enduring system for allocating emission allowances. This allocation mechanism should communicate stable expectations to market participants, encouraging firms to proactively plan their operational and research and development (R&D) strategies. This proactive approach motivates enterprises to pursue green innovation and enhance the efficiency of emissions reduction.
Publicly available datasets were analyzed in this study. This data can be found here: www.incopat.com www.epsnet.com.cn, www.wind.com.cn, www.wipo.int.gdee.gd.gov.cn.
KZ: Conceptualization, Funding acquisition, Writing–original draft, Writing–review and editing. ZG: Formal Analysis, Methodology, Writing–original draft, Writing–review and editing. YL: Project administration, Supervision, Writing–original draft, Writing–review and editing.
The author(s) declare financial support was received for the research, authorship, and/or publication of this article. This study was supported by Research Center for Pilot Demonstration Area of Socialism with Chinese Characteristics (Grant No. SFQZX2106), Major Project of the National Social Science Fund of China (Grant No. 20&ZD103), Research Capacity Enhancement Project of Key Construction Discipline in Guangdong Province (Grant No. 2022ZDJS150), National Natural Science Foundation of China (Grant No. 72002074), Special Innovation Projects in Ordinary Universities in Guangdong Province (Grant No. 2023WTSCX016).
The authors declare that the research was conducted in the absence of any commercial or financial relationships that could be construed as a potential conflict of interest.
All claims expressed in this article are solely those of the authors and do not necessarily represent those of their affiliated organizations, or those of the publisher, the editors and the reviewers. Any product that may be evaluated in this article, or claim that may be made by its manufacturer, is not guaranteed or endorsed by the publisher.
The Supplementary Material for this article can be found online at: https://www.frontiersin.org/articles/10.3389/fenvs.2023.1332224/full#supplementary-material
1Supplementary Table S12 shows the comparison on Guangdong and the other regional pilot markets.
2From the 1980s to the end of the 1990s, China’s climate policy focused on pollution prevention and resource conservation. In 1998, China signed the Kyoto Protocol, which was formally ratified in 2002. Since the Eleventh Five-Year Plan in 2006, China’s climate policy has begun to focus on energy conservation and emission reduction, with the connotation of “emission reduction” at this time still focusing on the reduction of various types of pollutant emissions. Since 2010, China’s climate policy has strengthened its focus on low-carbon transformation, emphasizing energy conservation, carbon reduction and efficiency, focusing on reducing the level of carbon emissions, improving the efficiency of carbon emissions, and developing a low-carbon economy. Since the 2011 Twelfth Five-Year Plan, the reduction of carbon dioxide emissions per unit of gross domestic product has been included as a binding indicator in the outline of the five-year plan for national economic and social development, and has been decentralized to localities for implementation.
3Typical measures of rewarding policies are to provide cash rewards of a fixed amount or a fixed proportion of the investment amount to enterprises that have obtained green production certifications (such as “carbon neutral enterprise” certifications, etc.), low-carbon demonstration parks or enterprises, and enterprises that have achieved the national advanced value of energy consumption per unit of product after the implementation of technological transformation projects. Typical measures of subsidized policies are the provision of special financial support for enterprises’ green technology R&D investment in order to reduce their technology R&D costs. In addition to the above two types of policies, punitive policies are also a commonly used type of environmental regulatory policies in China, which focus on penalizing enterprises with high levels of pollutions (e.g., PM2.5, etc.) rather than controlling the level of carbon emissions of enterprises in the implementation process. Therefore, we have not considered the impact of punitive policies for the time being.
4Supplementary Table S13 shows the extent of upstream and downstream for each industry in Guangdong Province. Compliance industries tend to be in the upstream. Although the cement and paper industries have a small number of corresponding downstream industries, they have a relatively high share of inputs in the corresponding downstream industries, about 47% and 36%, respectively. Most of the non-compliance industries are downstream industries. Only a small number of non-compliance industries tend to be in upstream, such as metal products and electrical machinery manufacturing. However, the input shares of these industries in the corresponding downstream industries are relatively low, all within the range of 5%–20%.
5
6Compliance year refers to the time of trading of allowances corresponding to the carbon emissions of a firm during the fiscal year. Generally speaking, the regulator allocates allowances to firms in the middle of the fiscal year, and firms can start trading allowances for this fiscal year. At the end of the fiscal year, after the firm completes its production and emissions, the regulator starts to verify the enterprise’s emissions data and determine the amounts of allowances that the firm needs to submit. In the middle of the next fiscal year, the regulator requires the firm to submit the allowances corresponding to the carbon emissions in the last fiscal year, and the trade of the allowances for the last fiscal year are stopped. Therefore, the trading time of allowances corresponding to carbon emissions of enterprises in fiscal year
7In addition to the 2012 input-output table, the 2007 and 2017 input-output tables are also used, leading to basically the same results as the 2012 ones.
8Definitions of the patent types are taken from the Patent Law of the People’s Republic of China.
Adekoya, O. B., Oliyide, J. A., and Noman, A. (2021). The volatility connectedness of the EU carbon market with commodity and financial markets in time-and frequency-domain: the role of the US economic policy uncertainty. Resour. Policy 74, 102252. No.102252. doi:10.1016/j.resourpol.2021.102252
Borghesi, S., Cainelli, G., and Mazzanti, M. (2015). Linking emission trading to environmental innovation: evidence from the Italian manufacturing industry. Res. Policy 44 (3), 669–683. doi:10.1016/j.respol.2014.10.014
Chaabane, A., Ramudhin, A., and Paquet, M. (2012). Design of sustainable supply chains under the emission trading scheme. Int. J. Prod. Econ. 135 (1), 37–49. doi:10.1016/j.ijpe.2010.10.025
Chemmanur, T., and Tian, X. (2018). Do antitakeover provisions spur corporate innovation? A regression discontinuity analysis. J. Financial Quantitative Analysis 53 (3), 1163–1194. doi:10.1017/s0022109018000029
Chen, Z., Zhang, X., and Chen, F. (2021). Do carbon emission trading schemes stimulate green innovation in enterprises? Evidence from China. Technol. Forecast. Soc. Change 168, 120744. No.120744. doi:10.1016/j.techfore.2021.120744
Chu, Y., Tian, X., and Wang, W. (2019). Corporate innovation along the supply chain. Manag. Sci. 65 (6), 2445–2466. doi:10.1287/mnsc.2017.2924
Cui, J., Zhang, J., and Zheng, Y. (2014). Carbon pricing induces innovation: evidence from China's regional carbon market pilots. AEA Pap. Proc. 108, 453–457. doi:10.1257/pandp.20181027
Demailly, D., and Quirion, P. (2008). European emission trading scheme and competitiveness: a case study on the iron and steel industry. Energy Econ. 30 (4), 2009–2027. doi:10.1016/j.eneco.2007.01.020
Du, G., Yu, M., Sun, C., and Han, Z. (2021). Green innovation effect of emission trading policy on pilot areas and neighboring areas: an analysis based on the spatial econometric model. Energy Policy 156, 112431. No.112431. doi:10.1016/j.enpol.2021.112431
Du, M., Feng, R., and Chen, Z. (2022). Blue sky defense in low-carbon pilot cities: a spatial spillover perspective of carbon emission efficiency. Sci. Total Environ. 846, 157509. No.157509. doi:10.1016/j.scitotenv.2022.157509
Du, M., Wu, F., Ye, D., Zhao, Y., and Liao, L. (2023). Exploring the effects of energy quota trading policy on carbon emission efficiency: quasi-experimental evidence from China. Energy Econ. 124, 106791. No.106791. doi:10.1016/j.eneco.2023.106791
Fassio, C., Montobbio, F., and Venturini, A. (2019). Skilled migration and innovation in European industries. Res. Policy 48 (3), 706–718. doi:10.1016/j.respol.2018.11.002
Hu, Y., Ren, S., Wang, Y., and Chen, X. (2020). Can carbon emission trading scheme achieve energy conservation and emission reduction? evidence from the industrial sector in China. Energy Econ. 85, 104590. No.104590. doi:10.1016/j.eneco.2019.104590
Ju, Y., and Fujikawa, K. (2019). Modeling the cost transmission mechanism of the emission trading scheme in China. Appl. Energy 236, 172–182. doi:10.1016/j.apenergy.2018.11.068
Knight, E. R. W. (2011). The economic geography of European carbon market trading. J. Econ. Geogr. 11 (5), 817–841. doi:10.1093/jeg/lbq027
Li, G., Yang, J., Chen, D., and Hu, S. (2017). Impacts of the coming emission trading scheme on China's coal-to-materials industry in 2020. Appl. Energy 195, 837–849. doi:10.1016/j.apenergy.2017.03.115
Liao, L., Du, M., and Chen, Z. (2023). Environmental pollution and socioeconomic health inequality: evidence from China. Sustain. Cities Soc. 95, 104579. No.104579. doi:10.1016/j.scs.2023.104579
Lin, B., and Jia, Z. (2019). Impacts of carbon price level in carbon emission trading market. Appl. Energy 239, 157–170. doi:10.1016/j.apenergy.2019.01.194
Lin, B., and Tan, Z. (2021). How much impact will low oil price and carbon trading mechanism have on the value of carbon capture utilization and storage (CCUS) project? analysis based on real option method. J. Clean. Prod. 298, 126768. doi:10.1016/j.jclepro.2021.126768
Liu, J., and Liu, X. (2023). Effects of carbon emission trading schemes on green technological innovation by industrial enterprises: evidence from a quasi-natural experiment in China. J. Innovation Knowl. 8 (3), 100410. No.100410. doi:10.1016/j.jik.2023.100410
Lv, M., and Bai, M. (2021). Evaluation of China's carbon emission trading policy from corporate innovation. Finance Res. Lett. 39, 101565. No.101565. doi:10.1016/j.frl.2020.101565
Ma, X., Ho, W., Ji, P., and Talluri, S. (2018). Contract design with information asymmetry in a supply chain under an emissions trading mechanism. Decis. Sci. 49 (1), 121–153. doi:10.1111/deci.12265
Marin, G., Marino, M., and Pellegrin, C. (2018). The impact of the European Emission Trading Scheme on multiple measures of economic performance. Environ. Resour. Econ. 71, 551–582. doi:10.1007/s10640-017-0173-0
Mo, J., Agnolucci, P., Jiang, M., and Fan, Y. (2016). The impact of Chinese carbon emission trading scheme (ETS) on low carbon energy (LCE) investment. Energy Policy 89, 271–283. doi:10.1016/j.enpol.2015.12.002
Shao, W., Yang, K., and Bai, X. (2021). Impact of financial subsidies on the R&D intensity of new energy vehicles: a case study of 88 listed enterprises in China. Energy Strategy Rev. 33, 100580. No.100580. doi:10.1016/j.esr.2020.100580
Venmans, F. M. J. (2016). The effect of allocation above emissions and price uncertainty on abatement investments under the EU ETS. J. Clean. Prod. 126, 595–606. doi:10.1016/j.jclepro.2016.02.108
Wang, B., Ji, F., Zheng, J., Xie, K., and Feng, Z. (2021). Carbon emission reduction of coal-fired power supply chain enterprises under the revenue sharing contract: perspective of coordination game. Energy Econ. 102, 105467. No.105467. doi:10.1016/j.eneco.2021.105467
Wang, C., Wang, Z., Ke, R., and Wang, J. (2018). Integrated impact of the carbon quota constraints on enterprises within supply chain: direct cost and indirect cost. Renew. Sustain. Energy Rev. 92, 774–783. doi:10.1016/j.rser.2018.04.104
Wang, L., Long, Y., and Li, C. (2022). Research on the impact mechanism of heterogeneous environmental regulation on enterprise green technology innovation. J. Environ. Manag. 322, 116127. No.116127. doi:10.1016/j.jenvman.2022.116127
Weber, T. A., and Neuhoff, K. (2010). Carbon markets and technological innovation. J. Environ. Econ. Manag. 60 (2), 115–132. doi:10.1016/j.jeem.2010.04.004
Wu, Q. (2022). Price and scale effects of China's carbon emission trading system pilots on emission reduction. J. Environ. Manag. 314, 115054. No.115054. doi:10.1016/j.jenvman.2022.115054
Wu, Q., and Wang, Y. (2022). How does carbon emission price stimulate enterprises' total factor productivity? Insights from China's emission trading scheme pilots. Energy Econ. 109, 105990. No.105990. doi:10.1016/j.eneco.2022.105990
Xia, L., Gao, S., Wei, J., and Ding, Q. (2022). Government subsidy and corporate green innovation-Does board governance play a role? Energy Policy 161, 112720. No.112720. doi:10.1016/j.enpol.2021.112720
Yao, S., Yu, X., Yan, S., and Wen, S. (2021). Heterogeneous emission trading schemes and green innovation. Energy Policy 155, 112367. No.112367. doi:10.1016/j.enpol.2021.112367
Yu, H., Jiang, Y., Zhang, Z., Shang, W., Han, C., and Zhao, Y. (2022). The impact of carbon emission trading policy on firms' green innovation in China. Financ. Innov. 8 (1), 55. No.55. doi:10.1186/s40854-022-00359-0
Zakeri, A., Dehghanian, F., Fahimnia, B., and Sarkis, J. (2015). Carbon pricing versus emissions trading: a supply chain planning perspective. Int. J. Prod. Econ. 164, 197–205. doi:10.1016/j.ijpe.2014.11.012
Zhang, H., Duan, M., and Deng, Z. (2019). Have China's pilot emissions trading schemes promoted carbon emission reductions? the evidence from industrial sub-sectors at the provincial level. J. Clean. Prod. 234, 912–924. doi:10.1016/j.jclepro.2019.06.247
Zhang, W., Li, G., and Guo, F. (2022). Does carbon emissions trading promote green technology innovation in China? Appl. Energy 315, 119012. No.119012. doi:10.1016/j.apenergy.2022.119012
Zhao, X., Lu, W., Wang, W., and Hu, S. (2023a). The impact of carbon emission trading on green innovation of China's power industry. Environ. Impact Assess. Rev. 99, 107040. doi:10.1016/j.eiar.2023.107040
Keywords: industry green innovation, emission trading scheme, cost pass-through mechanism, carbon price, carbon price volatility
Citation: Zhou K, Guan Z and Lu Y (2023) Does China’s emission trading scheme promote industry-level green innovation: evidence from Guangdong pilot market. Front. Environ. Sci. 11:1332224. doi: 10.3389/fenvs.2023.1332224
Received: 03 November 2023; Accepted: 21 November 2023;
Published: 07 December 2023.
Edited by:
Yantuan Yu, Guangdong University of Foreign Studies, ChinaReviewed by:
Ping Wei, Central South University, ChinaCopyright © 2023 Zhou, Guan and Lu. This is an open-access article distributed under the terms of the Creative Commons Attribution License (CC BY). The use, distribution or reproduction in other forums is permitted, provided the original author(s) and the copyright owner(s) are credited and that the original publication in this journal is cited, in accordance with accepted academic practice. No use, distribution or reproduction is permitted which does not comply with these terms.
*Correspondence: Yunzhi Lu, eXVuemhpLmx1QG0uc2NudS5lZHUuY24=
Disclaimer: All claims expressed in this article are solely those of the authors and do not necessarily represent those of their affiliated organizations, or those of the publisher, the editors and the reviewers. Any product that may be evaluated in this article or claim that may be made by its manufacturer is not guaranteed or endorsed by the publisher.
Research integrity at Frontiers
Learn more about the work of our research integrity team to safeguard the quality of each article we publish.