 Junfei Li1
 Li Sun
 Shuying Zang
 Jiao Wang
- 1Heilongjiang Province Key Laboratory of Geographical Environment Monitoring and Spatial Information Service in Cold Regions, Harbin Normal University, Harbin, China
- 2Heilongjiang Province Collaborative Innovation Center of Cold Region Ecological Safety, Harbin, China
- 3Department of Obstetrics and Gynecology, The First Affiliated Hospital of Harbin Medical University, Harbin Medical University, Harbin, China
Heavy pollution episodes frequently occurred in winter in northeast China due to the multiple anthropogenic emissions coupled with adverse meteorological conditions, which increased the difficulty of environmental pollution control. To better enact strategies for mitigating air pollution in the post-pandemic era, daily pollutant concentration monitoring and meteorological data were used to evaluate the changes and meteorological factors of air pollutants before (2019) and during (2020) the lockdown in Harbin City, northeast China. Moreover, typical pollution episodes under COVID-19 lockdown were identified, and their emission sources, meteorology conditions, and regional pollution transportation were analyzed. The results showed significant decreases in NO2, PM10 and CO, while O3 increased, and no differences in PM2.5 and SO2 during the lockdown compared with non-lockdown periods. It indicated that reduced activities of transportation resulted in reductions of NO2 concentrations by 16%, and stationary emission sources were less affected. Correlation between PM2.5 and O3 tended to change from positive to negative as the threshold of PM2.5 = 90 μg m−3, with the main controlling factor changed from their common gaseous precursors to meteorological conditions (temperature <0°C and wind speed <2 m s−1). Pollution days were concentrated in the COVID-19 lockdown period with PM2.5 as the primary pollutant. SO2 dominant pollution and PM2.5 dominant pollution were distinguished from six sustained heavy pollution events. PM2.5 and SO2 played essential roles in SO2 dominant pollution, which derived from local emissions of coal combustion and firework discharge. PM2.5 dominant pollution might be chemical transformed from coal burning, vehicle exhaust, and other secondary precursors, which was affected and aggravated by CO, NO2, high relative humidity and low wind speed affected by local emission and long-distance transport.
1 Introduction
Harbin is a cold metropolis, which is a provincial capital city that is located at the highest latitude and experiences the lowest temperature in China. As a heavily industrialized and agricultural city, it has significant atmospheric pollution due to its large population and history as a former industrial base in northeast China (Sun et al., 2023). In response to the severe air pollution, China has been actively implementing the Atmospheric Pollution Prevention and Control Action Plan (APPCAP) since 2013, significantly reducing the concentration of particulate matter (PM) pollution and effectively alleviating long-term haze conditions (Wang et al., 2017). But even so, PM2.5-dominated atmospheric pollution frequently occurred during winter mouths against the backdrop of continuous improvement in annual air quality in China (Sun et al., 2020). There are many causes leading to Harbin’s severe PM pollution, the most important reason is the release of coal during the long heating season (Liu et al., 2020a). The heating period can last up to 6 months due to cold temperature, requiring extensive coal burning. Furthermore, adverse meteorological conditions controlled by the Siberian high pressure and Arctic Vortex may intensify the formation and enrichment of airborne PM and hinder pollutant dispersion, such as low temperature, high humidity, low wind speed, frequent temperature inversions (Cui et al., 2019; Luo et al., 2021). Human activities, such as straw burning and fireworks, also exacerbate its pollution, making it a highly polluted city (Zhang et al., 2020a; Chen et al., 2021a). In addition, frequent strong winds in the spring often carry dust particles to Harbin from other regions (Xie et al., 2006; Wang et al., 2021). Research on Harbin’s air pollution has focused on the spatial and temporal distribution and source apportionment of air pollutants, as well as the causes and evolution of pollution by individual pollutants (Liu et al., 2020b; Wang et al., 2020). However, a lack of research exists on the annual variation of atmospheric PM, leading to uncertainties in the implementation of pollution control measures.
Coronavirus disease 2019 (COVID-19) pandemic was first identified in December 2019 in Wuhan City, Hubei Province, which spread rapidly to other countries across the world. Efforts to combat the spread of COVID-19, the government began initiating their first-level response to a major public health emergency, e.g., entailed self-isolation, reducing personal travel and outdoor activities, and business closures across all sectors. The strict control measures and social lockdowns have consequently involved switching off most pollutant emission sources, which have had a notable impact on air pollutant concentrations (Chu et al., 2021). The social lockdown initiated during COVID-19 pandemic presented an opportunity to investigate the impacts of reduced anthropogenic activities on the air quality. However, Harbin City still experienced severe pollution events when almost all avoidable outdoor anthropogenic activities stopped under COVID-19 in 2020. In particular, a rare pollution event with air quality index (AQI) reached the maximum value of 500 was occurred, indicating the cause of air pollution could be more complex due to the adverse synoptic systems, complex emission systems, secondary transformation, and regional transmission (Sun et al., 2020), and significant challenges related to improving air quality is urgently required here.
The current study utilizes pollution concentration and meteorological data collected in Harbin in 2020 to analyze continuous heavy pollution periods and identify typical pollution events and their meteorological and anthropogenic causes using radar charts and statistical methods under COVID-19 pandemic. The TrajStat model is used to cluster the backward trajectories, and weighted potential source contribution factor (WPSCF) and concentration-weighted trajectories (WCWT) analyses are conducted to quantify the potential source areas of atmospheric PM and reveal the causes, influencing factors, and the transport of typical continuous heavy pollution processes in Harbin. The specific objectives of the current study were to 1) comparatively investigate the changes and meteorological factors of air pollutants before (2019) and during (2020) the lockdown, and discuss the impacts of COVID-19 lockdown on air pollutants; 2) determine the temporal variations of AQI values and primary pollutant throughout the year 2020, identify pollution events, distinguish typical heavy pollution types, and compare the significant differences between heavy pollution types; 3) explore the impacts of meteorology conditions on the typical heavy pollution types; and 4) investigate the transmission paths and potential pollution source areas of the typical heavy pollution types. The findings of this study will provide theoretical support for the prevention, control, and prediction of atmospheric pollution in urban areas in the post-pandemic era.
2 Material and methods
2.1 Study area
Harbin City is located in the southern part of Heilongjiang Province (between 125°42′–130°13′E and 44°04′–46°40′N), with an average elevation of 151 m (Figure 1). The Songnen Plain is located in the west, and the Xiaoxing’an Mountains are located in the northeast. The city is adjacent to the Zhangguangcai Mountains, which are part of the Changbai Mountains to the south. The terrain is characterized by slightly higher elevations in the east, lower and flatter areas in the west, and a gradual slope from east to west. Harbin has a temperate continental monsoon climate, with short and cool summers and long, cold winters. The temperature in 2020 ranged from −23°C to 28°C, and the total precipitation was 792.8 mm, with summer precipitation accounting for 59.5% of the yearly total. The snow season is from November to February. According to the Harbin Statistical Yearbook 2021, the city supplied 175.97 million GJ of heating water in 2020, with the heating period ranging from October 20th to April 20th. Coal emissions are significantly higher during the long heating period, and pollutants accumulate due to relatively poor atmospheric conditions in winter, leading to significant differences in air quality between the heating and non-heating seasons. Pollution days mostly occur during the heating period.

FIGURE 1. Map of China (A) and study area (B).
2.2 Data source
The daily air quality data (AQI, PM2.5, PM10, CO, NO2, SO2, O3-8 h) for Harbin from 1 January 2019 to 31 December 2020 were obtained from the real-time national urban air quality platform of the China Environmental Monitoring Station (http://106.37.208.233:20035). The AQI classes were based on the “Technical Regulations for the Environmental Air Quality Index (Trial)” (HJ633-2012) and included excellent (0–50), good (51–100), mild pollution (101–150), moderate pollution (151–200), severe pollution (201–300), and serious pollution (>300). The ground meteorological data (temperature T), wind speed (WS), and relative humidity (RH)) were obtained from the China Meteorological Data Network (http://data.cma.cn/) as hourly monitoring data. The meteorological data used in the backward trajectory model were obtained from the Global Data Assimilation System (GDAS) data for the period of 2019–2020 and were provided by the United States National Centers for Environmental Prediction (NCEP) (ftp://ftp.arl.noaa.gov/pub/archives/gdas1/), with a spatial resolution of 1°×1° and a temporal resolution of 1 h. The land-use data were sourced from Esri (https://www.esri.com/) and were produced using Sentinel-2 satellite remote sensing images combined with artificial intelligence land classification models.
2.3 Radar chart
Radar charts are typically used to depict the normalized components of atmospheric pollutants (PM2.5, PM2.5-10, SO2, NO2, CO) at specific times or locations to eliminate the influence of the pollution concentrations of different pollutants. The upper and lower limits of pollutants can be compared with eigenvalue during the same period to determine the pollution type in the region (Duan et al., 2018).
The normalized component at specific times is defined as:
where Zij represents the normalized components of the jth type of pollutant at time i, and cij represents the original mass concentration (μg/m3) of the jth type of pollutant at time i.
The characteristic value of the pollutant at a specific time is defined as:
where CVij represents the char.
acteristic value of the jth pollutant at time i;
The characteristic the upper and lower limit values of the pollutants during a certain period are defined as:
where Maxj represents the upper limit of the jth pollutant, Minj represents the lower limit of the jth pollutant, and Sj represents the standard deviation of the jth pollutant.
2.4 Backward trajectory model and potential source analysis
This study used backward trajectory clustering, WPSCF, and WCWT analysis of the atmospheric data of Harbin city using the TrajStat model (Draxler and Hess, 1998) in the Meteoinfo software developed by Wang et al. (2009). We used the daily PM2.5 concentration data and GDAS meteorological data from 2020 to conduct a backward trajectory simulation of sustained heavy pollution events in Harbin. The city center (126.61oE, 45.74oN) was selected as the starting point for the computations. The previous period was 72 h, and the calculation interval was 2 h. The altitude was 500 m to incorporate the transport characteristics of near-surface air masses and reduce the influence of surface friction. The air mass trajectories in the study area were clustered using the Euclidean distance based on a significant increase in the total spatial variation (TSV), and the proportion of each trajectory category to the total trajectories was calculated.
The PSCF model has been widely used to identify potential pollution sources for high-concentration pollution events (Zong et al., 2018; Sun et al., 2020). It was used in this study to analyze the potential pollutant sources. Harbin city and its surrounding areas were divided into horizontal grids with a size of 0.25°×0.25°. The extent of the grid’s contamination was evaluated by determining the pollutant amount and time of the pollution trajectory in each grid as follows:
where PSCFij represents the potential source contribution of a grid cell ij; mij represents the number of pollution trajectory endpoints with pollutant values exceeding a threshold in grid cell ij; nij represents the total number of trajectory endpoints passing through grid cell ij.
An analysis of the weighted potential source contribution factors (WPSCF) was conducted by using the weighting factor Wij to eliminate uncertainties in grid cells with small nij and reduce the error values of PSCF. The weight functions are typically defined as follows (Zhang et al., 2019):
The PSCF analysis only provides the number of pollution trajectories within a grid cell. When the WPSCF values of grid cells are the same, it is impossible to differentiate the impact of the trajectory endpoints with different pollutant concentrations on the grid cells. However, the CWT method provides a more precise description of the influence of the trajectory endpoints with different pollutant concentrations on the grid cells. The CWT is calculated as follows:
where Cij represents the weighted average concentration of the (i,j) grid cell, i is the index of the trajectory, n is the total number of trajectories, Cl represents the concentration of pollutants corresponding to trajectory l passing through the network unit (i,j), and τijl represents the duration of trajectory l remaining in grid cell (i,j). Similar to the PSCF method, the CWT method also cannot distinguish the number of trajectory endpoints within each grid cell. Therefore, this study employed the same weight factor Wij. A higher WCWT value indicates a higher pollutant concentration in the grid cell and a greater contribution to pollution.
2.5 Statistical analysis
Statistical analysis and graphs were carried out using IBM SPSS Version 20.0 and OriginLab@ OriginPro 2017C. Independent−samples t-test was applied to determine the statistical significant differences between lockdown and non-lockdown periods. Nonparametric Kolmogorov−Smirnov test was used to determine significance of the differences between two typical heavy pollution types. Pearson correlation coefficients were applied to test the linear correlation among atmospheric pollutants and meteorological data. The results were considered significant if a p-value was less than 0.05.
3 Results and discussion
3.1 Changes in atmospheric pollutant concentrations
Soon after the outbreak of COVID-19 pandemic, Wuhan announced lockdown on 23 January 2020 due to the dramatically increase of COVID-19 case numbers. Subsequently, Harbin government officially initiated first-level response to the major public health emergency on 26 January 2020 to reduce gatherings and travel, and this strictest control measure lasted until 2 May 2020. Nevertheless, along with the prohibition of almost all avoidable activities, severe air pollution events still occurred in Harbin (for example, PM2.5 exceeded 900 μg/m3 on April 16), causing discussions regarding why severe air pollution was not avoided. To analyze the impacts of emission-reduction on the air quality, and also minimize the effects of meteorological conditions on temporal characteristics of air pollutants, pollutant concentrations during lockdown (January 26 to May 2) and non-lockdown (January 1 to January 25, May 3 to December 31) with respect to similar periods between 2019 and 2020 were further investigated (Figure 2).
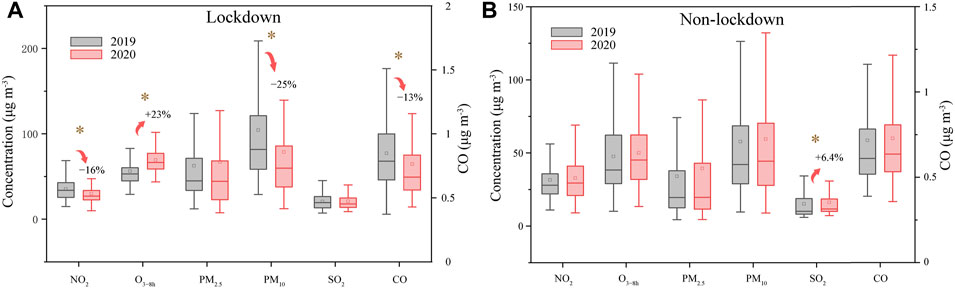
FIGURE 2. Comparison of air pollutant concentrations during the corresponding periods of lockdown (A) and non-lockdown (B) between 2019 and 2020 (* indicates significant difference between the two periods).
During the lockdown period, statistically significant decrease in average concentrations of NO2, PM10 and CO were found under COVID-19 compared to levels in 2019 (p < 0.05), with the reductions of 16%, 25% and 13%, respectively (Figure 2A). The concentrations of PM2.5 and SO2 during the lockdown period in 2020 had no significant differences with those in 2019 with p values of 0.275 and 0.959, respectively. The relatively stable SO2 concentrations indicated that the emissions from stationary sources, such as coal-fired heat plant, household heating systems, as well as firework discharge did not affected by the lockdown as much as traffic-related sources. However, significant concurrent decrease in PM2.5 concentrations were found at global, continental, and national scales in the corresponding period (He et al., 2021). An important reason for this could be possibly due to more PM2.5 were generated under adverse meteorological conditions since NO2 and SO2 are the key precursors of secondary PM2.5 (Sun et al., 2023). It is worth noting that O3 concentrations exhibited a significant increase by 23% during COVID-19 (p < 0.05). Lockdown measures such as restricting traffic, industry and community activities, have transformed the emission of primary pollutants into a simple pattern, which provides opportunities for the analysis of the causes of secondary pollution and the improvement of treatment plans. The more prominent cause of the increase of O3 may due to the unbalanced reduction of NOx and VOCs emissions, which makes the rate of O3 generation by VOCs greater than the rate of O3 consumption by NO, resulting in a large amount of O3 accumulation (Chu et al., 2021; Liu et al., 2023).
As shown in Figure 2B, during 2020 non-lockdown period, no statistically significant reduction was found for NO2, O3, PM2.5, PM10, and CO (p > 0.05), only SO2 showed a less significant increasing (6.4%, p < 0.05) trend compared to 2019. Overall, these data further support the hypothesis that less anthropogenic emissions due to COVID-19 lockdown could improve air quality, and stationary emission sources were less affected by the lockdown. Moreover, it is important to note that the increase of O3 and the high concentrations of PM2.5 have become the main environmental issue in Harbin, which require further investigation.
To better understand the pollution causes during 2020 lockdown period, relationships among the main air pollutants, and their associated meteorology conditions effects were investigated (Figure 3). It is noted that PM2.5 were correlated highest with NO2 and SO2, with R2 of 0.63 and 0.5, respectively (p < 0.01), while the coefficient of NO2 and SO2 was the lowest (R2 = 0.28, p < 0.01), which can be largely explained by the closely relationships between fine particles and gaseous pollutants released from coal combustion, vehicle exhaust, etc. O3 existed no significant correlations with NO2 and SO2 (p > 0.05), however, it is important to note that when PM2.5 < 90 μg m−3, O3 was positive correlated with PM2.5, and the impacts of meteorological factors on the O3 was not obvious. Whereas O3 was negative correlated with PM2.5 and NO2 when PM2.5 > 90 μg m−3 under T < 0°C and WS < 2 m s−1. According to Chu et al. (2020), when PM2.5 < 50 μg m−3, PM2.5 does not significantly reduce the actinic flux and HO2 free radicals due to sufficient solar irradiation. PM2.5 and O3 have common precursors and they are produced simultaneously in the photochemical reaction, thus showing a positive correlation. In Harbin, the unique winter climate (cold, dry and less windy) raises the threshold to 90 μg m−3.
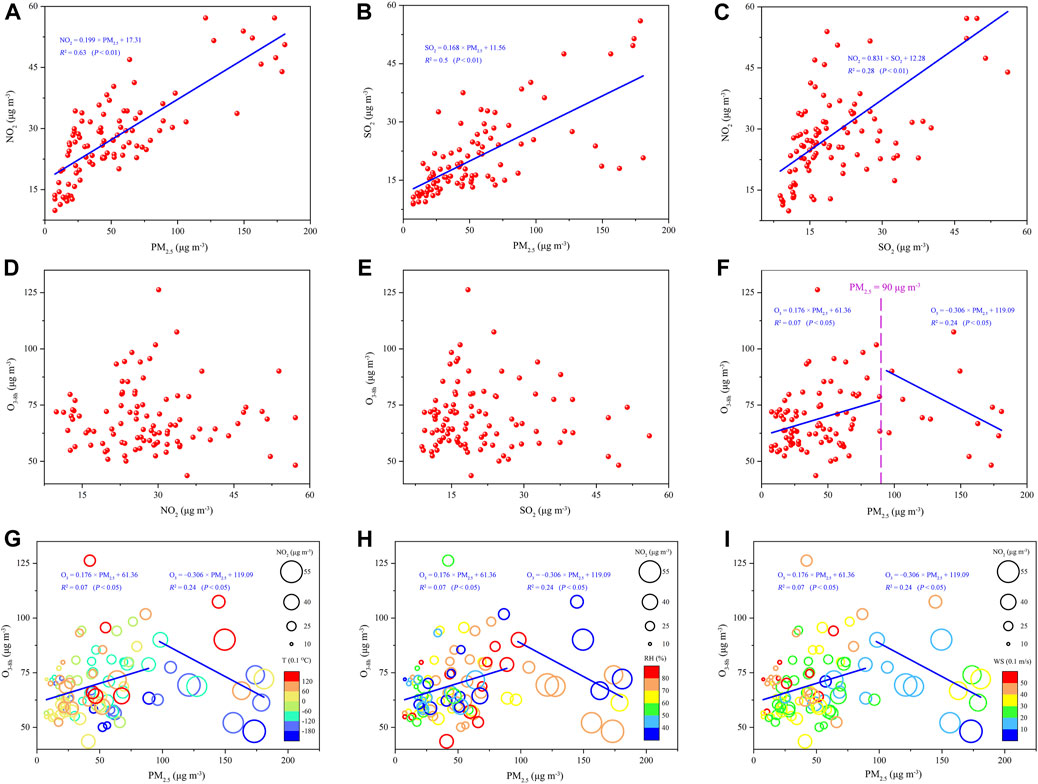
FIGURE 3. Relationships among the main air pollutants (A–F), and the relationships of T (G), RH (H), and WS (I), with O3, PM2.5 and NO2.
3.2 Pollution types and causes of typical pollution events
Heavy air pollution has occurred frequently in the past few years in Northeast China especially during winters, which was distinct from other regions in China because of increased levels of coal and biomass combustion during the heating season, particular geographical condition, and adverse meteorological conditions (Sun et al., 2020; Jia et al., 2023; Sun et al., 2023). The range of the AQI values in Harbin throughout the 2020 was 19–500 (Figure 4), with a variation coefficient of 81.1%, indicating strong variability and a large difference in air quality at different times due to natural and human factors. Overall, the air quality was good in summer and autumn, while air pollution was severe in winter and spring in Harbin. It was strongly endured PM2.5 pollution and haze almost one-third of that critical period, which require further air pollution control.
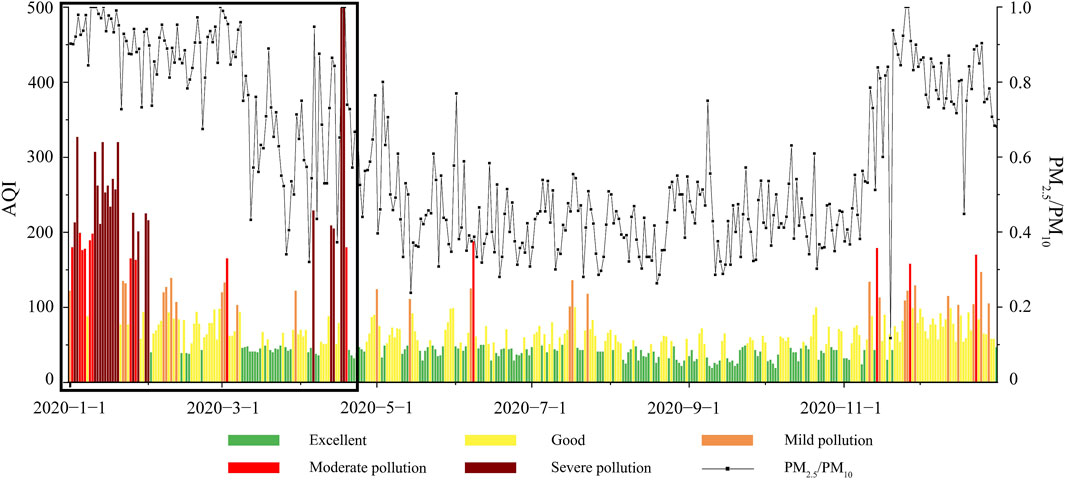
FIGURE 4. Temporal variations of air quality in Harbin in 2020.
According to the “Ambient Air Quality Standards” (GB3095-2012), there were 62 days throughout the 2020 AQI exceeded the Class II environmental assessment standard, with 27, 14, 15, and 6 days of mild, moderate, heavy, and severe pollution, respectively. These pollution days were concentrated from January 1 to April 19 which were under the lockdown period. The number of days when PM2.5 was the primary pollutant was 55 days, accounting for 88.7% of all pollution days. The average concentration of PM2.5 (ρ(PM2.5)) was 161.07 μg/m3, which was 2.15 times higher than the Class II requirement (75 μg/m3). The ρ(PM2.5)/ρ(PM10) ratio was consistently greater than 0.7, indicating that atmospheric pollution in Harbin during the winter and spring was primarily attributed to fine PM, whereas natural dust sources had a limited impact (Robert and Brigitte, 2003; Zha et al., 2021).
In order to further analyze the typical pollution characteristics of Harbin in winter and spring, six pollution events were defined based on the AQI values. A pollution event was identified when the AQI value exceeded mild pollution levels and persisted for more than 6 consecutive days. These events were categorized as follows: January 1–9 (Event I), January 10–20 (Event II), January 25–February 1 (Event III), February 7–12 (Event IV), March 1–7 (Event V), and April 13–19 (Event VI). The historical characteristic radar chart has been extensively used for identifying the main pollution types (Li et al., 2020; Sun et al., 2023). For the current study, two typical atmospheric pollution types were identified, i.e., SO2 dominant pollution type and PM2.5 dominant pollution type (Figure 5), and the impacts of meteorology conditions and human activities on the pollution types were further discussed.
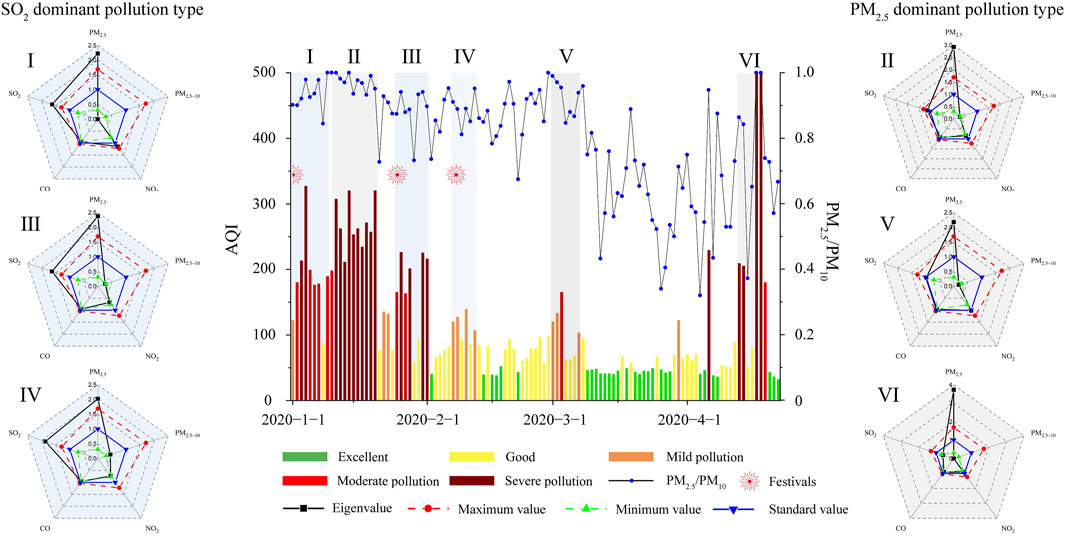
FIGURE 5. Temporal variations of pollution events and typical atmospheric pollution types.
The characteristic radar charts of the three sustained pollution periods (I, III, and IV) showed that the characteristic values of PM2.5 and SO2 significantly exceeded the maximum value, whereas the characteristic values of PM2.5-10, NO2, and CO were either close to or less than the standard values (Figure 5). Previous research indicated that fireworks and firecrackers had a significant impact on PM2.5, PM10, and SO2 (Camilleri and Vella, 2010; Godri et al., 2010). Thus, the occurrence of large-scale fireworks could be determined based on whether the PM2.5 and SO2 concentrations significantly exceeded the upper limits. These three sustained pollution periods occurred during the traditional Chinese festivals of New Year’s Day, Spring Festival, and Lantern Festival, which are peak periods for fireworks. In addition, SO2 is mainly released from coal combustion in winter in residential areas of north China, which is directly from the primary emissions of anthropogenic sources, makes the three sustained pollution periods are SO2 dominant pollution type.
Numerous studies have shown that SO2, NO2, and CO emissions significantly affect PM2.5 concentrations. SO2 and NO2 act as precursors for PM2.5, and secondary aerosol formation also contributes to increased PM2.5 concentrations (Zhang et al., 2015; Li et al., 2018; Bao et al., 2019; Chu et al., 2020). According to the NCBI (National Center for Biotechnology Information), in the air in a standard room (21% O2), the half-life of CO is 320 min. CO has a relatively long atmospheric lifetime and is an inert chemical pollutant whose concentration is affected by meteorological factors. Therefore, it can be used as a tracer to analyze the secondary generation of fine PM by examining ρ(PM2.5)/ρ(CO) (Song et al., 2017). In periods Ⅱ, Ⅴ, and Ⅵ, the value of ρ(PM2.5)/ρ(CO) was 0.131, higher than the annual value of 0.05, indicating a significant influence by the formation of secondary PM. The radar chart showed that only the characteristic value of PM2.5 exceeded the maximum value, indicating that these three periods of sustained pollution were PM2.5 dominant pollution type events and highly correlated with the secondary transformation of PM2.5.
Nonparametric Kolmogorov−Smirnov test was performed to determine significance of the differences of air pollutants between SO2 dominant pollution and PM2.5 dominant pollution (Figure 6). No significant differences were found for the concentrations of PM2.5, PM10, NO2 and CO between the two types (p > 0.05), while SO2 and O3 were significantly higher in the SO2 dominant pollution and PM2.5 dominant pollution, respectively (p < 0.05). As already discussed, these pollution events occurred during the COVID-19 lockdown period in 2020. It indicated the SO2, O3, together with PM2.5 were the most important contributors to heavy pollution formation when anthropogenic activities were reduced. The results reflected some typical and new characteristics of air pollution in northeast China. On one hand, coal combustion from heating supply due to the low temperature, and fireworks set off on traditional festivals were the major sources in Harbin, all of which were directly derived from primary emissions of anthropogenic sources. On the other hand, a combined air pollution dominated by PM2.5 and O3 was also observed, which were considered to damage human health severely. However, the formation regime of PM2.5−O3 are difficult to be accurately determined, due to the impacts of precursors and meteorological conditions (Liu et al., 2023; Xu et al., 2023), which require further investigation.
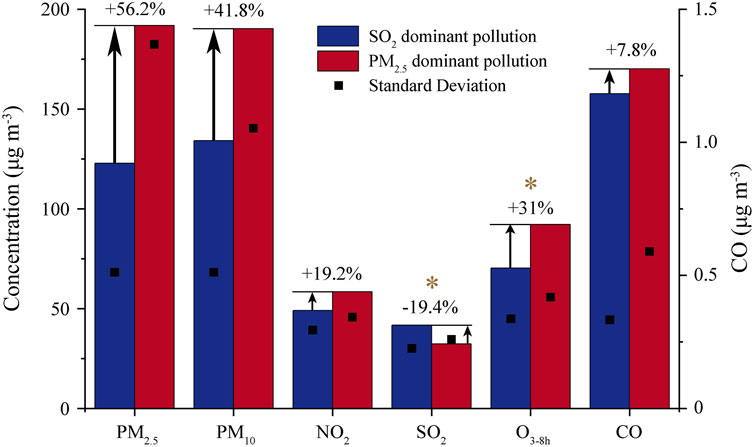
FIGURE 6. Comparison of air pollutant concentrations during the SO2 dominant pollution and PM2.5 dominant pollution episodes in 2020 (* indicates significant difference between the two pollution episodes).
The relationships among air pollutants and meteorological conditions during SO2 dominant pollution and PM2.5 dominant pollution were evaluated to investigate the attributions of emission-reduction and meteorological conditions (Figure 7). Positive correlations between PM2.5 and key gaseous pollutants (SO2, NO2 and CO) (p < 0.01), and negative correlation between PM2.5 and T (p < 0.05) were observed in SO2 dominant pollution, clearly indicating that combustion source release is important contributor in northeast China due to the low temperature and low wind speed. As for the PM2.5 dominant pollution, the influence of meteorological factors on pollutants is different from that of SO2 dominant pollution, with higher correlations between RH and PM2.5 and gaseous pollutants (p < 0.01), and less or no significant correlations were found between T and PM2.5 and gaseous pollutants. These phenomena may result from a significant influence by the formation of secondary particulate matter, that the hygroscopic growth of particles may be an essential factor, as it could promote homogeneous or heterogeneous reactions by providing sufficient reaction sites by increasing the surface area (Li et al., 2021). High humidity conditions accelerate the conversion of gaseous precursors to particles, and secondary fine particles are generated under stable meteorological conditions that hinder pollutant diffusion (Li et al., 2017).
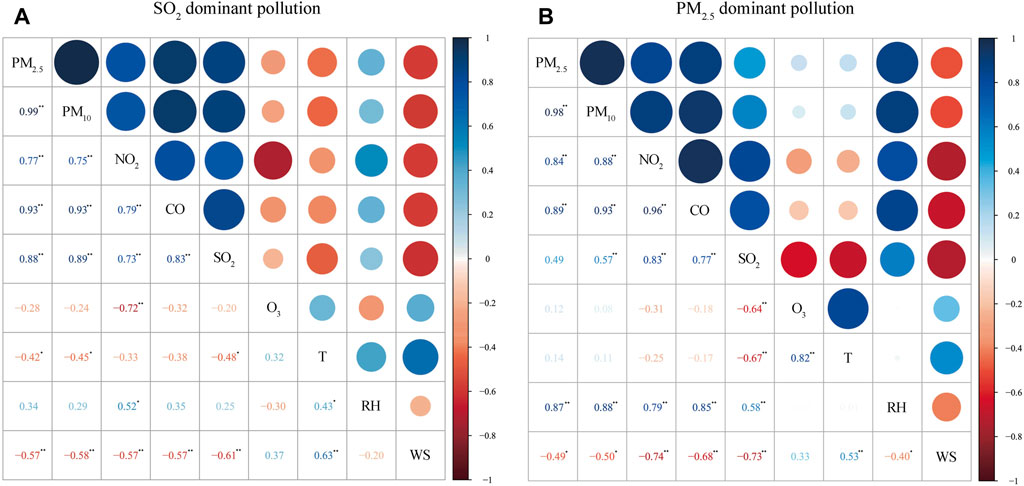
FIGURE 7. Correlation between atmospheric pollutants and meteorological factors during SO2 dominant pollution (A) and PM2.5 dominant pollution (B) pollution episodes (* indicates p < 0.05, ** indicates p < 0.01).
PM2.5 was the main pollutant exceeding air quality standards during pollution episodes, which comes from both primary pollution release and secondary transformation. The distributions of PM2.5 concentrations under different levels of temperature, relative humidity, and wind speed during SO2 dominant pollution and PM2.5 dominant pollution episodes were further investigated (Figure 8). The results showed that concentrations of PM2.5 increased with the decrease of temperature, due to coal-fired heating in cold winter, and increased with the increase of relative humidity, indicating that the effect of hygroscopic growth increased gradually. High concentrations of PM2.5 occurred more frequently under lower wind speed, which was unfavorable for the dispersion of atmospheric pollutants.
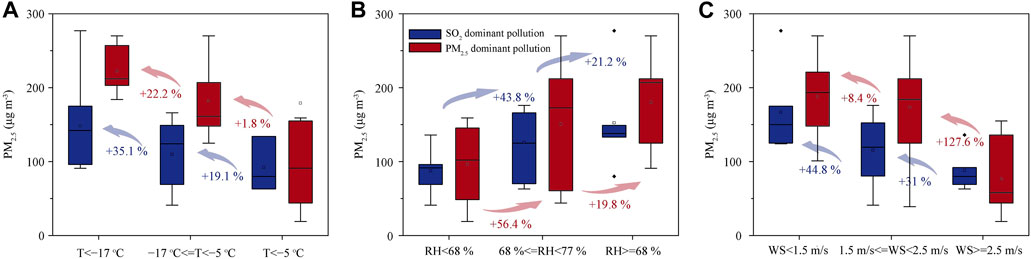
FIGURE 8. Distributions of PM2.5 concentrations under different levels of temperature (A), relative humidity (B), and wind speed (C) during SO2 dominant pollution and PM2.5 dominant pollution episodes.
3.3 Pollutant transport pathways and potential source analysis of different types of pollution episodes
3.3.1 SO2 dominant pollution
Regional transportation was found to contribute considerably to the rapid accumulation of PM2.5. Therefore, the trajectories of the air masses and potential geographical origins were analyzed to explore its influence. Five air mass trajectories were identified in the SO2 dominant pollution (I, III, and IV) pollution episode (Figure 9A). Trajectories 1, 3, and 5 were similar, originating from high-altitude regions in Russia and entering China from the southeast. As they passed through the mountains in the Greater Khingan Range, their altitude and speed decreased, accumulating atmospheric pollutants. Finally, they were transported to Harbin in the east via Daqing City. Trajectory 4 originated in high-altitude regions in southern Russia and entered China from the southeast, passing through Inner Mongolia at the border of Jilin Province. The trajectory turned northeastward, and the altitude decreased, ultimately reaching Harbin City at low speed. Trajectory 2 involved a short-distance transfer from neighboring cities, with a slow speed and small altitude changes. Nonetheless, it contributed the most to Harbin’s pollution (29.63%). It originated from central Hulunbuir City in the south, moved southeastward to Changchun, and then turned northward. The ups and downs became gentle, and the pollutants accumulated and were slowly transported to Harbin. In conjunction with the wind-rose diagram, due to the strong wind from the southwest contributed to the transmission of atmospheric particles, several surrounding cities west and southwest of Harbin had the greatest impact on Harbin’s pollution during the SO2 dominant pollution. In addition, atmospheric particles transmitted from Russia might have contributed to the severe pollution event in Harbin.
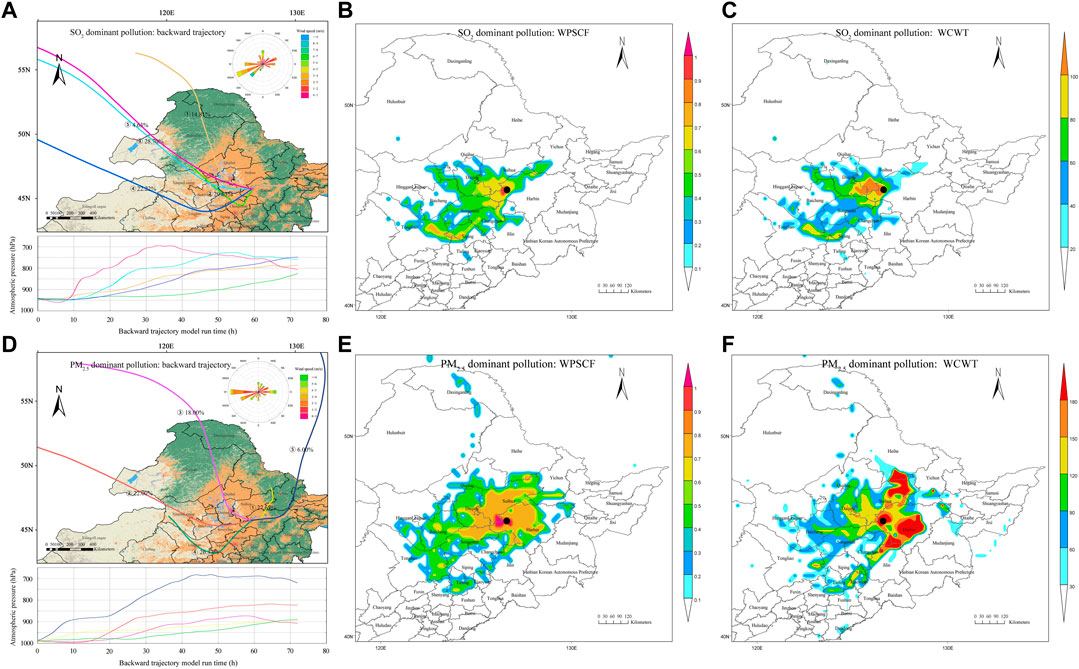
FIGURE 9. Backward trajectory (A,D), weighted potential source contribution factors (WPSCF) (B,E), and weighted concentration-weighted trajectories (WCWT) (C,F) of PM2.5 during SO2 dominant pollution and PM2.5 dominant pollution episodes.
The potential source area of PM2.5 during the SO2 dominant pollution is shown in Figures 9B,C. A WPSCF value exceeding 0.6 indicates that the region contributes significantly to PM2.5 pollution in Harbin and is a significant potential source area (Zhang et al., 2020b; Ren et al., 2021; Chen et al., 2022). The source area of PM2.5 was centered in the western part of Harbin and formed a central zone that extended to the southern parts of Daqing and Suihua cities and the northern parts of Changchun and Songyuan cities. This area mainly contributed to the short-distance transport of PM2.5. The potential source areas of PM2.5 in Tongliao, Tieling, and Siping were highly consistent with trajectory 4, which mainly contributed to the long-distance transport of PM2.5. The source area of mild pollution expanded outward from the source area for severe pollution and was located in the southwestern part of Heilongjiang Province, the central-western part of Jilin Province, and at the border area of Inner Mongolia. The results of the WCWT and WPSCF methods were similar. The pollution source area west of Harbin contributed 80–120 μg/m3 to Harbin’s WCWT concentration. Meanwhile, the source areas for severe pollution in Tongliao, Tieling, and Siping contributed 80–100 μg/m3. The area at the junction of Baicheng City, Songyuan City, and Daqing City also significantly contributed to the combustion source pollution in Harbin, with a WCWT value of 60–80 μg/m3. The results of the potential source areas combined with PM2.5 carried by strong winds from the southwest, are highly consistent with the backward trajectories, indicating that Harbin and the surrounding cities suffered from pollution emissions far beyond the environmental capacity due to fireworks and firecracker discharges, as well as coal combustion in cold season.
3.3.2 PM2.5 dominant pollution
Five air mass trajectories were obtained from backward trajectory simulation (Figure 9D). The altitudes of these five pollution trajectories were significantly lower than those of the SO2 dominant pollution episode, resulting in a smoother transport and the conversion of secondary PM precursors. Trajectory 1 exhibited short-distance transportation from the surrounding cities. It had the shortest airflow trajectory, slowest velocity, and the highest proportion (27.67%), which originated south of Heihe City, slowly descending in altitude as it moved south, passing through Yichun City and Suihua City, and transporting pollutants to Harbin City, contributing significantly to PM pollution in Harbin City. Trajectories 2 and 3 originated from the northwest airflow of Russia. When it crossed the Greater Khingan Range to the southeast, the altitude suddenly dropped, and the speed slowed down, and it moved eastward from Daqing City to Harbin. Trajectory 4 started from the Xing’an League and was transported to the border between Jilin Province and Liaoning Province in a southeastern direction with a continuous altitude decrease. Subsequently, the airflow turned northeast, and the altitude remained unchanged. A large number of pollutants accumulated during a relatively long stay in Jilin Province. Eventually, the trajectory slowly moved toward Harbin. Trajectory 5 was the only northeasterly airflow. It had a relatively high altitude and was moving fast before arriving in Harbin. Its height and speed suddenly dropped after entering Harbin, transporting pollutants from the eastern region to the central urban area. The wind frequency rose diagram shows that the wind speed was low, although the frequency of westward winds that dominated the PM2.5 dominant pollution episode was high. Therefore, locally generated PM from Harbin City’s pollution sources accounted for the main portion. In contrast, on days with high east and north winds, short-distance transport of pollutants, such as coal burning and vehicle exhaust from surrounding cities, occurred. The pollutants were transformed into secondary PM pollutants under favorable conditions, such as low temperatures, high humidity, and stagnant weather, accumulating pollutants and resulting in heavy pollution in Harbin (Li et al., 2021).
The range of the potential source areas of PM2.5 dominant pollution with WPSCF values >0.6 was larger than that of the SO2 dominant pollution, and the source areas extended beyond the central area. The potential source areas were centered on Harbin and covered most parts of Suihua City, southern Daqing city, western Harbin, and the north of Songyuan City. Another potential source area of heavy PM2.5 pollution formed at the junction of Changchun, Jilin, and Harbin, and there were other sporadic potential source areas in the surrounding cities. The WCWT results showed extremely high pollution areas east of Harbin, north of Suihua City, and at the junction of Changchun, Jilin, and Harbin, with WCWT values above 180 μg/m³. Due to the extreme pollution in mid-April, the highest WCWT value was 410 μg/m³. The PM2.5 contribution range of other potential source areas of PM2.5 dominant pollution in Harbin city was 90–180 μg/m³, whereas that of potential source areas of slight pollution was 60–90 μg/m³.
In summary, local source pollutants generated by combustion emission at specific times, coupled with pollutants transmitted by southwestern winds, caused SO2 dominant pollution in Harbin City. Many secondary pollutant precursors were transferred to Harbin from the east and north due to strong winds, causing a sharp deterioration of the atmospheric environment in Harbin City and form PM2.5 dominant pollution. The potential sources of PM2.5 in such a large area are mainly due to precursors of secondary pollution from coal-fired heating, biomass burning and vehicle exhaust (Cheng et al., 2021b; Li et al., 2023).
4 Conclusion
To better understand the impacts of reduced anthropogenic activities on the air quality, and develop more effective measures to control air pollution in the post-pandemic era, daily pollutant concentration monitoring and meteorological data in 2019 and 2020 were used to investigate the changes of air pollutants during lockdown and non-lockdown between the 2 years, respectively. And also to discriminate the dominant air pollution processes and pollution types, analyze the influence of meteorological factors and human activities on the pollution processes, and clarify the potential source areas and their contributions in Harbin City, a cold metropolis in northeast China under COVID-19 in 2020.
Compared to the same time spans in 2019, significant concurrent decrease in NO2, CO and PM10 concentrations, while no significant differences in SO2 and PM2.5 were found during the lockdown in 2020, indicating that reduced activities of transportation did result in reductions of NO2, and stationary emission sources were less affected. When PM2.5 < 90 μg m−3, O3 was positive correlated with PM2.5, and the impacts of meteorological factors on the O3 was not obvious. Whereas O3 was negative correlated with PM2.5 and NO2 when PM2.5 > 90 μg m−3 under temperature <0°C and wind speed <2 m s−1.
SO2 dominant pollution and PM2.5 dominant pollution were distinguished from six sustained heavy pollution periods by radar charts. PM2.5 and SO2 played driving role in SO2 dominant pollution derived from local pollutants emission of coal combustion and firework discharge. PM2.5 dominant pollution might be chemical transformed from coal burning, vehicle exhaust, and other secondary precursors, which was affected and aggravated by CO, NO2, high relative humidity and low wind speed affected by local emission and long-distance transport.
Data availability statement
The original contributions presented in the study are included in the article/Supplementary Material, further inquiries can be directed to the corresponding author.
Author contributions
JL: Writing–original draft, Data curation, Methodology, Resources, Software. LS: Conceptualization, Funding acquisition, Project administration, Writing–original draft, Writing–review and editing. XY: Methodology, Software, Writing–original draft. SZ: Data curation, Project administration, Writing–review and editing. JW: Data curation, Writing–original draft. DM: Resources, Writing–review and editing.
Funding
The author(s) declare financial support was received for the research, authorship, and/or publication of this article. This research was funded by National Natural Science Foundation of China (NSFC) (42371138 and 42171127), Key Joint Program of National Natural Science Foundation of China (NSFC) and Heilongjiang Province for Regional Development (U20A2082), Science and Technology Fundamental Resources Investigation Program (2022FY100701), and Fundamental Research Funds for the Central Universities (2022-KYYWF-0155).
Acknowledgments
The authors would like to thank the reviewers for their valuable and constructive comments.
Conflict of interest
The authors declare that the research was conducted in the absence of any commercial or financial relationships that could be construed as a potential conflict of interest.
Publisher’s note
All claims expressed in this article are solely those of the authors and do not necessarily represent those of their affiliated organizations, or those of the publisher, the editors and the reviewers. Any product that may be evaluated in this article, or claim that may be made by its manufacturer, is not guaranteed or endorsed by the publisher.
References
Bao, Z., Chen, L., Li, K., Han, L., Wu, X., Gao, X., et al. (2019). Meteorological and chemical impacts on PM2.5 during a haze episode in a heavily polluted basin city of eastern China. Environ. Pollut. 250, 520–529. doi:10.1016/j.envpol.2019.04.045
Camilleri, R., and Vella, A. J. (2010). Effect of fireworks on ambient air quality in Malta. Atmos. Environ. 44 (35), 4521–4527. doi:10.1016/j.atmosenv.2010.07.057
Chen, L. Y., Zhang, J. K., Huang, X. J., Li, H., Dong, G. M., and Wei, S. Y. (2022). Characteristics and pollution formation mechanism of atmospheric fine particles in the megacity of Chengdu, China. Atmos. Res. 273, 106172. doi:10.1016/j.atmosres.2022.106172
Cheng, Y., Yu, Q., Liu, J., Cao, X., Zhong, Y., Du, Z., et al. (2021a). Dramatic changes in Harbin aerosol during 2018–2020: the roles of open burning policy and secondary aerosol formation. Atmos. Chem. Phys. 21, 15199–15211. doi:10.5194/acp-21-15199-2021
Cheng, Y., Yu, Q., Liu, J., Du, Z., Liang, L., Geng, G., et al. (2021b). Strong biomass burning contribution to ambient aerosol during heating season in a megacity in Northeast China: effectiveness of agricultural fire bans? Sci. Total Environ. 754, 142144. doi:10.1016/j.scitotenv.2020.142144
Chu, B., Ma, Q., Liu, J., Ma, J., Zhang, P., Chen, T., et al. (2020). Air pollutant correlations in China: secondary air pollutant responses to NOx and SO2 control. Environ. Sci. Technol. 7, 695–700. doi:10.1021/acs.estlett.0c00403
Chu, B., Zhang, S., Liu, J., Ma, Q., and He, H. (2021). Significant concurrent decrease in PM2.5 and NO2 concentrations in China during COVID-19 epidemic. J. Environ. Sci. 99, 346–353. doi:10.1016/j.jes.2020.06.031
Cui, S., Song, Z. H., Zhang, L. M., Zhang, Z. L., Hough, R., Fu, Q., et al. (2019). Polycyclic aromatic hydrocarbons in fresh snow in the city of Harbin in northeast China. Atmos. Environ. 215, 1–9. doi:10.1016/j.atmosenv.2019.116915
Draxler, R. R., and Hess, G. D. (1998). An overview of the HYSPLI_4 modelling system for trajectories, dispersion, and deposition. Aust. Meteorol. Mag. 47 (4), 295–308.
Duan, J. C., Hu, J. N., Tan, J. H., and Chen, H. (2018). Design of characteristic radar chart and its application in air pollution analysis. Res. Environ. Sci. 31 (8), 1329–1336. doi:10.13198/j.issn.1001-6929.2018.06.12
Godri, K. J., Green, D. C., Fuller, G. W., Dall'Osto, M., Beddows, D. C., Kelly, F. J., et al. (2010). Particulate oxidative burden associated with firework activity. Environ. Sci. Technol. 44 (21), 8295–8301. doi:10.1021/es1016284
He, C., Hong, S., Zhang, L., Mu, H., Xin, A., Zhou, Y., et al. (2021). Global, continental, and national variation in PM2.5, O3, and NO2 concentrations during the early 2020 COVID-19 lockdown. Atmos. Pollut. Res. 12, 136–145. doi:10.1016/j.apr.2021.02.002
Jia, H. J., Zang, S. Y., Zhang, L. Q., Yakovleva, E., Sun, H. J., and Sun, L. (2023). Spatiotemporal characteristics and socioeconomic factors of PM2.5 heterogeneity in mainland China during the COVID-19 epidemic. Chemosphere 331, 138785. doi:10.1016/j.chemosphere.2023.138785
Li, B., Lu, L., Shi, X., Ma, L., Jiang, J., Yabo, S. D., et al. (2023). Drivers of 2015–2021 trends in cold winter surface PM2.5 in the Harbin-Changchun megalopolis in China: meteorology vs. anthropogenic emission. Atmos. Res. 285, 106623. doi:10.1016/j.atmosres.2023.106623
Li, H., Duan, F., Ma, Y., He, K., Zhu, L., Ma, T., et al. (2018). Case study of spring haze in Beijing: Characteristics, formation processes, secondary transition, and regional transportation. Environ. Pollut. 242 (Pt A), 544–554. doi:10.1016/j.envpol.2018.07.001
Li, H., Ma, Y., Duan, F., He, K., Zhu, L., Huang, T., et al. (2017). Typical winter haze pollution in Zibo, an industrial city in China: characteristics, secondary formation, and regional contribution. Environ. Pollut. 229, 339–349. doi:10.1016/j.envpol.2017.05.081
Li, L., Wang, K., Chen, W., Zhao, Q., Liu, L., Liu, W., et al. (2020). Atmospheric pollution of agriculture-oriented cities in Northeast China: a case in Suihua. J. Environ. Sci. 97, 85–95. doi:10.1016/j.jes.2020.04.038
Li, W., Duan, F., Zhao, Q., Song, W., Cheng, Y., Wang, X., et al. (2021). Investigating the effect of sources and meteorological conditions on wintertime haze formation in Northeast China: a case study in Harbin. Sci. Total Environ. 801, 149631. doi:10.1016/j.scitotenv.2021.149631
Liu, C., Liang, J., Li, Y., and Shi, K. (2023). Fractal analysis of impact of PM2.5 on surface O3 sensitivity regime based on field observations. Sci. Total Environ. 858, 160136. doi:10.1016/j.scitotenv.2022.160136
Liu, J., Zheng, Y., Geng, G., Hong, C., Li, M., Li, X., et al. (2020a). Decadal changes in anthropogenic source contribution of PM2.5 pollution and related health impacts in China, 1990–2015. Atmos. Chem. Phys. 20, 7783–7799. doi:10.5194/acp-20-7783-2020
Liu, Y., Dong, J., Xu, X., and Jiang, Y. (2020b). PM2.5 mass concentration variation in urban residential buildings during heating season in severe cold region of China: a case study in Harbin. Sci. Total Environ. 722, 137945. doi:10.1016/j.scitotenv.2020.137945
Luo, Y., Liu, S., Che, L., and Yu, Y. (2021). Analysis of temporal spatial distribution characteristics of PM2.5 pollution and the influential meteorological factors using Big Data in Harbin, China. J. Air Waste Manag. Assoc. 71 (8), 964–973. doi:10.1080/10962247.2021.1902423
Ren, B., Xie, P. H., Xu, J., Li, A., Tian, X., Hu, Z. K., et al. (2021). Use of the PSCF method to analyze the variations of potential sources and transports of NO2, SO2, and HCHO observed by MAX-DOAS in Nanjing, China during 2019. Sci. Total Environ. 782, 146865. doi:10.1016/j.scitotenv.2021.146865
Robert, G., and Brigitte, B. (2003). Characterising seasonal variations and spatial distribution of ambient PM10 and PM2.5 concentrations based on long-term Swiss monitoring data. Atmos. Environ. 37 (19), 2571–2580. doi:10.1016/S1352-2310(03)00221-8
Song, C., Wu, L., Xie, Y., He, J., Chen, X., Wang, T., et al. (2017). Air pollution in China: status and spatiotemporal variations. Environ. Pollut. 227, 334–347. doi:10.1016/j.envpol.2017.04.075
Sun, L., Ai, X., Yao, X., An, Q., Liu, X. M., Yakovleva, E., et al. (2023). Relationship between atmospheric pollution and polycyclic aromatic hydrocarbons in fresh snow during heavy pollution episodes in a cold city, northeast China. Ecotox. Environ. Safe. 260, 115091. doi:10.1016/j.ecoenv.2023.115091
Sun, X., Wang, K., Li, B., Zong, Z., Shi, X., Ma, L., et al. (2020). Exploring the cause of PM2.5 pollution episodes in a cold metropolis in China. J. Clean. Prod. 256, 120275. doi:10.1016/j.jclepro.2020.120275
Wang, J., Zhao, B., Wang, S., Yang, F., Xing, J., Morawska, L., et al. (2017). Particulate matter pollution over China and the effects of control policies. Sci. Total Environ. 584–585, 426–447. doi:10.1016/j.scitotenv.2017.01.027
Wang, P., Chen, K., Zhu, S., Wang, P., and Zhang, H. (2020). Severe air pollution events not avoided by reduced anthropogenic activities during COVID-19 outbreak. Resour. Conserv. Recycl. 158, 104814. doi:10.1016/j.resconrec.2020.104814
Wang, Y. L., Sun, Y. W., Zhang, Z. Q., and Cheng, Y. (2021). Spatiotemporal variation and source analysis of air pollutants in the Harbin-Changchun (HC) region of China during 2014–2020. Environ. Sci. Technol. 8, 100126. doi:10.1016/j.ese.2021.100126
Wang, Y. Q., Zhang, X. Y., and Draxler, R. R. (2009). TrajStat: GIS-based software that uses various trajectory statistical analysis methods to identify potential sources from long-term air pollution measurement data. Environ. Model. Softw. 24 (8), 938–939. doi:10.1016/j.envsoft.2009.01.004
Xie, Y. Y., Zhang, Y., He, K., Zhou, J., and Kang, C. G. (2006). Features of sand-dust deposits in Harbin city, China. Chin. Geogr. Sci. 16, 327–333. doi:10.1007/s11769-006-0327-4
Xu, T., Zhang, C., Liu, C., and Hu, Q. (2023). Variability of PM2.5 and O3 concentrations and their driving forces over Chinese megacities during 2018–2020. J. Environ. Sci. 124, 1–10. doi:10.1016/j.jes.2021.10.014
Zha, H., Wang, R., Feng, X., An, C., and Qian, J. (2021). Spatial characteristics of the PM2.5/PM10 ratio and its indicative significance regarding air pollution in Hebei Province, China. Environ. Monit. Assess. 193 (8), 486. doi:10.1007/s10661-021-09258-w
Zhang, J., Huang, X., Chen, Y., Luo, B., Luo, J., Zhang, W., et al. (2019). Characterization of lead-containing atmospheric particles in a typical basin city of China: seasonal variations, potential source areas, and responses to fireworks. Sci. Total Environ. 661, 354–363. doi:10.1016/j.scitotenv.2019.01.079
Zhang, L. Y., Qiao, L. P., Lan, J., Yan, Y., and Wang, L. N. (2020a). Three-years monitoring of PM2.5 and scattering coefficients in Shanghai, China. Chemosphere 253, 126613. doi:10.1016/j.chemosphere.2020.126613
Zhang, M. D., Chen, W. W., Shen, X. J., Zhao, H. M., Gao, C. K., Zhang, X. L., et al. (2020b). Comprehensive and high-resolution emission inventory of atmospheric pollutants for the northernmost cities agglomeration of Harbin-Changchun, China: implications for local atmospheric environment management. J. Environ. Sci. (China) 104, 150–168. doi:10.1016/j.jes.2020.11.026
Zhang, Q., Quan, J., Tie, X., Li, X., Liu, Q., Gao, Y., et al. (2015). Effects of meteorology and secondary particle formation on visibility during heavy haze events in Beijing, China. Sci. Total Environ. 502, 578–584. doi:10.1016/j.scitotenv.2014.09.079
Keywords: PM2.5 pollution, meteorological factor, secondary transformation, backward trajectory model, regional transportation
Citation: Li J, Sun L, Yao X, Zang S, Wang J and Ma D (2023) Attributions of emission-reduction and meteorological conditions to typical heavy pollution episodes in a cold metropolis, northeast China. Front. Environ. Sci. 11:1331536. doi: 10.3389/fenvs.2023.1331536
Received: 01 November 2023; Accepted: 08 December 2023;
Published: 20 December 2023.
Edited by:
Caiqing Yan, Shandong University, ChinaCopyright © 2023 Li, Sun, Yao, Zang, Wang and Ma. This is an open-access article distributed under the terms of the Creative Commons Attribution License (CC BY). The use, distribution or reproduction in other forums is permitted, provided the original author(s) and the copyright owner(s) are credited and that the original publication in this journal is cited, in accordance with accepted academic practice. No use, distribution or reproduction is permitted which does not comply with these terms.
*Correspondence: Li Sun, c3VubGlfd2FiYkAxNjMuY29t