 Chenglong Chen
 Hua Deng2
- 1Wulingshan Collaborative Innovation Center for Green Development, Yangtze Normal University, Chongqing, China
- 2Chongqing Youth Vocational and Technical College, Chongqing, China
To explore the impact of different land use modes on the contents of nitrogen and phosphorus in soil and water in the agricultural basin of the Three Gorges Reservoir, the differences in the nitrogen and phosphorus contents in soil and shallow groundwater under different land use modes were studied by using sample data collected in the field. The typical agricultural small watershed at the heart of the reservoir area was selected as the research object. The differences in the nitrogen and phosphorus loss concentrations during the rainfall process and in the daily surface runoff of the two subcatchments with different land use compositions and spatial layouts were compared. The results show that under the five land use modes, the average total nitrogen (TN) content of the paddy soil (1.51 g/kg) was the highest and was significantly higher than that of the other four land use modes (p < 0.05); the average nitrate nitrogen (NO3−-N) content of the terraced soil in dry land (30.05 mg/kg) was the highest, and the dispersion degree was the greatest; and the total phosphorus (TP) content of the three types of sloping farmland was higher than that of terraced farmland, among which the total phosphorus content of the dryland sloping farmland (1.37 g/kg) was the highest and was significantly greater than that of the other types (p < 0.05); moreover, the available phosphorus (AP) content in the soil of the closely planted mulberry garden was the highest, with an average of 36.85 mg/kg. Under the different land use modes, the concentrations of TN and NO3−-N in the shallow groundwater varied greatly, while there were no obvious differences in the TP concentrations. Influenced by fertilization, the concentrations of TN and NO3−-N in the shallow groundwater clearly increased after fertilization in spring and autumn. The concentration of TP increased slightly, and the concentration was the highest when the rainfall was concentrated in summer. A comparison of the two subcatchments revealed that the interplanted mulberry and paddy fields at the bottom of the basin effectively reduced TN and TP outputs of surface runoff in the subcatchment.
1 Introduction
The deterioration of water quality caused by nonpoint source pollution is one of the most significant environmental problems in the world (Lee et al., 2020). Effective control of nonpoint source pollution has become a key aspect of water environment governance in many countries and regions. The generation, transportation, and final output of nonpoint source pollution are related to many factors (Islam et al., 2018), including natural factors such as soil, terrain and meteorology as well as human factors such as land use activities. Scholars have conducted extensive research on various factors, such as rainfall (Fernandez-Raga et al., 2017), slope (Tu et al., 2018), landscape pattern (Chen et al., 2019) and land use (Suescun et al., 2017). Land use is an important human factor that affects nonpoint source pollution (Anand et al., 2018; Zhou et al., 2020). Land use determines factors such as vegetation type, farmland measures, and cultivation methods, thereby affecting the input and output of pollutants (Selassie et al., 2015; Ou et al., 2017).
The process of soil nutrient loss essentially involves interactions among surface soil nutrients, rainfall and runoff (Lee et al., 2018). Driven by water, some soil nutrients are lost along the horizontal migration path of surface runoff and eroded sediment, and some are lost along the vertical migration path formed by water infiltration. The soil nutrient content is an important factor that affects the ability of rainfall runoff and infiltration to transport nutrients (Essaid et al., 2015). The main pathways for the migration and transformation of different forms of nutrients in soil are different. Many studies have shown that phosphorus is easily fixed in soil, and leaching is less common than nitrogen removal. Soil particles also strongly adsorb ammonium nitrogen, while nitrate nitrogen is rarely adsorbed by soil particles and mainly exists in soil solution in the form of solutes, facilitating its leakage into groundwater (Pierzynski et al., 2005; King et al., 2015; Bender et al., 2018). Land use modes and management measures are among the most critical human factors affecting the spatial variation in soil nutrients (Nilovna et al., 2018; Zaher et al., 2020). Unreasonable land use causes the accumulation of nutrients in the soil, posing a threat to the safety of groundwater pollution. Many scholars have conducted research on the relationship between soil and underground leakage nutrient content; however, most of the related research is currently based on runoff plots or indoor and outdoor simulation experiments (Appels et al., 2016; Li et al., 2022), and insufficient research has been conducted on in situ monitoring under natural rainfall conditions in the field. The nutrient content characteristics of shallow groundwater on natural slopes more directly reflect the impact of slope land use, while current research is mostly based on field or watershed scales (Lin et al., 2018). The runoff output of pollutants in a watershed is closely related to land use and spatial structure, and research based on landscape ecology methods (Vrebos et al., 2017; Cheng et al., 2019) and on-site monitoring methods (Du et al., 2011; Xu et al., 2022) is the most common. Currently, on-site monitoring methods often involve the collection of samples from only a single rainfall event or from several rainfall events (Li et al., 2020); moreover, insufficient continuous monitoring research exists that can comprehensively reflect the impact of land use on pollutant output under different cultivation periods and rainfall conditions. However, relatively little research has been conducted on the dynamic changes in pollutant outputs during typical rainfall events.
The Three Gorges Reservoir area is one of the most sensitive areas in China’s ecological environment (Zhang et al., 2020); its terrain is mainly hilly and mountainous, and it is located in a concentrated rainfall area with numerous small agricultural catchments. Agricultural nonpoint source pollutants are easily transported and transformed from source watersheds via rainfall processes and ultimately flow into the Three Gorges Reservoir via runoff (Zhang L et al., 2015; Chen et al., 2016). As relatively independent catchment units, small catchments are sources of nonpoint source pollution occurrence and development. Exploring the impact of land use modes on the output of nonpoint source pollution in small catchments can help implement corresponding countermeasures to reduce and control nonpoint source pollution in reservoir areas. The typical agricultural small catchments in the Three Gorges Reservoir area were taken as an example to analyse the characteristics of the soil nutrient content under the different land use modes. The impact of land use on the nutrient content of shallow groundwater was explored at the slope scale. The rainfall and daily surface runoff data collected from the two subcatchments were used to compare the differences in nutrient output between the two subcatchments under the different land use modes. The proposed study provides a reference and guidance for the control of nonpoint source pollution in the Three Gorges Reservoir area and for the study of nonpoint source pollution in small catchments, with agriculture as the main focus.
2 Materials and methods
2.1 Overview of the study area
The Wangjiagou small catchment in the study area is located on the northern bank of the Yangtze River in the northeast region of Fuling District, Chongqing, with a geographical location between 107° 30′10″- 107° 30′55″E and 29° 53′54″- 29° 54′32″N, belonging to the first-class tributary of the Yangtze River (Figure 1). The region has a subtropical monsoon climate, with an average annual temperature of 22.1°C, an average annual rainfall of 1,011 mm, and a rainy season from April to October. The soil types in the catchment are representative purple soil and paddy soil from the Three Gorges Reservoir area. The terrain, which features the typical topographic and geomorphological features of the Three Gorges area, mainly consists of low mountains and hills interspersed with gullies and valleys, and the typical sloping arable land farming in the reservoir area of crops-mulberry planting pattern is widely distributed in the catchment.
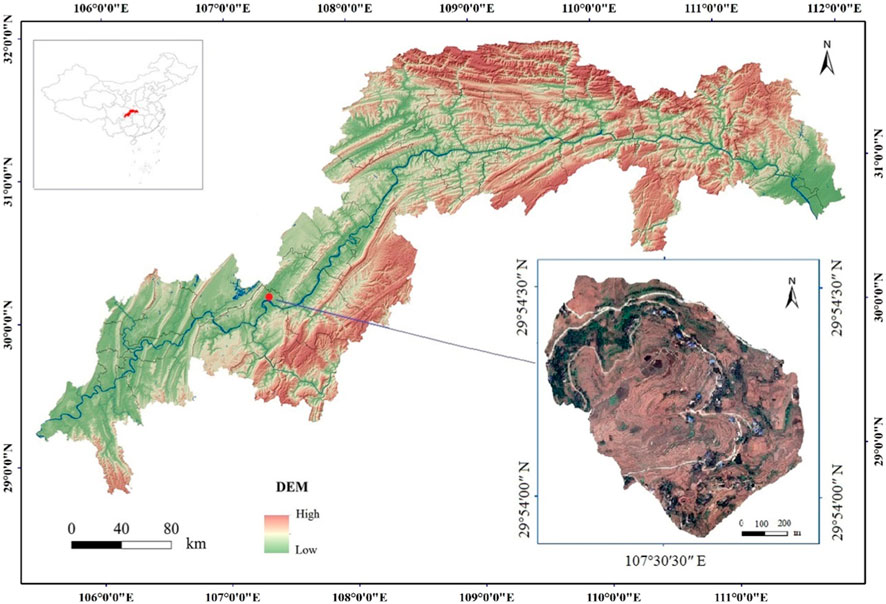
FIGURE 1. Location of the Wangjiagou catchment in the Three Gorges Reservoir area.
The catchment is closed and divided into two tree-shaped subcatchments (A and B) by natural landforms (Figure 2). The two outlet catchments have a total area of 82.34 hm2, the area of subcatchment A is 47.21 hm2 and that of subcatchment B is 35.13 hm2. According to the 1:1000 land use status map from 2014, combined with the field survey of land use change in the catchment in 2018, the land use status map of the Wangjiagou small catchment was drawn using ArcGIS 10.2 software (Figure 2). The main land use types and areas of the two subcatchments are shown in Table 1.
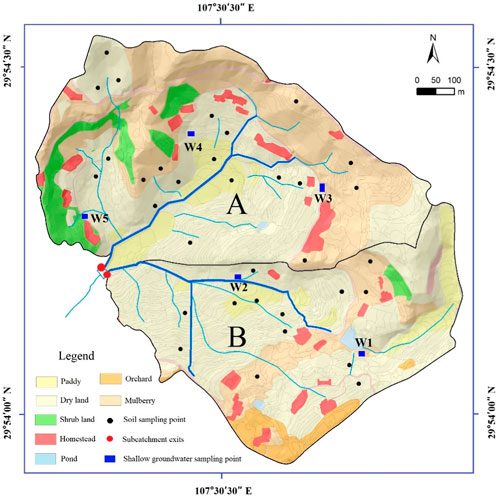
FIGURE 2. Map showing the land use status and layout of the sampling points in the study area (2018).

TABLE 1. Land use and the proportion of subcatchments A and B (2018) (unit: hm2).
The land reclamation rate in the catchment is high, and the crop planting mode is relatively simple. Corn and rice are the main crops in spring, and mustard is planted in autumn. Corn is sown in mid-March, at which point basal fertilizer is applied. Top dressing was applied at the beginning of May at a rate of approximately 180 kg N/hm2 (compound fertilizer for corn, N:P2O5:K2O = 11:9:5). The corn harvest was completed in mid-July. Rice plants were transplanted before the end of April and harvested in mid-August. Fertilizer was applied to the rice fields at a rate of 40 kg N/hm2. The mustard tubers are transplanted between the end of September and early October, and fertilizer is applied at a rate of approximately 220 kg N/hm2 (compound fertilizer for mustard tubers, N:P2O5:K2O = 12:6:7). Mustard tubers are harvested at the end of January of the following year.
2.2 Layout of sample collection points, collection methods and test methods
2.2.1 Selection and collection methods for soil samples
According to the spatial distribution and areal proportions of the different land use types in the catchment, the soil sample collection points were uniformly arranged (Figure 2). A total of 32 soil sample collection points were arranged in the catchment, i.e., 6 sampling points for sloping farmland in dry land, 12 sampling points for terraced farmland in dry land, 4 sampling points for the paddy field, 4 sampling points for the dense mulberry plantation, and 6 sampling points for mulberry interplanted sloping farmland. A total of 7 soil samples were collected in 2018–2019, mainly before the planting of spring and autumn crops, at the end of crop fertilization and during the idle period of the summer rotation.
2.2.2 Design and collection methods for shallow groundwater
According to the distribution characteristics of topography and geomorphology in the study area and from the perspective of the representativeness of land use modes, 5 slopes with a clear boundary of the catchment area on the slope and not prone to return flow were selected. A shallow groundwater collection well (Figure 2) was established at the bottom of the slope at a depth of 1.5–2.5 m and a sampling depth of 0.5–1 m. The land use modes of the five water wells were as follows: W1 was a dry land terrace, W2 was dryland sloping farmland, W3 was mulberry interplanted sloping farmland, W4 was a compound slope composed of dry sloping land, a mulberry garden, forestland and rural residential land, and W5 was forestland and a small part of dry sloping land. The well water samples were collected from March to December 2018, approximately once every 4 weeks, for a total of 15 samples.
2.2.3 Subcatchment rainfall process and daily surface runoff collection method
Subcatchment rainfall process sample collection: During the rainfall event on 5 June 2019, samples were collected every 15 min in the first 2 h after surface runoff generation, every 30 min from 2–5 h, and every 60 min from 5–10 h. A total of 19 samples were collected, and each sample was 200 mL in volume.
Subcatchment daily surface runoff collection: Automatic water samplers (ISCO 6712, America) were placed at the outlets of subcatchments A and B to collect surface water samples every day. The automatic water samplers were in operation from April to December 2019. Water samples were collected daily at six hourly intervals (at 0:00, 06:00, 12:00, and 18:00). The samples were then integrated to form a composite sample that was representative of the whole day. Over the study period, the automatic water sampler was regularly transported to the laboratory for checking and maintenance.
2.2.4 Sample test method
Water sample test method: The collected water samples were stored at 4°C, and the test was completed within 48 h. The water samples were split into two portions before analysis. One part was unfiltered and analysed for total nitrogen (TN) and total phosphorus (TP) content. The other part was passed through a 0.45-μm filter and tested for nitrate (NO3−-N). TN was determined by peroxide potassium sulfate-ultraviolet spectrophotometry (GB11894-89), TP was determined by the molybdenum blue method (GB11893-89), and NO3−-N was determined by ion chromatography (DX120).
Soil sample test methods: The total nitrogen in the soil was determined by the Kjeldahl method, the total phosphorus in the soil was determined by alkali fusion-molybdenum-antimony resistance colorimetry, and 0.5 mol/L NaHCO3 extraction-molybdenum-antimony resistance colorimetry was used for soil available phosphorus (AP) analysis. The content of NO3−-N in the fresh soil samples was determined via phenol disulfonic acid colorimetry.
2.2.5 Data analysis method
The distributions and degrees of variation in the TN, TP, NO3−-N and AP contents in the soil samples and shallow groundwater samples under the different land use modes were compared and analysed with SPSS 21 software (small letters indicate the results of multiple comparisons of significant differences). The spatial distribution characteristics of the different land types in the two subcatchments were analysed via ArcGIS 10.2 software.
3 Results and discussion
3.1 Spatial distribution characteristics of different land types in the subcatchments
The types of land use in the catchment included dry land, paddy fields, mulberry gardens, forestland, pond water surfaces, and rural residential areas. Among them, dry land, paddy fields and mulberry gardens were mainly affected by artificial cultivation. Combined with the existing farming methods used for different land types in the catchment, the land use modes were subdivided into five types: dryland sloping farmland (L1), dryland terrace (L2), paddy field terrace (L3), closely planted mulberry garden (L4), and mulberry interplanted sloping farmland (L5). According to the spatial distribution in the catchment, the cumulative changes in the area proportion of the spatial relative elevation (the outlet of the subcatchments was 0, and the maximum elevation was 1) and the relative slope (the minimum slope of the field in the subcatchments was 0, and the maximum slope was 1) of the five land types were calculated by using the theory of the Lorenz curve.
3.1.1 Comparison of relative elevation values
A comparison of the standard values of relative elevation (Figure 3) revealed that the relative elevation curves of dryland sloping farmland in the two subcatchments (L1) were roughly evenly distributed, which indicated that dryland sloping farmland was widely distributed in the catchment and distributed across different elevation intervals. Paddy fields and dry land terraces (L2 and L3) were mainly distributed in the lower section of the relative elevation, and paddy fields in subcatchment A were mainly distributed in the section below the standard value of a relative elevation of 0.1, that is, the bottom of the subcatchment; however, the standard values of the relative elevation of paddy fields in subcatchment B were concentrated in the two ranges of 0.1–0.2 and 0.6–0.7, and their spatial distributions were mainly in the slope waist and the gully area in the middle and upper parts of the subcatchment. The dry land terraces in subcatchment A were mainly distributed within the range below the relative elevation standard value of 0.4, while those in subcatchment B were more widely distributed. Mulberry interplanted sloping farmland (L5) was mainly distributed within the range of 0.3–0.8 relative elevation standard values, namely, the middle and upper parts of the catchment, with subcatchment A accounting for approximately 76% and subcatchment B accounting for approximately 92%, whose spatial distribution was relatively concentrated and contiguous.
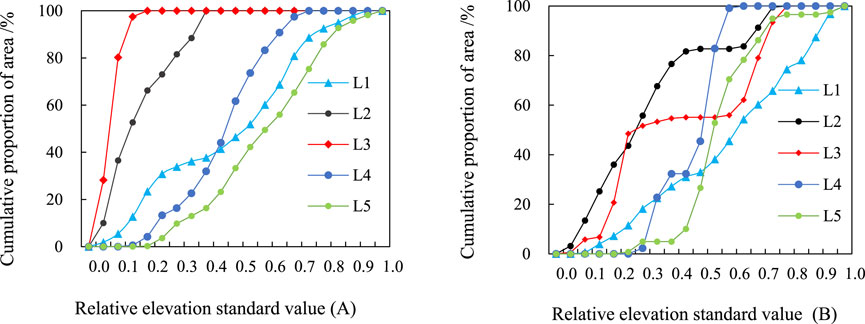
FIGURE 3. Lorenz curve of the relative elevation of five land types in subcatchments (A) and (B).
3.1.2 Comparison of the standard values of the relative slope
The Lorentz curves of the slopes of the different land types exhibited overall parallel distributions and were mainly distributed at the upper left of the equilibrium line (Figure 4). The distribution of various types in subcatchment B was mainly concentrated in the 0.1–0.35 range of the standard value of the relative slope, while the sloping farmland (L1, L4, L5) in subcatchment A was approximately evenly distributed in the 0.1–0.65 range, and its sloping farmland slope was greater than that in subcatchment B. The Lorenz curve of paddy fields and dry land terraces (L2 and L3) in the two subcatchments was closer to the Y-axis with the gradient, which showed that the gradient of terraces in the catchment was the slowest. The slope distribution range of dryland sloping farmland (L1) was smaller than that of mulberry interplanted sloping farmland (L5), and the relative slope standard value distribution range of the closely planted mulberry garden (L4) was the highest among the five land types, with the largest slope.
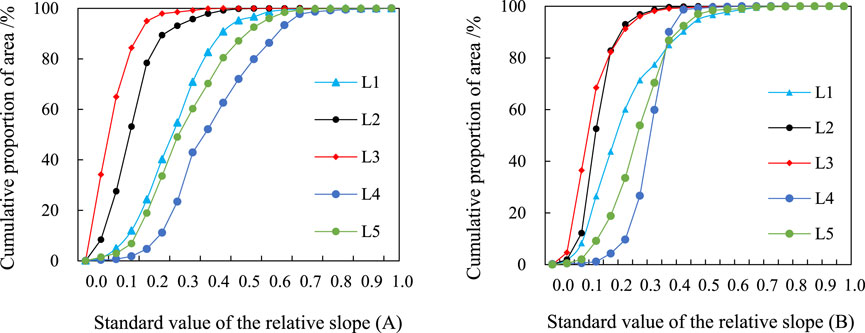
FIGURE 4. Lorenz curve of the relative gradients of five land types in subcatchments (A) and (B).
3.2 Characteristics of the soil nutrient content under the different land use modes
3.2.1 TN and TP content characteristics
A comparison of the nitrogen and phosphorus contents under the five different utilization modes (Figure 5) revealed that the average TN content (1.51 g/kg) in the paddy fields was significantly higher than that in the other four types (p < 0.05). Similarly, the average TN content in the closely planted mulberry fields was 1.07 g/kg, which was the lowest. Similarly, the average TN content in the terraced fields in the dry land was significantly higher than that in the sloping fields in the dry land (p < 0.05), and the average TN content in the soil of the mulberry interplanted sloping fields was also approximately 0.11 g/kg greater than that in the dry sloping fields. In contrast to that in the closely planted mulberry fields, the fertilization intensity of the spring and autumn crops in the mulberry interplanted sloping farmland was not significantly different from that in the dry land, and the soil total nitrogen (TN) content was 0.29 g/kg higher (approximately 27% higher) than that in the closely planted mulberry fields. The soil TP content under the different land use modes exhibited the opposite trend as that of TN, and the soil TP content in the sloping farmland was greater than that in the terrace. The total phosphorus (TP) content in dry sloping soil (1.37 g/kg) was the highest and was significantly higher than that in the other land types (p < 0.05), and the average TP content in paddy fields was 0.78 g/kg, which was the lowest and was 0.59 g/kg lower than that in dry sloping farmland.
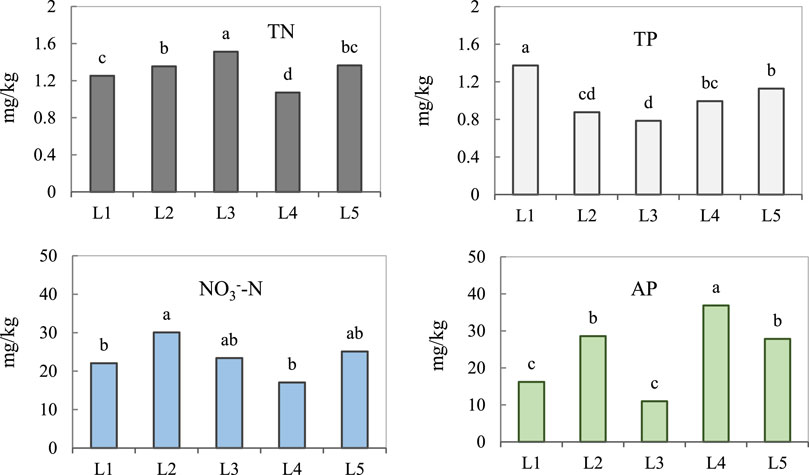
FIGURE 5. Contents of TN, TP, NO3−-N and AP in soil under different land use modes.
3.2.2 Characteristics of the soil NO3−-N and AP contents
The average soil NO3−-N content under the five land use modes was generally the same as the variation trend in TN. However, the NO3−-N content in the paddy field soil was lower than that in the TN, and there was no significant difference from that in the other land types. The average NO3−-N content in the terraced soil in the dry land was 30.05 mg/kg, which was the highest, and that in the closely planted mulberry garden was 17.05 mg/kg, which was the lowest. The difference in the AP content under the five land use modes was the most obvious. The AP content in the soil of the closely planted mulberry garden was 36.85 mg/kg, which was the highest, and that in the paddy field was 10.97 mg/kg, which was the lowest. The AP content in the dryland terraces was 12.38 mg/kg higher than that in the dryland sloping farmland, i.e., approximately 76% higher.
3.2.3 Comparison of dispersion degrees
A comparison of the dispersion coefficients of nitrogen and phosphorus nutrient contents in 5 different types of soils (Table 2) revealed that the dispersion coefficients of soil total nutrients (TN and TP) were significantly lower than those of quick-acting nutrients (NO3−-N and AP). The dispersion degree of the NO3−-N content was the largest, with the highest dispersion coefficient of 77.69% in dryland terraced fields, and the dispersion degree of TN was the smallest, which was less than 20%. Under the different land utilization modes, the dispersion coefficients of dryland sloping land and dryland terraces were higher than those of the other utilization modes, while the dispersion coefficient of dense mulberry orchard was lower, and its NO3−-N dispersion coefficient was only 46.86%. The dispersion coefficients of AP for the two slope cropland utilization modes (L1 and L5) were significantly higher than those of the other three modes.
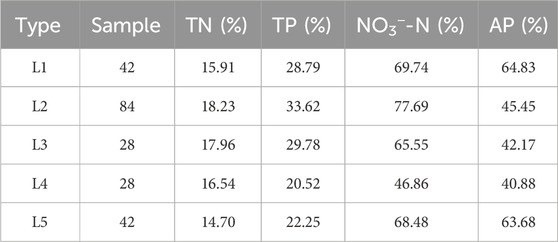
TABLE 2. Statistics of the dispersion coefficient of soil nitrogen and phosphorus contents under different land use types.
3.2.4 Land use mode impact analysis
The main utilization modes of drylands in the catchment are the mixed planting pattern of terracing, slope cultivation and mulberry, and the types of crop cultivation, fertilizer intensity and management modes of these three modes are basically the same. However, due to the better water and fertilizer retention of terraces (Jia et al., 2022), the TN, NO3−-N and AP contents of dryland terraced soils are significantly higher than those of slope cultivated soils (p < 0.05). According to Figure 3, the dryland sloping cropland in the catchment was mainly distributed in areas with relatively high terrain, which experienced rapid decomposition of soil organic matter, better aeration conditions, easier soil phosphorus fixation (Hu et al., 2013), and significantly higher TP content than did the other land types. Ding (2010) has utilized spatial interpolation to predict soil nutrients in small catchments, revealing that the distribution of TP in these catchments increases from the valley area to the surrounding highlands. A high standard deviation of the relative slope gradient of dryland sloping arable land in the catchment (see Figure 4) and a high intensity of soil erosion exacerbated the loss of AP from dryland sloping arable land soils. With the reduction in the AP content in soils, under the combined influence of fertilizer application, rainfall, and other factors, the degree of AP dissociation in the soils of dryland sloping arable land and mulberry tree-supported sloping arable land was also significantly higher than that under the other utilization modes. The surface of the densely planted mulberry garden was covered by dense branches and leaves of mulberry plants most of the time, in addition to the well-developed root system of mulberry plants, improving the erosion resistance of the soil and reducing the loss of AP (Liu et al., 2016). Under this utilization mode, the AP content is the highest, and the discrete degree is the lowest. The agricultural mulberry configuration farming conservation mode is more widely applied in the Three Gorges Reservoir area (Zhang et al., 2016). Although the fertilizer level applied to the mulberry set-aside slope cropland in the watershed was slightly lower than that applied to the dryland slope cropland, the TN and NO3−-N contents in the watershed were 9.2% and 14.1% higher, respectively, than those applied to the dryland slope cropland because the root system of mulberry planted in the set-aside region improved soil agglomeration, porosity, and other physical properties (Pu et al., 2012), promoted the formation of a good soil structure and prevented the loss of nitrogen from surface runoff. The crop cultivation pattern on paddy terraces involves planting rice and swede in turns, so the fertilizer intensity per unit area is lower than that in drylands. Due to the loose texture of the purple soil and the abundant rainfall in the Three Gorges Reservoir area (Wang et al., 2013), nitrogen fertilizer is lost in the form of NO3−-N in the process of rainfall-runoff and leaching. Rice paddy has a special redox process, and the mechanism of organic matter formation and preservation is entirely different between paddy fields and drylands, resulting in a significantly higher TN content than that of drylands, and that prolonged inundation resulted in nitrate nitrogen loss through anaerobic bacterial loss by denitrification under the action of anaerobic bacteria (Tian et al., 2021), the NO3−-N content of paddy soils is lower than that of dryland terraces. Phosphorus in paddy fields is easily sequestered by iron oxides so that the AP content will be greatly reduced, and the sequestered phosphorus in acidic soil can reach more than 80%.
3.3 Characteristics of nitrogen and phosphorus contents in shallow groundwater on different slopes
3.3.1 TN, NO3−-N and TP content characteristics of shallow groundwater
Based on the comparison of the nitrogen content of shallow groundwater on the slope surface under the different land use modes (Figure 6), the average contents of TN and NO3−-N in shallow groundwater (W1) on the slope surface mainly composed of dry land terraces were 17.09 mg/L and 13.52 mg/L, respectively, which were the highest and significantly higher than those of the other four slopes (p < 0.05). The average contents of TN and NO3−-N in the shallow groundwater (W5) on the slope surface were 7.95 mg/L and 5.54 mg/L, respectively, which were the lowest. The average contents of TN and NO3−-N in W1 were 114.96% and 144.04% higher, respectively, than those in W5. There was no significant difference in the average contents of TN and NO3−-N between the shallow groundwater (W2) on the slope of the dryland and the shallow groundwater (W3) on the slope of the interplanted mulberry plant (p > 0.05). The average content of TN in W2 was slightly higher than that in W3, while the average content of NO3−-N exhibited the opposite trend.
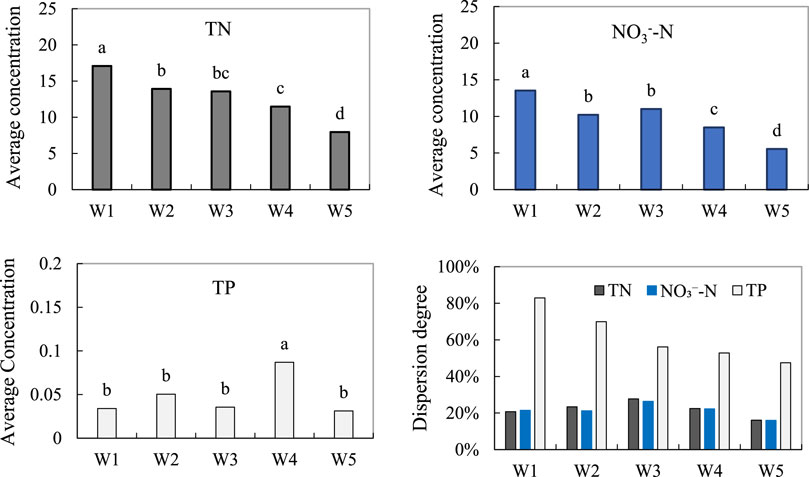
FIGURE 6. Comparison of the average nitrogen and phosphorus contents and dispersion coefficients of shallow groundwater on different slopes.
Compared with the average TN content of the shallow groundwater on the different slopes, the average TP content exhibited a small difference. As W4 was close to two peasant households and was affected by daily domestic sewage discharge, the average content of TP in shallow groundwater was 0.087 mg/L, which was the highest and was significantly higher than that of the other four slopes (p < 0.05). The average TP content in W2 was 0.051 mg/L, which was higher than that in the other three slopes. The average TP content in W5 was 0.031 mg/L, which was the lowest.
3.3.2 Comparison of dispersion degrees
Based on a comparison of the dispersion degrees of the nitrogen and phosphorus contents in the shallow groundwater on the five slopes (Figure 6), the dispersion coefficients of the TN and NO3−-N contents on each slope were between 16% and 28%, which are far lower than the dispersion coefficient of TP. The TP dispersion coefficient in W1 was the highest at 83%, and that in W5 was the lowest at 47%. The dispersion coefficient of the TN concentration was mostly higher than that of NO3−-N. The TN and NO3−-N dispersion coefficients of W3 were slightly higher than those of the other four slopes, and the TN and NO3−-N dispersion coefficients of W5 were the smallest.
3.3.3 Temporal variation characteristics of shallow groundwater
Three land types, namely, dryland sloping farmland (L1), dryland terrace (L2) and mulberry interplanted sloping farmland (L5), which were significantly affected by tillage, were selected to study the characteristics of changes in shallow groundwater concentration during different tillage periods based on the average contents of TN, NO3−-N and TP. According to Figure 7, the concentrations of TN and NO3−-N in the shallow groundwater on the three slopes significantly increased after the second sampling event (March 21), while the TP began to increase after the third sampling event (April 18). During the spring crop period (between the 2nd and 7th sampling periods), affected by rainfall and fertilization, the contents of TN and NO3−-N in the shallow groundwater first increased, then decreased and peaked during the fifth sampling period (May 14), with average contents of TN and NO3−-N of 17.25 mg/L and 15.22 mg/L, respectively. During the idle period of the summer rotation (between the 7th and 10th sampling events), the average contents of TN and NO3−-N showed a downwards trend, and the average content of TP began to decline after reaching an annual peak of 0.075 mg/L. During the autumn crop period (between the 10th and 15th sampling periods), the average content of TN in the shallow groundwater on the three slopes increased rapidly, reaching an annual peak of 19.98 mg/L at the 14th sampling period, while the average content of NO3−-N was relatively stable. The average TP content increased slowly and then decreased slowly and was slightly lower than the average TP content during the spring crop period.
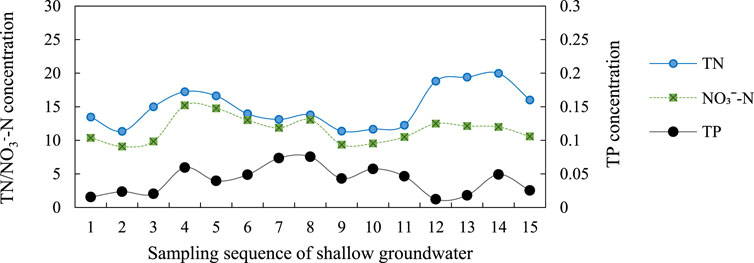
FIGURE 7. Average contents of TN, NO3−-N and TP in shallow groundwater on three slopes and their variations with sampling time.
3.3.4 Change in the NO3−-N contribution rate to TN in shallow groundwater
Based on the contribution rate of NO3−-N to TN in shallow groundwater on the three slopes (Figure 8), the nitrogen in shallow groundwater mainly originated from the NO3−-N in the soil. When the TN content of the shallow groundwater was less than 10 mg/L, the contribution rate of NO3−-N to TN was within 70%; when the TN content was 10–15 mg/L, NO3−-N had the highest contribution rate to TN, with an average of 79.09%; and when the TN content exceeded 15 mg/L, the contribution rate of NO3−-N to TN was mostly less than 70%.
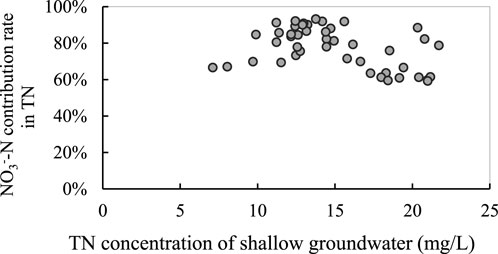
FIGURE 8. Variation in the NO3−-N contribution rate to TN concentration in shallow groundwater.
3.3.5 Analysis of the impact of slope land use practices on shallow groundwater
The formation time of purple soil was short, and the process was dominated by physical weathering; thus, purple soil has abundant capillary pores and good water permeability and is prone to infiltration when disturbed by anthropogenic production and living activities (Necpalova, et al., 2012). A comparison of the average contents of TN, NO3−-N and TP in the 5 slopes of shallow groundwater revealed that the TN and NO3−-N concentrations were more significantly affected by the land utilization mode of the infiltration slopes, but their effect on the TP concentration was not obvious. This is mainly due to the reaction of phosphorus with the soil to form soil minerals, coupled with the adsorption and fixation of phosphorus in different soil layers, which limits its ability to migrate downwards in the soil (Zhang T et al., 2015; He et al., 2022). However, owing to the negative charge of the soil particles, the nitrogen fertilizer applied to the soil had a strong adsorption capacity for ammonium ions and a weak adsorption capacity for nitrate ions (Cai et al., 2016); additionally, the nitrogen fertilizer was applied mainly in the form of solutes in the soil solution and easily leaked to the groundwater or lost from surface runoff (Molenat et al., 2008; He et al., 2016). The contribution of NO3−-N to TN in shallow groundwater can also be seen from the contribution of NO3−-N in the range of 59%–93% (see Figure 8), which was the main form of TN present in shallow groundwater. Many studies on purple soil areas also show that the contribution of NO3−-N to TN in shallow groundwater ranges from 62% to 97% (Zhu et al., 2006; Jia et al., 2007). Combined with the characteristics of shallow groundwater changes over time, the TN and NO3−-N concentrations in shallow groundwater increased after crop fertilization in spring and autumn. Especially during the spring planting period, with increasing rainfall, the NO3−-N that accumulated in the soil was more likely to leach into the shallow groundwater during the rainfall, and its contribution to TN became the greatest. According to the study of the soil on the slope, the NO3−-N content in the dryland terrace soil was significantly higher than that in the dryland sloping cultivated land (see Figure 5), and the shallow groundwater and NO3−-N content are usually considered to have a linear positive correlation; therefore, the average concentrations of TN and NO3−-N in the shallow groundwater on the terraced slope of the dryland terrace (W1) were higher than those in the dryland slope cropland (W2). The slope of W4 was distributed across several settlements, and the output of soluble phosphorus from daily life water use had a greater impact on the total phosphorus (TP) content in shallow groundwater than in the other slopes (Hou et al., 2022), which may be the main reason for the significantly higher average TP concentration in the former. Since the TP content in shallow groundwater is much lower than that of TN and NO3−-N, factors such as fertilizer application are very likely to lead to larger changes in TP concentration, and the degree of dispersion is significantly higher than that of TN and NO3−-N.
3.4 Comparison of the variation characteristics of nitrogen and phosphorus loss concentrations in surface runoff in subcatchments
3.4.1 Comparison of the rainfall process
Based on the surface runoff samples collected during heavy rain (38 mm/24 h) on June 5, the changes in the total nitrogen (TN) and total phosphorus (TP) loss concentrations in surface runoff in the two subcatchments during the rainfall process were analysed. The change in precipitation every 5 min during the rainfall process is shown in Figure 9.
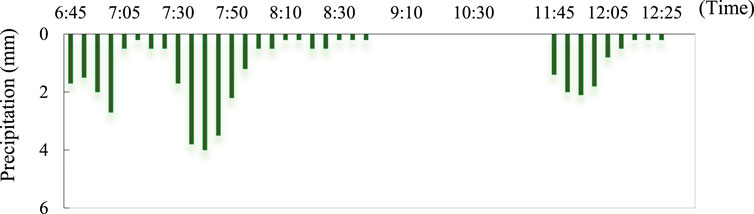
FIGURE 9. Changes in precipitation with time during the rainfall process (the interval time is 5 min).
As shown in Figure 10, the TN loss concentration in surface runoff from the two subcatchments did not change significantly during the four sample collections in the 1st hour after runoff generation. However, it fluctuated slightly more in subcatchment A. The TN loss concentration in the two subcatchments showed the first peak at approximately 75 min after runoff generation and then declined rapidly. Afterwards, subcatchment A fluctuated and increased with increasing rainfall duration, rising to a high level 3.5 h after runoff generation and then slowly declining, whereas subcatchment B peaked again 2 h after runoff generation and then declined rapidly after 1 h. After 6 h, a second peak occurred, after which the concentration of TN loss in surface runoff decreased gradually from the high level.
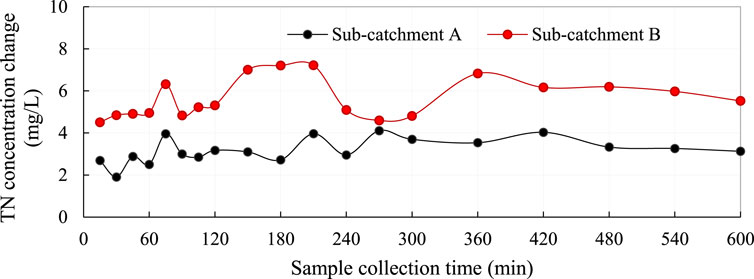
FIGURE 10. Change in the TN loss concentration in surface runoff in the subcatchments during the rainfall process.
Based on the comparison of the TP loss concentration in surface runoff between the two subcatchments (Figure 11), the TP loss concentration in surface runoff in subcatchment A increased rapidly 1 h after runoff generation and decreased rapidly after reaching the peak value of 0.727 mg/L. The concentration of TP loss continued to fluctuate at approximately 0.1 mg/L 2 hours after runoff generation and generally showed a gradual downwards trend. The TP loss concentration in surface runoff in subcatchment B generally showed a slow increasing trend in the first 2 hours after runoff generation, reaching a peak value of 0.982 mg/L after 2.5 h of runoff generation, and the TP loss concentration in surface runoff was high during 2–4 h of runoff generation. Afterwards, it was less affected by rainfall and showed a slow downwards trend from 6–10 h.
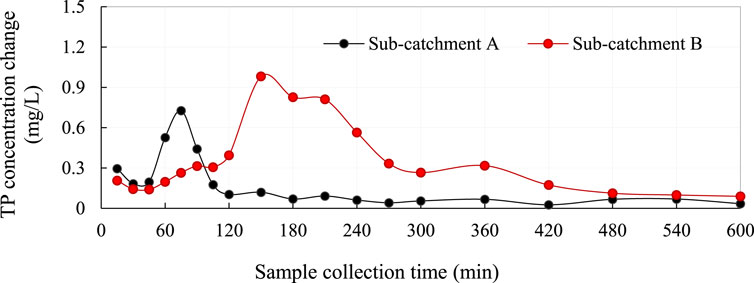
FIGURE 11. Change in the TP loss concentration in the surface runoff in the subcatchments during the rainfall process.
3.4.2 Analysis of the response of the rainfall processes
Several studies have suggested that the loss of TN decreases rapidly due to the dilution effect of runoff in the early stage of rainfall (Fang et al., 2021), while the change in TN loss in the early stage of rainfall in the two sub-watersheds in the present study was not significant, which may be related mainly to the size of the watersheds and the land-use pattern near the outlet of the watersheds. The larger the watershed is, the longer the time for the surface runoff carrying the nutrients to be pooled at the outlet (Bauwe et al., 2015); thus, at the beginning of the rainfall period, the surface runoff at the outlet mainly consisted of rainwater and surface runoff from nearby slopes. The selected watersheds in this study are relatively small in size, with a high percentage of paddy fields at the bottom of the slope in subbasin A, into which the surface runoff from paddy fields at the outlet at the beginning of the rainfall period converged. Therefore, the concentration of TN loss gradually increased, while the concentration of TN loss in subbasin B slowly increased because of the predominance of drylands in the vicinity. With the continuation of rainfall, the nitrogen in the soil of sloping cultivated land was dissolved in the water and flowed to the outlet. As spring crops such as corn and rice in the catchment grew rapidly in early June, the ground was mostly covered with vegetation; thus, the impact of the loss of TN was relatively small (Araya et al., 2011). However, subbasin A had a high ratio of mulberry gardens and mulberry set-aside sloping cropland areas, and frequent mulberry leaf harvesting activities disturbed the topsoil, resulting in surface runoff carrying many soil particles at the beginning of the rainfall period; thus, the TP concentration in surface runoff increased rapidly. Under the influence of high-intensity rainfall on soil splash erosion in the middle stage of rainfall (Dunne et al., 2010; Ma et al., 2022), soil particles from dryland cornfields were separated into runoff water bodies, and the TP concentration in subbasin B peaked rapidly, whereas disturbed surface soil particles from mulberry gardens and mulberry planting slope cultivated land were carried by initial rainfall runoff. Moreover, the weakening of the kinetic energy of raindrops by branches and leaves and the anchoring of soil by the root system weaken the erosive effect of rainfall in the later stage. Together with the high distribution of paddy fields at the bottom of the slope in subbasin A (see Figure 2), which can effectively intercept the particulate phosphorus carried by surface runoff from dryland slopes (House et al., 1994; Cao et al., 2006), the TP loss continued to decrease after a rapid decline. The concentrations of TN and TP loss in the two subbasins decreased steadily in the later stages of rainfall, but the concentration of TN loss in subbasin B was approximately twice as high as that in subbasin A due to the differences in land-use practices and spatial patterns.
3.4.3 Comparison of daily surface runoff
The basic fertilizer for spring corn in the studied area was applied mainly in mid- and late March. The TN loss concentration in the daily surface runoff in the subcatchments increased rapidly at the beginning of April but began to decline rapidly in mid- and late April. From the end of April to the beginning of May, the dry land corn crop in the basin received topdressing, and the TN loss concentration in the two subcatchments peaked again in the middle of May (Figure 12). In the middle of June, affected by the increase in rainfall and rainfall intensity, the TN loss concentration in the two subcatchments peaked for the third time, after which the TN loss concentration slowly decreased. During the spring crop season, the average loss concentration of TN in subcatchment B was 8.69 mg/L, which was approximately 37.23% higher than that of 6.33 mg/L in subcatchment A. In particular, when the TN loss concentration was high, such as when the TN loss concentration was higher than 10 mg/L, the TN loss concentration in subcatchment B was approximately 48.64% greater than that in subcatchment A. The TN loss concentration in the two subcatchments was low due to low amounts of rainfall and few rainfall events during the summer idle period. At the beginning of October, the autumn crop (mustard) was transplanted into the two subcatchments. Affected by fertilization, the TN loss concentration in surface runoff exhibited the fourth highest peak in the year, after which it slowly decreased. During this period, the difference in the TN loss concentration between the two subcatchments was more obvious than that in the spring crop period.
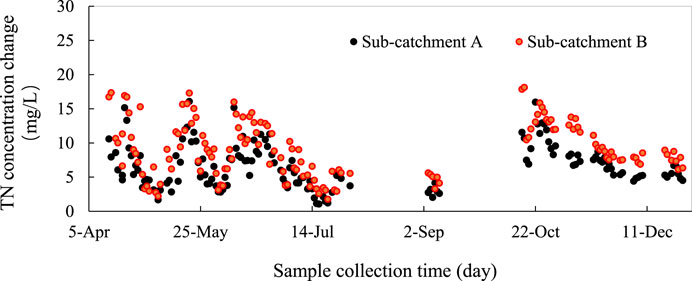
FIGURE 12. Change in the TN loss concentration in the daily surface runoff of the subcatchments.
Based on a comparison of the TP concentrations in the surface daily runoff in the two subcatchments, the TP loss concentration in subcatchment A fluctuated slightly during the different periods, and 16 samples with loss concentrations higher than 0.1 mg/L mainly appeared in the early stage of crop fertilization in spring and autumn and during the heavy rainfall period (Figure 13). However, subcatchment B was different. The TP surface runoff loss concentration increased significantly in the early stage of fertilization and during heavy rainfall. Among the 141 daily runoff samples collected, 53 had loss concentrations higher than 0.1 mg/L. Furthermore, 12 TP concentrations exceeded 0.5 mg/L. Combined with the analysis of surface runoff during the rainfall process (Figure 11), the TP loss concentration in surface runoff at the outlet of subcatchment B was more likely to fluctuate than that in subcatchment A, and the high level lasted for a long time. The difference in the average loss concentration of TP was more obvious than that of TN in the daily surface runoff of the two subcatchments. The average loss concentration in subcatchment A was 0.055 mg/L, and that in subcatchment B was 0.145 mg/L, which was 1.64 times that in subcatchment A.

FIGURE 13. Change in the TP loss concentration in the daily surface runoff of the subcatchments.
3.4.4 Analysis of the impact of land use patterns and their spatial patterns
At the watershed scale, the correlation between the land-use structure and spatial combination of land use structures in watersheds and between the water quality and surface runoff is more significant (Molina et al., 2017; Wan et al., 2021). Combined with the current land use status of the two subbasins (see Figure 2) and Lorenz curve analysis (see Figure 4; Figure 5), the differences in land use patterns and spatial patterns of the two subbasins are mainly manifested as follows. First, subbasin A had a high ratio of forested land, mulberry gardens, mulberry plantations, and paddy fields, with fewer dryland sloping cropland and more terraced fields; dense mulberry gardens were distributed in all the regions with high relative slopes; and paddy fields were located mainly at the bottom of the slopes where the standard value of the relative elevation difference was relatively low. Second, the dryland slope cultivated land and dryland terraces in subbasin B are adjacent to the water outlet, with a high proportion of slope cultivated land, and the paddy fields are mostly distributed in the slope waist, the middle and upper parts of the subbasin, and the paddy fields are relatively dispersed. After fertilization in spring, frequent and intense rainfall led to generally high losses of TN and TP in surface runoff (Rixon et al., 2020). During this period, influenced by land use and spatial patterns, the decrease in the TN concentration in subbasin A was lower than that in subbasin B. Considering the sub-rainfall event, the TP loss was probably influenced mainly by the spatial distribution pattern of the paddy fields, and the paddy fields in subbasin A effectively intercepted the loss of particulate phosphorus, while the TP loss from surface runoff in the two subcatchments did not increase. Many studies have also shown that paddy fields at the bottom of slopes could effectively intercept nutrient loss from the upper end of slopes and reduce the intensity of nutrient removal from slopes (Wang et al., 2019; Chen et al., 2020). In the fall, there was less heavy rainfall and less TP floating in the two subcatchments, so the loss of TN increased rapidly after fertilization and then declined slowly. As influenced by the ratio of swede acreage, the loss of TN in subcatchment A was lower than that in subcatchment B.
4 Conclusion
(1) Based on a comparison of the soil nitrogen and phosphorus contents under the different land use modes, the average TN content in the paddy fields was the highest at 1.51 g/kg, and the average TP and AP contents were the lowest at 0.76 g/kg and 10.97 mg/kg, respectively. The average TN and NO3−-N contents in dry land terraces were significantly higher (P < 0.05) than those in dry land sloping farmland, the average TP content was significantly lower (P < 0.05) than that in dry land sloping farmland, and the dispersion degree of NO3−-N in dry land terraces was the greatest. The average TN and NO3−-N contents in the soil of the closely planted mulberry garden were the lowest, the AP content was the highest at 36.85 mg/kg, and the dispersion degree of TP and AP was the smallest.
(2) The sloping land use mode had a significant impact on the concentrations of TN and NO3−-N in shallow groundwater but had a small impact on the concentration of TP. The concentrations of TN and NO3−-N in shallow groundwater with dry land terraces were the highest at 17.09 mg/L and 13.52 mg/L, respectively. However, the concentrations of TN and NO3−-N in shallow groundwater on slopes with a higher proportion of forestland and less affected by human activities were significantly lower than those on other slopes (P < 0.05), and the dispersions of TN, TP and NO3−-N were the smallest. The average concentration of TN in the shallow groundwater on the three slopes strongly affected by cultivation was the highest in the autumn crop period, while the average concentration of NO3−-N in the spring crop period was the highest. The average concentration of TP increased slightly after fertilization of the spring and autumn crops, but its peak value occurred mainly during the summer rotation idle period. The contribution rate of NO3−-N to TN in shallow groundwater ranged from 59%–93%. When the TN content was 10–15 mg/L, the contribution rate of NO3−-N to TN reached 79.09% on average.
(3) Influenced by the land use structure and spatial layout, the TN and TP loss concentrations during the rainfall process and daily surface runoff of the two subcatchments significantly differed. The area ratio of forestland to mulberry interplanted sloping farmland in subcatchment A was high, and paddy fields were mainly distributed at the bottom of the subcatchment. The TN concentration fluctuated slightly during each rainfall event, with an average loss concentration of 3.2 mg/L, which was 43.5% lower than the average concentration in subcatchment B. The TP concentration was more stable. After 2 h of runoff generation, the TP loss concentration in subcatchment A continued to reach a low level, while that in subcatchment B started to decline slowly after 6 h of runoff generation. The difference in the TN loss concentration in the daily surface runoff between the two subcatchments was the most obvious in the autumn crop period, while the difference in TP concentration was mainly manifested in the early stage of crop fertilization in spring and autumn, and the higher the TN and TP loss concentration was, the more significant the difference was.
(4) At the slope scale, the soil nutrient content is closely related to rainfall and surface runoff, and the relationships between the nutrient content of soil and between shallow groundwater and surface runoff can provide a more comprehensive understanding of the impact of land use on pollutant output from land sources. Furthermore, the “source‒sink” landscape theory is a new research method for landscape pattern analysis that can be used to effectively integrate landscape patterns with ecological processes at the watershed scale and can more accurately interpret the differences in the characteristics of the pollutant outputs of two subcatchments.
Data availability statement
The raw data supporting the conclusion of this article will be made available by the authors, without undue reservation.
Author contributions
CC: Writing–original draft. HD: Methodology, Writing–review and editing. GX: Software, Writing–review and editing. YZ: Funding acquisition, Resources, Supervision, Writing–review and editing.
Funding
The author(s) declare financial support was received for the research, authorship, and/or publication of this article. This research was funded by the Chongqing Social Science Planning Project (2019YBGL055), the Humanities and Social Science Research Project of Chongqing Education Commission (19JD055), the Natural Science Foundation of Chongqing (cstc2020jcyj-msxmX0843), and the Chongqing Education Comprehensive Reform Pilot Project (23JGS60).
Conflict of interest
The authors declare that the research was conducted in the absence of any commercial or financial relationships that could be construed as a potential conflict of interest.
Publisher’s note
All claims expressed in this article are solely those of the authors and do not necessarily represent those of their affiliated organizations, or those of the publisher, the editors and the reviewers. Any product that may be evaluated in this article, or claim that may be made by its manufacturer, is not guaranteed or endorsed by the publisher.
References
Anand, J., Gosain, A. K., and Khosa, R. (2018). Prediction of land use changes based on Land Change Modeler and attribution of changes in the water balance of Ganga basin to land use change using the SWAT model. Sci. Total Environ. 644, 503–519. doi:10.1016/j.scitotenv.2018.07.017
Appels, W. M., Bogaart, P. W., van der Zee, , and Sjoerd, E. A. T. M. (2016). Surface runoff in flat terrain: how field topography and runoff generating processes control hydrological connectivity. J. Hydrology 534, 493–504. doi:10.1016/j.jhydrol.2016.01.021
Araya, T., Cornelis, W. M., Nyssen, J., Govaerts, B., Bauer, H., Gebreegziabher, T., et al. (2011). Effects of conservation agriculture on runoff, soil loss and crop yield under rainfed conditions in Tigray, Northern Ethiopia. Soil Use Manag. 27 (3), 404–414. doi:10.1111/j.1475-2743.2011.00347.x
Bauwe, A., Tiemeyer, B., Kahle, P., and Lennartz, B. (2015). Classifying hydrological events to quantify their impact on nitrate leaching across three spatial scales. J. Hydrology 531, 589–601. doi:10.1016/J.JHYDROL.2015.10.069
Bender, M. A., Dos Santos, D. R., Tiecher, T., Minella, J. P. G., De Barros, C. A. P., and Ramon, R. (2018). Phosphorus dynamics during storm events in a subtropical rural catchment in southern Brazil. Agric. Ecosyst. Environ. 261, 93–102. doi:10.1016/j.agee.2018.04.004
Cai, Y., Qi, H., Liu, Y., and He, X. (2016). Sorption/desorption behavior and mechanism of NH4(+) by biochar as a nitrogen fertilizer sustained-release material. J. Agric. Food Chem. 64 (24), 4958–4964. doi:10.1021/acs.jafc.6b00109
Cao, Z. H., Lin, X. G., Yang, L. Z., Hu, Z. Y., and Dong, Y. H. (2006). Ecological function of 'Paddy Field Ring' to urban and rural environments. I. Characteristics of soil P losses from paddy fields to water by runoff. Acta Pedol. Sin. 42 (5), 256–260. doi:10.11766/trxb200505080213
Chen, C. L., Gao, M., Xie, D. T., and Ni, J. P. (2016). Spatial and temporal variations in non-point source losses of nitrogen and phosphorus in a small agricultural catchment in the Three Gorges Region. Environ. Monit. Assess. 188, 257. doi:10.1007/s10661-016-5260-0
Chen, L. D., Sun, R. H., and Lu, Y. H. (2019). A conceptual model for a process-oriented landscape pattern analysis. Sci. China Earth Sci. 62 (12), 2050–2057. doi:10.1007/s11430-019-9427-2
Chen, S. Q., Long, Y., Yan, D. C., Ming, G., Li, J. C., Xu, G. X., et al. (2020). Characteristics of nitrogen and phosphorus output and loss flux in the shipanqiu watershed, three gorges reservoir area. Environ. Sci. 41, 1276–1285. doi:10.13227/j.hjkx.201909082
Cheng, X., Chen, L. D., and Sun, R. H. (2019). Modeling the non-point source pollution risks by combing pollutant sources, precipitation, and landscape structure. Environ. Sci. Pollut. Res. 26 (12), 11856–11863. doi:10.1007/s11356-019-04384-y
Ding, E. J. (2010). A land-use optimization approach for agricultural nonpoint sources pollution control in the three-gorge reservoir area. dissertation/doctoral thesis. Chongqing: Southwest University.
Du, J., Yang, P. L., Li, Y. K., Ren, S. M., and Wang, Y. Z. (2011). Effect of different irrigation seasons on the transfer of N in different types farmlands and the no-point pollution production. Trans. CSAE 27 (1), 66–74. doi:10.3969/j.issn.1002-6819.2011.1.010
Dunne, T., Malmon, D. V., and Mudd, S. M. (2010). A rain splash transport equation assimilating field and laboratory measurements. J. Geophys Res-Earth 115, 2009JF001302. doi:10.1029/2009JF001302
Essaid, H. I., Bekins, B. A., and Cozzarelli, I. M. (2015). Organic contaminant transport and fate in the subsurface: evolution of knowledge and understanding. Water Resour. Res. 51 (7), 4861–4902. doi:10.1002/2015WR017121
Fang, Z. D., Su, J. J., Zhao, H. T., Hu, L., and Li, X. Y. (2021). Output characteristics of nitrogen and phosphorus from non-point source pollution of typical land use in A micro-watershed in hilly red soil region. Environ. Sci. 42 (11), 5394–5404. doi:10.13227/j.hjkx.202103163
Fernandez-Raga, M., Palencia, C., Keesstra, S., Jordan, A., Fraile, R., Angulo-Martinez, M., et al. (2017). Splash erosion: a review with unanswered questions. Earth-Science Rev. 171, 463–477. doi:10.1016/j.earscirev.2017.06.009
He, G., Wang, Z., Li, F., Dai, J., Ma, X., Li, Q., et al. (2016). Soil nitrate–N residue, loss and accumulation affected by soil surface management and precipitation in a winter wheat-summer fallow system on dryland. Nutr. Cycl. Agroecosyst 106, 31–46. doi:10.1007/s10705-016-9787-9
He, X. L., Zheng, Z. C., Li, T. G., and He, S. Q. (2022). Effects of phosphorus fertilizer application rates on colloidal phosphorus leaching in purple soil in southwest China. Water 14, 2391. doi:10.3390/w14152391
Hou, L., Zhou, Z. Y., Wang, R. Y., Li, J. X., Dong, F., and Liu, J. Q. (2022). Research on the non-point source pollution characteristics of important drinking water sources. Water-Sui 14 (2), 211. doi:10.3390/w14020211
House, C. H., Broome, S. W., and Hoover, M. T. (1994). Treatment of nitrogen and phosphorus by a constructed upland-wetland wastewater treatment system. Water Sci. Technol. 29 (4), 177–184. doi:10.2166/wst.1994.0185
Hu, Z. F., Gao, M., Xie, D. T., and Wang, Z. F. (2013). Phosphorus loss from dry sloping lands of three gorges reservoir area, China. Pedosphere 23, 385–394. doi:10.1016/S1002-0160(13)60030-2
Islam, M. M. M., Iqbal, M. S., Leemans, R., and Hofstra, N. (2018). Modelling the impact of future socio-economic and climate change scenarios on river microbial water quality. Int. J. Hyg. Environ. Health 221 (2), 283–292. doi:10.1016/j.ijheh.2017.11.006
Jia, H., Wang, X., Sun, W., Mu, X., Gao, P., Zhao, G., et al. (2022). Estimation of soil erosion and evaluation of soil and water conservation benefit in terraces under extreme precipitation. Water 14, 1675. doi:10.3390/w14111675
Jia, H. Y., Lei, A., Lei, J. S., Ye, M., and Zhao, J. Z. (2007). Effects of hydrological processes on nitrogen loss in purple soil. Agric. Water Manag. 89 (1-2), 89–97. doi:10.1016/j.agwat.2006.12.013
King, K. W., Williams, M. R., Macrae, M. L., Fausey, N. R., Frankenberger, J., Smith, D. R., et al. (2015). Phosphorus transport in agricultural subsurface drainage: a review. J. Environ. Qual. 44 (2), 467–485. doi:10.2134/jeq2014.04.0163
Lee, C. H., Wang, C. C., Lin, H. H., Lee, S. S., Tsang, D. C. W., Jien, S. H., et al. (2018). In-situ biochar application conserves nutrients while simultaneously mitigating runoff and erosion of an Fe-oxide-enriched tropical soil. Sci. Total Environ. 619, 665–671. doi:10.1016/j.scitotenv.2017.11.023
Lee, S. W., Kim, J. H., and Cha, S. M. (2020). Analysis of the relation between pollutant loading and water depth flowrate changes in a constructed wetland for agricultural nonpoint source pollution management. Ecol. Eng. 152 (1–3), 105841. doi:10.1016/j.ecoleng.2020.105841
Li, G. F., Yang, H., Ye, Y. H., Chen, Q. F., Cui, R. Y., Chen, A. Q., et al. (2022). Shallow groundwater around plateau lakes: spatiotemporal distribution of nitrogen and its driving factors. Environ. Sci. 43 (6), 3027–3036. doi:10.13227/j.hjkx.202109195
Li, J. Y., Wei, Q., Wagn, H. Y., Chen, P., Cheng, H., and Xu, J. Z. (2020). Nitrogen loss with rainfall leaching from paddy field. J. Irrigation Drainage 39 (12), 97–102. doi:10.13522/j.cnki.ggps.2020190
Lin, C., Ma, R. H., and Xiong, J. F. (2018). Can the watershed non-point phosphorus pollution be interpreted by critical soil properties? A new insight of different soil P states. Sci. Total Environ. 628-629, 870–881. doi:10.1016/j.scitotenv.2018.02.098
Liu, Y., Willison, J. H. M., Wan, P., Xiong, X. Z., Ou, Y., Huang, X. H., et al. (2016). Mulberry trees conserved soil and protected water quality in the riparian zone of the Three Gorges Reservoir, China. Environ. Sci. Pollut. Res. 23, 5288–5295. doi:10.1007/s11356-015-5731-9
Ma, L., Huang, Z. L., and Lin, H. (2022). Effects of land use on soil nutrient loss and water quality in the three gorges reservoir area of China. J. Hydroecology 43 (1), 1–7. doi:10.1111/j.1475-2743.2001.tb00040.x
Molenat, J., Gascuel-Odoux, C., Ruiz, L., and Gruau, G. (2008). Role of water table dynamics on stream nitrate export and concentration in agricultural headwater catchment (France). J. Hydrology 348 (3-4), 363–378. doi:10.1016/j.jhydrol.2007.10.005
Molina, M. C., Roa-Fuentes, C. A., Zeni, J. O., and Casatti, L. (2017). The effects of land use at different spatial scales on instream features in agricultural streams. Limnologica 65, 14–21. doi:10.1016/j.limno.2017.06.001
Necpalova, M., Fenton, O., Casey, I., and Humphreys, J. (2012). N leaching to groundwater from dairy production involving grazing over the winter on a clay-loam soil. Sci. Total Environ. 432, 159–172. doi:10.1016/j.scitotenv.2012.05.091
Nilovna, C., Ramachandran, N., Saptarshi, C., and Nair, V. D. (2018). Changes in soil carbon stocks across the forest-agroforest-agriculture/pasture continuum in various agroecological regions: a meta-analysis. Agric. Ecosyst. Environ. 266, 55–67. doi:10.1016/j.agee.2018.07.014
Ou, Y., Rousseau, A. N., Wang, L. X., and Yan, B. X. (2017). Spatio-temporal patterns of soil organic carbon and pH in relation to environmental factors—a case study of the Black Soil Region of Northeastern China. Agric. Ecosyst. Environ. 245, 22–31. doi:10.1016/j.agee.2017.05.003
Pierzynski, G. M., McDowell, R. W., and Sims, J. T. (2005). Chemistry, cycling, and potential movement of inorganic phosphorus in soils. Phosphorus Agric. Environ. 2, 53–86. doi:10.2134/agronmonogr46.c3
Pu, Y. L., Xie, D. T., Lin, C. W., Ding, E. J., and Zhan, g K. (2012). Composition and fractal features of soil micro-aggregates in sloping farmland with headgerow. Acta Pedol. Sin. 49 (6), 1069–1077. doi:10.11766/trxb201201070009
Rixon, S., Levison, J., Binns, A., and Persaud, E. (2020). Spatiotemporal variations of nitrogen and phosphorus in a clay plain hydrological system in the Great Lakes Basin. Sci. Total Environ. 714, 136328. doi:10.1016/j.scitotenv.2019.136328
Selassie, Y. G., Anemut, F., and Addisu, S. (2015). The effects of land use types, management practices and slope classes on selected soil physico-chemical properties in Zikre watershed, North-Western Ethiopia. Environ. Syst. Res. 4 (1), 3. doi:10.1186/s40068-015-0027-0
Suescun, D., Villegas, J., Leon, J. D., Florez, C. P., Garcia-Leoz, V., and Correa-Londono, G. A. (2017). Vegetation cover and rainfall seasonality impact nutrient loss via runoff and erosion in the Colombian Andes. Reg. Environ. Change 17 (3), 827–839. doi:10.1007/s10113-016-1071-7
Tian, C., Yu, Y. J., Wu, L. L., Zhang, L., Huang, J., Zhu, L. F., et al. (2021). Effects of various irrigation and fertilization schedules on the transformation and availability of phosphorus in paddy fields. Trans. Chin. Soc. Agric. Eng. 37 (24), 112–122. doi:10.11975/j.issn.1002-6819.2021.24.013
Tu, C. L., He, T. B., Lu, X. H., Luo, Y., and Smith, P. (2018). Extent to which pH and topographic factors control soil organic carbon level in dry farming cropland soils of the mountainous region of Southwest China. Catena 163, 204–209. doi:10.1016/j.catena.2017.12.028
Vrebos, D., Beauchard, O., and Meire, P. (2017). The impact of land use and spatial mediated processes on the water quality in a river system. Sci. Total Environ. 601-602, 365–373. doi:10.1016/j.scitotenv.2017.05.217
Wan, W., Han, Y. W., Wu, H. Q., Liu, F., and Liu, Z. (2021). Application of the source-sink landscape method in the evaluation of agricultural non-point source pollution: first estimation of an orchard dominated area in China. Agric. Water Manag. 252, 106910. doi:10.1016/j.agwat.2021.106910
Wang, B., Zheng, F. L., Romkens, M. J. M., and Darboux, F. (2013). Soil erodibility for water erosion: a perspective and Chinese experiences. Geomorphology 187, 1–10. doi:10.1016/j.geomorph.2013.01.018
Wang, J. L., Chen, C. L., Ni, J. P., Xie, D. T., Guo, X., Luo, Z. J., et al. (2019). Assessing effects of “source-sink” landscape on non-point source pollution based on cell units of a small agricultural catchment. J. Mt. Sci. 16 (9), 2048–2062. doi:10.1007/s11629-018-5268-8
Xu, G. Z., Shao, Z. J., Wang, T., Huang, M. Y., and Li, M. M. (2022). Patterns of nitrogen and phosphorus losses in two catchments with contrasting underlying surfaces. China Environ. Sci. 42 (7), 3334–3342. doi:10.19674/j.cnki.issn1000-6923.2022.0134
Zaher, H., Sabir, M., Benjelloun, H., and Paul-Igor, H. (2020). Effect of forest land use change on carbohydrates, physical soil quality and carbon stocks in Moroccan cedar area. J. Environ. Manag. 254, 109544. doi:10.1016/j.jenvman.2019.109544
Zhang, L., Loáiciga, H. A., Xu, M., Du, C., and Du, Y. (2015). Kinetics and mechanisms of phosphorus adsorption in soils from diverse ecological zones in the source area of a drinking-water reservoir. Int. J. Environ. Res. Public Health 12, 14312–14326. doi:10.3390/ijerph121114312
Zhang, T., Ni, J. P., and Xie, D. T. (2015). Severe situation of rural non-point source pollution and efficient utilization of agricultural wastes in the Three Gorges Reservoir Area. Environ. Sci. Pollut. Res. 22, 16453–16462. doi:10.1007/s11356-015-5429-z
Zhang, T., Yang, Y., Ni, J., and Xie, D. (2020). Construction of an integrated technology system for control agricultural non-point source pollution in the three gorges reservoir areas. Agric. Ecosyst. Environ. 295, 106919. doi:10.1016/j.agee.2020.106919
Zhang, Y., Fan, F. L., Zhou, C., Ni, J. P., and Xie, D. T. (2016). Effects of crop/mulberry intercropping on surface nitrogen and phosphorus losses in three gorges reservoir area. Acta Pedol. Sin. 53 (1), 189–201. doi:10.11766/trxb201507160248
Zhou, L. G., Wang, X. D., Zhang, X. M., Zhao, Y., Zhu, P. P., Zhao, X., et al. (2020). Spatiotemporal variations in nitrogen and phosphorus in a large man-made lake and their relationships with human activities. Water 12 (4), 1106. doi:10.3390/w12041106
Keywords: three Gorges reservoir area, land use modes, soil, water, nitrogen and phosphorus contents
Citation: Chen C, Deng H, Xin G and Zhou Y (2024) Characteristics of nitrogen and phosphorus contents in soil and water in an agricultural catchment of the three Gorges reservoir area. Front. Environ. Sci. 11:1327260. doi: 10.3389/fenvs.2023.1327260
Received: 24 October 2023; Accepted: 22 December 2023;
Published: 08 January 2024.
Edited by:
Zhihao Xu, Guangdong University of Technology, ChinaReviewed by:
Rong Huang, Sichuan Agricultural University, ChinaWuxia Bi, China Institute of Water Resources and Hydropower Research, China
Copyright © 2024 Chen, Deng, Xin and Zhou. This is an open-access article distributed under the terms of the Creative Commons Attribution License (CC BY). The use, distribution or reproduction in other forums is permitted, provided the original author(s) and the copyright owner(s) are credited and that the original publication in this journal is cited, in accordance with accepted academic practice. No use, distribution or reproduction is permitted which does not comply with these terms.
*Correspondence: Youwen Zhou, enl3QGNxeXUuZWR1LmNu