 Jie Huang
 Xinyu Duan
- Business School, Research Institute of the Economic and Social Development in the Dabie Mountains, Xinyang Normal University, Xinyang, Henan, China
The fundamental means of addressing the challenges concerning China’s agricultural resources and environment is to achieve green and high-quality development within the agricultural sector. In this study, we measured the level of green high-quality agricultural development (GHQAD) in China from 2003 to 2020, and used Theil index, Moran’s I and Geographic detector to reveal the evolution trend and driving factors of GHQAD in China. The results show that the development level of GHQAD in China is constantly improving while the spatial difference is decreasing, and the primary contributor to this overall variation is the intra-regional variation. The spatial distribution of GHQAD in China was positively correlated, with high concentration in eastern and central regions, and low concentration in western regions. Notably, topographic relief degree and urbanization level are the key driving factors contributing to the spatial differences in GHQAD across China. The insights gained from this study will be particularly valuable for the government decision-making processes, thereby elevating GHQAD development in China and ultimately achieving coordinated development within the agricultural sector.
1 Introduction
The 27th UN Climate Change Conference emphasized that efforts should be made to limit the global temperature rise to 1.5°C and avoid further deterioration of the global climate environment. Climate change and environmental pollution are adversely affecting all aspects of human society (Fisher et al., 2021; Li and Zhao, 2022; Liao et al., 2023; Wei et al., 2023). Agriculture is the basis of the national economy and one of the sectors most vulnerable to climate change (Elahi et al., 2021; Li et al., 2021; Huang et al., 2023). In addition to carbon dioxide, agricultural processes emit large quantities of methane and nitrous oxide, which are 20 and 310 times more capable of contributing to global warming than carbon dioxide (Chen et al., 2020; Du et al., 2022; Huang et al., 2022). Agriculture is under tremendous pressure to mitigate climate change and feed the global population (Agovino et al., 2019; Araújo et al., 2021; Bibi and Rahman, 2023). As a populous and agricultural country, China’s level of green and high-quality development of agriculture (GHQAD) is critical to China’s food security and agricultural carbon emissions, which deserve more attention.
From reform and opening up to the present, China has garnered global recognition for its remarkable achievements in agricultural development (Huang and Yang, 2017; Qi, 2022). Notably, the total value of agricultural output has exhibited an average annual growth rate of approximately 5.3 percent (Huang, 2018). Despite possessing only 10 percent of the world’s land, China successfully sustains the nutritional needs of 22 percent of the global population (Chen et al., 2021). By the year 2022, China’s aggregate grain production has reached an impressive 1,373.1 billion kilograms, accompanied by a per capita grain output of 483 kg, surpassing the internationally acknowledged threshold for food safety by 83 kg. Nonetheless, China’s agricultural development is currently primarily characterized by an extensive management model. This approach has led to a multitude of environmental and ecological issues throughout the development process, as evidenced by previous studies (Hansen et al., 2018; Li et al., 2018; Ren et al., 2021). The bulletin of the Second National Pollution Source Census shows that in 2017, China’s agricultural chemical oxygen demand emissions (COD) were 10,671,300 tones, total nitrogen (TN) 1,414,900 tones, and total phosphorus (TP) 212,000 tones, and the respective contributions of their emissions to the total emissions were 49.77%, 46.52%, and 67.21%. The large amount of pollution emissions makes the contradiction between ecological sustainability and agricultural development day by day (Liu et al., 2021; Shen et al., 2023; Liu et al., 2020). Hence, it is now urgent for China to seek effective ways to accomplish green high-quality agriculture development and to minimize environmental damage while maintaining sustained growth in agricultural output to ensure sustainable agricultural development.
Since the 21st century, the Chinese government has launched a series of policies in the agricultural development sector aimed at promoting green practices. These measures have contributed to the ongoing development and enhancement of a comprehensive green, ecology-oriented agricultural policy support system (Huang et al., 2022). Nevertheless, regional disparities persist in the realm of the development of green agriculture across China, primarily due to variations in agricultural resource endowment, development infrastructure, and agricultural production technologies (Chen et al., 2009). Previous research has underlined the noticeable regional disparities in the development of green agriculture (Shen et al., 2018; Qi et al., 2020; Chen et al., 2021). Furthermore, it is important to acknowledge that the driving factors influencing the development of green agriculture likewise exhibit marked heterogeneity (Huang and Chen, 2023; Liu et al., 2023). In view of the regional differences mentioned above, a deeper understanding of the spatial differences and drivers of GHQAD in China is needed when studying the current status of GHQAD in China. This will promote the coordinated development of China’s agricultural sector and further enhance the level of GHQAD in China.
Current literature on GHQAD barely focuses on different key aspects. First, researchers have emphasized the importance of the GHQAD index. Many scholars have developed multidimensional evaluation systems based on the specific characteristics of the agricultural industry. Wei et al. (2018) designed an evaluation index system, encompassing 14 indicators distributed across resource conservation, environmental friendliness, eco-protection, quality, and efficiency. Their work aimed to assess GHQAD in China, aligning with the goals of ecological protection and agricultural modernization. Likewise, Wang et al. (2022) employed the entropy method to evaluate GHQAD in Jiangsu Province, focusing on economic, social, environmental, and resource aspects. Additionally, some scholars have integrated pollution generated during agricultural production into the analysis framework, incorporating endogenous growth theory. Using green total factor productivity as the evaluation index of agricultural green development quality (Rusiawan et al., 2015; Han et al., 2018; Baráth et al., 2020; Xu et al., 2020; Chen et al., 2021; Chen et al., 2022; Zhao and Tan, 2022). Other scholars have taken a sustainable development perspective, arguing that GHQAD is about promoting sustainable development in the agricultural sector (Ionescu et al., 2022; Thakur et al., 2022; Sridhar et al., 2023).
The second focus of research centers on examining regional disparities in GHQAD. Chen et al. (2023) highlighted significant regional distinctions in green total factor productivity rankings in China’s four major regions. They found that these rankings, from high to low, are the east, central, northeast, and west. Xiao et al. (2022) found that green total factor productivity in the agricultural sector showed a decreasing trend from east to west. Zhang et al. (2023) found that GHQAD moved from eastern and northeastern provinces to central and western provinces, showing an obvious trend of high concentration characteristics.
Thirdly, research into the driving factors of GHQAD has been a prominent area of study. Scholars have suggested that factors like the digital transformation of agriculture (Shen et al., 2022), environmental regulations (Kamp et al., 2016; Fan et al., 2022; Liu et al., 2022; Du et al., 2023; Liu et al., 2023), and technological innovations in agricultural production significantly enhance GHQAD (He et al., 2021; Liu et al., 2021). Other research has underscored the impact of natural elements, such as climate change and green development (Arora, 2019; Ortiz-Bobea et al., 2021; Song et al., 2022). Additionally, researchers have delved into various influential factors like international trade (Adom et al., 2018; Edeh et al., 2021; Li et al., 2021), crop insurance (Ma and Lai, 2021), human capital (Wang et al., 2021; Li et al., 2022), and digital financial inclusion (Xiao et al., 2023) and pesticide use (Anani and Adetunji, 2021; Ganguly et al., 2021; Singh et al., 2021).
Despite the theoretical groundwork laid by existing literature, there remain certain deficiencies that this study aims to address. First, the existing indicator system mostly evaluates green agriculture development from an environmental perspective and an economic perspective, and is unable to comprehensively measure the level of green agriculture development. Therefore, this study constructs an evaluation index system for GHQAD based on the new development concept, Scientific evaluation of China’s GHQAD in five dimensions. Second, the existing literature has not explored the spatial differences in green agriculture development, and relies more on traditional regression models when studying the drivers of GHQAD, ignoring the influence of spatial differences. Based on this, this study explores the spatial differences and spatial correlations of GHQAD in China using Theil and Moran’s I, and utilizes Geographic detector (GD) to reveal the sources of spatial differences in GHQAD in China. Targeted policy recommendations are proposed while filling the existing research gaps so as to enhance China’s GHQAD.
The following is the structure of the remaining studies. Section 2 introduces the research methodology, data sources and indicator system. Section 3 describes the empirical results. Section 4 presents the discussion. Section 5 describes the main conclusions and policy implications.
2 Methodology
As shown in Figure 1, this paper measures the level of GHQAD by entropy method. The spatial differences are measured by the Tel index. Spatial correlation is measured through Moran’s index. Driving factors are measured through Geographic detector.

FIGURE 1. Methods of this study.
2.1 Methodology
2.1.1 Entropy method
The entropy method can determine the indicator weights according to the dispersion of each indicator’s values, and as an indicator’s dispersion increases, it is weighted more heavily in the comprehensive evaluation (Zhou et al., 2017; Wang et al., 2022). In contrast to the subjective assignment method, the entropy method offers a means to circumvent the influence of human factors during the determination of weight coefficients (Chen et al., 2021). Following is the specific calculation process. Firstly, the original data are dimensionless using the extreme value method, and the calculation process is shown in Eqs 1, 2, respectively. Secondly, the weight of the indicator
Where
2.1.2 Theil index
The Theil index, pioneered by Theil and based on the concept of entropy, has evolved into a vital method for investigating regional disparities (Bourguignon, 1979; Shorocks, 1980). This index facilitates the breakdown of overall differences into two crucial components: intra-group differences and inter-group differences. By doing so, it uncovers the respective trends and contributions of these components to the overall differences, as illustrated in Eq. 8 below.
2.1.3 Exploratory spatial data analysis
The Moran’s I is a pivotal metric for assessing spatial correlation and is a primary tool in exploratory spatial data analysis (Legendre, 1973). This index encompasses both the global Moran’s I and the local Moran’s I. The global Moran’s I, which are depicted in Eqs 9, 10.
As can be seen from the two equations,
2.1.4 Geographic detector
GD has the capacity to ascertain not only the magnitude of each factor’s influence but also the interactions among these factors (Feng et al., 2020). Furthermore, unlike conventional statistical techniques, this method is impervious to multicollinearity among independent variables and does not necessitate linear assumptions (Ding et al., 2019). Factor detection was employed to gauge the degree to which the independent variable clarifies the spatial variability in the dependent variable, as illustrated in Eq. 11 below.
Where
The utilization of interaction detection aims to evaluate the impact of the interaction between any two influences strengthens or weakens the extent to which they explain spatial variation in the GHQAD.
2.2 Data description
GHQAD is led by green development, with innovation as the main means and balanced and open development as the main purpose. It is characterized not only by large-scale production and industrial integration, but also by the need to achieve significant changes in the quality of agricultural development (Jin et al., 2023). Refer to previous studies (Wei et al., 2018; Chena et al., 2022; Cui et al., 2022; Wang et al., 2022), a GHQAD system was established in this paper (Table 1), and the study area is divided into three regions: East, Centre and West1 (Figure 2). The data used are from China Statistical Yearbook, China Rural Statistical Yearbook, China Agricultural Yearbook, China Population and Employment Statistical Yearbook and National Bureau of Statistics (NBS).
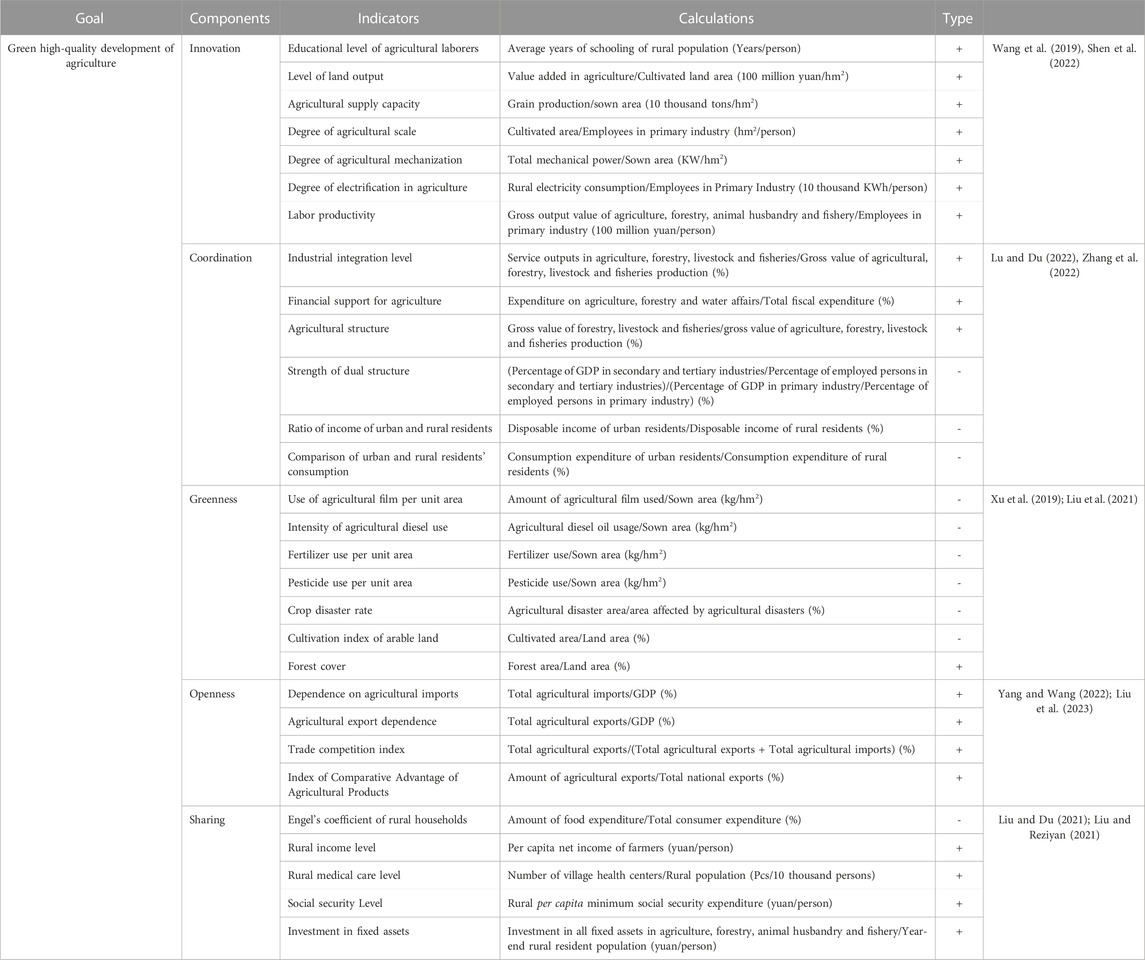
TABLE 1. Index system for GHQAD.
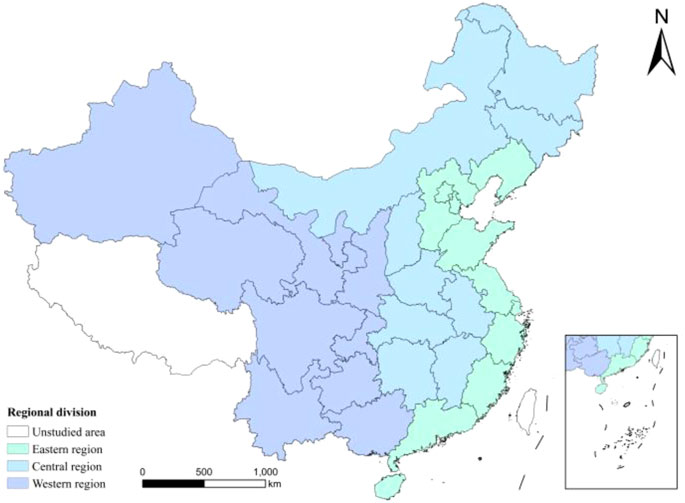
FIGURE 2. Regional division.
3 Results
3.1 Characteristics of spatial and temporal distribution
3.1.1 Analysis of time evolution
Table 2 presents the average GHQAD values at both the national and regional levels from 2003 to 2020. Nationally, a noticeable upward trend is observed in GHQAD. The elimination of agricultural taxes in 2006 further reduced the cost of agricultural production in China. This led to increased agricultural business efficiency, and enhanced agricultural production efficiency, all contributing to the betterment of GHQAD. Regionally, GHQAD has improved in all three major regions, although the degrees of improvement vary. Specifically, GHQAD in the eastern region increased from 0.365 in 2003 to 0.371 in 2020. The central and western regions have risen to 0.340 and 0.311, respectively. Although there is an obvious gap with the eastern region, the central and western regions have developed at a faster pace, indicating that the GHQAD in the central and western regions has a greater potential for development.
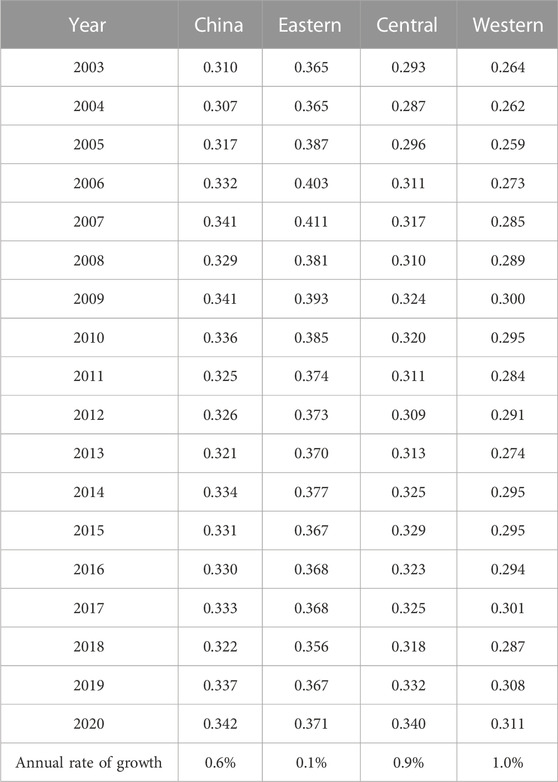
TABLE 2. Results of the GHQAD.
3.1.2 Analysis of spatial evolution
For a more comprehensive understanding of the spatial distribution pattern of GHQAD in China from 2003 to 2020, this study employed the ArcGIS platform to visualize the spatial distribution of GHQAD at five key time points: 2003, 2007, 2011, 2015, and 2020, as depicted in Figure 3. Overall, the GHQAD in China displays a progressive decline from east to west and the development gap between the three regions is gradually narrowing. In 2003, higher levels of GHQAD were primarily concentrated in eastern regions. This concentration can be attributed to factors such as geographical location, economic development, and supportive policies for the agricultural industry. In 2007, GHQAD increased from medium to high levels in Shandong, Inner Mongolia, Fujian, and Heilongjiang, and from low to medium-high levels in most provinces in the central region. Compared with 2007, GHQAD in Jilin and Liaoning provinces rose to high levels in 2011, with no significant change in GHQAD levels in the central and western provinces. Subsequently, the level of GHQAD in the central and western regions further increased during the 2015–2020 period. Thus, China’s GHQAD levels in general show a clear trend of improvement.
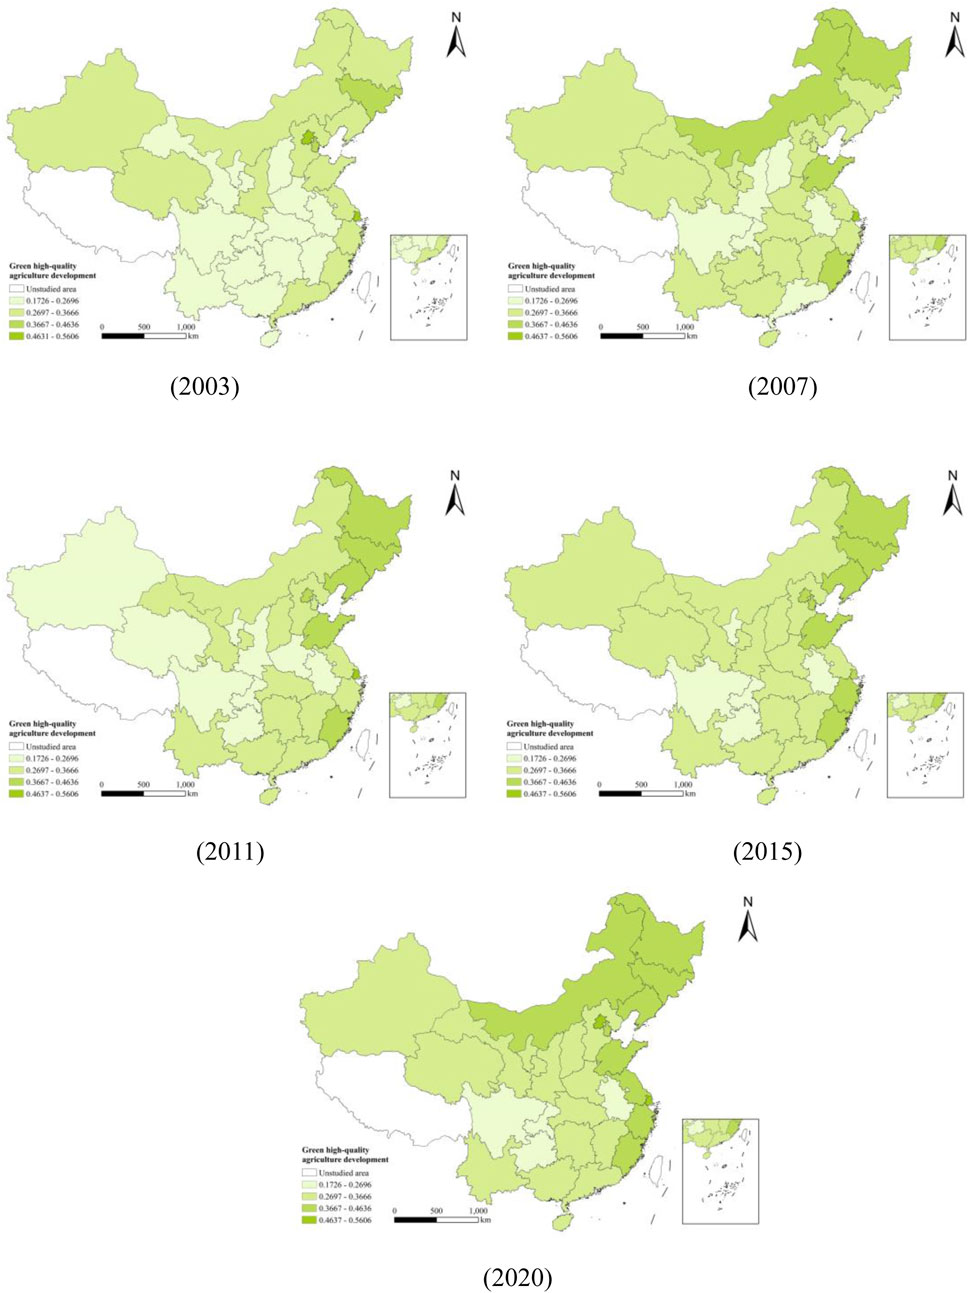
FIGURE 3. Spatial pattern of the GHQAD.
3.2 Characteristics of spatial differences
Figure 4 presents an overview of the spatial differences and their respective contribution rates to GHQAD in China. It is observed that the overall differences in the GHQAD show a fluctuating downward trend. Specifically, according to Figure 4A it first rises from 0.028 in 2003 to 0.031 in 2005, and then declines from 0.027 in 2006 to 0.011 in 2020. The reason is that with the deepening of the Poverty Alleviation Strategy, the conditions of agricultural production in the backward areas have been greatly improved, and the technological innovation capacity of agricultural production has been significantly enhanced, which makes the GHQAD in lagging areas rapidly rising. This has effectively narrowed the spatial differences in the GHQAD in China. As shown in Figure 4B, the trends in the inter- and intra-regional differences are generally consistent with those of the overall differences, decreasing to 0.003 and 0.008, respectively. Except for 2006, Intra-regional differences have always contributed more to overall differences than inter-regional differences. The key to resolving the spatial imbalance in the GHQAD in China, therefore, lies in narrowing the intra-regional disparities among the three major regions.
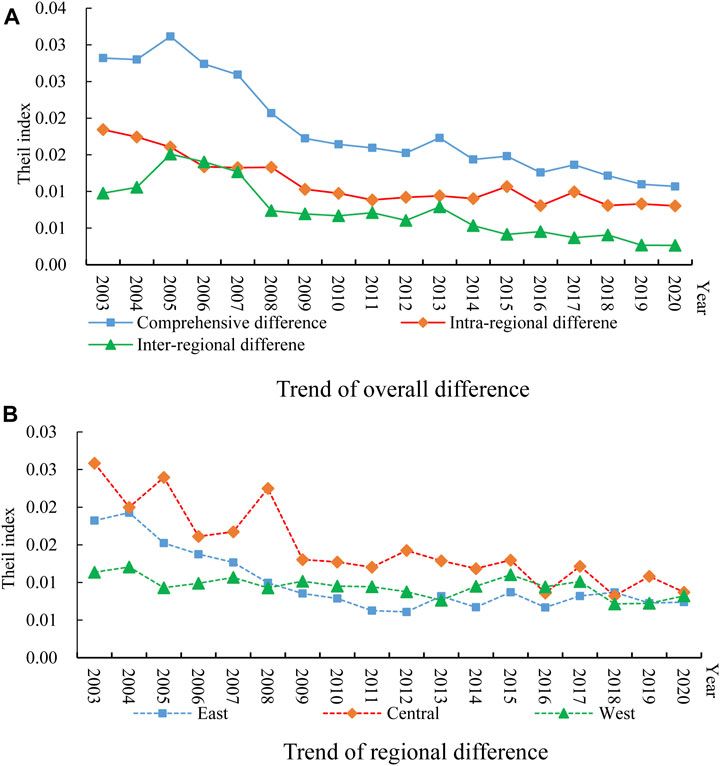
FIGURE 4. The spatial differences in the GHQAD.
3.3 Spatial correlation analysis
3.3.1 Global Moran’s I
Table 3 presents the global Moran’s I for GHQAD in China spanning the years 2003–2020. While there’s a fluctuating and decreasing pattern in the global Moran’s I of GHQAD, it is noteworthy that the mean value remains quite high at 0.388. This indicates the persistence of a substantial spatial agglomeration effect within GHQAD across China.
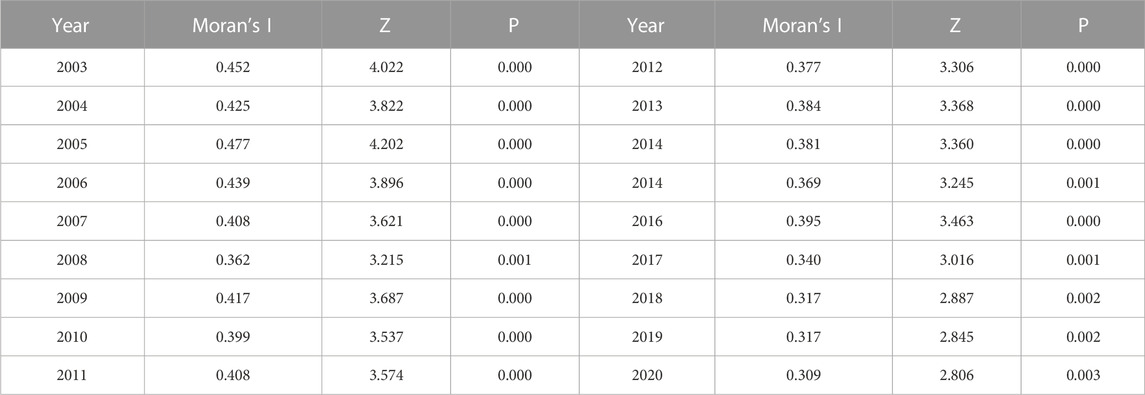
TABLE 3. The global Moran’s I of the GHQAD.
3.3.2 Local Moran’s I
In order to further present the relationship between the GHQAD in each province and its neighbor, this study adopted Moran’s I. Results are shown in Figure 5. Overall, most provinces are H-H agglomeration or L-L agglomeration, with significant spatial positive autocorrelation characteristics, in line with previous global Moran’s I results. Specifically, H-H agglomeration is mainly distributed in the eastern regions. The eastern region has a higher level of science and technology, which is conducive to improving the GHQAD level. At the meantime, these regions can also drive the GHQAD in the neighboring regions through the spatial spillover effect. The L-L agglomerations is mainly located in the central and western regions. The central and western inland regions, which are significantly behind the eastern regions in terms of economic development and sexual capacity, have a relatively low GHQAD. L-H agglomerations are mainly located in provinces such as Shanxi, Anhui, and Ningxia. Compared with the neighboring provinces, they have a lower level of GHQAD. For the purpose of improving the GHQAD, it is essential to actively use the spatial spillover effect of neighboring provinces so as to enter the H-H agglomeration area. The distribution of H-L agglomerations is primarily concentrated in the provinces of Shandong, Guangdong, Fujian, and other regions. Compared with neighboring provinces, they have a higher level of GHQAD, but they do not show strong spatial spillover effects and cannot drive GHQAD in neighboring provinces.
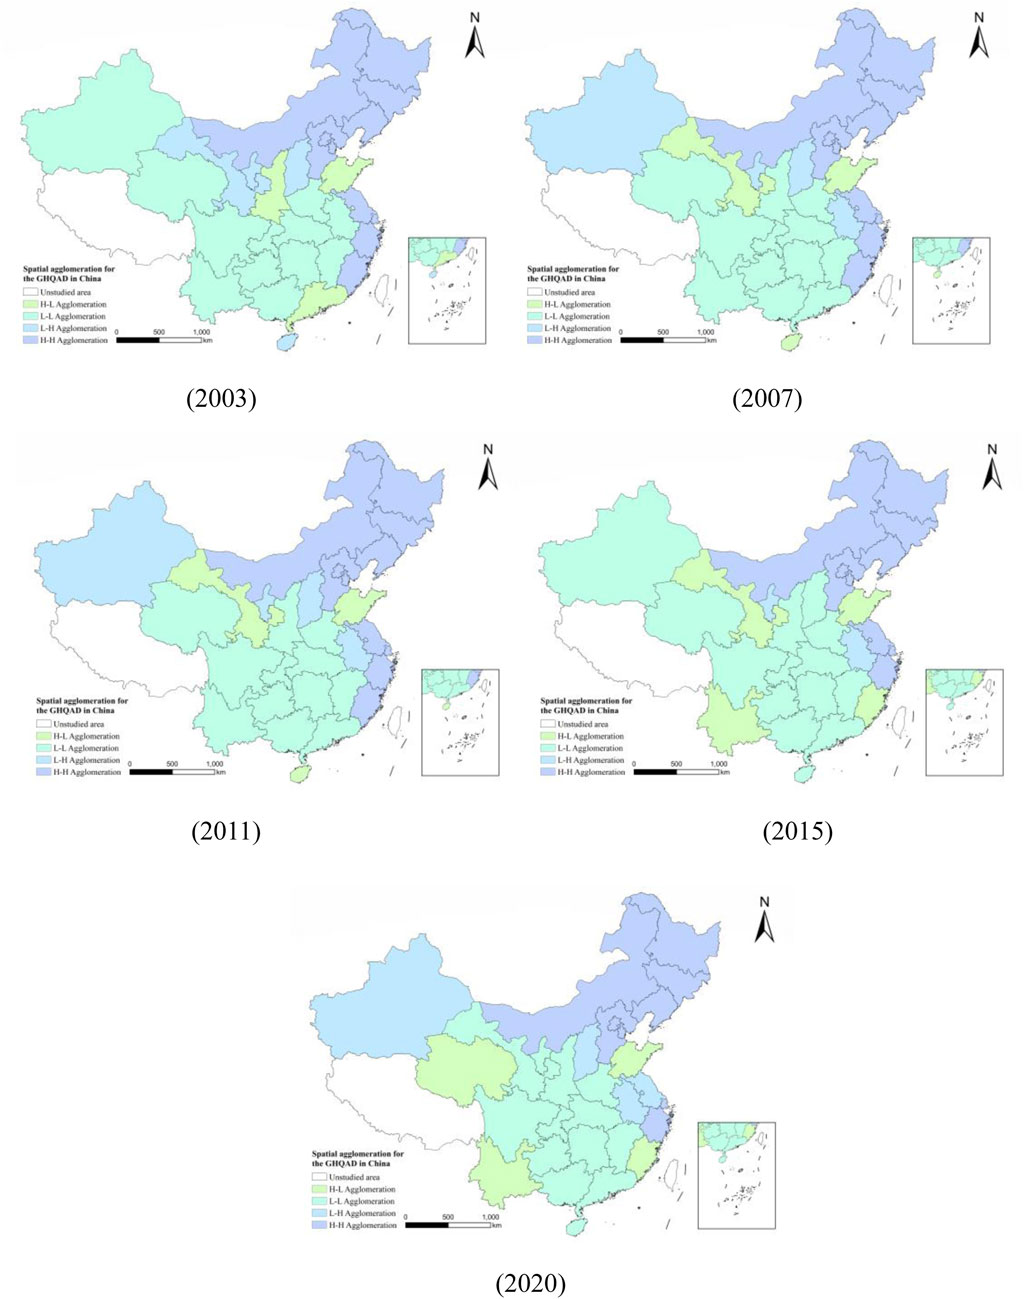
FIGURE 5. Spatial agglomeration for the GHQAD.
3.4 Driving factors
3.4.1 Variable selection
Based on the above findings, there is some spatial variability in the GHQAD in China. Therefore, this study used GD to detect the factors and interactions that drive the spatial variability characteristics of the GHQAD in China. Referring to existing research (Liu et al., 2021; Wang et al., 2021), this study selected nine indicators as explanatory variables from two dimensions: natural conditions and socio-economic conditions. Among them, the explanatory variables under the dimension of natural conditions include three indicators, namely, average annual precipitation (
3.4.2 Single factor detection
Considering that the intensity of the driving effect of each factor may change over time, this study took 2003, 2007, 2011, 2015 and 2020 as the time points, and the results are shown in Table 4. Overall, the driving effect of
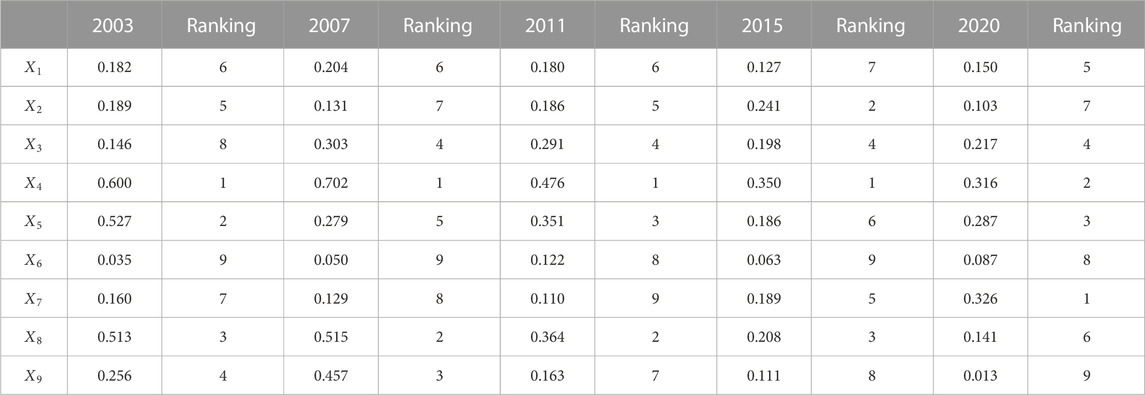
TABLE 4. The results of single-factor detection.
3.4.3 Interaction detection
On the basis of the single factors driving analysis, the interaction detection function was used to analyze the intensity of the effect of the interaction between driving factors on the spatial differences in the GHQAD in China and the type of interaction. Figure 6 shows the top ten interactions among factors. In 2003, the interaction between
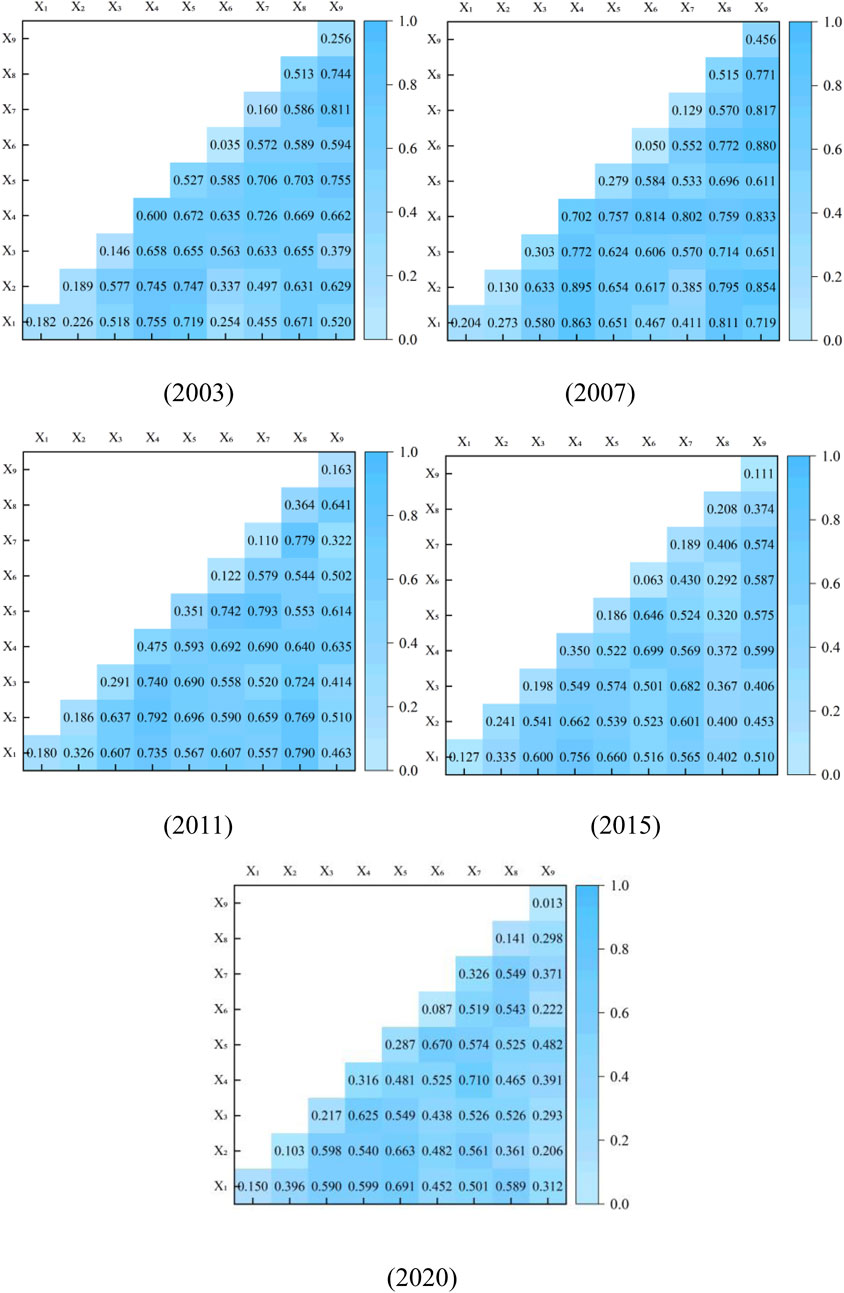
FIGURE 6. Intensity of interaction between factors.
4 Discussion
GHQAD is crucial for China to ensure food security and realize the goals of “peak carbon” and “carbon neutrality.” Therefore, this paper takes 30 provinces in China as the research object, establishes the evaluation index system of GHQAD, and studies the spatial and temporal evolution trend of GHQAD. And its driving factors. By comparing and discussing the results of this paper with those of previous studies, it can help each region in China formulate strategies in line with its actual situation, thus promoting the coordinated development of GHQAD. At the same time, it can also serve as a reference for other countries or regions to enhance their own GHQAD level. The differences between the findings of this paper and those of previous studies are mainly focused on the driving factors.
The study found that the overall level of GHQAD in China has been increasing, and spatial variability has been decreasing. Among them, the eastern region has the highest level of GHQAD, followed by the central region, and the western region has the lowest. Intra-regional variation was the main cause of the overall variation, and there was a significant positive spatial correlation between regions. This is consistent with the findings of Xiao et al. (2022) and Zhang et al. (2023).
Among the drivers of GHQAD, this paper finds that topographic relief and urbanization are critical to the spatial variation of GHQAD in China and that the interactions between natural and socio-economic factors such as average annual precipitation, average annual temperature, urbanization, industrial structure sophistication, and investment in environmental pollution control have a great impact on the spatial variation of GHQAD. This is similar to the findings of Arora (2019) and Ortiz-Bobea et al. (2021). However, the study by Liu et al. (2021) identified innovation in agricultural production technology as a significant reason for enhancing the level of GHQAD, which is different from the main drivers identified in this paper. The reason for this is that Liu et al. (2021) measure the level of China’s GHQAD through the green total factor productivity in agriculture, which focuses more on the inputs and outputs of agriculture in the selection of evaluation indexes, which is not complete enough and fails to fully consider the connotation of GHQAD.
5 Conclusion and policy implications
5.1 Conclusion
The key findings of this study are summarized as follows. First, GHQAD in China and each regions exhibited an overall upward trend, with the eastern region consistently leading. This progress follows an east-to-west pattern, where high-level GHQAD areas are spatially concentrated, showcasing distinctive “point-slice” development characteristics. Second, the spatial differences in GHQAD, as indicated by the Theil Index, have been decreasing, with intra-regional disparities being the primary source of overall differences. Third, The Moran’s I findings reveal a noticeable positive spatial correlation within GHQAD in China. Many regions show a tendency toward H-H agglomeration and L-L agglomeration. H-H agglomeration is chiefly observed in the eastern region and some grain-producing provinces, while L-L agglomeration is concentrated in the central and western regions. Finally, factor detection results indicate that topographic relief and urbanization play pivotal roles in driving the spatial differences in GHQAD in China, with a more substantial impact. Interaction detection results emphasize that interactions between specific natural and socio-economic factors, such as average annual precipitation, average annual temperature, urbanization, advanced industrial structure, and investments in environmental pollution control, exert a strong influence on spatial differences in GHQAD. Notably, the interactions among these driving factors enhance the role of individual factors in driving these spatial disparities in GHQAD across China.
5.2 Policy implications
This study argues that in advancing GHQAD, whether for China or other countries, it is imperative to direct attention towards not solely enhancing “points”, but also achieving a harmonized advancement of “surfaces”, so as to realize the synergistic improvement of China’s GHQAD across regions. On the basis of the findings above, it is recommended that the following actions be taken.
First, we should pay attention to the problem of insufficient GHQAD in China and tap its development potential. Given that the overall development level of GHQAD is lagging behind, all regions should explore their own development strengths and vigorously promote GHQAD. The eastern region should make full use of favorable conditions such as economic strength, consumption capacity, and science and technology level to promote the continuous improvement of GHQAD. The central and western regions should fully consider the advantages of their own natural resources endowment, and national policies should be tilted to such regions to realize the balanced development of GHQAD.
Second, understanding the spatial differences and spatial relevance of the GHQAD in China holds paramount importance. Accordingly, the pursuit of GHQAD that is both environmentally sustainable and of superior quality should be undertaken, taking into account the specificities of each locality. The eastern region will provide technical and financial support to the central and western regions while utilizing its existing advantages to promote further improvement of its own GHQAD level. Provinces in the central and western regions should make the most of the spatial spillover effect of the GHQAD in the eastern region by combining the natural conditions and geographical advantages, in order to enhance their own green agricultural development capacity.
Third, attention should be paid to the key driving factors affecting spatial differences in the GHQAD in China. As provinces continue to promote their own urbanization, they should clearly recognize the synergistic enhancement of GHQAD through the interaction of various factors. Provinces should take full advantage of the interaction between factors which surpasses the influence exerted by their individual driving forces. The synergy between natural and socio-economic factors should be utilized to accelerate the GHQAD in China in a balanced manner.
5.3 Limitations
However, the evaluation indicators developed in this study still do not adequately capture the connotation of GHQAD, primarily due to constraints in data acquisition resources. Therefore, further improvement of the relevant indicators is needed. In addition, the significant variations in agricultural production technology, operational modes, and the basis of agriculture across different regions of China necessitate the adoption of distinct paths for GHQAD in each respective region. In the future, the research object can be specific to a particular region in order to obtain more realistic and instructive conclusions.
Data availability statement
The original contributions presented in the study are included in the article/Supplementary Material, further inquiries can be directed to the corresponding author.
Author contributions
JH: Project administration, Writing–original draft, Writing–review and editing. XD: Methodology, Software, Visualization, Writing–original draft.
Funding
The author(s) declare financial support was received for the research, authorship, and/or publication of this article. This research was funded by the National Natural Science Foundation of China (72203197, 72003071), National Social Science Foundation of China (21FJYB047), University Science and Technology Innovation Talent Support Plan in Henan Province (Humanities and Social Sciences) (2021-CX-054), Henan Provincial Soft Science Research Project (232400410051), and Nanhu Scholars Program for Young Scholars of XYNU.
Conflict of interest
The authors declare that the research was conducted in the absence of any commercial or financial relationships that could be construed as a potential conflict of interest.
Publisher’s note
All claims expressed in this article are solely those of the authors and do not necessarily represent those of their affiliated organizations, or those of the publisher, the editors and the reviewers. Any product that may be evaluated in this article, or claim that may be made by its manufacturer, is not guaranteed or endorsed by the publisher.
Footnotes
1East includes Beijing, Tianjin, Hebei, Liaoning, Shanghai, Jiangsu, Zhejiang, Fujian, Shandong, Guangdong, and Hainan. Centre includes Shanxi, Inner Mongolia, Jilin, Heilongjiang, Anhui, Jiangxi, Henan, Hubei, and Hunan. West includes Guangxi, Chongqing, Sichuan, Guizhou, Yunnan, Shaanxi, Gansu, Qinghai, Ningxia, and Xinjiang.
References
Adom, P. K., Djahini-Afawoubo, D. M., Mustapha, S. A., Fankem, S. G., and Rifkatu, N. (2018). Does FDI moderate the role of public R&D in accelerating agricultural production in Africa? Afr. J. Econ. Manag. Stud. 9 (3), 290–304. doi:10.1108/AJEMS-07-2017-0153
Agovino, M., Casaccia, M., Ciommi, M., Ferrara, M., and Marchesano, K. (2019). Agriculture, climate change and sustainability: the case of EU-28. Ecol. Indic. 105, 525–543. doi:10.1016/j.ecolind.2018.04.064
Anani, O. A., and Adetunji, C. O. (2021). Role of pesticide applications in sustainable agriculture. Appl. Soil Chem., 235–256. doi:10.1002/9781119711520.ch13
Araújo, S. O., Peres, R. S., Barata, J., Lidon, F., and Ramalho, J. C. (2021). Characterising the agriculture 4.0 landscape—emerging trends, challenges and opportunities. Agronomy 11 (4), 667. doi:10.3390/agronomy11040667
Arora, N. K. (2019). Impact of climate change on agriculture production and its sustainable solutions. Environ. Sustain. 2, 95–96. doi:10.1007/s42398-019-00078-w
Baráth, L., Fertő, I., and Bojnec, Š. (2020). The effect of investment, LFA and agri-environmental subsidies on the components of total factor productivity: the case of Slovenian farms. J. Agric. Econ. 71, 853–876. doi:10.1111/1477-9552.12374
Bibi, F., and Rahman, A. (2023). An overview of climate change impacts on agriculture and their mitigation strategies. Agriculture 13 (8), 1508. doi:10.3390/agriculture13081508
Bourguignon, F. (1979). Decomposable income inequality measures. Econometrica 47, 901–920. doi:10.2307/1914138
Chen, R., Zhang, R., Han, H., and Jiang, Z. (2020). Is farmers' agricultural production a carbon sink or source? - variable system boundary and household survey data. J. Clean. Prod. 266, 122108. doi:10.1016/j.jclepro.2020.122108
Chen, X. L., Song, Z. Q., and Deng, H. Y. (2023). Land market distortion and agricultural green total factor productivity: provincial-level evidence from China. Econ. Research-Ekonomska Istraživanja 2023, 1–18. doi:10.1080/1331677X.2022.2158482
Chen, Y., Su, X. Y., and Zhou, Q. (2021). Study on the spatiotemporal evolution and influencing factors of urban resilience in the yellow river basin. Int. J. Environ. Res. Public Health 18, 10231. doi:10.3390/ijerph181910231
Chen, Y. F., Miao, J. F., and Zhu, Z. T. (2021). Measuring green total factor productivity of China's agricultural sector: a three-stage SBM-DEA model with non-point source pollution and CO2 emissions. J. Clean. Prod. 318, 128543. doi:10.1016/j.jclepro.2021.128543
Chen, Y. L., Zhuang, P. F., and Peng, J. P. (2021). The impact on agriculture economy high-quality development of trade openness: from the perspective of agricultural green total factor productivity. Ecol. Econ. 37, 105–114.
Chen, Z., Huffman, W. E., and Rozelle, S. (2009). Farm technology and technical efficiency: evidence from four regions in China. China Econ. Rev. 20, 153–161. doi:10.1016/j.chieco.2009.03.002
Chen, Z., Li, X. J., and Xia, X. L. (2021). Measurement and spatial convergence analysis of China’s agricultural green development index. Environ. Sci. Pollut. Res. 28, 19694–19709. doi:10.1007/s11356-020-11953-z
Chen, Z., Sarkar, A., Rahman, A., Li, X. J., and Xia, X. L. (2022). Exploring the drivers of green agricultural development (GAD) in China: a spatial association network structure approaches. Land Use Policy 112, 105827. doi:10.1016/j.landusepol.2021.105827
Chena, C., Restuccia, D., and Santaeulàlia-Llopis, R. (2022). The effects of land markets on resource allocation and agricultural productivity. Rev. Econ. Dyn. 45, 41–54. doi:10.1016/j.red.2021.04.006
Cui, X. F., Cai, T., Deng, W., Zheng, R., Jiang, Y. H., and Bao, H. J. (2022). Indicators for evaluating high-quality agricultural development: empirical study from yangtze river economic belt, China. Soc. Indic. Res. 164, 1101–1127. doi:10.1007/s11205-022-02985-8
Ding, Y. T., Zhang, M., Qian, X. Y., Li, C. R., Chen, S., and Wang, W. W. (2019). Using the geographical detector technique to explore the impact of socioeconomic factors on PM2. 5 concentrations in China. J. Clean. Prod. 211, 1480–1490. doi:10.1016/j.jclepro.2018.11.159
Du, M., Feng, R., and Chen, Z. (2022). Blue sky defense in low-carbon pilot cities: a spatial spillover perspective of carbon emission efficiency. Sci. Total Environ. 846, 157509. doi:10.1016/j.scitotenv.2022.157509
Du, M., Wu, F., Ye, D., Zhao, Y., and Liao, L. (2023). Exploring the effects of energy quota trading policy on carbon emission efficiency: quasi-experimental evidence from China. Energy Econ. 2023, 106791. doi:10.1016/j.eneco.2023.106791
Edeh, C. E., Eze, C. G., and Ugwuanyi, S. O. (2021). Impact of foreign direct investment on the agricultural sector in Nigeria (1981-2017). Afr. Dev. Review-Revue Afr. De. Dev. 32, 551–564. doi:10.1111/1467-8268.12460
Elahi, E., Khalid, Z., Tauni, M. Z., Zhang, H., and Lirong, X. (2021a). Extreme weather events risk to crop-production and the adaptation of innovative management strategies to mitigate the risk: a retrospective survey of rural Punjab, Pakistan. Technovation 4, 102255. doi:10.1016/j.technovation.2021.102255
Fan, M., Yang, P., and Li, Q. (2022). Impact of environmental regulation on green total factor productivity: a new perspective of green technological innovation. Environ. Sci. Pollut. Res. 29, 53785–53800. doi:10.1007/s11356-022-19576-2
Feng, X. H., Xiu, C. L., Bai, L. M., Zhong, Y. X., and Wei, Y. (2020). Comprehensive evaluation of urban resilience based on the perspective of landscape pattern: a case study of Shenyang city. Cities 104, 102722. doi:10.1016/j.cities.2020.102722
Fisher, S., Bellinger, D. C., Cropper, M. L., Kumar, P., Binagwaho, A., Koudenoukpo, J. B., et al. (2021). Air pollution and development in Africa: impacts on health, the economy, and human capital. Lancet Planet. Health 5 (10), e681–e688. doi:10.1016/S2542-5196(21)00201-1
Ganguly, R. K., Mukherjee, A., Chakraborty, S. K., and Verma, J. P. (2021). Impact of agrochemical application in sustainable agriculture. New Future Dev. Microb. Biotechnol. Bioeng. 2021, 15–24. doi:10.1016/B978-0-444-64325-4.00002-X
Han, H. B., Zhong, Z. Q., Wen, C. C., and Sun, H. G. (2018). Agricultural environmental total factor productivity in China under technological heterogeneity: characteristics and determinants. Environ. Sci. Pollut. Res. 25, 32096–32111. doi:10.1007/s11356-018-3142-4
Hansen, M. H., Li, H. T., and Svarverud, R. (2018). Ecological civilization: interpreting the Chinese past, projecting the global future. Glob. Environ. Change 53, 195–203. doi:10.1016/j.gloenvcha.2018.09.014
He, W. C., Li, E. L., and Cui, Z. Z. (2021). Evaluation and influence factor of green efficiency of China’s agricultural innovation from the perspective of technical transformation. Chin. Geogr. Sci. 31, 313–328. doi:10.1007/s11769-021-1192-x
Huang, J., and Chen, J. (2023). Spatial spillover and impacting factors of green development: a study based on China’s provincial data. Plos one 18 (3), e0282865. doi:10.1371/journal.pone.0282865
Huang, J., Sun, Z., and Du, M. (2023). Spatiotemporal characteristics and determinants of agricultural carbon offset rate in China based on the geographic detector. Environ. Sci. Pollut. Res. 30, 58142–58155. doi:10.1007/s11356-023-26659-1
Huang, J., Sun, Z., and Zhong, P. (2022). The spatial disequilibrium and dynamic evolution of the net agriculture carbon effect in China. Sustainability 14 (21), 13975. doi:10.3390/su142113975
Huang, J. K. (2018). Forty years of China's agricultural development and reform and the way forward in the future. J. Agrotechnical Econ. 3, 4–15. doi:10.13246/j.cnki.jae.2018.03.001
Huang, J. K., and Yang, G. L. (2017). Understanding recent challenges and new food policy in China. Glob. Food Security-Agriculture Policy Econ. Environ. 12, 119–126. doi:10.1016/j.gfs.2016.10.002
Huang, X. Q., Feng, C., Qin, J. H., Wang, X., and Zhang, T. (2022). Measuring China's agricultural green total factor productivity and its drivers during 1998–2019. Sci. Total Environ. 829, 154477. doi:10.1016/j.scitotenv.2022.154477
Ionescu, R. V., Zlati, M. L., and Antohi, V. M. (2022). A new approach on making European agriculture more efficient under uncertainty conditions. Agronomy 12 (10), 2559. doi:10.3390/agronomy12102559
Jin, S., Zhang, Z., Hu, Y., et al. (2023). Historical logic, theoretical interpretation, and practical exploration of China’s agricultural green transformation. Issues Agric. Econ., 1–16. doi:10.13246/j.cnki.iae.20230614.001
Kamp, A., Morandi, F., and Østergård, H. (2016). Development of concepts for human labour accounting in emergy assessment and other environmental sustainability assessment methods. Ecol. Indic. 60, 884–892. doi:10.1016/j.ecolind.2015.08.011
Legendre, P. (1973). Spatial autocorrelation: trouble or new paradigm? Ecology 74, 1659–1673. doi:10.2307/1939924
Li, J., Zhang, Z. L., Jin, X. F., Chen, J. Q., Zhang, S. J., He, Z., et al. (2018). Exploring the socioeconomic and ecological consequences of cash crop cultivation for policy implications. Land Use Policy 76, 46–57. doi:10.1016/j.landusepol.2018.04.009
Li, J., Zheng, Q., and Gao, J. (2021). Spatiotemporal evolution of contribution rate of agricultural science and technology elements in henan province under the background of rural revitalization. J. Xinyang Normal Univ. Nat. Sci. Ed. 34 (04), 571–576. doi:10.3969/j.issn.1003-0972.2021.04.011
Li, M., Shao, B., and Li, Z. (2022). A study on the logical mechanism of rural revitalization strategy and the rural labor back-flow. J. Xinyang Normal Univ. (Philosophy Soc. Sci. Ed. 42 (03), 48–53. doi:10.3969/j.issn.1003-0964.2022.03.008
Li, Z. L., Jin, M. H., and Cheng, J. W. (2021). Economic growth of green agriculture and its influencing factors in China: based on emergy theory and spatial econometric model. Environ. Dev. Sustain. 23, 15494–15512. doi:10.1007/s10668-021-01307-1
Liao, L., Du, M., and Chen, Z. (2023). Environmental pollution and socioeconomic health inequality: evidence from China. Sustain. Cities Soc. 95, 104579. doi:10.1016/j.scs.2023.104579
Liu, D. D., Zhu, X. Y., and Wang, Y. F. (2021). China's agricultural green total factor productivity based on carbon emission: an analysis of evolution trend and influencing factors. J. Clean. Prod. 278, 123692. doi:10.1016/j.jclepro.2020.123692
Liu, T., and Du, S. (2021). The construction of high-quality development evaluation index system of agricultural based on new development concept. .Chinese J. Agric. Resour. Regional Plan. 42 (04), 1–9. doi:10.7621/cjarrp.1005-9121.20210401
Liu, Y., Shi, P., Zhang, S., et al. (2023). Study on the measurement, spatial evolution and influencing of high-quality agricultural development in China—analysis based on the PROMETHEE method. Resour. Dev. Mark. 39 (07), 855–864. doi:10.3969/j.issn.1005-8141.2023.07.011
Liu, Y., Tian, L., Sun, H., Zhang, X., and Kong, C. (2022). Option pricing of carbon asset and its application in digital decision-making of carbon asset. Appl. Energy 310, 118375. doi:10.1016/j.apenergy.2021.118375
Liu, Y., Xu, L., Sun, H., Chen, B., and Wang, L. (2023). Optimization of carbon performance evaluation and its application to strategy decision for investment of green technology innovation. J. Environ. Manag. 325, 116593. doi:10.1016/j.jenvman.2022.116593
Liu, Y. F., Sun, D. S., Wang, H. J., Wang, X. J., Yu, G. Q., and Zhao, X. J. (2020). An evaluation of China’s agricultural green production: 1978–2017. J. Clean. Prod. 243, 118483. doi:10.1016/j.jclepro.2019.118483
Liu, Y. P., Lu, C. P., and Chen, X. P. (2023). Dynamic analysis of agricultural green development efficiency in China: spatiotemporal evolution and influencing factors. J. Arid Land 15, 127–144. doi:10.1007/s40333-023-0007-6
Liu, Z., and Reziyan, W. (2021). A research of the regional disparities and distributional dynamic evolution of high-quality agricultural development in China. J. Quantitative Technol. Econ. 38 (06), 28–44. doi:10.13653/j.cnki.jqte.2021.06.002
Li, X., and Zhao, X. (2022). An empirical analysis on the impact of air pollution on green transportation consumption. J. Xinyang Normal Univ. (Nat. Sci. Ed.) 35 (04), 591–596. doi:10.3969/j.issn.1003-0972.2022.04.011
Lu, Z., and Du, Y. (2022). An empirical study on digital economy enabling the high-quality development of agriculture. China Bus. Mark. 36 (11), 3–14. doi:10.14089/j.cnki.cn11-3664/f.2022.11.001
Ma, G. Y., and Lai, Y. B. (2021). Study on the ecological environment effects of policy crop insurance. For. Econ. 43, 22–37. doi:10.13843/j.cnki.lyjj.20211027.002
Ortiz-Bobea, A., Ault, T. R., Carrillo, C. M., Chambers, R. G., and Lobell, D. B. (2021). Anthropogenic climate change has slowed global agricultural productivity growth. Nat. Clim. Change 11, 306–312. doi:10.1038/s41558-021-01000-1
Qi, X. (2022). An analysis of rural multi-values under the background of rural revitalization. J. Xinyang Normal Univ. (Philosophy Soc. Sci. Ed. 42 (06), 35–40. doi:10.3969/j.issn.1003-0964.2022.06.006
Qi, Y. B., Han, S., and Deng, X. (2020). China’s green agriculture development: production level measurement, regional spatial difference and convergence analysis. J. Agrotechnical Econ. 4, 51–65. doi:10.13246/j.cnki.jae.2020.04.004
Ren, Y. J., Peng, Y. L., Campos, B. C., and Li, H. J. (2021). The effect of contract farming on the environmentally sustainable production of rice in China. Sustain. Prod. Consum. 28, 1381–1395. doi:10.1016/j.spc.2021.08.011
Rusiawan, W., Tjiptoherijanto, P., Suganda, E., and Darmajanti, L. (2015). Assessment of green total factor productivity impact on sustainable Indonesia productivity growth. Procedia Environ. Sci. 28, 493–501. doi:10.1016/j.proenv.2015.07.059
Shen, Y., Fu, Y., and Song, M. (2023). Digital finance promotes sustainable total factor eco-efficiency: evidence from China. Appl. Econ., 1–15. doi:10.1080/00036846.2023.2211337
Shen, Z. Y., Baležentis, T., Chen, X. L., and Valdmanis, V. (2018). Green growth and structural change in Chinese agricultural sector during 1997–2014. China Econ. Rev. 51, 83–96. doi:10.1016/j.chieco.2018.04.014
Shen, Z. Y., Wang, S. K., Boussemart, J. P., and Hao, Y. (2022). Digital transition and green growth in Chinese agriculture. Technol. Forecast. Soc. Change 181, 121742. doi:10.1016/j.techfore.2022.121742
Shorrocks, A. F. (1980). The class of additively decomposable inequality measures. Econometrica 48, 613–625. doi:10.2307/1913126
Singh, H., Sharma, A., Bhardwaj, S. K., Arya, S. K., Bhardwaj, N., and Khatri, M. (2021). Recent advances in the applications of nano-agrochemicals for sustainable agricultural development. Environ. Sci. Process. Impacts 23 (2), 213–239. doi:10.1039/D0EM00404A
Song, Y. G., Zhang, B. C., Wang, J. H., and Kwek, K. (2022). The impact of climate change on China’s agricultural green total factor productivity. Technol. Forecast. Soc. Change 185, 122054. doi:10.1016/j.techfore.2022.122054
Sridhar, A., Balakrishnan, A., Jacob, M. M., Sillanpää, M., and Dayanandan, N. (2023). Global impact of COVID-19 on agriculture: role of sustainable agriculture and digital farming. Environ. Sci. Pollut. Res. 30 (15), 42509–42525. doi:10.1007/s11356-022-19358-w
Thakur, A. K., Singh, R., Gehlot, A., Kaviti, A. K., Aseer, R., Suraparaju, S. K., et al. (2022). Advancements in solar technologies for sustainable development of agricultural sector in India: a comprehensive review on challenges and opportunities. Environ. Sci. Pollut. Res. 29 (29), 43607–43634. doi:10.1007/s11356-022-20133-0
Wang, M., Xu, M., and Ma, S. J. (2021). The effect of the spatial heterogeneity of human capital structure on regional green total factor productivity. Struct. Change Econ. Dyn. 59, 427–441. doi:10.1016/j.strueco.2021.09.018
Wang, X. L., Wang, L., Zhang, X. R., and Fan, F. (2022). The spatiotemporal evolution of COVID-19 in China and its impact on urban economic resilience. China Econ. Rev. 74, 101806. doi:10.1016/j.chieco.2022.101806
Wang, Y., Xie, L., Zhang, Y., Wang, C., and Yu, K. (2019). Does FDI promote or inhibit the high-quality development of agriculture in China? An agricultural GTFP perspective. Sustainability 11 (17), 4620. doi:10.3390/su11174620
Wang, Y. Q., Yao, S. B., Hou, M. Y., Jia, L., Li, Y. Y., Deng, Y. J., et al. (2021). Spatial-temporal differentiation and its influencing factors of agricultural eco-efficiency in China based on geographic detector. J. Appl. Ecol. 32, 4039–4049. doi:10.13287/j.1001-9332.202111.026
Wang, Z. G., Huang, L. F., Yin, L. S., Wang, Z. X., and Zheng, D. D. (2022). Evaluation of sustainable and analysis of influencing factors for agriculture sector: evidence from Jiangsu Province, China. Front. Environ. Sci. 10, 836002. doi:10.3389/fenvs.2022.836002
Wei, Q., Zhang, B., and Jin, S. Q. (2018). A study on construction and regional comparison of agricultural green development index in China. Issues Agric. Econ. 11, 11–20. doi:10.13246/j.cnki.iae.2018.11.002
Wei, X., Jiang, Y., and Gan, T. (2023). Air pollution and entrepreneurship: evidence from China. Appl. Econ., 1–15. doi:10.1080/00036846.2023.2203454
Xiao, Q., Wang, Y., Liao, H. J., Han, G., and Liu, Y. J. (2023). The impact of digital inclusive finance on agricultural green total factor productivity: a study based on China’s provinces. Sustainability 15, 1192. doi:10.3390/su15021192
Xiao, S. X., He, Z. X., Zhang, W. K., and Qin, X. M. (2022). The agricultural green production following the technological progress: evidence from China. Int. J. Environ. Res. Public Health 19 (16), 9876. doi:10.3390/ijerph19169876
Xu, B., Chen, W. T., Zhang, G. J., Wang, J. H., Ping, W. Y., Luo, L. Q., et al. (2020). How to achieve green growth in China’s agricultural sector. J. Clean. Prod. 271, 122770. doi:10.1016/j.jclepro.2020.122770
Xu, X., Huang, X., Huang, J., Gao, X., and Chen, L. (2019). Spatial-temporal characteristics of agriculture green total factor productivity in China, 1998–2016: based on more sophisticated calculations of carbon emissions. Int. J. Environ. Res. public health 16 (20), 3932. doi:10.3390/ijerph16203932
Yang, N., and Wang, W. (2022). Measurement and construction of evaluation index system of agricultural high-quality development. Statistics Decis. 38 (19), 26–30. doi:10.13546/j.cnki.tjyjc.2022.19.005
Zhang, J., Zeng, Z., and Li, G. (2022). The measurement and spatial difference analysis of the high-quality development level of agricultural economy of China. World Agric. (10), 98–110. doi:10.13856/j.cn11-1097/s.2022.10.009
Zhang, Q., Qu, Y., and Zhan, L. (2023). Great transition and new pattern: agriculture and rural area green development and its coordinated relationship with economic growth in China. J. Environ. Manag. 344, 118563. doi:10.1016/j.jenvman.2023.118563
Zhao, N., and Tan, X. (2022). A study of spatial spillover effect of green credit on green total factor productivity. J. Xinyang Normal Univ. Soc. Sci. Ed. 42 (03), 40–47. doi:10.3969/j.issn.1003-0964.2022.03.007
Keywords: green high-quality agriculture development, spatial-temporal evolution, spatial differences, driving factors, geographic detector
Citation: Huang J, Duan X, Li Y and Guo H (2023) Spatial-temporal evolution and driving factors of green high-quality agriculture development in China. Front. Environ. Sci. 11:1320700. doi: 10.3389/fenvs.2023.1320700
Received: 12 October 2023; Accepted: 15 November 2023;
Published: 29 November 2023.
Edited by:
Yantuan Yu, Guangdong University of Foreign Studies, ChinaReviewed by:
Xufeng Cui, Zhongnan University of Economics and Law, ChinaYongchang Shen, Anhui Jianzhu University, China
Yue Liu, Jiangsu University, China
Copyright © 2023 Huang, Duan, Li and Guo. This is an open-access article distributed under the terms of the Creative Commons Attribution License (CC BY). The use, distribution or reproduction in other forums is permitted, provided the original author(s) and the copyright owner(s) are credited and that the original publication in this journal is cited, in accordance with accepted academic practice. No use, distribution or reproduction is permitted which does not comply with these terms.
*Correspondence: Jie Huang, amllLmh1YW5nQHh5bnUuZWR1LmNu