 You Wu
 Wenting Ren1
- 1School of Economics, Beijing Technology and Business University, Beijing, China
- 2ABC Wealth Management Co., Ltd., Beijing, China
With heightened concern over carbon neutrality and increased energy market fluctuations against the backdrop of increasing global uncertainty, it becomes imperative to thoroughly investigate the information transmission and risk contagion between carbon and energy markets. This paper empirically explores the return and volatility connectedness among carbon and energy markets (electricity, natural gas, crude oil, and coal) from April 2008 to September 2021 by employing the time-frequency domain connectedness approaches. This paper indicates: i) the return connectedness exceeds volatility connectedness, and extreme events can intensify the dynamic changes; ii) the return connectedness is predominantly concentrated at high-frequency, while the volatility connectedness is concentrated at medium- and low-frequency. Net volatility connectedness maintains a consistent direction across all markets in the time-frequency domain. In contrast, net return connectedness exhibits an opposing direction at high-frequency and medium- and low-frequency. iii) the natural gas and coal markets predominantly act as net transmitters in both return and volatility connectedness, while the electricity, crude oil, and carbon markets operate as net receivers. Moreover, during the COVID-19 pandemic, the carbon market emerged as an information receiver in time-frequency domains and acted as a risk transmitter, exporting risk, particularly to the electricity market. These conclusions help investors, high-carbon enterprises, and policymakers to comprehensively understand the carbon-energy relationships, thereby supporting sustainable energy development and low-carbon economic goals. Simultaneously, this paper provides insights for enhancing carbon markets in emerging markets like China.
1 Introduction
In recent years, the global warming issue has garnered increasing attention. The carbon market, a pivotal market mechanism for climate change mitigation, was established and underwent rapid development following the enactment of the Kyoto Protocol in 2005 (Wang and Guo, 2018; Gong et al., 2021). To aid European Union member states in meeting emission reduction obligations mandated by the Kyoto Protocol and to accumulate expertise in employing the cap-and-trade scheme for greenhouse gas reduction, the European Union instituted the European Union Emissions Trading System (EU ETS). The design of the EU ETS aims to motivate companies to decrease reliance on fossil fuel-based energy, boost investments in clean and low-carbon technologies, and embrace more significant use of renewable energy. This framework facilitates shifting from carbon-intensive energy sources to cleaner, low-carbon alternatives (Arabi et al., 2021; Gong et al., 2021; Zhang et al., 2022). Presently, the EU ETS stands as the world’s inaugural and largest carbon trading market (Ji et al., 2018; Wang and Guo, 2018). In tandem, the carbon market has witnessed swift growth and consistent expansion concerning scale, liquidity, trading volume, and complexity. Its connectedness with energy markets has progressively deepened (Tan and Wang, 2017).
Recent studies have revealed a connection between carbon and energy markets from two perspectives: supply-demand shocks and the financialization of commodity markets (Zhang and Sun, 2016; Tan and Wang, 2017). On the one hand, in terms of supply-demand shocks, energy markets can directly influence the carbon market through three channels. First, a total demand effect exists. The increase in carbon emissions is primarily attributed to the combustion of fossil fuels (Sun et al., 2023). Therefore, businesses increase energy consumption when energy prices decrease, stimulating demand for carbon allowances and driving up carbon prices. Second, there is a substitution effect. Shifts in energy prices can influence energy consumption patterns, and the fuel-switching behavior of power generation companies can consequently induce fluctuations in carbon prices. Third, there is a production suppression effect. Elevated energy prices typically lead to reduced production and energy consumption, leading to a decrease in carbon prices (Tan and Wang, 2017; Duan et al., 2021). On the other hand, owing to the advancement of commodity financialization, the carbon and energy markets exhibit specific financial attributes. The cross-market flow of speculative capital is anticipated to heighten further the connectedness between carbon and energy markets (Ortas and Álvarez, 2016; Wang and Guo, 2018). Moreover, the correlation between carbon price and energy prices is expected to undergo dynamic changes (Ji et al., 2018; Wang and Guo, 2018; Tan et al., 2020; Gong et al., 2021). This characteristic becomes particularly pronounced during extreme events, such as the Eurozone debt crisis and the global COVID-19 pandemic (Tan and Wang, 2017; Ding et al., 2022). In order to elucidate the dynamic relationship between carbon and energy markets more clearly, this paper seeks to analyze their connectedness from a more detailed and comprehensive perspective.
Existing literature suggests varied patterns of connectedness between return and volatility within carbon and energy markets. This connectedness plays a crucial role in evaluating market efficiency and can offer investors and policymakers nuanced economic and managerial insights at multiple levels (Attarzadeh and Balcilar, 2022; Gyamerah et al., 2022; Hoque et al., 2023). To be specific, return connectedness involves the price discovery process, primarily measuring the transmission of cross-market information (Lu et al., 2023). Volatility connectedness serves as an indicator of risk contagion, where shocks in one market may adversely affect the willingness of market participants to hold risks in any other market (Acharya and Pedersen, 2005; Tan et al., 2020). By comprehensively examining the return and volatility connectedness between carbon and energy markets, investors can better understand these markets' impact on portfolio diversification and investment opportunities. From a hedging perspective, return connectedness empowers market participants to optimize their investment choices by designing more effective hedging strategies. Meanwhile, from a risk management standpoint, volatility connectedness enables market participants to adjust their asset allocation choices (Toyoshima and Hamori, 2018; Umar et al., 2022).
Moreover, the combined analysis perspective of time-frequency domains is equally crucial for understanding the connectedness between carbon and energy markets. On the one hand, an integrated view across time and frequency domains can assist market participants in identifying the frequency origins of the connectedness between carbon and energy markets (Baruník and Křehlík, 2018; Wan et al., 2024). Indeed, at various time scales or frequency bands, both carbon and energy markets are influenced by distinct dominant factors (Yu et al., 2015; Ji et al., 2018). Market sentiment plays a significant role in the short-term, while in the medium- and long-term, fundamental factors such as supply and demand become the primary influencers (Dai et al., 2021). Sousa et al. (Sousa et al., 2014) and Ortas and Alvarez (Ortas and Álvarez, 2016) assert the importance of analyzing frequency connectedness between carbon and energy markets, emphasizing that energy markets display stickiness in the short-term and relative flexibility in the long-term (Ding et al., 2022). On the other hand, analyzing the connectedness in the frequency domain among markets allows tailoring recommendations for market participants with different preferences (Jiang and Chen, 2022a). Speculators, oriented toward short-term returns, may utilize these commodities to enhance the financial performance of their investment portfolios (Hoque et al., 2023). In contrast, institutional investors and policymakers operate with long-term objectives, such as achieving the goals of the European Union Emissions Trading Scheme (Ortas and Álvarez, 2016). Therefore, analyzing the time-frequency domain connectedness between carbon and energy markets not only allows speculators to refine their portfolios and uncover potential diversification opportunities but also aids policymakers in more accurately assessing the spillover scale of energy on the carbon price, ensuring the sustainable development of the carbon market.
The motivation of this paper can be summarized as follows. On the one hand, previous research on the connectedness between carbon and energy markets has primarily focused on the time domain perspective (Ji et al., 2018; Tan et al., 2020; Dai et al., 2021). However, there is limited investigation into the connectedness from the frequency domain perspective (Ding et al., 2022). On the other hand, although there exists literature that has delved into the connectedness between carbon and energy markets from the frequency domain. These studies have predominantly focused on either return connectedness (Jiang and Chen, 2022a; Ding et al., 2022) or volatility connectedness (Adekoya et al., 2021). Addressing these research gaps, this paper aims to comprehensively consider the return and volatility connectedness between carbon and energy markets from both time and frequency domains. The paper addresses the following inquiries: what are the commonalities and differences in return and volatility connectedness between carbon and energy markets? What are the time-varying characteristics among these commonalities and differences? In addition, the EU ETS has undergone three phases: the initial phase (2005–2007), the second phase (2008–2012), and the third phase (2013–2020). Currently, it is in the fourth development phase (2021–2030) (Hanif et al., 2021). Indeed, carbon price exhibits substantial fluctuations over time, influenced by different stages of the EU ETS (Fang et al., 2018). It is noteworthy that, since entering the fourth phase, global uncertainty events occur frequently, such as the COVID-19 pandemic and the Russia-Ukraine conflict. Both carbon and energy markets experience severe shocks (Zhang et al., 2021; Liu X. et al., 2023; Wu et al., 2023). Simultaneously, during the fourth phase, many countries, especially China, adopt carbon neutrality strategies and actively formulate low-carbon development policies (Sun et al., 2023). These policies, aimed at restricting high-carbon energy sources, may also contribute to fluctuations in both carbon and energy markets (Wei et al., 2022a; Tan et al., 2022). Unfortunately, existing literature has primarily focused on the connectedness between carbon and energy markets during the second and third phases (Adekoya et al., 2021; Dai et al., 2021), with a notable gap in exploring the fourth phase. Therefore, this study selects data from the second phase to the fourth phase to analyze the return and volatility connectedness under combined time-frequency domains. Additionally, despite many studies analyzing the impact of the COVID-19 pandemic on the energy markets (Wang and Su, 2020; Wang and Huang, 2021; Wang et al., 2022a), these studies primarily focus on investigating the changes in energy markets demand during the pandemic (Wang and Su, 2020; Wang and Zhang, 2021), subsequently affecting the carbon market (Jiang and Chen, 2022b). On the other hand, existing studies predominantly focus on analyzing the impact of the pandemic on individual markets or risk contagion between pairs of markets (Wang et al., 2022a; Wang et al., 2022b). However, there is a lack of comprehensive analysis regarding information transmission and risk contagion between carbon and multiple energy markets. Therefore, based on the existing literature, this paper comprehensively analyzes the time-frequency domains return and volatility connectedness between carbon and energy markets. This paper addresses the research gap in current literature and provides insights into patterns during crisis moments, enriching the understanding of the connectedness between carbon and energy markets.
To comprehensively investigate the return and volatility connectedness between carbon and energy markets in time-frequency domains, this paper uses a combination of the time-domain connectedness method proposed by Diebold and Yilmaz (Diebold and Yilmaz, 2014) and the frequency-domain connectedness method proposed by Baruník and Křehlík (Baruník and Křehlík, 2018)1. The integration of these methods is motivated by the following reasons. First, the DY model facilitates time-varying estimates of connectedness by employing a rolling window technique, representing a significant advancement in such research (Diebold and Yilmaz, 2014). The BK model, an extension of the DY model, integrates the frequency-domain method to evaluate connectedness across different frequency ranges. This approach captures the impact of shocks over various time horizons, including short-term, medium-term, or long-term (Baruník and Křehlík, 2018; Yang et al., 2021). The combined time-frequency domains analysis is well-suited for addressing the heterogeneity among market participants (Asadi et al., 2022; Wan et al., 2024). Second, compared to other frequency-domain analysis methods, like the wavelet methods, the BK model not only characterizes bivariate relationships but also captures the connectedness of the overall system (Pal and Mitra, 2020; Wan et al., 2024). Hence, the BK model can be viewed as a frequency-related network analysis. Third, the combined time-frequency domain analysis method has been widely applied across various fields, including stock markets (Dai and Zhu, 2022; Wan et al., 2024), currency markets (Ding et al., 2022), and commodity markets (Pal and Mitra, 2020; Wu et al., 2023). Therefore, this paper integrates the DY and BK models to analyze the static and dynamic connectedness in return and volatility between carbon and energy markets. The time domain is decomposed into short-term (1–5 days), medium-term (5–22 days), and long-term (more than 22 days), allowing an analysis of the connectedness characteristics across different time horizons.
A comprehensive investigation into the return and volatility connectedness between carbon and energy markets in time-frequency domains holds significant implications for investors, energy-consuming enterprises, and policymakers. For investors, this paper provides insights into information transmission and risk contagion between carbon and energy markets, enabling a more thorough understanding of the connectedness. The conclusions will empower investors to make informed choices in crafting optimal portfolios to mitigate risks and achieve excess returns (Crossland et al., 2013). The costs of high-energy-consuming enterprises are closely linked to carbon and energy prices (Gong et al., 2021; Liu Y. et al., 2023). Therefore, investigating the dynamic connectedness between carbon and energy markets across different phases of the EU ETS can contribute to refining enterprises' carbon asset management (Gong et al., 2021). Lastly, the outbreak of uncertainty events such as the COVID-19 pandemic and the Russia-Ukraine conflict profoundly impact macroeconomics and financial markets (Zhang et al., 2021; Liu X. et al., 2023). Against this backdrop, a thorough investigation into the information transmission and risk contagion between carbon and energy markets can assist policymakers in better understanding the influence of uncertainty on connectedness. This can improve the transparency of future policies and provide support for achieving carbon neutrality goals (Jiang and Chen, 2022a).
This paper contributes to three main aspects. First, this paper enriches relevant literature (Ji et al., 2018; Wang and Guo, 2018; Gong et al., 2021; Ding et al., 2022) based on an in-depth discussion of the connectedness between carbon and energy markets by introducing the data of phase fourth of carbon market and the time-frequency connectedness approaches. Meanwhile, this paper helps better understand the interactive relationships between carbon and energy markets and provides practical policy tools for improving the operation mechanisms of the carbon market. Moreover, this paper can help to support the accelerated realization of carbon peak and carbon neutrality goals (Wang and Su, 2020; Zhao et al., 2023). Second, this paper gets some thought-provoking conclusions based on distinguishing the return and volatility connectedness between carbon and energy markets. Specifically, the information transmission between carbon and energy markets is more potent than their risk contagion. Extreme events can intensify information transmission and risk contagion, but risk contagion changes more frequently. Information transmission is primarily concentrated at high-frequency, while risk contagion is mainly at medium- and low-frequency. These findings support the conclusions of Adekoya et al. (2021) and Ding et al. (2022). Moreover, the natural gas and coal markets primarily act as net transmitters in both return and volatility connectedness. In contrast, the crude oil, electricity, and carbon markets mainly serve as net receivers. These findings help investors and policymakers adopt more appropriate strategies to avoid risks. Third, this paper provides new lessons for the dynamic interplay between carbon and energy markets in times of crisis by discussing the return and volatility connectedness during the COVID-19 pandemic. During the pandemic, the carbon market received information spillovers from the electricity, natural gas, and coal markets. Conversely, the carbon market primarily acted as a source of risk transmitter, transmitting risk to the electricity market. Therefore, in the post-pandemic scenario, it is necessary to remain vigilant about the complex linkages between carbon and energy markets, especially the electricity market. To some extent, this conclusion supports Ding et al. (2022), who indicate that the carbon market experienced significant disruptions during the COVID-19 pandemic. Simultaneously, this paper supports the viewpoint of Wang and Huang (2021) that the pandemic severely leads to a significant imbalance between supply and demand in the energy markets. This may further result in changes in the connectedness between carbon and energy markets. Therefore, there is a need to establish long-term regulatory rules to avoid abnormal fluctuations in energy prices.
The rest of the paper is organized as follows. Section 2 presents the methodology and data used in this study. Section 3 reports the empirical findings and robustness tests. Section 4 concludes with a summary of the main conclusions of this paper.
2 Data and methodology
2.1 Data
In light of the EU ETS being the largest and most mature global carbon trading market, this paper chooses to explore the ICE-EUA futures contracts (EUR/ton of CO2) as representatives of the carbon market, serving as a crucial constituent of the European carbon market. This choice is based on the extensive acknowledgment of the European carbon market and the paramount role played by the ICE-EUA futures in revealing the dynamic characteristics of the carbon market. Following Tan et al. (2020) and Lovcha et al. (2022), this paper focuses on four energy markets: electricity, natural gas, crude oil, and coal. The reason is that the close correlation between these traditional energies' consumption patterns and the carbon market’s evolution (Tan et al., 2020). The EEX-Phelix Electricity Baseload future (EUR/MWh) represents the electricity market. This choice is because the EEX-Phelix Electricity future is recognized as the benchmark contract for European electricity, boasting the most liquid contract in the European electricity market. For the natural gas, the ICE-UK Natural Gas future (GBP/Therm) is selected since it is prevalent as a liquefied natural gas derivative in pricing the European natural gas market. Referring to Vellachami et al. (2023), the crude oil market is captured through the ICE-Brent Crude Continuous futures (USD/barrel). It is selected as a reference benchmark for two-thirds of the global trade of crude oil supply, particularly in the European crude oil supply. Additionally, following Zhou et al. (2022), this paper chooses the ICE-Rotterdam Coal futures (USD/ton) to represent the coal market since the price of Rotterdam coal futures is regarded as a primary reference for Northwest European coal prices.
This study chooses futures prices, given their higher trading activity and lower susceptibility to short-term noise than spot prices (Sadorsky, 2001). This paper converts various currencies to the US dollar to ensure uniform currency representation for the abovementioned assets. The commodities' data and the exchange rates are obtained from the Datastream database. The sample period is selected from 3 March 2008, to 27 September 2021. The availability of ICE-EUA futures data influences the sample period selection. Notably, Phase I is excluded from the analysis, as numerous studies have shown that price fluctuations during this phase were predominantly driven by EU policy adjustments rather than market fundamentals (Sousa et al., 2014; Ortas and Álvarez, 2016). Subsequently, this paper calculates the continuous compounded return of the five markets (carbon, crude oil, natural gas, electricity, coal) using the logarithmic difference method. The absolute values of returns are employed to calculate volatility (Zheng et al., 2014; Tan et al., 2020). Descriptive statistics for the return and volatility of the five markets are shown in Table 1.
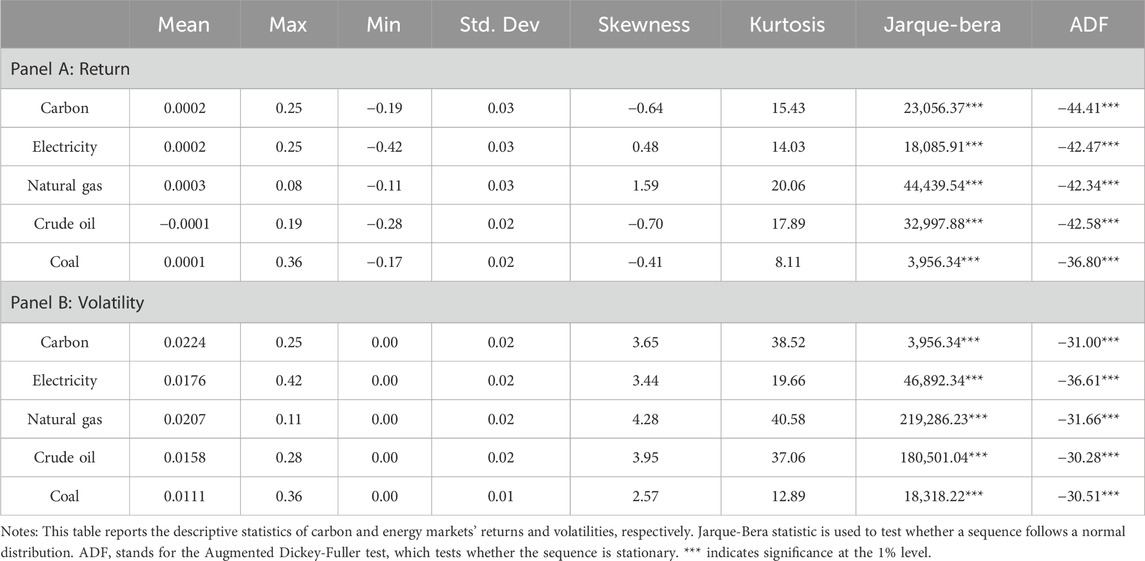
TABLE 1. Descriptive statistics.
In Panel A, it is evident that the average values span from −0.01% to 0.03%. The unconditional volatility, measured by standard deviation, ranges from 2% to 3%. Notably, coal and crude oil exhibit the lowest standard deviation, signifying relatively stable investment markets. In contrast, the electricity market emerges as a highly volatile asset, with the most comprehensive range between the maximum and minimum daily returns reaching 25% and −42%, respectively. At the same time, the carbon, crude oil, and coal markets exhibit negative skewness and have more significant downside risks. As shown in Table 1, both the return and volatility series display the characteristics of “high peak and fat tails" since all market returns have skewness values that are not equal to zero and kurtosis values greater than three. Additionally, the Jarque-Bera statistic indicates that each market’s return and volatility series do not follow a normal distribution. Furthermore, both the DY model and the BK model are grounded in the vector autoregressive (VAR) model framework, which requires stationarity for all involved variables. The Augmented Dickey-Fuller (ADF) test was utilized in this paper to evaluate the stationarity of the variables. The ADF stationarity test indicates that each market’s return and volatility series are stationary, facilitating the subsequent application of the DY and BK modeling.
Figure 1 presents the Pearson correlation heatmap that depicts the correlation between carbon and energy markets. The heatmap illustrates a positive correlation in the returns of all markets. The most robust correlation is observed between the electricity and natural gas markets. This observation highlights a correlation between carbon and energy markets, warranting further investigation into their connectedness.
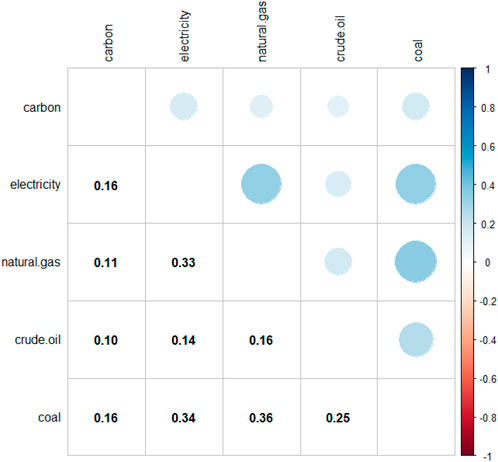
FIGURE 1. Correlations matrix.
2.2 Methodology
This paper uses the DY model and the BK model to examine the time-frequency domain connectedness between carbon and energy markets. The DY model, grounded in a VAR model, employs a generalized forecast error variance decomposition (GFEVD) technique to derive spillover effects. This method facilitates a nuanced understanding of the connectedness among variables (Diebold and Yilmaz, 2014). This method allows simultaneous measurement of connectedness between any two markets, between one market to any set of markets, or one market and overall markets. Therefore, it provides a more comprehensive and intuitive assessment of the connectedness between carbon and energy markets. Additionally, incorporating rolling window technology, the DY model facilitates a dynamic observation of the connectedness between carbon and energy markets. Currently, this method has been widely adopted in research on the connectedness between carbon and energy markets (Wang and Guo, 2018; Dai et al., 2021). The BK model, on the other hand, is built upon the DY model by constructing a spectral representation framework for GFEVD (Baruník and Křehlík, 2018). This method has gained widespread acceptance among scholars, who have employed it to investigate connectedness in various contexts (Ding et al., 2022; Wan et al., 2024). It measures the differential connectedness generated by heterogeneous frequency shocks, enabling the identification of whether shocks induce connectedness between markets in high-frequency (short-term) or low-frequency (long-term) (Yang et al., 2021). Therefore, employing the BK method to study the frequency connectedness between carbon and energy markets can help market participants with diverse time horizon objectives to make more informed decisions.
Specifically, the total connectedness index (TCI) can be defined as Eq. 1:
where
The directional connectedness index
Then, the net connectedness index
If
Following Baruník and Křehlík (2018), this paper can describe the connectedness in the frequency domain. The total frequency connectedness index on frequency band d can be defined as Eq. 5:
where the frequency band
The directional connectedness index
3 Results
3.1 Return connectedness
3.1.1 Static connectedness
Table 2 illustrates the static return connectedness between carbon and energy markets in both time and frequency domains. First, the total connectedness index is 17.62%, indicating that system variables account for 17.62% of the variation in the forecast error variance. This denotes a moderate return connectedness between carbon and energy markets. This finding is supported by Ji et al. (2018) and Su et al. (2023), who affirmed the presence of informational connectedness between carbon and energy markets. Simultaneously, the high-frequency connectedness (13.08%, constituting 74.23% of the total connectedness) surpasses both medium- and low-frequency connectedness, implying that the return connectedness is predominantly concentrated at high-frequency. It suggests that most information is absorbed within 5 days of a specific shock (Hoque et al., 2023). The findings of Ding et al. (2022) also support this notion. Their research indicates that the high-frequency connectedness between carbon and energy markets is significantly greater than the low-frequency connectedness. According to Dai et al. (2021), this phenomenon means that the return connectedness between carbon and energy markets is primarily influenced by market sentiment.
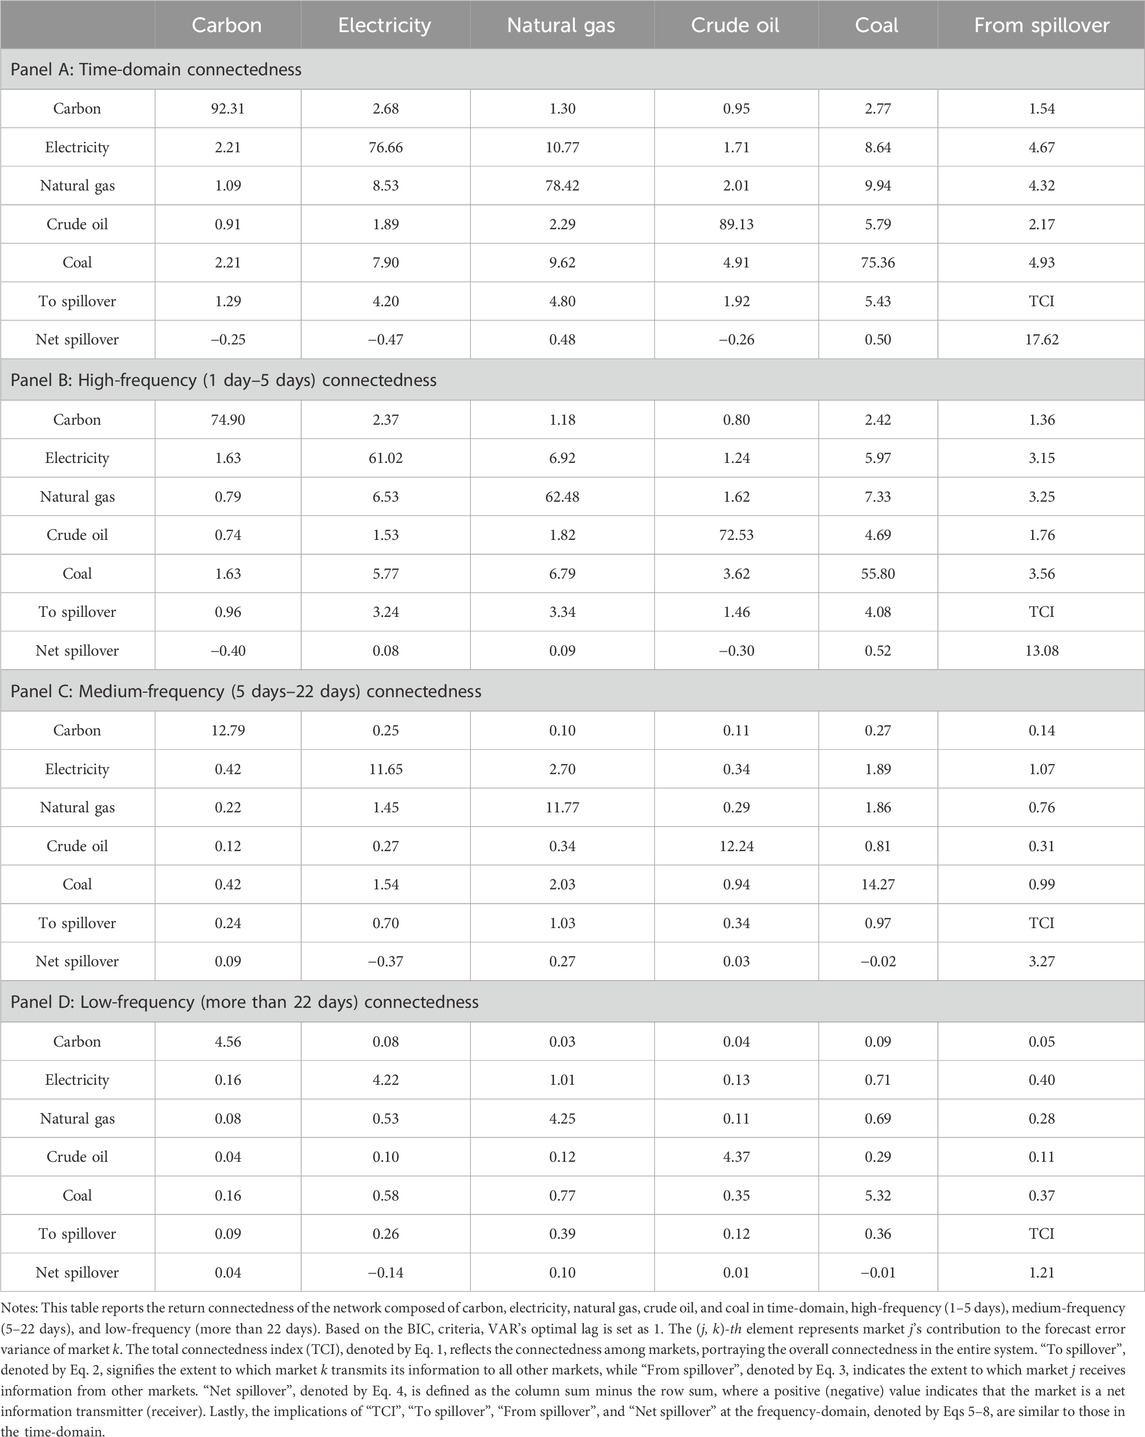
TABLE 2. Return connectedness (%).
Secondly, the electricity and coal markets are the primary markets influencing the return connectedness of the carbon market. Notably, the directional spillover from the energy markets to carbon is as follows: coal (2.77%), electricity (2.68%), natural gas (1.30%), and crude oil (0.95%). The electricity and coal markets also receive the most substantial directional spillovers from the carbon market. This conclusion holds in the frequency-domain as well. However, it contrasts with the findings of Zhao et al. (2023), who suggest no significant return connectedness between carbon and electricity markets. The different conclusions may be ascribed to the intermediary role of the energy markets, which indirectly facilitates the connectedness between carbon and electricity markets.
Thirdly, the directional return connectedness between carbon and energy markets predominantly concentrates on high-frequency, underscoring the importance of heightened vigilance towards high-frequency information transmission for investors. We focus on the markets exhibiting the most pronounced connectedness with the carbon market. Specifically, the time-domain connectedness received by the coal and electricity markets from other markets are 4.93% and 4.67%, respectively. And their high-frequency connectedness are 3.56% (accounting for 72.27%) and 3.15% (accounting for 67.56%), respectively. The time-domain connectedness of the coal and electricity markets transferred to other markets are 5.43% and 4.20%, respectively. And the high-frequency connectedness are 4.08% (75.25%) and 3.24% (77.13%), respectively.
Table 3 summarizes the net return connectedness among different markets in both time and frequency domains. Notably, the net return connectedness across various markets generally exhibits consistent direction in the time-domain and at high-frequency. However, it takes an almost opposite direction at medium- and low-frequency. Hence, it becomes imperative to decompose the return connectedness in the frequency-domain, ensuring that investors adopt a more scientific investment strategy (Mensi et al., 2021; Li et al., 2022). Specifically, in the time-domain, the natural gas market (0.48%) and the coal market (0.50%) act as net transmitters. Conversely, the crude oil market (−0.26%) and the carbon market (−0.25%) are net receivers, which remains consistent at high-frequency. This conclusion, to some extent, aligns with the viewpoint of Hoque et al. (2023), asserting that the carbon market operates as a net receiver of return connectedness between carbon and energy markets. However, except for the natural gas market, the net connectedness at medium- and low-frequency exhibits an opposite direction compared to high-frequency. This finding is consistent with Ding et al. (2022), who suggest that the carbon market acts as a net receiver of return connectedness in the short term. Conversely, the carbon market transforms into a transmitter of return connectedness in the long-term. This phenomenon further underscores the heterogeneity of connectedness across different frequency domains.
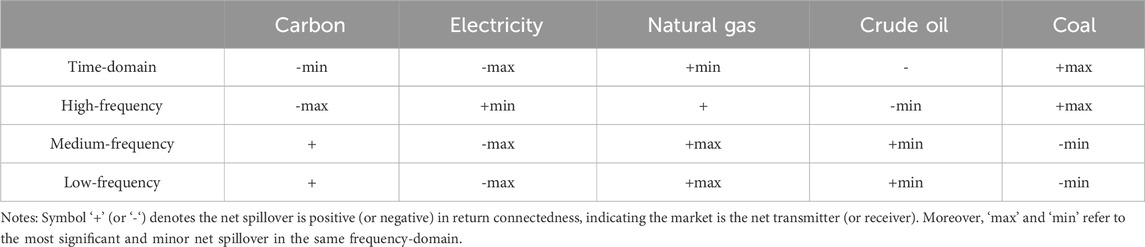
TABLE 3. Summary for net return connectedness in the time and frequency domains.
3.1.2 Dynamic connectedness
Figure 2 illustrates the dynamic return connectedness between carbon and energy markets in time and frequency domains. The return connectedness is predominantly concentrated at high-frequency, and extreme events exacerbate this dynamic connectedness. Both Naeem et al. (2020) and Zhou et al. (2022) indicate that under the backdrop of increasing global uncertainty, the connectedness between carbon and energy markets is more sensitive to the impacts of extreme events.
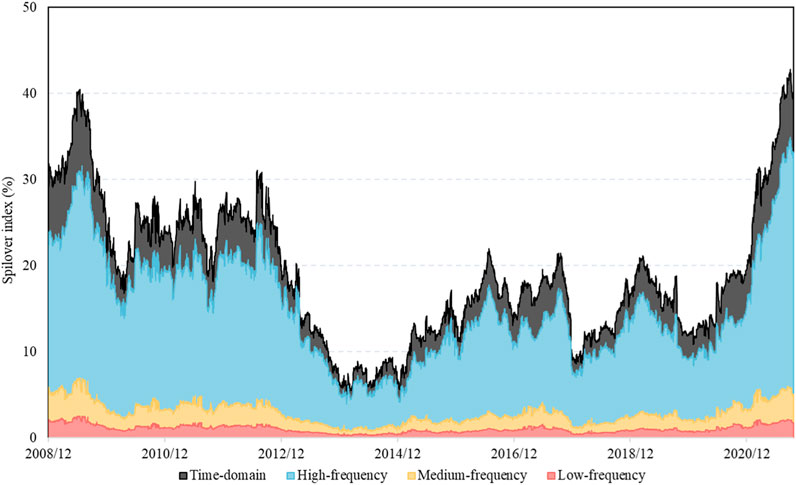
FIGURE 2. The dynamics of total return connectedness in the time and frequency domains. Notes: This figure shows the dynamics of total return connectedness between carbon and energy markets in the time-domain and at high-frequency, medium-frequency, and low-frequency. This figure is based on the 100-step-ahead forecast horizon and 200-day rolling window size (around 1 year covered by each window).
First, the total return connectedness ranges from 5% to 45%, indicating that the connectedness between carbon and energy markets exhibits time-varying characteristics. Second, the dynamic return connectedness is predominantly concentrated at high-frequency. Specifically, the range of dynamic connectedness at high-frequency fluctuates between 5% and 35%, exhibiting a noticeable variability. In contrast, the dynamic connectedness at medium-frequency remains relatively stable, fluctuating around 5%. Furthermore, the dynamic connectedness at low-frequency shows a minimal variation, with the highest reaching only 2.5%. Additionally, the trend of the high-frequency connectedness aligns with the time-domain connectedness, whereas the time-varying characteristics of medium- and low-frequency connectedness are not evident. Third, the occurrence of extreme events leads to an increase in the return connectedness. Specifically, due to the severe economic recession in the Eurozone in 2009 and the subsequent European debt crisis that worsened from late 2009 to mid-2011 (Tan et al., 2020), the return connectedness consistently maintained a high level (above 25%). In 2015, the connectedness index exhibited an upward trend, possibly attributable to heightened global uncertainty from the deceleration of the Chinese economy in 2015. It coupled with the Federal Reserve’s interest rate hike (Tan et al., 2020). In 2016, the connectedness index experienced another increase attributed to the plunge in oil prices. Subsequently, the surge of the connectedness index in 2018–2019 may be linked to the Sino-U.S. trade friction and the signing of the oil production reduction agreement (Jiang and Chen, 2022a). In January 2020, the outbreak of the COVID-19 pandemic shook market sentiment, resulting in a significant spike in the connectedness index. In December 2020, the emergence of “variant strains" (specifically, Alpha (B.1.1.7) and Beta (B.1.351)) influenced market sentiment, leading to a further escalation in the connectedness index and reaching its peak.
Figure 3 shows the dynamic net return connectedness between carbon and energy markets in time-frequency domains. Throughout the sample period, the natural gas and coal markets primarily act as net transmitters, whereas carbon and crude oil markets predominantly act as net receivers. The electricity market exhibits alternating positive and negative net connectedness. This finding somewhat aligns with Naeem et al. (2020), who suggest that natural gas is the primary net transmitter. Furthermore, the net return connectedness for individual markets is concentrated at high-frequency.
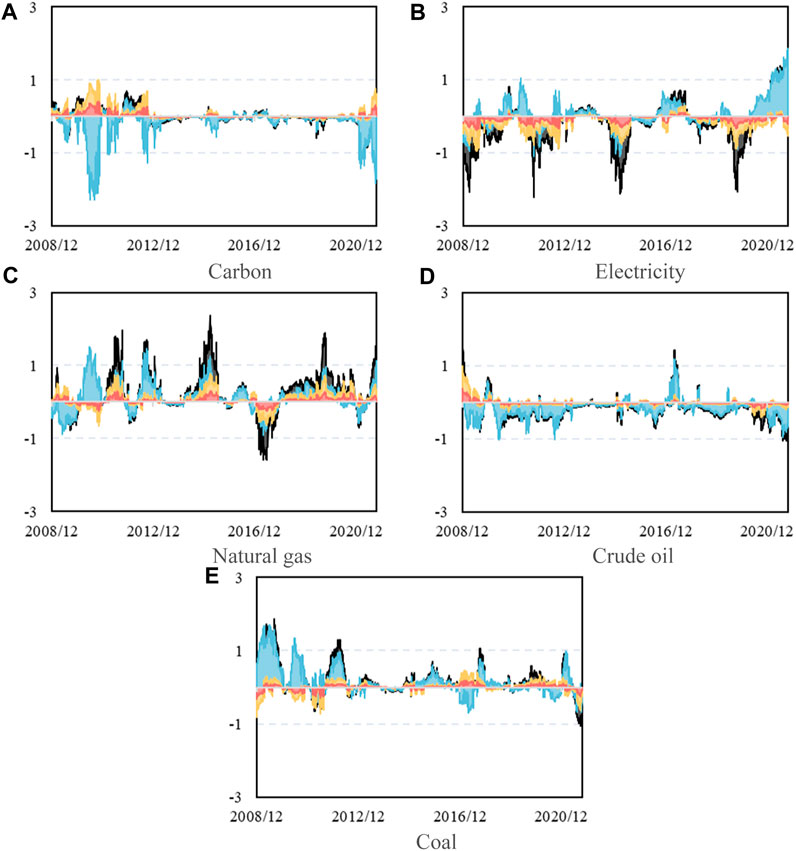
FIGURE 3. The dynamics of net return connectedness in the time and frequency domains: (A) Carbon, (B) Electricity, (C) Natural gas, (D) Crude oil, (E) Coal.
First, the carbon market primarily acted as a net receiver in the time-domain and at high-frequency, with prominent periods observed in 2010 and 2020. However, the carbon market is primarily a net transmitter at medium- and low-frequency. Second, the electricity market was a net receiver before 2016 in the time-domain. However, post-2016, the net connectedness of the electricity market exhibited an alternating pattern of positive and negative values. This shift might be attributed to Germany’s electricity reform in 2016, introducing Electricity Market 2.0, abandoning capacity markets, and implementing a more efficient and flexible electricity supply system (Tan et al., 2020). At medium- and low-frequency, the electricity market predominantly operated as a net receiver, while it changed to mainly a net transmitter at high-frequency after 2016. Third, the natural gas market serves as the primary net transmitter, mainly attributable to the distinctive pricing mechanism of natural gas in Europe (Tan et al., 2020). Additionally, the natural gas market is generally a net transmitter in different frequency domains, with high-frequency connectedness being predominant. Fourth, the crude oil market predominantly acts as a net receiver, and the net connectedness maintains a consistent direction in the time-domain and at high-frequency. Fifth, the coal market is primarily characterized as a net transmitter in the time-domain. The net connectedness at high-frequency exhibited an alternating pattern between positive and negative values from 2016, while medium- and low-frequency net connectedness kept positive values. Sixth, during the COVID-19 pandemic, the net return connectedness of all markets increased in both time and frequency domains. The crude oil and carbon markets act as net receivers with a heightened level of net inward spillover. However, the net return connectedness of the electricity and coal markets undergoes a directional transformation in the time-domain and at high-frequency, shifting from net receivers to net transmitters.
3.2 Volatility connectedness
3.2.1 Static connectedness
Table 4 shows the static volatility connectedness between carbon and energy markets in time-frequency domains. Notably, volatility connectedness is evident, primarily concentrated at medium- and low-frequency. This implies that fundamental factors, such as supply and demand, influence the risk contagion between carbon and energy markets. Consequently, investors should give increased attention to medium- and low-frequency risk contagion (Dai et al., 2021). Our conclusion aligns with the findings of Adekoya et al. (2021), who indicate that the volatility connectedness between carbon and energy markets is primarily concentrated in the medium- and long-term. This finding differs from the conclusion of Hoque et al. (2023), whose research suggests that the volatility connectedness between carbon and energy markets is concentrated in the short-term. Moreover, unlike the net return connectedness, the net volatility connectedness between carbon and energy markets exhibits a consistent direction in both time and frequency domains.

TABLE 4. Volatility connectedness (%).
First, the volatility connectedness between carbon and energy markets amounts to 9.32%, with high-frequency connectedness at 3.82% (accounting for 41.03% of the time-domain connectedness) and medium- and low-frequency connectedness at 5.49% (accounting for 58.97% of the time-domain connectedness). Second, in line with the return connectedness, the coal and electricity markets primarily influence the carbon market. Specifically, the directional connectedness of the carbon market received from the coal and electricity markets are 0.49% (accounting for 31.45%) and 0.39% (accounting for 25.30%), while the directional connectedness of the carbon market transmitted to the coal and electricity markets are 0.36% (accounting for 31.21%) and 0.30% (accounting for 25.81%). This conclusion remains true at medium- and low-frequency. Third, the directional volatility connectedness is mainly concentrated at medium- and low-frequency. Specifically, taking the markets with the most prominent directional volatility connectedness to the entire system as the sample, the time domain volatility connectedness transmitted by the coal and natural gas markets to other markets are 3.02% and 2.94%, respectively. In contrast, the medium- and low-frequency connectedness are 1.83% (accounting for 60.50%) and 1.97% (accounting for 67.12%), respectively. Meanwhile, the time domain volatility connectedness received from other markets by the coal and electricity markets are 2.72% and 2.84%, respectively. In contrast, the medium- and low-frequency connectedness are 1.54% (accounting for 56.72%) and 1.70% (accounting for 59.94%), respectively.
Table 5 summarizes the net volatility connectedness between carbon and energy markets in both time and frequency domains. Notably, the net volatility connectedness remains consistent in both time and frequency domains, except for the crude oil market at high-frequency. Regarding time-domain net connectedness, the net volatility connectedness maintains an entirely consistent direction with the net return connectedness. However, it is worth noting that the natural gas market becomes the largest net volatility connectedness transmitter. The electricity market emerges as the highest net receiver in return and volatility net connectedness at medium- and low-frequency. Furthermore, the net volatility connectedness of carbon, crude oil, and coal markets is opposite to their net return connectedness. Specifically, the carbon and crude oil markets shift from the net return transmitters to the net volatility receivers, while the coal market shifts from the net return receiver to the net volatility transmitter. This conclusion aligns with Adekoya et al. (2021), who indicate that carbon and crude oil markets act as the net receivers in medium- and long-term volatility connectedness.
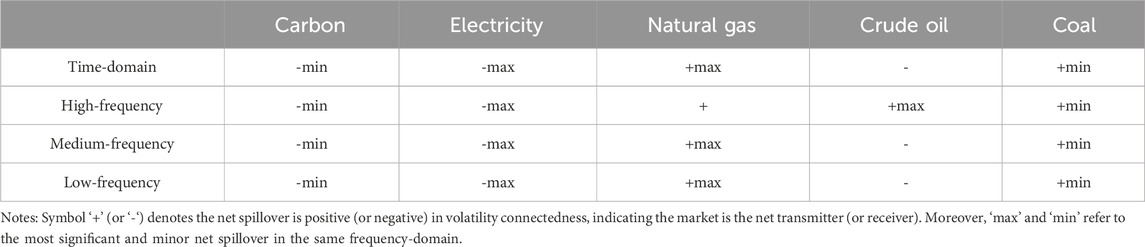
TABLE 5. Summary for net volatility connectedness in the time and frequency domains.
3.2.2 Dynamic connectedness
Figure 4 presents the dynamic volatility connectedness between carbon and energy markets in both time and frequency domains. First, the dynamic volatility connectedness in the time-domain varies from 2% to 25%. High-frequency volatility connectedness exhibits similar fluctuating trends with the time-domain volatility connectedness, fluctuating between 2% and 20%. Meanwhile, the medium-frequency (low-frequency) volatility connectedness fluctuates between 1% and 5% (1% and 4%). Furthermore, the volatility connectedness was concentrated at high-frequency before 2013. However, from 2013 to 2019, the volatility connectedness was mainly concentrated at medium- and low-frequency.
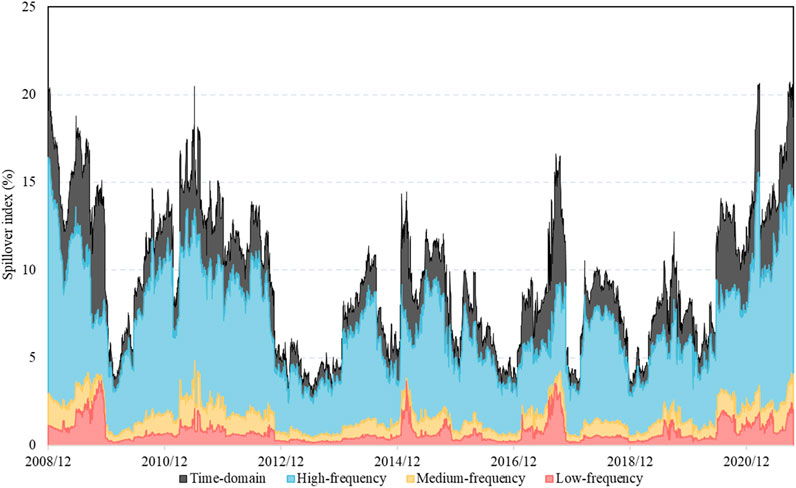
FIGURE 4. The dynamics of total volatility connectedness in the time and frequency domains. Notes: This figure shows the dynamics of total volatility connectedness between carbon and energy markets in the time-domain and at high-frequency, medium-frequency, and low-frequency. The figure is based on the 100-step-ahead forecast horizon and 200-day rolling window size (around 1 year covered by each window).
Second, extreme events can also lead to substantial shifts in volatility connectedness. In contrast to the dynamic return connectedness, the dynamic volatility connectedness undergoes more frequent variations. It suggests that volatility connectedness is more sensitive to shocks from extreme events than return connectedness (Ding et al., 2022). Specifically, the severe economic recession in the Eurozone in 2009 resulted in a high level of volatility connectedness, exceeding 15%. The outbreak of the European debt crisis at the end of 2009 and its subsequent deterioration in mid-2011 contributed to a continuous increase in volatility connectedness, surging from 3.8% to 20.5% (Tan et al., 2020). In early 2013, the EU ETS entered its third phase, accompanied by the implementation various related policies. This increased market uncertainty and expectations’ instability, consequently enhancing the connectedness between carbon and energy markets and causing a rapid increase in volatility connectedness (Dai et al., 2021). In 2016, the sharp decline in crude oil prices led to a rapid increase in volatility connectedness, maintaining a high level. In 2017, the United States withdrew from the Paris Agreement, presenting substantial challenges to global environmental governance’s fairness, efficiency, and effectiveness. Consequently, the connectedness index once again showed an upward trend. It is worth noting that the medium- and low-frequency volatility connectedness increased significantly during 2016 and even surpassed the high-frequency volatility connectedness. It suggests that this event has a long-term impact on both carbon and energy markets. The outbreak of the COVID-19 pandemic in 2020 caused a shock to market sentiment, leading to a continuous increase in volatility connectedness. Simultaneously, concerns about long-term macroeconomic performance led to an increase in medium- and low-frequency volatility connectedness. Furthermore, the continuous emergence of variant strains from late 2020 to mid-2021 contributed to the sustained increase in volatility connectedness, reaching its peak at the end of 2021. This conclusion supports the findings of Lu et al. (2023). Their research indicates a sharp increase in the total volatility connectedness index and the emergence of significant peaks in both carbon and energy markets since the outbreak of the COVID-19 pandemic. Therefore, the COVID-19 pandemic has posed substantial risks to these markets.
Figure 5 presents the dynamic net volatility connectedness between carbon and energy markets in time-frequency domains. The natural gas market primarily serves as a net transmitter, while the electricity market mainly acts as a net receiver. The roles of net transmitters or receivers in the carbon, crude oil, and coal markets have undergone several transformations. Additionally, compared to the net return connectedness, the net volatility connectedness is mainly concentrated at medium- and low-frequency.
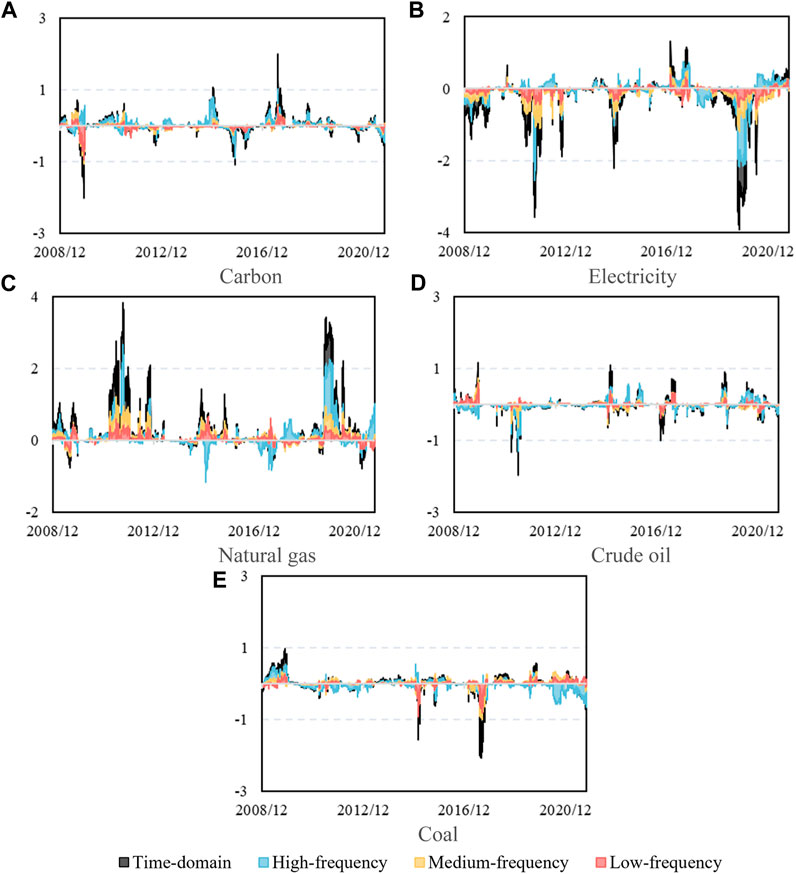
FIGURE 5. The dynamics of net volatility connectedness in the time and frequency domains: (A) Carbon, (B) Electricity, (C) Natural gas, (D) Crude oil, (E) Coal.
First, in 2014, the carbon market was primarily a risk transmitter, while the electricity and coal markets were risk receivers during this period. This was due to the European Union Environment Committee accelerating the back-loading process2. Moreover, the unstable expectations for the carbon market resulted in the dominance of high-frequency connectedness during this period. Second, the electricity market primarily acts as a net receiver, which may be attributed to the significant determinants of production costs for electricity companies, namely, carbon, coal, and natural gas (Keppler and Mansanet-Bataller, 2010). Therefore, volatilities in these markets will be transmitted to the electricity market. Furthermore, the net volatility connectedness of the electricity market is primarily concentrated at medium- and low-frequency. Third, the natural gas market is primarily characterized by a net transmitter during the sample period, with medium- and low-frequency net volatility connectedness dominating. This may be attributed to the low price and abundant reserves of natural gas, which directly compete with other energies in production activities (Wang and Guo, 2018). Consequently, volatilities in the natural gas market have significant impacts on the marginal costs of other fuels (Wang and Guo, 2018). Fourth, the net connectedness of the crude oil market exhibits relatively tiny changes during the sample period. Furthermore, the medium- and low-frequency net connectedness exhibits consistent direction with time-domain net connectedness. Fifth, the direction of net volatility connectedness in the coal market also exhibits an alternated positive and negative characteristic, opposing that of the carbon market. This may be attributed to coal being the primary source of carbon emissions, making it more sensitive to changes in the carbon market (Tan et al., 2020; Edziah et al., 2022). Sixth, during the outbreak of the COVID-19 pandemic, the net volatility connectedness of various markets increased in both time and frequency domains. Notably, the natural gas market witnessed an intensified net outward spillover at high-frequency connectedness, while the electricity and coal markets experienced augmented net inward spillovers. Simultaneously, the natural gas, crude oil, and coal markets exhibited heightened net outward spillovers at medium- and low-frequency connectedness. In contrast, the carbon futures and electricity markets showed increased net inward spillovers.
3.3 Comparison of return connectedness and volatility connectedness
We can obtain the following observations by comparing the results of return and volatility connectedness between carbon and energy markets. First, the total return connectedness (17.62%) significantly surpasses the total volatility connectedness (9.32%), indicating that information transmission among these markets is stronger than risk contagion. This conclusion aligns with Tan et al. (2020), who assert that the volatility connectedness between carbon and energy markets is weaker than the return connectedness. However, it differs from the findings of Ji et al. (2018), whose research suggests that the risk contagion between carbon and energy markets is higher than the information transmission. This differential conclusion may be influenced by data frequency since the former uses daily data consistent with the data frequency in this paper, while the latter employs weekly data. More importantly, the sampling period of this paper spans Phases II and III and part of Phase IV in the EU ETS. In contrast, Tan et al. (2020) and Ji et al. (2018) research sample periods only reach the mid-to-late stages of Phase III. Consequently, our conclusions better capture the objective outcomes in the current scenario.
Second, the return connectedness is predominantly concentrated at high-frequency, representing over 77% of the total connectedness. This suggests rapid information transmission across markets, with most information absorbed within 5 days following a specific shock. Moreover, the return connectedness is primarily influenced by market sentiment (Wang, 2020). As for the volatility, connectedness is mainly concentrated at medium- and low-frequency, indicating that market risk contagion is primarily influenced by long-term fundamental factors such as supply and demand (Dai et al., 2021; Wu et al., 2023).
Third, both return and volatility dynamic connectedness exhibit similar fluctuating trends, and extreme events can cause significant changes. Moreover, the dynamic return connectedness demonstrates a higher degree of fluctuation in the face of extreme events, while the dynamic volatility connectedness experiences more frequent variations. This conclusion, to some extent, supports the viewpoints of Ji et al. (2018), who indicate that the risk contagion between carbon and energy markets exhibits more pronounced dynamic changes than information transmission.
Fourth, high-frequency connectedness dominates total and directional return connectedness, while medium- and low-frequency connectedness dominates total and directional volatility connectedness. This is consistent with the results observed in the static connectedness in time-frequency domains. This conclusion aligns with the findings of Ding et al. (2022) since they indicate that the return connectedness between carbon and energy markets is concentrated at high-frequency. Simultaneously, our findings are consistent with those of Adekoya et al. (2021), who suggest that volatility connectedness is concentrated at medium- and low-frequency. However, the abovementioned research only considers return connectedness or volatility connectedness. Given the distinct transmission channels for return and volatility connectedness (Wan et al., 2024), this paper comprehensively addresses both return and volatility connectedness, shedding new light on the connectedness between carbon and energy markets. Moreover, this paper indicates that risk contagion between carbon and energy markets can last over a month. This aligns with practical reality, given that volatility exhibits persistence (Wei et al., 2022b).
Fifth, the net return connectedness in each market maintains a consistent direction in the time-domain and at high-frequency. In contrast, the direction at medium- and low-frequency is opposite to the time-domain. Moreover, the net volatility connectedness maintains a generally consistent direction in both time and frequency domains. This suggests that information transmission and risk contagion among different markets exhibit noticeable differences in time-frequency domains, highlighting the complexity of the connectedness between carbon and energy markets (Hoque et al., 2023). Furthermore, both in terms of return and volatility connectedness, the markets most strongly correlated with the carbon market are the electricity and coal markets. This conclusion aligns with Zhang and Sun (2016) since they indicate that the coal market transmits volatility connectedness to the carbon market through its effect on the carbon emission demands of power companies. This is supported by Giorgio (2014), who indicates a bidirectional causal relationship between carbon and electricity prices.
Sixth, during the COVID-19 pandemic (from 1 January 2020, to 27 September 2021), all markets' net return and volatility connectedness increased in both time and frequency domains. Figures 6, 7 present the return and volatility connectedness networks between carbon and energy markets in time-frequency domains during the COVID-19 pandemic. Overall, the return connectedness is notably stronger than the volatility connectedness during this period. This means that the level of information transmission between carbon and energy markets is higher than that of risk contagion during the pandemic. Meanwhile, both return connectedness and volatility connectedness are primarily concentrated at high-frequency. Regarding return connectedness, the carbon market primarily acts as an information receiver, mainly receiving spillovers from the electricity market, followed by the natural gas and coal markets. This conclusion supports Ding et al. (2022), who pointed out that during the COVID-19 pandemic, the carbon market primarily acted as a receiver. However, in the volatility connectedness, the carbon market transforms into a risk transmitter, mainly transmitting risks to the electricity market. This conclusion, to some extent, supports the findings of Tan et al. (2020), who point out that the volatility spillover from the carbon market to the electricity market can help predict volatility in the electricity market via the carbon market. Lastly, the focus of this paper differs in several ways. First, different from previous research (Wang and Guo, 2018; Naeem et al., 2020; Tan et al., 2020; Dai et al., 2021), this paper investigates the connectedness between carbon and energy markets spanning from 2008 to 2021, covering the period of the COVID-19 pandemic. This helps to reveal the influence of the pandemic on the connectedness between carbon and energy markets, enriching the investigation of information transmission and risk contagion during crises. Second, while Ding et al. (2022), Jiang and Chen (2022b), and Su et al. (2023) examined the return connectedness between carbon and energy markets pre and post-pandemic, they neglected to consider the volatility connectedness amid the pandemic. This paper comprehensively contrasts the return and volatility connectedness between carbon and energy markets during the pandemic, addressing the research gap in the existing literature.
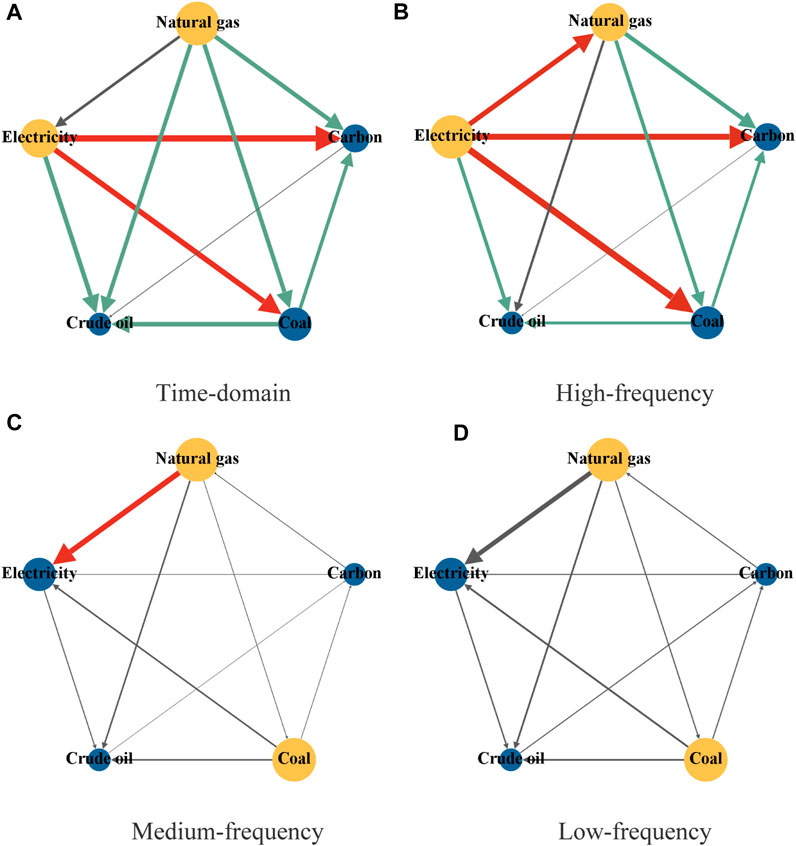
FIGURE 6. The networks of time-frequency return connectedness between carbon and energy markets during the COVID-19 pandemic: (A) Time-domain, (B) High-frequency, (C) Medium-frequency, (D) Low-frequency. Notes: The diameter of the nodes in this figure denotes the out-degree. The yellow nodes in this figure represent the net return transmitters in the network, while the blue nodes denote the net receivers. The direction of the arrows shows the net pairwise spillover direction. The color and magnitude of the lines indicate the strength of the return connectedness (black (spillover level less than 10%), blue-green (spillover level from 10% to 20%), and red (spillover level more than 20%)).
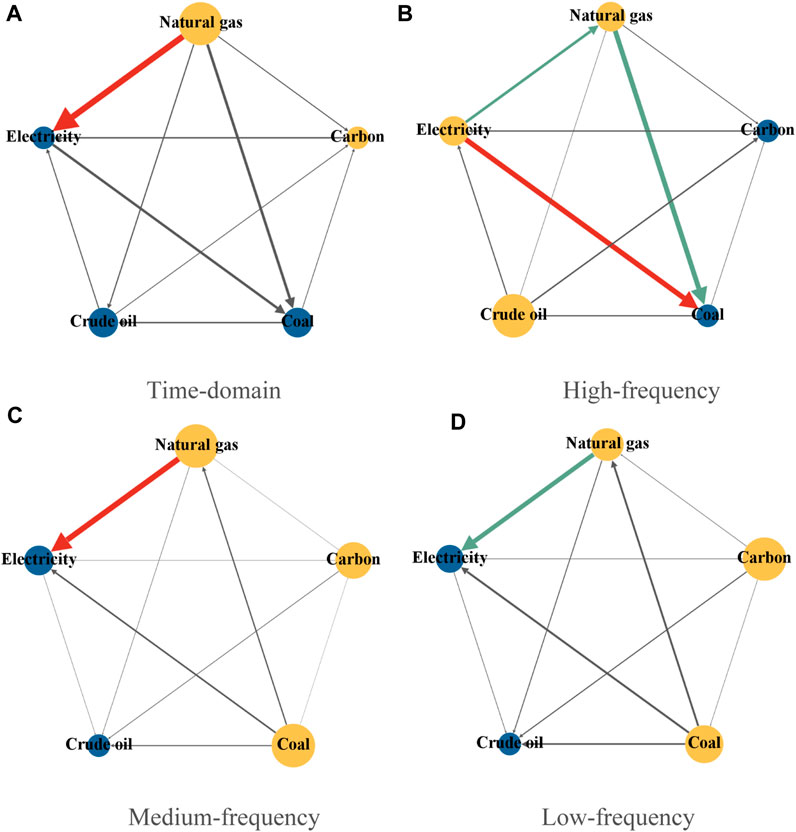
FIGURE 7. The networks of time-frequency volatility connectedness between carbon and energy markets during the COVID-19 pandemic: (A) Time-domain, (B) High-frequency, (C) Medium-frequency, (D) Low-frequency. Notes: The diameter of the nodes denotes the out-degree. The yellow nodes in this figure represent the net volatility transmitters in the network, while the blue nodes denote the net receivers. The direction of the arrows shows the net pairwise spillover direction. The color and magnitude of the lines indicate the strength of the volatility connectedness (black (spillover level less than 10%), blue-green (spillover level from 10% to 20%), and red (spillover level more than 20%)).
3.4 Robustness check
To ensure the robustness of our findings, this paper conducts examinations using two distinct configurations to assess the stability of the time-frequency domains' connectedness calculated earlier. First, setting a higher forecast horizon can help better separate the connectedness into long-term and short-term components (Baruník and Křehlík, 2018; Zhu et al., 2023b). Referring to Zhu et al. (2023b), this paper adjusts the forecast horizon to 100 days and 150 days to ensure the robustness of the results. Figure 8 shows that neither return nor volatility connectedness is sensitive to changes in the forecast horizon.
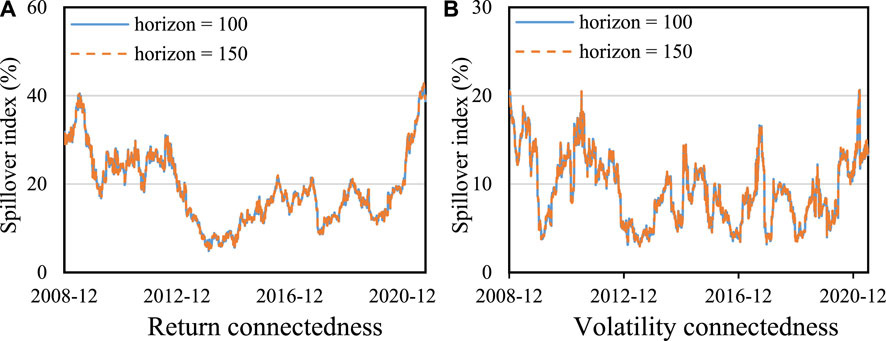
FIGURE 8. Robust tests on the forecast horizon: (A) Return connectedness, (B) Volatility connectedness.
Second, a smaller rolling window size may make connectedness sensitive to outliers, thereby obscuring critical time points in risk transmission (Zhu et al., 2023b). Conversely, if the rolling window size is relatively large, it may lead to excessively smooth connectedness, preventing the detection of its actual dynamic structure (Zhu et al., 2023a). To assess the sensitivity of the connectedness between carbon and energy markets to the rolling windows setting, this paper conducts robustness tests with rolling windows setting at 150, 200, and 250 days while keeping the forecasting horizon unchanged at 100 days by following Zhu et al. (2023a). Figure 9 demonstrates that both return and volatility connectedness are not sensitive to changes in rolling window size. Therefore, the findings of this paper are robust.
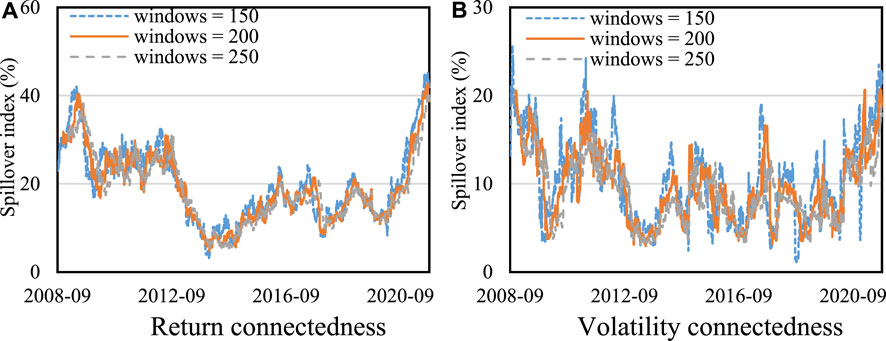
FIGURE 9. Robust tests on the rolling window size: (A) Return connectedness, (B) Volatility connectedness.
4 Conclusion
4.1 Research conclusion
This paper investigates the return and volatility connectedness between carbon and energy markets from March 2008 to September 2021. The time-frequency connectedness approaches proposed by Diebold and Yilmaz (2014) and Baruník and Křehlík (2018) are introduced for the analysis. This paper draws four conclusions. First, the return connectedness surpasses volatility connectedness. Moreover, high-frequency connectedness prevails in total and directional return connectedness, implying that information transmission in carbon and energy markets is predominantly concentrated in the short-term (1–5 days). While medium- and low-frequency connectedness dominate in total and directional volatility connectedness, indicating that the risk contagion in carbon and energy markets is primarily concentrated in medium- and long-term (5–22 days and more than 22 days). This means that information transmission is more pronounced than risk contagion between carbon and energy markets. And information transmission is primarily influenced by market sentiment, while risk contagion is more affected by fundamentals. Second, extreme events, such as the oil price plunge, the Sino-U.S. trade friction, and the COVID-19 pandemic, have heightened dynamic changes in return and volatility connectedness. In contrast to the return connectedness, changes in volatility connectedness are more frequent, especially at medium- and low-frequency. This indicates that extreme events intensify information transmission and risk contagion between carbon and energy markets, and risk contagion changes more frequently. Third, the net return connectedness in all markets remains consistently oriented in the time-domain and at high-frequency but exhibits an almost opposite direction at medium- and low-frequency. In contrast, the net volatility connectedness in all markets maintains a consistent direction in both time and frequency domains. These findings may reflect potential differences in the impact of short-term market sentiment and long-term supply-demand fundamentals on information transmission. This observation suggests a measure of synergistic influence in the manifestations of risk contagion across diverse temporal scopes. Further, the natural gas and coal markets primarily act as net transmitters in both time-frequency return and volatility connectedness. In contrast, the crude oil, electricity, and carbon markets mainly serve as net receivers. This implies that the natural gas and coal markets exhibit some predictability towards the movements of the crude oil, electricity, and carbon markets, as highlighted by Tan et al. (Tan et al., 2020). Fourth, during the COVID-19 pandemic, all markets' net return and volatility connectedness increased in time-frequency domains. Moreover, during this period, the carbon market acted as a net receiver regarding return connectedness, primarily receiving spillovers from the electricity, natural gas, and coal markets. Meanwhile, regarding volatility connectedness, the carbon market transformed into a net transmitter, mainly transmitting risk to the electricity market. This indicates that the COVID-19 pandemic profoundly affects information transmission and risk contagion between carbon and energy markets, highlighting the complexity of the dynamic interplay between carbon and electricity markets during the crisis period.
This paper enriches the research on the frequency-domain connectedness between carbon and energy markets (Ding et al., 2022). Comparing the information transmission and risk contagion between carbon and energy markets, this paper addresses the research gap in existing literature (Adekoya et al., 2021). Furthermore, the paper provides new insights into the relationship between carbon and energy markets during the COVID-19 pandemic. This enriches existing literature (Wang and Huang, 2021; Jiang and Chen, 2022b), contributing to a new and more comprehensive insight for investors and policymakers.
4.2 Policy implications
This paper offers the following recommendations. First, it is crucial to examine both return and volatility connectedness to analyze inter-market relationships between carbon and energy markets. It is essential to focus on high-frequency information transmission and medium- and low-frequency risk contagion. In particular, investors should concentrate on information releases within a week and implement risk prevention measures lasting more than a month to optimize their portfolio returns (Wan et al., 2024). Policymakers need to focus on the time-varying characteristics of the connectedness between carbon and energy markets, adopting a flexible policy framework. This ensures the effective achievement of sustainable carbon emission goals while stabilizing the price fluctuations in both the carbon and energy markets (Wang and Guo, 2018). Second, it is necessary to pay heightened attention to extreme events and their impacts, specifically in the context of risk contagion dynamics. Moreover, investors and policymakers should carefully consider the distinct impacts of different extreme events, enabling more effective strategy adjustments (He and Hamori, 2021). Third, it is essential to diligent monitoring of information transmission and risk contagion between carbon and energy markets, with a specific focus on the spillovers from the electricity and coal markets to the carbon market. Specifically, the carbon market is significantly influenced by the electricity and coal markets. Investors can leverage changes in electricity and coal prices to anticipate fluctuations in the carbon market, allowing for timely adjustments to their investment strategies. It is advisable to avoid including electricity and coal in diversified portfolio strategies within the carbon market to prevent the accumulation of risks. Energy-intensive enterprises should focus on comprehending the influence of electricity and coal markets on carbon prices to facilitate the selection of an optimal energy consumption structure (Gong et al., 2021). Policymakers' responsibility goes beyond monitoring the spillover effects of electricity and coal markets on the carbon market. Additionally, they should closely monitor the information and risk spillover from the natural gas market to the carbon market amid the COVID-19 pandemic. Thus, policymakers ought to prioritize attention to technological advancements within the electricity, coal, and natural gas markets to guide enterprises in adapting and managing carbon emissions. Furthermore, this paper offers valuable insights for formulating suitable carbon trading mechanisms in emerging markets like China, facilitating their rapid construction and enhancement of carbon markets for a more sustainable and low-carbon future.
4.3 Research limitations and future work
There are some limitations to this paper. First, it exclusively examines return and volatility connectedness, neglecting higher-order moments (skewness and kurtosis) connectedness. Skewness and kurtosis precisely capture market crash risk and fat-tail risk. Transmitting information and risk through the asymmetry of return distributions and fat tails can significantly impact portfolio strategies and asset pricing (He and Hamori, 2021). Second, asymmetric connectedness is not addressed in this paper. However, positive and negative shocks in the market often lead to different connectedness characteristics (Apergis et al., 2017). Therefore, future research could explore time-frequency higher-order moment connectedness between carbon and energy markets. Additionally, further investigations may delve into the separation of connectedness induced by positive/negative shocks and explore time-frequency asymmetric connectedness between carbon and energy markets.
Data availability statement
The original contributions presented in the study are included in the article/Supplementary material, further inquiries can be directed to the corresponding authors.
Author contributions
YW: Conceptualization, Formal Analysis, Methodology, Writing–original draft, Writing–review and editing. WR: Data curation, Formal Analysis, Software, Writing–original draft, Writing–review and editing. YX: Writing–original draft, Writing–review and editing. GC: Project administration, Writing–original draft, Writing–review and editing. PL: Conceptualization, Project administration, Writing–original draft. WZ: Writing–original draft.
Funding
The author(s) declare financial support was received for the research, authorship, and/or publication of this article. This research is supported by the National Social Science Fund of China under No. 21BJY192.
Acknowledgments
Thanks to the editors and all reviewers for the publication of this paper.
Conflict of interest
Author YX is employed by ABC Wealth Management Co., Ltd.
The remaining authors declare that the research was conducted in the absence of any commercial or financial relationships that could be construed as a potential conflict of interest.
Publisher’s note
All claims expressed in this article are solely those of the authors and do not necessarily represent those of their affiliated organizations, or those of the publisher, the editors and the reviewers. Any product that may be evaluated in this article, or claim that may be made by its manufacturer, is not guaranteed or endorsed by the publisher.
Footnotes
1For simplicity, the following text will use the DY model to replace the Diebold and Yilmaz time-domain spillover index model, and use the BK model to replace the Baruník and Křehlík frequency-domain spillover index model.
2http://www.tanpaifang.com/tanpaimai/201406/3034403.html.
References
Acharya, V. V., and Pedersen, L. H. (2005). Asset pricing with liquidity risk. J. Financ. Econ. 77, 375–410. doi:10.1016/j.jfineco.2004.06.007
Adekoya, O. B., Oliyide, J. A., and Noman, A. (2021). The volatility connectedness of the EU carbon market with commodity and financial markets in time- and frequency-domain: the role of the U.S. economic policy uncertainty. Resour. Policy 74, 102252. doi:10.1016/j.resourpol.2021.102252
Apergis, N., Baruník, J., and Lau, M. C. K. (2017). Good volatility, bad volatility: what drives the asymmetric connectedness of Australian electricity markets? Energy Econ. 66, 108–115. doi:10.1016/j.eneco.2017.06.010
Arabi, S. M. S., Alicata, J., Hanigan, D., and Hiibel, S. R. (2021). Capturing atmospheric carbon dioxide by depleting inorganic carbon in municipal wastewater. Int. J. Greenh. Gas. Control 111, 103472. doi:10.1016/j.ijggc.2021.103472
Asadi, M., Roubaud, D., and Tiwari, A. K. (2022). Volatility spillovers amid crude oil, natural gas, coal, stock, and currency markets in the US and China based on time and frequency domain connectedness. Energy Econ. 109, 105961. doi:10.1016/j.eneco.2022.105961
Attarzadeh, A., and Balcilar, M. (2022). On the dynamic return and volatility connectedness of cryptocurrency, crude oil, clean energy, and stock markets: a time-varying analysis. Environ. Sci. Pollut. Res. 29, 65185–65196. doi:10.1007/s11356-022-20115-2
Baruník, J., and Křehlík, T. (2018). Measuring the frequency dynamics of financial connectedness and systemic risk. J. Financ. Econom. 16, 271–296. doi:10.1093/jjfinec/nby001
Crossland, J., Li, B., and Roca, E. (2013). Is the European Union Emissions Trading Scheme (EU ETS) informationally efficient? Evidence from momentum-based trading strategies. Appl. Energy 109, 10–23. doi:10.1016/j.apenergy.2013.03.079
Dai, X., Xiao, L., Wang, Q., and Dhesi, G. (2021). Multiscale interplay of higher-order moments between the carbon and energy markets during Phase III of the EU ETS. Energy Policy 156, 112428. doi:10.1016/j.enpol.2021.112428
Dai, Z., and Zhu, H. (2022). Time-varying spillover effects and investment strategies between WTI crude oil, natural gas and Chinese stock markets related to belt and road initiative. Energy Econ. 108, 105883. doi:10.1016/j.eneco.2022.105883
Diebold, F. X., and Yilmaz, K. (2014). On the network topology of variance decompositions: measuring the connectedness of financial firms. J. Econom. 182, 119–134. doi:10.1016/j.jeconom.2014.04.012
Ding, Q., Huang, J., and Zhang, H. (2022). Time-frequency spillovers among carbon, fossil energy and clean energy markets: the effects of attention to climate change. Int. Rev. Financ. Anal. 83, 102222. doi:10.1016/j.irfa.2022.102222
Duan, K., Ren, X., Shi, Y., Mishra, T., and Yan, C. (2021). The marginal impacts of energy prices on carbon price variations: evidence from a quantile-on-quantile approach. Energy Econ. 95, 105131. doi:10.1016/j.eneco.2021.105131
Edziah, B. K., Sun, H., Adom, P. K., Wang, F., and Agyemang, A. O. (2022). The role of exogenous technological factors and renewable energy in carbon dioxide emission reduction in Sub-Saharan Africa. Renew. Energy 196, 1418–1428. doi:10.1016/j.renene.2022.06.130
Fang, S., Lu, X., Li, J., and Qu, L. (2018). Multifractal detrended cross-correlation analysis of carbon emission allowance and stock returns. Phys. A Stat. Mech. its Appl. 509, 551–566. doi:10.1016/j.physa.2018.05.136
Giorgio, C. (2014). How competitive are EU electricity markets? An assessment of ETS Phase II. Energy Policy 73, 278–297. doi:10.1016/j.enpol.2014.06.015
Gong, X., Shi, R., Xu, J., and Lin, B. (2021). Analyzing spillover effects between carbon and fossil energy markets from a time-varying perspective. Appl. Energy 285, 116384. doi:10.1016/j.apenergy.2020.116384
Gyamerah, S. A., Owusu, B. E., and Akwaa-Sekyi, E. K. (2022). Modelling the mean and volatility spillover between green bond market and renewable energy stock market. Green Financ. 4, 310–328. doi:10.3934/GF.2022015
Hanif, W., Arreola Hernandez, J., Mensi, W., Kang, S. H., Uddin, G. S., and Yoon, S. (2021). Nonlinear dependence and connectedness between clean/renewable energy sector equity and European emission allowance prices. Energy Econ. 101, 105409. doi:10.1016/j.eneco.2021.105409
He, X., and Hamori, S. (2021). Is volatility spillover enough for investor decisions? A new viewpoint from higher moments. J. Int. Money Finan. 116, 102412. doi:10.1016/j.jimonfin.2021.102412
Hoque, M. E., Soo-Wah, L., and Billah, M. (2023). Time-frequency connectedness and spillover among carbon, climate, and energy futures: determinants and portfolio risk management implications. Energy Econ. 127, 107034. doi:10.1016/j.eneco.2023.107034
Ji, Q., Zhang, D., and Geng, J. (2018). Information linkage, dynamic spillovers in prices and volatility between the carbon and energy markets. J. Clean. Prod. 198, 972–978. doi:10.1016/j.jclepro.2018.07.126
Jiang, W., and Chen, Y. (2022a). The time-frequency connectedness among carbon, traditional/new energy and material markets of China in pre- and post-COVID-19 outbreak periods. Energy 246, 123320. doi:10.1016/j.energy.2022.123320
Jiang, W., and Chen, Y. (2022b). The time-frequency connectedness among metal, energy and carbon markets pre and during COVID-19 outbreak. Resour. Policy 77, 102763. doi:10.1016/j.resourpol.2022.102763
Keppler, J. H., and Mansanet-Bataller, M. (2010). Causalities between CO2, electricity, and other energy variables during phase I and phase II of the EU ETS. Energy Policy 38, 3329–3341. doi:10.1016/j.enpol.2010.02.004
Li, J., Liu, R., Yao, Y., and Xie, Q. (2022). Time-frequency volatility spillovers across the international crude oil market and Chinese major energy futures markets: evidence from COVID-19. Resour. Policy 77, 102646. doi:10.1016/j.resourpol.2022.102646
Liu, X., Wojewodzki, M., Cai, Y., and Sharma, S. (2023a). The dynamic relationships between carbon prices and policy uncertainties. Technol. Forecast. Soc. Chang. 188, 122325. doi:10.1016/j.techfore.2023.122325
Liu, Y., Sun, H., Meng, B., Jin, S., and Chen, B. (2023b). How to purchase carbon emission right optimally for energy-consuming enterprises? Analysis based on optimal stopping model. Energy Econ. 124, 106758. doi:10.1016/j.eneco.2023.106758
Lovcha, Y., Perez-Laborda, A., and Sikora, I. (2022). The determinants of CO2 prices in the EU emission trading system. Appl. Energy 305, 117903. doi:10.1016/j.apenergy.2021.117903
Lu, X., Huang, N., Mo, J., and Ye, Z. (2023). Dynamics of the return and volatility connectedness among green finance markets during the COVID-19 pandemic. Energy Econ. 125, 106860. doi:10.1016/j.eneco.2023.106860
Mensi, W., Hammoudeh, S., Vinh Vo, X., and Hoon Kang, S. (2021). Volatility spillovers between oil and equity markets and portfolio risk implications in the US and vulnerable EU countries. J. Int. Financial Mark. Institutions Money 75, 101457. doi:10.1016/j.intfin.2021.101457
Naeem, M. A., Peng, Z., Suleman, M. T., Nepal, R., and Shahzad, S. J. H. (2020). Time and frequency connectedness among oil shocks, electricity and clean energy markets. Energy Econ. 91, 104914. doi:10.1016/j.eneco.2020.104914
Ortas, E., and Álvarez, I. (2016). The efficacy of the European Union Emissions Trading Scheme: depicting the co-movement of carbon assets and energy commodities through wavelet decomposition. J. Clean. Prod. 116, 40–49. doi:10.1016/j.jclepro.2015.12.112
Pal, D., and Mitra, S. K. (2020). Time-frequency dynamics of return spillover from crude oil to agricultural commodities. Appl. Econ. 52, 5426–5445. doi:10.1080/00036846.2020.1764482
Sadorsky, P. (2001). Risk factors in stock returns of Canadian oil and gas companies. Energy Econ. 23, 17–28. doi:10.1016/S0140-9883(00)00072-4
Sousa, R., Aguiar-Conraria, L., and Soares, M. J. (2014). Carbon financial markets: a time–frequency analysis of CO2 prices. Phys. A Stat. Mech. its Appl. 414, 118–127. doi:10.1016/j.physa.2014.06.058
Su, C., Pang, L., Qin, M., Lobonţ, O., and Umar, M. (2023). The spillover effects among fossil fuel, renewables and carbon markets: evidence under the dual dilemma of climate change and energy crises. Energy 274, 127304. doi:10.1016/j.energy.2023.127304
Sun, H., Chen, T., and Wang, C. N. (2023). Spatial impact of digital finance on carbon productivity. Geosci. Front., 101674. doi:10.1016/j.gsf.2023.101674
Tan, X., Sirichand, K., Vivian, A., and Wang, X. (2020). How connected is the carbon market to energy and financial markets? A systematic analysis of spillovers and dynamics. Energy Econ. 90, 104870. doi:10.1016/j.eneco.2020.104870
Tan, X., and Wang, X. (2017). Dependence changes between the carbon price and its fundamentals: a quantile regression approach. Appl. Energy 190, 306–325. doi:10.1016/j.apenergy.2016.12.116
Tan, X., Wang, Y., Gu, B., Kong, L., and Zeng, A. (2022). Research on the national climate governance system toward carbon neutrality—a critical literature review. Fundam. Res. 2, 384–391. doi:10.1016/j.fmre.2022.03.010
Toyoshima, Y., and Hamori, S. (2018). Data from: measuring the time-frequency dynamics of return and volatility connectedness in global crude oil markets.
Umar, Z., Alwahedi, W., Zaremba, A., and Vo, X. V. (2022). Return and volatility connectedness of the non-fungible tokens segments. J. Behav. Exp. Financ. 35, 100692. doi:10.1016/j.jbef.2022.100692
Vellachami, S., Hasanov, A. S., and Brooks, R. (2023). Risk transmission from the energy markets to the carbon market: evidence from the recursive window approach. Int. Rev. Financ. Anal. 89, 102715. doi:10.1016/j.irfa.2023.102715
Wan, J., Yin, L., and Wu, Y. (2024). Return and volatility connectedness across global ESG stock indexes: evidence from the time-frequency domain analysis. Int. Rev. Econ. Financ. 89, 397–428. doi:10.1016/j.iref.2023.10.038
Wang, Q., and Huang, R. (2021). The impact of COVID-19 pandemic on sustainable development goals – a survey. Environ. Res. 202, 111637. doi:10.1016/j.envres.2021.111637
Wang, Q., Li, S., Zhang, M., and Li, R. (2022b). Impact of COVID-19 pandemic on oil consumption in the United States: a new estimation approach. Energy 239, 122280. doi:10.1016/j.energy.2021.122280
Wang, Q., and Su, M. (2020). A preliminary assessment of the impact of COVID-19 on environment – a case study of China. Sci. Total Environ. 728, 138915. doi:10.1016/j.scitotenv.2020.138915
Wang, Q., Yang, X., and Li, R. (2022a). The impact of the COVID-19 pandemic on the energy market – a comparative relationship between oil and coal. Energy Strateg. Rev. 39, 100761. doi:10.1016/j.esr.2021.100761
Wang, Q., and Zhang, F. (2021). What does the China’s economic recovery after COVID-19 pandemic mean for the economic growth and energy consumption of other countries? J. Clean. Prod. 295, 126265. doi:10.1016/j.jclepro.2021.126265
Wang, X. (2020). Frequency dynamics of volatility spillovers among crude oil and international stock markets: the role of the interest rate. Energy Econ. 91, 104900. doi:10.1016/j.eneco.2020.104900
Wang, Y., and Guo, Z. (2018). The dynamic spillover between carbon and energy markets: new evidence. Energy 149, 24–33. doi:10.1016/j.energy.2018.01.145
Wei, Y., Chen, K., Kang, J., Chen, W., Wang, X., and Zhang, X. (2022a). Policy and management of carbon peaking and carbon neutrality: a literature review. Engineering 14, 52–63. doi:10.1016/j.eng.2021.12.018
Wei, Y., Zhang, Y., and Wang, Y. (2022b). Information connectedness of international crude oil futures: evidence from SC, WTI, and Brent. Int. Rev. Financ. Anal. 81, 102100. doi:10.1016/j.irfa.2022.102100
Wu, Y., Ren, W., Wan, J., and Liu, X. (2023). Time-frequency volatility connectedness between fossil energy and agricultural commodities: comparing the COVID-19 pandemic with the Russia-Ukraine conflict. Financ. Res. Lett. 55, 103866. doi:10.1016/j.frl.2023.103866
Yang, J., Li, Z., and Miao, H. (2021). Volatility spillovers in commodity futures markets: a network approach. J. Futur. Mark. 41, 1959–1987. doi:10.1002/fut.22270
Yu, L., Li, J., Tang, L., and Wang, S. (2015). Linear and nonlinear Granger causality investigation between carbon market and crude oil market: a multi-scale approach. Energy Econ. 51, 300–311. doi:10.1016/j.eneco.2015.07.005
Zhang, H., Chen, J., and Shao, L. (2021). Dynamic spillovers between energy and stock markets and their implications in the context of COVID-19. Int. Rev. Financ. Anal. 77, 101828. doi:10.1016/j.irfa.2021.101828
Zhang, Y., Qi, L., Lin, X., Pan, H., and Sharp, B. (2022). Synergistic effect of carbon ETS and carbon tax under China's peak emission target: a dynamic CGE analysis. Sci. Total Environ. 825, 154076. doi:10.1016/j.scitotenv.2022.154076
Zhang, Y., and Sun, Y. (2016). The dynamic volatility spillover between European carbon trading market and fossil energy market. J. Clean. Prod. 112, 2654–2663. doi:10.1016/j.jclepro.2015.09.118
Zhao, Y., Zhou, Z., Zhang, K., Huo, Y., Sun, D., Zhao, H., et al. (2023). Research on spillover effect between carbon market and electricity market: evidence from Northern Europe. Energy 263, 126107. doi:10.1016/j.energy.2022.126107
Zheng, Z., Qiao, Z., Takaishi, T., Stanley, H. E., and Li, B. (2014). Realized volatility and absolute return volatility: a comparison indicating market risk. PLoS One 9, e102940. doi:10.1371/journal.pone.0102940
Zhou, Y., Wu, S., and Zhang, Z. (2022). Multidimensional risk spillovers among carbon, energy and nonferrous metals markets: evidence from the quantile VAR network. Energy Econ. 114, 106319. doi:10.1016/j.eneco.2022.106319
Zhu, H., Huang, X., Ye, F., and Li, S. (2023a). Frequency spillover effects and cross-quantile dependence between crude oil and stock markets: evidence from BRICS and G7 countries. North Am. J. Econ. Finance 70, 102062. doi:10.1016/j.najef.2023.102062
Keywords: carbon market, energy markets, connectedness, frequency-domain, COVID-19
Citation: Wu Y, Ren W, Xiong Y, Cao G, Liang P and Zeng W (2024) Return and volatility connectedness among carbon and energy markets based on time- and frequency-domain approaches. Front. Environ. Sci. 11:1315893. doi: 10.3389/fenvs.2023.1315893
Received: 10 October 2023; Accepted: 31 December 2023;
Published: 12 January 2024.
Edited by:
Pengxiang Zhai, Beihang University, ChinaCopyright © 2024 Wu, Ren, Xiong, Cao, Liang and Zeng. This is an open-access article distributed under the terms of the Creative Commons Attribution License (CC BY). The use, distribution or reproduction in other forums is permitted, provided the original author(s) and the copyright owner(s) are credited and that the original publication in this journal is cited, in accordance with accepted academic practice. No use, distribution or reproduction is permitted which does not comply with these terms.
*Correspondence: Gang Cao, ZXRjYW9nYW5nQDE2My5jb20=; Peng Liang, bGlhbmdwZW5nQHRoLmJ0YnUuZWR1LmNu