 Min Zhang
 Jianhua Ping2,3*
94% of researchers rate our articles as excellent or good
Learn more about the work of our research integrity team to safeguard the quality of each article we publish.
Find out more
ORIGINAL RESEARCH article
Front. Environ. Sci. , 07 December 2023
Sec. Freshwater Science
Volume 11 - 2023 | https://doi.org/10.3389/fenvs.2023.1310181
This article is part of the Research Topic Vegetation-soil-hydrology Interactions and Ecohydrological Processes View all 14 articles
Precipitation infiltrates into the soil or river and then percolates downward through the deeper mineral soil to the groundwater. Understanding the interactions between surface water and groundwater in the river ecosystem is crucial for supporting decision-making in eco-construction and the efficient use of water resources. In our study, the secondary perched reach of the lower Yellow River was taken as the research area. The trend analysis and correlation relationship were evaluated using the M–K significance test and gray correlation; furthermore, the groundwater recharge was quantified by Darcy‘s law and the water balance method based on 50 years of hydrological data. The results showed that 1) from 1972 to 2020, the runoff and water level of the Huayuankou hydrological station and the Jiahetan hydrological station showed a significant downward trend. 2) The calculation of the gray correlation degree method shows that the groundwater level is mainly affected by the Yellow River. The river water and groundwater levels show a significant downward trend using the M–K significance test. 3) The unit width recharge values of the secondary perched river to the groundwater in the dry year were calculated to be 566.79 and 374.13 m3/m·d, using Darcy‘s law and the water balance method, respectively, indicating that the results of the two methods are basically the same. Our findings highlight the storage capacity of groundwater and can provide support for regulation and sustainable management of water resources in the ecosystem.
As the second longest river in China, the Yellow River is known as the “mother river” of China because of its contribution to Chinese civilization. It is an important water supply source in arid and semi-arid areas of Northwest and North China (Yang et al., 2004). The Yellow River is crucial to the survival of the local residents and for sustainable economic development (Zhang et al., 2009; Xu et al., 2022). Since 1986, due to climate change and the intensification of human activities, especially due to the increase of agricultural irrigation along the Yellow River (Zhang et al., 2014), the runoff in the lower reaches of the Yellow River has decreased significantly, which has greatly affected the production, life, and ecological environment of the people along the riverbank.
In recent years, scholars have carried out a series of studies on the river runoff, water level, infiltration, sediment, topography, river morphology, and groundwater in the typical secondary perched reach of the lower Yellow River. Using meteorological data, combined with irrigation data, the long-term changes in the runoff of the Yellow River were studied in order to find out the causes of the Yellow River cutoff (Yang et al., 2004). The sustainability of the Yellow River water resources was analyzed by using the system dynamics method (Xu et al., 2002). The in situ measurement of the hydraulic conductivity of riverbed sediments was carried out by using the groundwater dynamics method, and the leakage of groundwater recharged by river water in the lower reaches of the Yellow River was calculated. Based on the principles of hydrogeology and environmental isotopes, the interaction between Yellow River water and groundwater in the secondary perched reach and its hydrochemical evolution law were studied (Acero et al., 2015; Li et al., 2022; Li et al., 2014; Wang et al., 2021). At the same time, the risk assessment and regulation of groundwater development in the secondary perched reach of the lower Yellow River were studied (Yan et al., 2023). The three-dimensional numerical simulation model was used to study the relationship between the secondary perched reach of the Yellow River (Henan section) and the regional groundwater recharge and discharge, and the average annual recharge resources of groundwater and the evaluation of exploitable resources were determined (Gu et al., 2013; Fu et al., 2020; Li et al., 2022).
In summary, most of the current studies focus on the evolution of the water–sediment relationship and analysis of water chemical characteristics of the Yellow River Basin, and the qualitative analysis of the Yellow River and the groundwater along the river. However, the quantitative research on the long-time series of the Yellow River water and the groundwater needs further study. Therefore, the recharge relationship between the secondary perched reach of the Yellow River and the groundwater is an urgent problem to be solved at present. This study mainly focuses on these problems for in-depth research and discussion.
The lower reaches of the Yellow River have formed the world-famous “The secondary perched reach of the Yellow River” due to its large amount of sediment deposition, and the Huayuankou–Jiahetan section is the most typical section of the Yellow River (Figure 1).
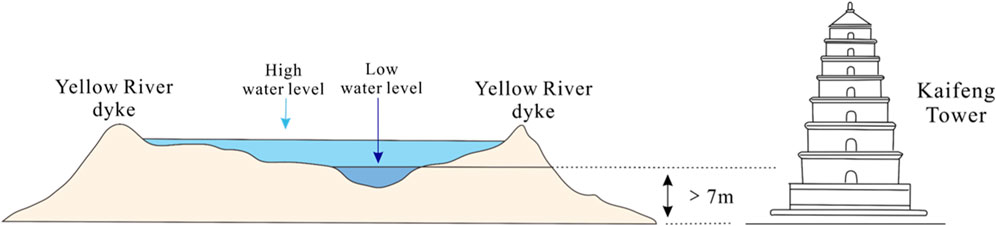
FIGURE 1. Schematic drawing of the secondary perched reach of the Yellow River.
This research paper takes the secondary perched reach river of the Huayuankou–Jiahetan section of the Yellow River as the study area and studies the evolution characteristics of the secondary perched reach river water and groundwater dynamic field of the Yellow River in the past 50 years. The latitude and longitude of the study area are between 113°35′17″–114°48′29″N and 34°26′11″– 35°13′42″E, respectively. The length of the secondary perched reach river is 105 km, which is the largest area of groundwater recharge in the lower Yellow River (Figure 2).
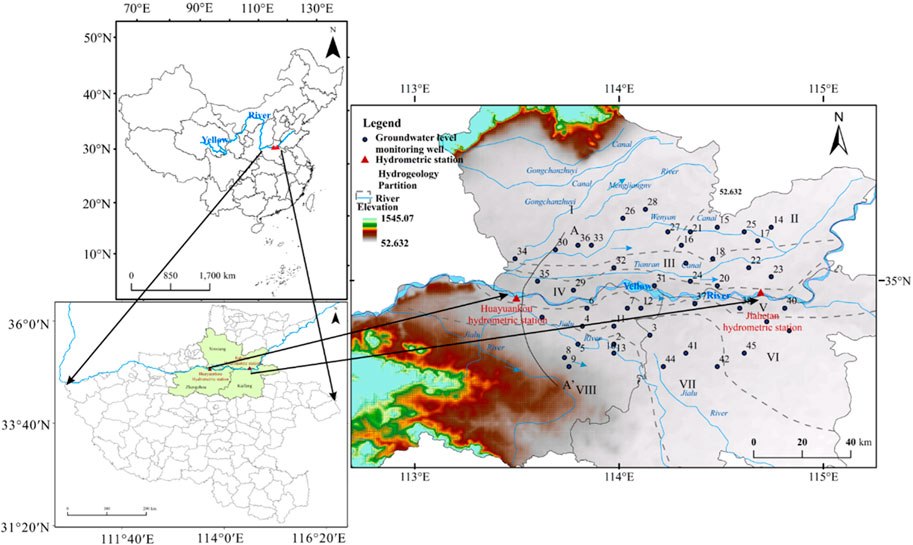
FIGURE 2. Geographical location of the Huayuankou–Jiahetan study area.
The study area belongs to the alluvial plain in the lower reaches of the Yellow River. The terrain is flat, and the river runoff rate is slow. Moreover, 25% of the sediment carried by the river runoff is deposited here leading to the Yellow River riverbed being 3–10 m higher than the plain ground outside the river embankment. The highest riverbed is located in Liuyuankou, 8 km north of Kaifeng City, which is 7–8 m higher than the ground of Kaifeng City. The width of the river is 1,000 m, and the embankment is approximately 15 m high. The bottom of the riverbed is the fine sand and medium coarse sand layer of the Yellow River alluvial and is directly connected with the shallow aquifer group of the beach. The water level of the Yellow River (82–92 m (Huayuankou) and 71–75 m (Jiahetan)) is higher than the groundwater level on both sides (82–76 m; 92–77 m). It can be seen that the water level difference between them is 6–15 m, and the secondary perched reach river has become an important source of recharge for shallow groundwater along the riverbank. The aquifer has become the main mining layer supplying water for cities, industry, and agriculture along the Yellow River.
The study area belongs to the groundwater system of the alluvial plain in the lower reaches of the Yellow River. The landform belongs to the alluvial plain of the Yellow River. The groundwater mainly occurs in the Quaternary loose rock, with a total thickness of more than 300 m. The aquifers composed of Holocene (Q4) and Late Pleistocene (Q3) strata can be classified as shallow aquifer groups. The lithology is mostly sand, fine sand, and clay interbedded, and the bottom depth varies from 60 to 120 m. The deep aquifer group is composed of various types of sand layers and gravel layers in the early Pleistocene (Q1) and middle Pleistocene (Q2). The aquifer is up to 6–7 layers, forming a multi-structural micro-confined aquifer, with hydraulic connections in local areas. Between the shallow and deep aquifer groups, there is a weak permeable layer composed of a layer of more stable clay with a thickness of 20–30 m. The weak permeable layer makes the hydraulic connection between shallow and deep groundwater weak. According to the hydrogeological conditions of the study area, the study area is divided into eight hydrogeological zones. The study area is mainly to study the relationship between the secondary perched reach river and shallow groundwater (Figure 3).
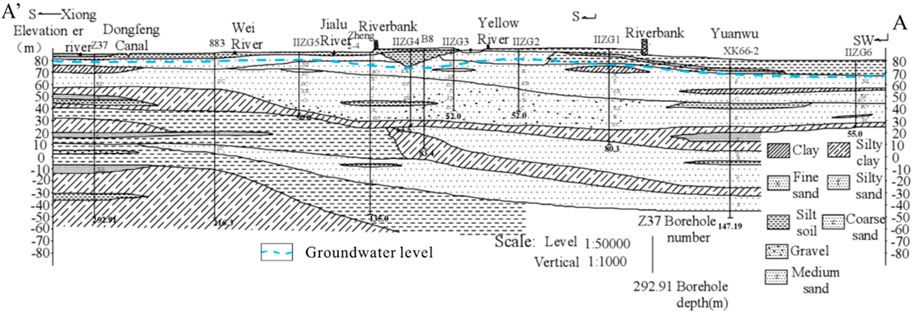
FIGURE 3. Hydrogeological profile of the study area.
The water level and discharge data on the Huayuankou and Jiahetan hydrological stations in the lower reaches of the Yellow River from 1972 to 2020 were provided by the Yellow River website (http://www.yrcc.gov.cn/). The groundwater level data on groundwater monitoring wells in the study area from 1972 to 2020 are from the compilation of “Groundwater Data of Henan Province” by the Henan Provincial Hydrology and Water Resources Bureau (Table 1).

TABLE 1. Typical monitoring well water level elevation (m).
The frequency analysis method in hydrological statistics was used to determine the wet years, normal years, and dry years of the secondary perched reach river of the Yellow River. When judging the significance of the secondary perched reach river and groundwater, the Pearson correlation coefficient was used for significance statistics.
In the series analysis of discharge and water level data, the Mann–Kendall trend test method was selected. The Mann–Kendall method is not affected by outliers and is more suitable for trend analysis of time series with outliers (Yue et al., 2002). The M–K non-linear statistical method can perform non-linear detection on time series variables. It has a powerful detection function and can eliminate the influence of non-linear changes in variables. It has been widely used in hydrological series trend and mutation analysis; compared with other methods, the M–K non-linear statistical method is more accurate in precipitation trend and mutation analysis (Cheng et al., 2019).
This method assumes that the time data sequence
In the formula, sgn is the sign function, n is the number of data in the sequence, q is the number of knots (repeated datasets) in the sequence, tp is the width of the knot (the number of repeated data in the repeated dataset of group p), and ZMK is the test statistic. The ZMK statistic conforms to the normal distribution. At a given confidence level α, if it is the absolute value of Z, it means that the null hypothesis (no trend) is rejected. When the ZMK statistic is greater than 1.65, 1.96, and 2.32, then the confidence level is 90%, 95%, and 99%, respectively, of the significance test, meaning that it becomes more significant the greater the trend.
When analyzing the influencing factors of the groundwater level change along the river, the gray correlation method was used. Gray correlation analysis is a method of multi-factor statistical analysis (Deng et al., 1989). This paper calculated the correlation degree between the five influencing factors and the groundwater level of observation wells in the study area in order to determine the key factors affecting the change of groundwater level along the river. The five influencing factors are the river water level, runoff, precipitation, evaporation, and groundwater exploitation.
Gray correlation analysis calculation: first, select the reference sequence X0 and the comparison sequence Xi. Second, perform dimensionless processing of the original data:
In Eq. 5, Xi (t) is the ith indicator dimensionless value in year t, xi (t) is the original data on the ith indicator in year t, and Xi (1) is the ith indicator data in year 1. Third, calculate the absolute difference, the minimum difference, and the maximum difference between the reference sequence X0 and the comparison sequence Xi:
In Eq. 6,
Fourth, find the gray correlation coefficient:
In Equation 7,
Fifth, calculate the correlation degree. The correlation
Darcy‘s law is the theoretical basis of groundwater seepage calculation (Vincent et al., 2014). The formula for calculating the single-width infiltration volume of groundwater recharged by the infiltration of the secondary perched reach river is as follows:
In the formula, q is the unit width exchange capacity of groundwater and surface water, m3/(d·m), K is the comprehensive permeability coefficient of the riverbed sediment and aquifer, m/d; h is the average thickness of the phreatic aquifer, m; J is the hydraulic gradient between surface water and groundwater, dimensionless; ΔH is the water level difference between surface water and groundwater, m; and L is the distance between the river and the groundwater monitoring well, m.
When the water level of the studied river (canal) section is higher than the groundwater level on both sides of the river, the recharge effect of the leakage of river (canal) water on the underground aquifer can be obtained by this method. The following formula is used to calculate the infiltration recharge amount of the river using the water balance method:
In the formula,
The discharge of the Huayuankou and Jiahetan hydrological stations showed a downward trend in the past 50 years, and the trend was significant (Figure 4A). The M–K statistical values of the discharge at the Huayuankou and Jiahetan hydrological stations are −2.656 and −2.433, respectively. They passed the significance test with an M–K confidence of 95% (Table 2).
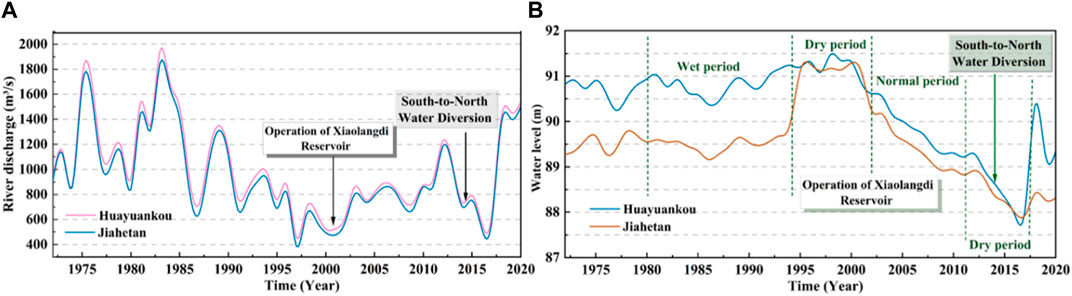
FIGURE 4. Years of discharge and water level changes at the Huayuankou and Jiahetan hydrological stations. (A) River discharge changes and (B) water-level changes.
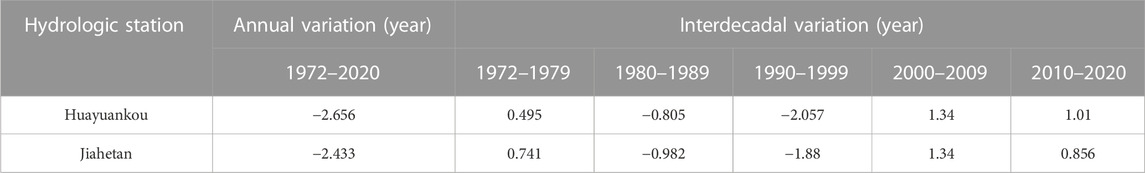
TABLE 2. M–K trend analysis ZMK statistical value of the river runoff from 1972 to 2020.
From 1974 to 1976, the discharge showed an increasing trend. During this period, the increase in discharge of the Huayuankou hydrological station was 93.14%, and the increase in that of the Jiahetan hydrological station was 83.82%. These increases were due to the “75·8 Flood” in Henan in 1975, which led to a significant increase in the discharge. From 1976 to 2001, the increase and decrease of river discharge fluctuated greatly. In the 25 years from 1972 to 1996, there were 19 years of river stem cutoff, with an average of three times in 4 years. From 2002 to 2020, the overall discharge showed a significant upward trend, and the change tended to be stable. The Xiaolangdi Reservoir officially operated water and sediment regulation so that the discharge of the Yellow River channel tended to be stable.
The annual water level data on hydrological stations from 1972 to 2020 were statistically analyzed, and the M–K trend change analysis and mutation characteristics were analyzed (Table 3). The water level of the Huayuankou and Jiahetan hydrological stations showed a significant downward trend in the past 50 years (Figure 4B). The M–K statistical values of the water level of the Huayuankou and Jiahetan hydrological stations are −4.065 and −2.879, respectively. They passed the significance test of the M–K confidence level of 95%.
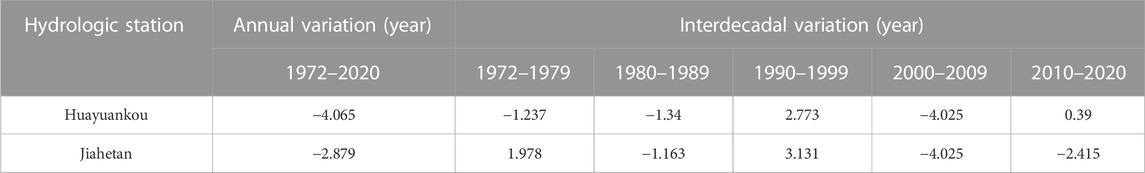
TABLE 3. ZMK statistical value of the river water level from 1972 to 2020.
From 1972 to 1989, the water level of the Yellow River at the Huayuankou hydrological station had a certain downward trend. From 1990 to 1999, the water level showed an upward trend, and it was significant. The water level showed a significant downward trend from 2000 to 2020 (Table 3).
For nearly 50 years from 1972 to 2020, the groundwater level in the lower reaches of the Yellow River formed a flow field with the Yellow River as the watershed, which gradually decreased to the north and south, and the groundwater level gradually decreased from the west to the east along the Yellow River. The groundwater level of the monitoring wells along the secondary perched reach river was mostly in the range of −10 ∼ 0 m, and the groundwater levels of only a few monitoring wells were in the range of −5 ∼ 0 m. The groundwater level of wells far away from the riverbank gradually dropped, by up to −20∼−10 m. With the increase in distance, the recharge of the Yellow River to groundwater gradually weakened and the groundwater level decreased greatly (Figure 5). Affected by the riverside water source, the groundwater level in some areas dropped deeper. For example, the shallow groundwater level in the water source area of Zhengzhou City on the south bank of the secondary perched reach river was 15 m deep, and its total funnel area was 358 km2. The shallow groundwater level was 8 m deep in the riverside water source area of Yuanyang County on the north bank of the secondary perched reach river. The shallow groundwater depth in Kaifeng City, located on the south bank of the secondary perched reach river, was 10 m.
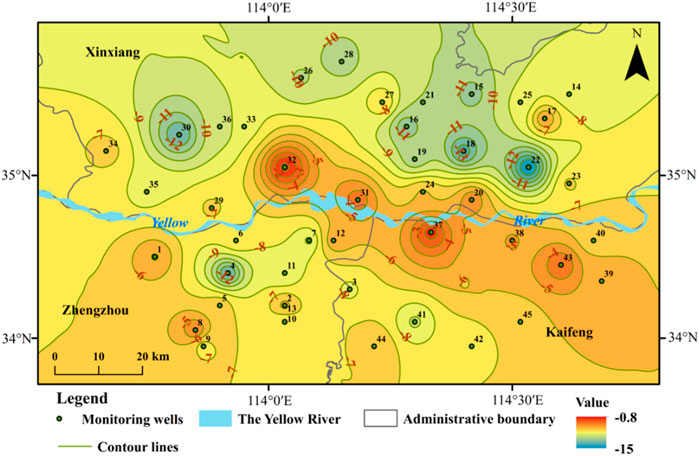
FIGURE 5. Spatial distribution of the groundwater level change.
On both sides of the Yellow River, eight monitoring wells with a uniform distance and close to the river were selected as typical monitoring wells. Based on the annual groundwater level data on typical monitoring wells (# 35, # 29, # 31, # 20, # 6, # 12, # 37, and # 38) along the secondary perched reach river in 1972–2020, the trend of M–K change was analyzed. This information can be seen in Table 3. The ZMK values of the M–K trend test results of each typical monitoring well were negative, indicating that the groundwater level of each monitoring well showed a downward trend, and it was significant (Table 4).
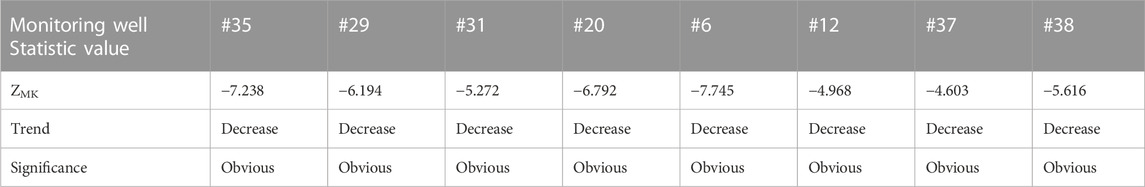
TABLE 4. ZMK statistical value of the groundwater level in typical monitoring wells from 1972 to 2020.
The groundwater levels of typical monitoring wells along the riverbank from 1972 to 2020 were statistically analyzed. The monitoring wells #35, #29, and #20 tended to be stable before 2010 and showed a significant downward trend after 2010. The changing trend in the water level of the #31 monitoring well was not obvious. The changes in wells #6, #12, and #38 tended to be stable before 2010 and showed a significant downward trend after 2010. The changing trend of the water level of the #37 monitoring well was not obvious (Figure 6).
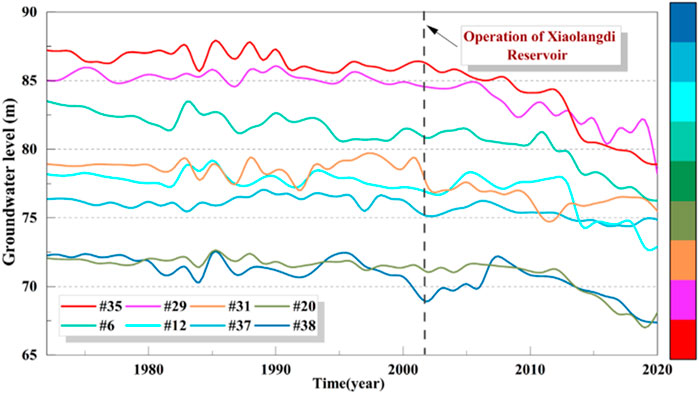
FIGURE 6. Groundwater level changes year by year of a typical monitoring well.
According to the recharge, runoff, and excretion characteristics of the groundwater flow field in the study area, the groundwater level of the observation well was taken as the reference sequence. The river discharge, river level, precipitation, evaporation, and groundwater exploitation were taken as the comparison sequence. The gray correlation degree between each factor and the groundwater level was calculated (Figure 7). Based on the correlation degree of each influencing factor, each observation well was divided into five categories, namely, affected by the secondary perched reach river discharge, water level, precipitation, evaporation, and groundwater exploitation. The groundwater level of the monitoring well was greatly affected by the water level and discharge of the secondary perched reach river (the influence factor was greater than 0.65).
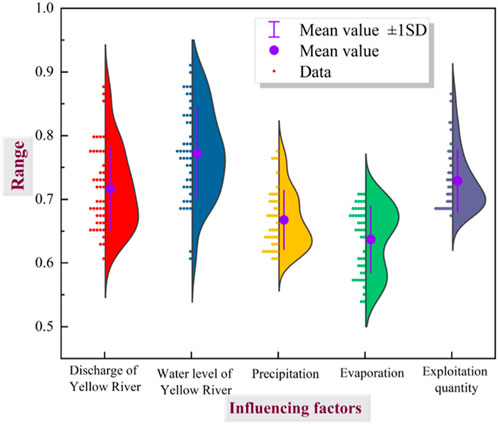
FIGURE 7. Statistics of influencing factors of the groundwater level.
The linear correlation significance test was carried out on the Yellow River water runoff and the groundwater level at the Huayuankou and Jiahetan hydrological stations. When the significance test coefficient p < 0.05, it indicated that the significance test of 0.05 was passed. Most of the Yellow River water runoff and groundwater level at the Huayuankou and Jiahetan hydrological stations passed the 0.05 significance test, indicating that the Yellow River water runoff was significantly correlated with the groundwater level along the riverbank (Table 5).
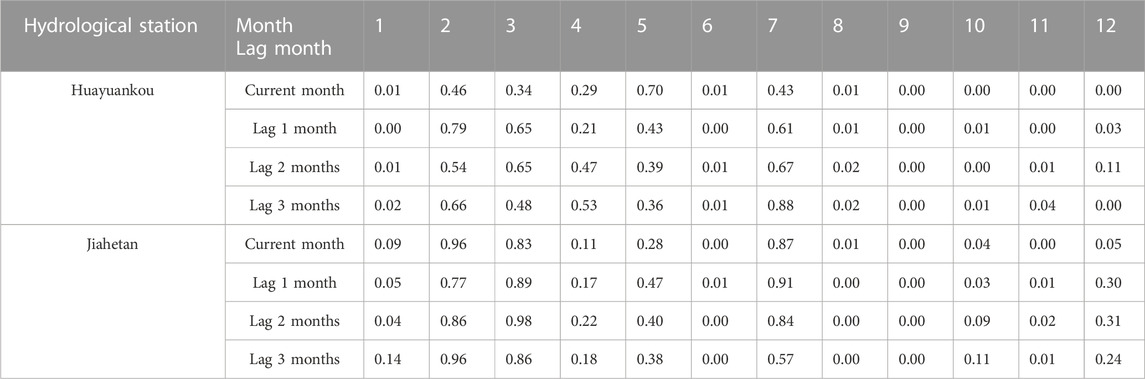
TABLE 5. Significant test of the Yellow River water discharge and groundwater level at the two hydrological stations.
Pearson’s correlation coefficient (Pearson), commonly used to determine the linear correlation, was used to measure the correlation between two variables. Through the long sequence of the groundwater and river levels, the Pearson correlation coefficient between them could be calculated, and the correlation between them could be quantitatively analyzed. The correlation coefficient had the following relationship: |r| <0.3, weak correlation; 0.3<|r|< 0.5, low correlation; 0.5<|r|<0.8, significant correlation; and 0.8<|r|<1, highly correlated.
The secondary perched reach river has a lag in the recharge of groundwater along the river. The river water discharge groundwater was divided into the current month, 1-month lag, 2-month lag, and 3-month lag. The correlation and lag between the river runoff and groundwater level are discussed.
The results of correlation and hysteresis between the river runoff and groundwater at the Huayuankou hydrological station indicated that the river runoff has a lag effect on the recharge of groundwater. Because the runoff in January, September, October, November, and December is significantly correlated with groundwater lagging in 1, 2, and 3 months (Table 7).
The correlation and lag between the river runoff and groundwater in the Jiahetan hydrological station were calculated. The results showed that the runoff in June and August is significantly correlated with groundwater lagging for 1, 2, and 3 months (Table 6), indicating that the river runoff has a lag effect on the recharge of groundwater.
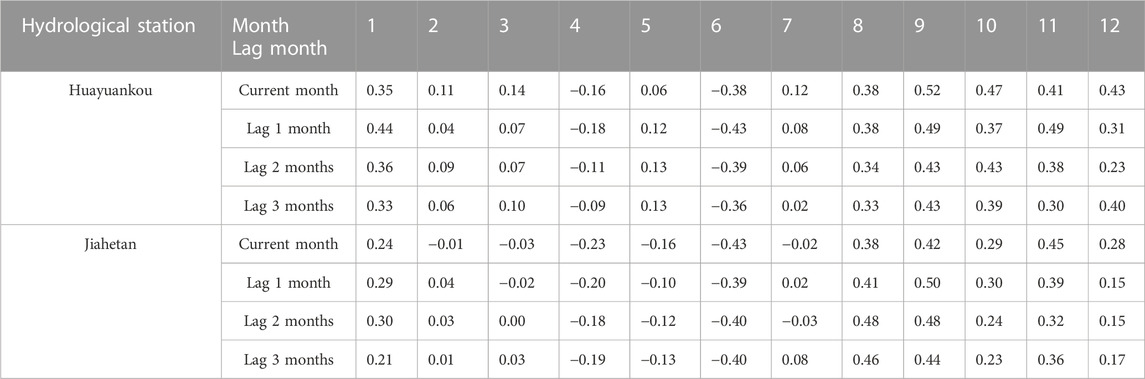
TABLE 6. Yellow River discharge and groundwater level lag at the two hydrological stations.
The significant test of the river water and groundwater levels at the Huayuankou and Jiahetan hydrological stations showed that most of the river water level and groundwater at the two hydrological stations passed the 0.05 significant test, indicating that the river water level is related to the groundwater level (Table 7).
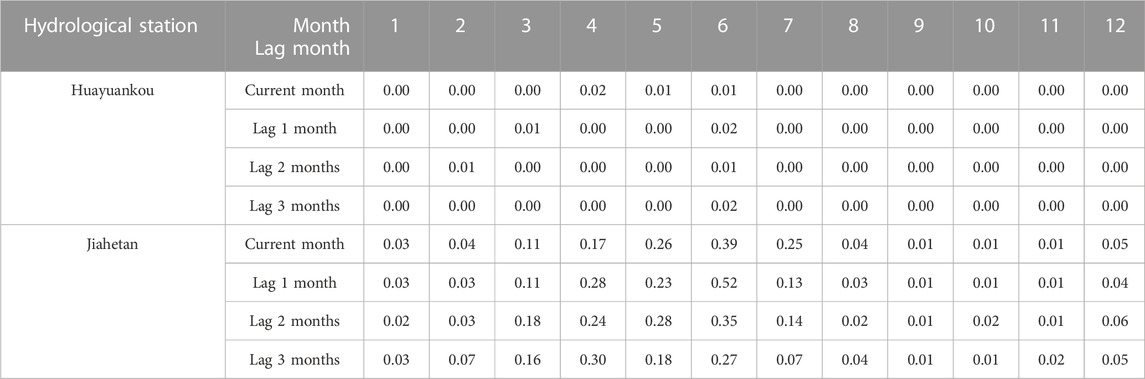
TABLE 7. Significant test of the Yellow River water and groundwater levels at the two hydrological stations.
The river water level at the Huayuankou hydrological station is significantly correlated with the groundwater level at the lag of 1, 2, and 3 months, indicating that the river water level has a lag in the replenishment of the groundwater level (Table 8).
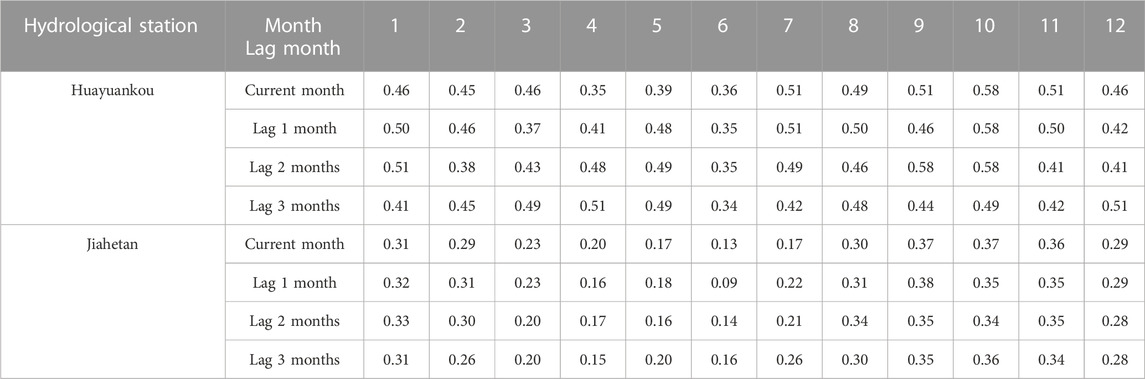
TABLE 8. River water level and the groundwater level lag of the two hydrological stations.
The calculation results of the correlation and hysteresis between the river water level and groundwater at the Jiahetan hydrological station showed that the lag of the river water level to the discharge of groundwater is not strong.
The correlation between the discharge and water level of the Yellow River at the Huayuankou hydrological station and the water level of the groundwater observation well is higher than that of the Yellow River at the Jiahetan hydrological station. The discharge and water level of the Yellow River at the Huayuankou hydrological station has a greater impact on the water level of the groundwater observation well in the secondary perched reach of the lower Yellow River.
The wet year, normal year, and dry year were divided by the guarantee rate. The discharge series generally obeys the probability distribution of P_III (Pearson type III). The frequency analysis method was used to determine the statistical parameters and the design values of each frequency, which was used as the standard for dividing the water level runoff series. When the guarantee rate p ≤ 37.5%, it was considered a wet year; when 37.5% < p ≤ 62.5%, it was deemed a normal year; and when p>62.5%, it was considered a dry year.
The number of occurrences in the wet year accounted for 36.7% of the total series, the number of occurrences in the normal year accounted for 26.6% of the total series, and the number of occurrences in the dry year accounted for 36.7%. The percentage of the three periods was mainly balanced throughout the three periods. It was considered that the representativeness of the series, namely, the division of wet, normal, and dry years, was appropriate and able to reflect the objective law. According to the classification criteria of wet, normal, and dry years, the runoff was divided into four distinct periods: 1980–1994 was categorized as the wet year period, 1995–2002 was the dry year period, 2003–2011 was the normal year period, and 2012–2020 was another dry year period. According to the different wet, normal, and dry years of the secondary perched reach river and the different periods of the three sections of Huayuankou, Zhongmu, and Jiahetan, the recharge of the secondary perched reach river to the groundwater showed that when the river recharged the groundwater in the wet year of the Huayuankou section, Zhongmu section, and Jiahetan section, the groundwater level was higher than that in the normal year and the dry year. The water level of the Huayuankou hydrological station was 91.07 m in the wet year, 90.63 m in the normal year, and 89.30 m in the dry year. The water level of the Jiahetan hydrological station was 74.48 m in the wet year, 73.60 m in the normal year, and 72.53 m in the dry year. The groundwater level of the Zhongmu section was 72.35 m in the wet year, 71.86 m in the normal year, and 70.68 m in the dry year (Figure 8).
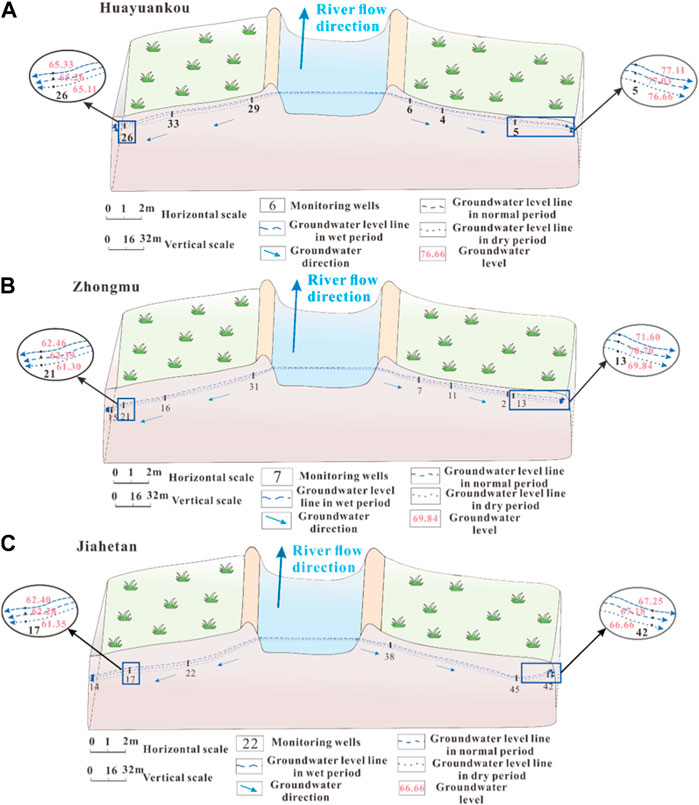
FIGURE 8. Groundwater recharge along the river in different hydrological years. (A) Huayuankou section, (B) Zhongmu section, (C) and Jiahetan section.
By using the analytical method, the amount of groundwater recharged by the secondary perched reach river infiltration was calculated by formula (9) and formula (10). From 1972 to 2020, the annual average unit width recharge of groundwater along the secondary perched reach river recharge (south bank) was 462.18 m3/m·d. The annual recharge in wet years was 566.79 m3/m·d, in normal years it was 439.25 m3/m·d, and in dry years it was 374.13 m3/m·d (Figure 9).
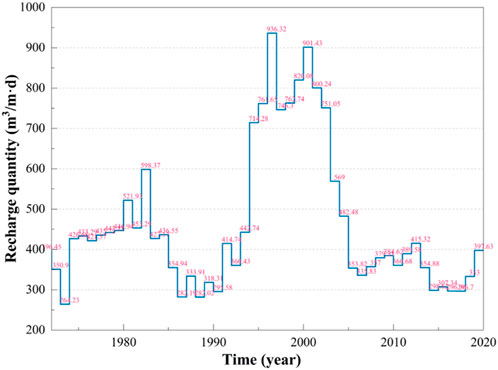
FIGURE 9. Amount of groundwater recharge by infiltration of the secondary perched reach.
The Huayuankou hydrological station of the Yellow River is 105 km away from the Jiahetan hydrological station. The water consumption balance method was calculated by Eq. 11. The interval loss was 240 million m3, and the unit length loss was 649.65 m3/m d. Due to the differences in lithology, thickness, and permeability of the aquifers on both sides, the lateral infiltration ratio was different and the lateral infiltration on the north bank was larger than that on the south bank. It was calculated that the lateral infiltration of the south bank was only 70% of that of the north bank, that is, 454.75 m3/m·d. This showed that the calculation results were consistent with the analytical method Darcy formula.
Due to the “sediment and water regulation” of the reservoir, the river channel has been affected in many aspects. In addition to the regulation of runoff in the river, the natural fluctuation process is weakened, and the change of the sediment concentration and the discharge of low-temperature water affect the reproduction of aquatic organisms. The main channel is scoured, and the river bottom is cut down. Under the same flow condition, the river water level decreases, which reduces the probability of an overbank flood. Overbank floods reduced, riparian beaches and wetlands shrank and degenerated, and the wetland area in the river channel decreased from 724 km2 in 1997 (before the operation of the reservoir) to 651 km2 in 2003 (after the operation) (Zhu et al., 2018). In the wetland ecosystem outside the river, part of the surface water in the marshland dried up and the vegetation decreased, which affected the habitat of a large number of birds (Liu et al., 2008).
The Huayuankou–Jiahetan section is located on the axis of the alluvial fan and alluvial plain of the Yellow River. It is the largest area of groundwater recharge by river water infiltration in the lower reaches of the Yellow River. The Yellow River Wetland Bird National Nature Reserve in Xinxiang, Henan Province; the Yellow River in Zhengzhou; and the Liuyuankou Wetland Provincial Nature Reserve in Kaifeng are distributed on both sides of the river from 5 to 20 km away from the embankment. They are important inland wetland ecosystems in China. Affected by the operation of the Xiaolangdi Reservoir, the recharge base level is reduced, and the shallow groundwater level in the Yellow River influence zone continues to decline. In 2019, compared with 2003, the area with groundwater depth greater than 8 m gradually expanded, from 4 km2 to 268 km2 in the north bank embankment and from 1 km2 to 1,257 km2 outside the embankment. On the south bank, it expanded from 58 km2 to 247 km2, and outside the embankment, it expanded from 66 km2 to 697 km2. The area with a buried depth of less than 2 m gradually shrunk, from 124 km2, the area disappeared outside the north bank, and it decreased from 55 to 26 km2 outside the south bank.
From 1972 to 2002, due to the increase in the irrigation amount of the Yellow River, the annual average runoff of the Huayuankou and Jiahetan hydrological stations decreased by 39.36% and 38.97%, respectively. Since the Xiaolangdi Reservoir was officially regulated by water and sediment in 2002, the operation of the dam has reduced the flood peak runoff, and the change of the river runoff tends to be stable. The amount of irrigation from the Yellow River has been reduced, resulting in an increase in the Yellow River water runoff compared with 1990–2000 (Figure 3A).
From 1972 to 2002, the river water level of the Huayuankou and Jiahetan hydrological stations did not decrease significantly. After the construction of the Xiaolangdi Reservoir (2002), the water level of the same discharge at the Huayuankou and Jiahetan hydrological stations is lower than that before the construction of the Xiaolangdi Reservoir (1990). The water level of the same runoff shows a downward trend year by year. The water level of the Huayuankou hydrological station decreased by 2.13, 3.13, and 3.85 m, respectively, in the initial stage (2005) and stable stage (2010 and 2020) of reservoir operation compared with that before reservoir construction (1990), and the water level of the Jiahetan hydrological station decreased by 2.11, 3.04, and 3.91 m, respectively. Since 2002, the Xiaolangdi Reservoir has carried out water and sediment regulation once a year and four times in a row. The sediment in the reservoir has been reduced by 310 million m3, the downstream channel has been scoured by 340 million m3, and the runoff capacity of the downstream channel has been increased from 1,800 m3/s to 3,000 m3/s. The trend of sedimentation deterioration in the downstream channel has been effectively controlled (Kong et al., 2015). The downstream river channel is continuously scoured, which alleviates the siltation of the river channel, and the river channel is cut down. The water level of the Huayuankou and Jiahetan rivers shows a significant downward trend (Figure 3B).
In the past 50 years, the groundwater level along the secondary perched reach river has generally shown a downward trend. The groundwater levels of typical monitoring wells #35, #29, #31, #20, #6, #12, #37, and #38 along the secondary perched reach river of the Yellow River have decreased by 8.31, 6.79, 3.42, 3.97, 7.24, 5.28, 1.51, and 4.88 m, respectively. Before 2002, the downward trend of the groundwater level was relatively gentle, with an average decline of 1.32 m. After 2002, the downward trend of the water level became more significant, with an average decline of 3.53 m (Figure 10). After the stable operation of water and sediment regulation of the Xiaolangdi Reservoir, the secondary perched reach riverbed was scoured, and the sediment particles in the riverbed were coarsened, which was conducive to the recharge of the secondary perched reach river to the groundwater. The scouring of the riverbed by the Xiaolangdi Reservoir will make the river channel cut down, making the hydraulic gradient smaller (Sun et al., 2016). Compared with this, the riverbed coarsening has less impact on groundwater recharge and the groundwater level along the riverbank still shows a downward trend.
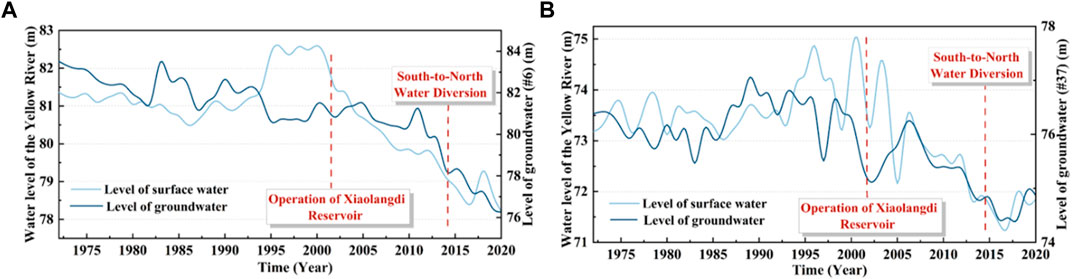
FIGURE 10. Relationship between surface water and groundwater. (A) #6 well water level and the middle Yellow River water level; (B) #38 well water level and the Jiahetan Yellow River water level.
According to the calculation in Section 4.3, the quantity of groundwater recharge by the secondary perched reach river in different hydrological years is different. In the wet season, the secondary perched reach river level is higher, the hydraulic gradient is larger, and the groundwater recharge is stronger. As the difference between the Yellow River water level and the monitoring well water level increases, the single-width infiltration flow of the Yellow River increases, that is, the infiltration recharge increases (Li et al., 2022). The lower reaches of the Yellow River were interrupted by many factors from 1992 to 1998. In order to ensure water supply for the local industrial and agricultural sectors, the Huayuankou station transferred water from the middle reaches and other places for many years during this period, reaching 800 m3/s in spring. During this period, the width of this section of the river decreased from 1.7 km in 1990 to 0.8 km in 1999, and the depth of the river increased from 1.2 to 1.8 m. The river discharge decreased from 1,135 m3/s to 663.5 m3/s, but the sediment discharge increased from 5.5 × 10⁸t to 11 × 108t, and 25% of the average sediment discharge was deposited in this reach, causing the river level to rise. As a result, the river flow decreases and the river level rises. After the operation of the Xiaolangdi Reservoir, from 1999 to 2004, as the median particle size of D50 of bed sand at each section of Huayuankou increased to 0.15 mm, the riverbed profile developed in the direction of narrowness and depth, forming a higher river level. After 2003, except for the Huayuankou section, D50 of other sections increased slightly or remained unchanged. Therefore, the sediment coarsening of the downstream riverbed was the most significant in the first 4 years after the operation of the Xiaolangdi Reservoir, and the changes in the riverbed led to an increase in river water infiltration. From the two factors mentioned above, the Yellow River infiltration was higher from 1994–2004 (Ma et al., 2022). Since then, with the decrease in the river flow, the weakening of bed sand coarsening and the reduction of river level, the infiltration recharge of the Yellow River has gradually decreased. The reduction intensity was the largest in 2006 (Figure 4), and the infiltration reduction rate in the following years was between 2.47% and 0.5%. With the operation of the “South-to-North Water Diversion Project,” the river volume and water level of the secondary perched reach tend to rise, and the infiltration of the Yellow River has been increasing.
(1) In the past 50 years, the river discharge and water level of the secondary perched reach of the Yellow River in the Huayuankou–Jiahetan section, and the groundwater level on both sides of the river have shown a significant downward trend. Since 2002, affected by the operation of the Xiaolangdi Reservoir, the river water runoff has stabilized and the river water has scoured the riverbed. The average depth of the riverbed undercutting is 2.44–3.77 m, resulting in a decrease in the river water level (Huayuankou decreased by 0.68 m and Jiahetan decreased by 2.7 m). The hydraulic gradient of groundwater decreases, the groundwater recharge weakens, and the groundwater level decreases significantly.
(2) It was observed, by using the gray correlation method, that the main factors affecting the groundwater level were the river discharge and the river water level. The hydraulic connection between the secondary perched river and the aquifer is strong. The Pearson correlation coefficient of the secondary perched river and the aquifer was calculated, indicating that the river discharge and water level of the river have a lag in the recharge of groundwater along the river. In the wet year, the water level of the secondary perched river is higher, the hydraulic gradient is larger, the recharge to the groundwater is stronger, and the unit width recharge is larger (566.79 m3/m·d). In the dry year, the recharge is less and the unit width recharge is 374.13 m3/m·d.
(3) Since the operation of the South-to-North Water Diversion Project in 2014, the irrigation amount of the Yellow River has been reduced. In 2020, the water discharge of the Yellow River in the Huayuankou and Jiahetan hydrologic stations increased from 735 m3/s to 1,536.9 m3/s and from 701 m3/s to 1,500.8 m3/s, respectively. The groundwater level (<2 km) showed a downward trend except for the rise of the water level of the Zheng 9 well. This reflects that Zhengzhou city receives water supply from the South-to-North Water Diversion Canal every year, approximately 580 million m3/a, reducing groundwater exploitation by 488 × 104 m3/a and making the groundwater level rise. In other areas, the water supply of canals is small, and the groundwater level shows a downward trend.
(4) This study focuses on the interannual mean variation characteristics of the water volume, water level and groundwater level of the Yellow River. The monthly mean value is used in the study of the lag of the water level of the groundwater and the secondary perched reach of the Yellow River, we will further carry out a multidisciplinary comprehensive study of river and groundwater dynamics on the monthly and daily data on river and groundwater.
The original contributions presented in the study are included in the article/Supplementary Material; further inquiries can be directed to the corresponding author.
MZ: writing–original draft. JP: writing–original draft. XM: writing–original draft. WL: writing–review and editing. HL: writing–review and editing. JZ: writing–review and editing. JL: writing–review and editing.
The author(s) declare that financial support was received for the research, authorship, and/or publication of this article. This research was funded by the Research Startup Fund for Academician Team of Zhengzhou University (grant no. 13432340370), High-level talents of Zhengzhou University (grant nos. 134-32340364 and 135-32340122), the National Natural Science Foundation of China–Henan Talent Training Joint Foundation (grant no. U1504404) and Dual-source groundwater ecological environment quality monitoring network in Henan Province and groundwater environment monitoring Early warning platform construction (Phase II) project B package (grant no. SJCAQ-HT-2023-036).
The authors specially thank the Yellow River Water Conservancy Commission for providing the water level and runoff data on the Huayuankou and Jiahetan hydrological stations in the lower reaches of the Yellow River from 1972 to 2020. They also specially thank the Henan Provincial Bureau of Hydrology and Water Resources for providing “Henan groundwater data”.
The authors declare that the research was conducted in the absence of any commercial or financial relationships that could be construed as a potential conflict of interest.
All claims expressed in this article are solely those of the authors and do not necessarily represent those of their affiliated organizations, or those of the publisher, the editors, and the reviewers. Any product that may be evaluated in this article, or claim that may be made by its manufacturer, is not guaranteed or endorsed by the publisher.
Acero, P., Auque, L. F., Galve, J. P., Gutierrez, F., Carbonel, D., Gimeno, M. J., et al. (2015). Evaluation of geochemical and hydrogeological processes by geochemical modeling in an area affected by evaporite karstification. J. Hydrol. 529, 1874–1889. doi:10.1016/j.jhydrol.2015.07.028
Chen, J. Y., Tang, C. Y., Sakura, Y., Kondoh, A., and Shen, Y. J. (2002). Groundwater flow and geochemistry in the lower reaches of the Yellow River: a case study in Shandong Province, China. Hydrogeol. J. 10 (6), 674. doi:10.1007/s10040-002-0231-7
Cheng, Q., Gao, L., Zuo, X., and Zhong, F. (2019). Statistical analyses of spatial and temporal variabilities in total, daytime, and nighttime precipitation indices and of extreme dry/wet association with large-scale circulations of Southwest China. Atmos. Res. 219, 166–182. doi:10.1016/j.atmosres.2018.12.033
Fu, Y., Dong, Y., Xie, Y., Xu, Z., and Wang, L. (2020). Impacts of regional groundwater flow and river fluctuation on floodplain wetlands in the middle reach of the Yellow River. Water-Sui 12 (7), 1922. doi:10.3390/w12071922
Gao, P., Xie, Y., Song, C., Cheng, C., and Ye, S. (2023). Exploring detailed urban-rural development under intersecting population growth and food production scenarios: trajectories for China's most populous agricultural province to 2030. J. Geogr. Sci. 33 (2), 222–244. doi:10.1007/s11442-023-2080-3
Gu, L., Shao, J., Sun, Y., and Zhao, Y. (2013). Groundwater flow simulation and resource evaluation of the affected zone along the Yellow River (henan section). Prog. Environ. Sci. Eng. 610-613, 2713–2718. doi:10.4028/www.scientific.net/AMR.610-613.2713
Kong, D., Miao, C., Wu, J., Duan, Q., Sun, Q., Ye, A., et al. (2015). The hydro-environmental response on the lower Yellow River to the water-sediment regulation scheme. Ecol. Eng. 79, 69–79. doi:10.1016/j.ecoleng.2015.03.009
Li, J., Li, F., Liu, Q., and Zhang, Y. (2014a). Trace metal in surface water and groundwater and its transfer in a Yellow River alluvial fan: evidence from isotopes and hydrochemistry. Sci. Total Environ. 472, 979–988. doi:10.1016/j.scitotenv.2013.11.120
Li, P., Wu, J., and Qian, H. (2014b). Hydrogeochemistry and quality assessment of shallow groundwater in the southern part of the Yellow River alluvial plain (zhongwei section), northwest China. Earth Sci. Res. J. 18 (1), 27–38. doi:10.15446/esrj.v18n1.34048
Li, X., Yan, B., Wang, Y., Wang, X., Li, Y., and Gai, J. (2022). Study of the interaction between Yellow River Water and groundwater in henan province, China. Sustainability-Basel 14 (14), 8301. doi:10.3390/su14148301
Liu, Q., Yang, Z., and Cui, B. (2008). Spatial and temporal variability of annual precipitation during 1961-2006 in Yellow River Basin, China. J. Hydrol. 361 (3-4), 330–338. doi:10.1016/j.jhydrol.2008.08.002
Ma, H., Nittrouer, J. A., Fu, X., Parker, G., Zhang, Y., Wang, Y., et al. (2022). Amplification of downstream flood stage due to damming of fine-grained rivers. Nat. Commun. 13 (1), 3054. doi:10.1038/s41467-022-30730-9
Qu, L., Li, Y., Wang, Y., Dong, S., and Wen, Q. (2022). Dynamic evolution and the mechanism of modern gully agriculture regional function in the Loess Plateau. J. Geogr. Sci. 32 (11), 2229–2250. doi:10.1007/s11442-022-2045-y
Sun, Z., Wang, W., Li, Y., Zhang, M., Shang, H., and Zhang, F. (2016). Can the narrowing of the Lower Yellow River by regulation result in non-siltation and even channel scouring? J. Geogr. Sci. 26 (9), 1337–1348. doi:10.1007/s11442-016-1330-z
Vincent, K. K., Muthama, M. N., and Muoki, S. N. (2014). Darcy’s law equation with application to underground seepage in earth dams in calculation of the amount of seepage. Am. J. Appl. Math. Statistics 2 (3), 143–149. doi:10.12691/ajams-2-3-8
Wang, Z., Jin, J., Liu, W., Deng, T., Zhao, Y., and Du, X. (2021). Chemical characteristics and factors affecting groundwater chemistry from the Yellow River irrigation area in tumochuan plain in the middle and upper reaches of the Yellow River basin. Res. Square. doi:10.21203/rs.3.rs-584081/v1
Xu, H., Li, Y., Huang, Z., Bai, Y., and Zhang, J. (2022). Energy dissipation caused by boundary resistance in a typical reach of the lower Yellow River and the implications for riverbed stability. J. Geogr. Sci. 32 (11), 2311–2327. doi:10.1007/s11442-022-2049-7
Xu, Z. X., Takeuchi, K., Ishidaira, H., and Zhang, X. W. (2002). Sustainability analysis for Yellow River water resources using the system dynamics approach. Water Resour. Manag. 16 (3), 239–261. doi:10.1023/A:1020206826669
Yan, J., Xu, H., Xu, L., Gurkalo, F., and Gao, X. (2023). Evolution characteristics of long time series of secondary perched River in typical reaches of the lower Yellow River. Water-Sui 15 (20), 3674. doi:10.3390/w15203674
Yang, D. W., Li, C., Hu, H. P., Lei, Z. D., Yang, S. X., Kusuda, T., et al. (2004). Analysis of water resources variability in the Yellow River of China during the last half century using historical data. Water Resour. Res. 40 (6). doi:10.1029/2003WR002763
Yue, S., Pilon, P., and Cavadias, G. (2002). Power of the Mann-Kendall and Spearman's rho tests for detecting monotonic trends in hydrological series. J. Hydrol. 259 (1-4), 254–271. doi:10.1016/S0022-1694(01)00594-7
Zhang, Q., Peng, J., Singh, V. P., Li, J., and Chen, Y. D. (2014). Spatio-temporal variations of precipitation in arid and semiarid regions of China: the Yellow River basin as a case study. Glob. Planet Change 114, 38–49. doi:10.1016/j.gloplacha.2014.01.005
Zhang, Q., Xu, C. Y., and Yang, T. (2009). Variability of water resource in the Yellow River Basin of past 50 Years, China. Water Resour. Manag. 23 (6), 1157–1170. doi:10.1007/s11269-008-9320-2
Zhou, P., Li, M., and Lu, Y. (2017). Hydrochemistry and isotope hydrology for groundwater sustainability of the coastal multilayered aquifer system (zhanjiang, China). Geofluids 2017, 1–19. doi:10.1155/2017/7080346
Keywords: hydrological response, ecohydrological processes, ecosystem, hydrology, sustainable management practices
Citation: Zhang M, Ping J, Mei X, Leng W, Li H, Zhao J and Liu J (2023) The trend of groundwater recharge in the secondary perched reaches of the Yellow River in the past 50 years. Front. Environ. Sci. 11:1310181. doi: 10.3389/fenvs.2023.1310181
Received: 09 October 2023; Accepted: 23 November 2023;
Published: 07 December 2023.
Edited by:
Xudong Huang, North China University of Water Conservancy and Electric Power, ChinaReviewed by:
Sheng Li, Xinjiang University, ChinaCopyright © 2023 Zhang, Ping, Mei, Leng, Li, Zhao and Liu. This is an open-access article distributed under the terms of the Creative Commons Attribution License (CC BY). The use, distribution or reproduction in other forums is permitted, provided the original author(s) and the copyright owner(s) are credited and that the original publication in this journal is cited, in accordance with accepted academic practice. No use, distribution or reproduction is permitted which does not comply with these terms.
*Correspondence: Jianhua Ping, cGluZ2ppYW5odWFAenp1LmVkdS5jbg==
Disclaimer: All claims expressed in this article are solely those of the authors and do not necessarily represent those of their affiliated organizations, or those of the publisher, the editors and the reviewers. Any product that may be evaluated in this article or claim that may be made by its manufacturer is not guaranteed or endorsed by the publisher.
Research integrity at Frontiers
Learn more about the work of our research integrity team to safeguard the quality of each article we publish.