 Jing Gong1
 Yong Sun
94% of researchers rate our articles as excellent or good
Learn more about the work of our research integrity team to safeguard the quality of each article we publish.
Find out more
ORIGINAL RESEARCH article
Front. Environ. Sci., 16 November 2023
Sec. Land Use Dynamics
Volume 11 - 2023 | https://doi.org/10.3389/fenvs.2023.1306187
This article is part of the Research TopicRealization of Ecological Product Value, Land Use Change and EnvironmentView all 11 articles
The Pearl River Delta (PRD) is a highly urbanized region in China that faces significant challenges in land use management. These challenges include the decrease in agricultural and ecological land resulting from rapid urbanization, the effectiveness of government governance, and the trajectory of development, all of which warrant careful research examination. Moreover, existing studies on land use in the PRD predominantly rely on static historical analysis, lacking a multi-scenario simulation approach. This study examines land use in PRD using a Patch-Generating Simulation (PLUS), from 1985 to 2020 to address this gap. Three scenarios were established to simulate potential land use outcomes in the PRD by 2030: spontaneous change, cropland protection, and ecological protection. The findings reveal that cropland, forest, and impervious surfaces are the dominant land use types in the PRD. From 1985 to 2020, the proportion of cropland decreased from 37.63% to 27.40%, with most conversions occurring to impervious surfaces and forest land. The proportion of impervious surfaces increased from 1.81% to 12.57%, primarily from conversions of cropland, forest, and water bodies. Economic development, population growth, accessibility, climatic factors, and topographic conditions were shown to be the primary determinants of land use in the PRD. Modelling results suggest that under the spontaneous change scenario, cropland and ecological land decrease, while impervious surfaces expand significantly, threatening cropland preservation and ecological construction. However, under the cropland protection scenario, the conversion rate of cropland to other land types can be effectively controlled, contributing to efficient preservation. Under the ecological protection scenario, impervious infrastructure encroachment on ecological land can be mitigated, but cropland protection is limited. The study proposes cropland protection and ecological priority policies to optimize the structure of land use, enhance efficiency, and offer policy guidance for the efficient utilization of land resources and the preservation of the ecological environment in the PRD.
The land is a key element in nature and the most basic natural resource and material basis for human survival and development (Kozak et al., 2017; Wang et al., 2023a). Human activities transform different attributes of land to meet the requirements of social development, especially in key urban agglomerations, where rapid urban development is seriously crowding out other land uses, threatening food security and ecological safety. This phenomenon has received considerable attention from researchers in various countries and regions. Urban agglomerations are focal areas for land use/land cover change. However, the patterns and processes of land use change in urban agglomerations differ significantly from those in non-urban areas (Chen et al., 2020). With higher population densities and greater influence of economic and social factors, urban agglomerations experience more pronounced land use changes compared to non-urban regions (Yu et al., 2019). Therefore, it is crucial to use satellite imagery, population census data, and statistical models to analyze the dynamic changes in land use within urban agglomerations. In particular, it is essential to unveil the primary drivers that shape land use change in these areas.
Pearl River Delta (PRD) is one of the most populous urban agglomerations in China, with relatively scarce resources, rapid economic development, and high ecological and environmental pressure (Ouyang et al., 2021). In the context of rapid economic development and accelerated urbanisation, the PRD has experienced dramatic land use, leading to a series of problems such as a reduction in cropland area, ecosystem degradation, and biodiversity loss (Jiao et al., 2019; Li et al., 2023). Therefore, researching land use and its impact mechanisms in the PRD has great theoretical significance and practical value.
In the 1990s, the International Geosphere-Biosphere Programme and the International Human Dimensions Programme on Global Environmental Change jointly proposed the land use programme, making land use a hot topic and a Frontier in the natural and social sciences (Li et al., 2012). Previous studies have identified economic development, population growth and climate change as the main drivers of land use and explored their effects on natural ecosystems (Cai et al., 2011; Liu et al., 2019; Himes et al., 2020). These studies have also revealed that land use can have hidden and adverse impacts on ecosystem services, such as biodiversity, climate regulation and hydrological regulation, leading to various ecological problems (Yu et al., 2010; Li et al., 2017; Pellissier et al., 2017). To support land use planning and ecological protection, some studies have conducted multi-scenario simulations and analyses of land use under different conditions (Liu et al., 2020; Cabral et al., 2021). For instance, Li et al. (2022) used land use images to examine land use change in the PRD, simulated land use under different scenarios and evaluated the corresponding ecosystem service values. This study can help us better understand the environmental consequences of land use choices and formulate more sustainable land use policies.
Model-based analysis methods are very effective for land use studies as they can provide information on the trends and changes in land use in terms of quantity and spatial patterns (Jiao et al., 2019; Sun et al., 2022). However, different quantitative research methods are suitable for different conditions and problems, and they have some differences in the issues they address. Firstly, evaluation models of land use are mainly used to assess land use over a specific period. These models quantify the current situation and characteristics of land use, such as the distribution, area and spatial pattern of land use types, by collecting land use data and relevant indicators, such as the use/cover change transfer matrix, land use dynamics and so on (Chang et al., 2022; Yang et al., 2022). Secondly, causal identification models of land use are used to infer the causes and mechanisms of land use change by analysing the correlation and influence of land use and drivers, such as system dynamics models and regression analysis (He et al., 2022; Jiang et al., 2023). Thirdly, predictive models of land use are used to forecast future trends in land use change. These models are based on historical land use data, drivers and trend analysis, etc., and they use mathematical-statistical models or machine learning algorithms to predict future land use changes, such as Markov chain models, cellular automata models and machine learning models (Genga et al., 2017; Huang et al., 2022; Wang et al., 2023a). However, it has been shown that these models can hardly combine the advantages of both quantitative and spatial pattern prediction (Liang et al., 2021).
The model that integrates quantitative and spatial pattern prediction can reveal more information about the trend of land use change, thus providing more comprehensive guidance for total land use control and local governance and facilitating accurate land use management (Jiao et al., 2019; Liu et al., 2023). The Patch-Generating Simulation (PLUS) is a raster-based CA model (Liang et al., 2021), which can explore the drivers of land expansion and predict the patch-level evolution of land-use landscapes (Zhang et al., 2022; Wang et al., 2023b). This model has several advantages. Firstly, it can consider not only the quantity and spatial distribution of land use types but also the shape and size of land use patches, thus reflecting the spatial pattern of land use better. Secondly, it can analyse the interactions and competition between different land-use types in an integrated way by introducing multiple drivers and constraints, as well as adaptive inertia and competition mechanisms, thus simulating the processes and outcomes of land-use change more accurately. This model can help us better understand the impacts of land use on ecosystems and provide a scientific basis for sustainable land use and environmental protection.
The PRD is strategically positioned within China’s territorial spatial development pattern, and is facing the challenge of rapid urbanization and its consequent impact on land use changes, which poses a threat to its sustainable development. To comprehensively understand the evolving trends and devise effective strategies for regulating land use changes in urban agglomeration areas, this study employs a multi-perspective analysis and simulation approach based on the case of the PRD. Specifically, the PLUS model is utilized, which combines the quantitative predictive capabilities of Markov models with the spatial pattern predictive advantages of meta-cellular automata. This model enables an examination of the spatial and temporal dynamics of land use changes and their driving forces in the PRD from 1985 to 2020. It also sets up three scenarios of inertial development, Cropland protection and ecological priority to predict the land use situation in the PRD in 2030. The paper aims to answer the following questions: What are the trends and factors of land use change in the PRD? What are the future land use trends of urban agglomerations under different scenarios? The projections are intended to provide a reference for the optimal allocation of land resources and a rational land use structure in the PRD. This study applies the PLUS model to reveal the main factors affecting the land use change processes and outcomes in urban agglomerations, and provides decision support for optimizing the allocation and rational utilization of land resources in the Pearl River Delta region.
The remaining sections of the paper are structured as follows: Section 2 provides an overview of the study area and data sources. Section 3 outlines the research methodology employed in this study. Section 4 presents a detailed analysis of the obtained results. Section 5 engages in a comprehensive discussion of the findings. Finally, Section 7 draws conclusions based on the findings and contributions of this paper.
The PRD urban agglomeration is one of China’s most significant economic regions and ranks among the largest urban clusters globally (Ouyang et al., 2021; Li et al., 2023). Characterized by a subtropical monsoonal climate, this area benefits from abundant rainfall and well-established water systems. With a robust industrial base, efficient transportation networks, high population density, and remarkable economic vitality, it holds a crucial strategic position as a Frontier of China’s reform and opening-up policies. As the economy continues to flourish, the land use patterns within the PRD have been undergoing rapid transformations. In comparison to other prominent urban agglomerations in China, such as the Beijing-Tianjin-Hebei region and the Yangtze River Delta, the PRD exhibits a greater diversity of land use types and faces more pronounced ecological and environmental pressures and challenges. Consequently, the land use changes occurring in this region bear significant implications for both China’s and the world’s socio-economic development and ecological conservation efforts (Figure 1).
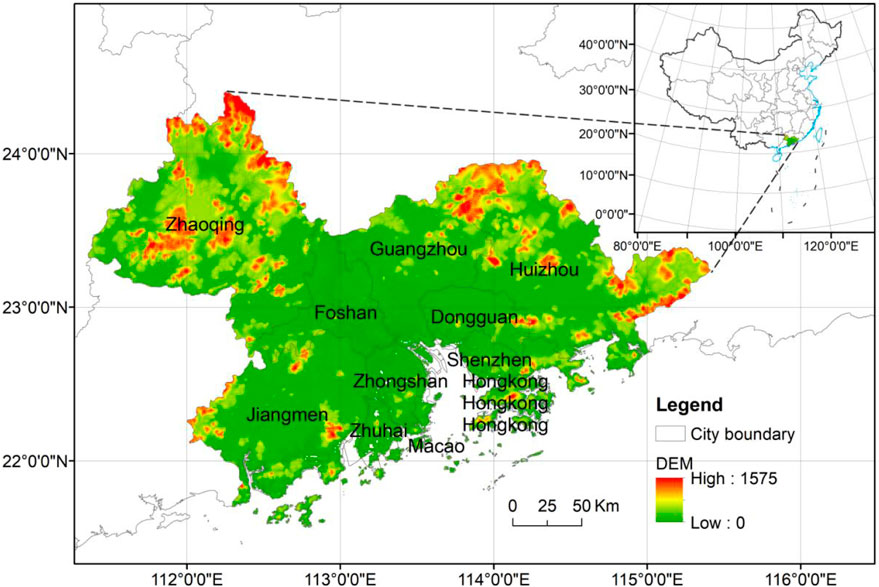
FIGURE 1. Study area.
The PRD is located between 112°57′-114°48′E and 21°48′-23°56′N. It covers nine prefecture-level cities and is bordered by the mountains of northern Guangdong to the north, the South China Sea to the south, the border between Fujian, Guangdong and Jiangxi to the east and the Xijiang River basin to the west. The PRD is mainly a plain region, with plains accounting for 70% of the total area. Its topography is high in the north and low in the south, with a low centre and high sides. The western, northern and eastern parts are surrounded by hilly mountains, forming a natural barrier. The southern coastline of the PRD has many islands and is 1,059 km long.
This paper uses land use data, socio-economic data and natural conditions data (Table 1). The land use data are from the CLCD dataset, which was published by Yang Jie and Huang Xin of Wuhan University in Earth System Science Data (Yang and Huang, 2021). This dataset has the advantage of providing 30 m annual land use classification results for 30 years, which is a higher temporal resolution than other products such as GLC_FCS30, Global30, AGLC2000_2015, FROM-GLC10, ESA10 and ESRI10. The dataset divides the land into nine categories: Cropland, Forest, Shrub, Grassland, Water, Sonw/Ice, Barren, Impervious and Wetland. The DEM data is from SRTM (http://srtm.csi.cgiar.org/) and the slope data is derived from DEM. The data on soil type, GDP, population, annual mean temperature and annual precipitation are from the CAS Data Centre for Resource and Environmental Sciences (https://www.resdc.cn/). The data on railways and other transport features are from OSM (https://www.openstreetmap.org/).
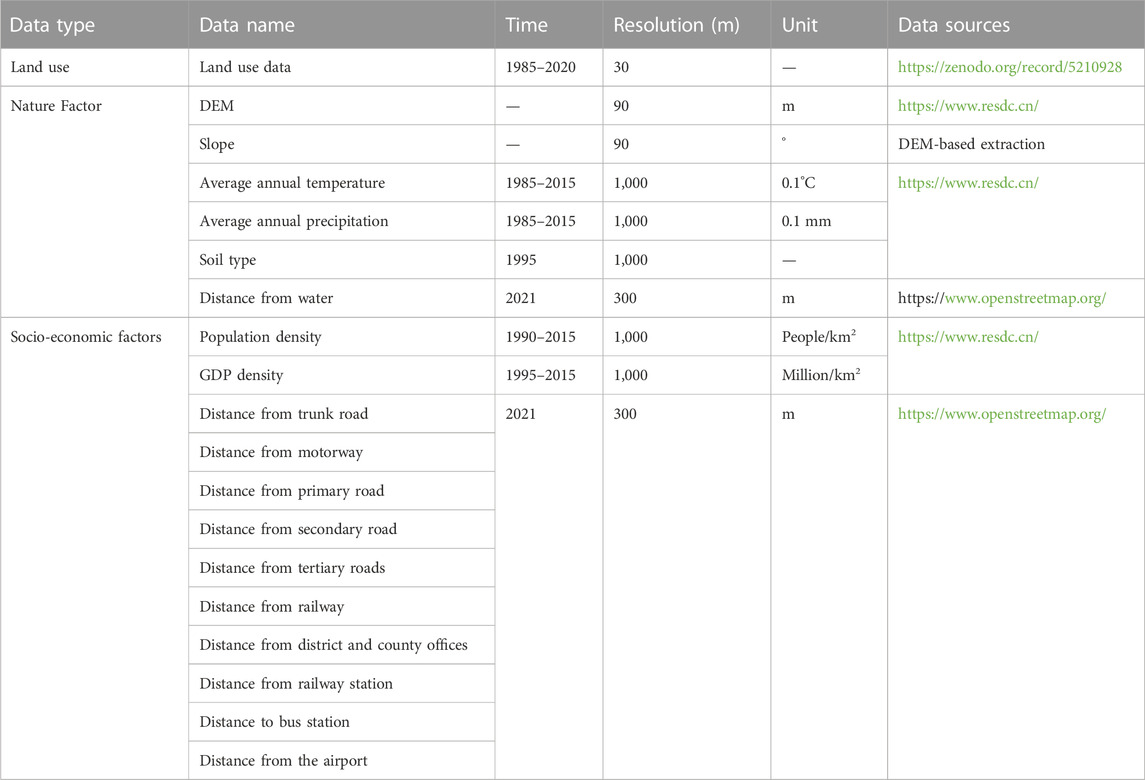
TABLE 1. Data information.
Our research methodology has two main parts (Figure 2). The first part is a historical analysis of land use in PRD from 1985 to 2020. We use descriptive statistics, land use transfer matrix, and land use dynamic attitudes to analyse the spatial and temporal patterns of land use. The second part is a future simulation of land use using the PLUS model. The year 2030 marks the deadline for the United Nations Sustainable Development Goals, making it a crucial milestone that many studies focus on. With reference to relevant research (Feng et al., 2020; Floreano and de Moraes, 2021; Rahnama, 2021), we examine the impact and driving effects of future variables on land use and compare three scenarios of possible land use change by 2030.
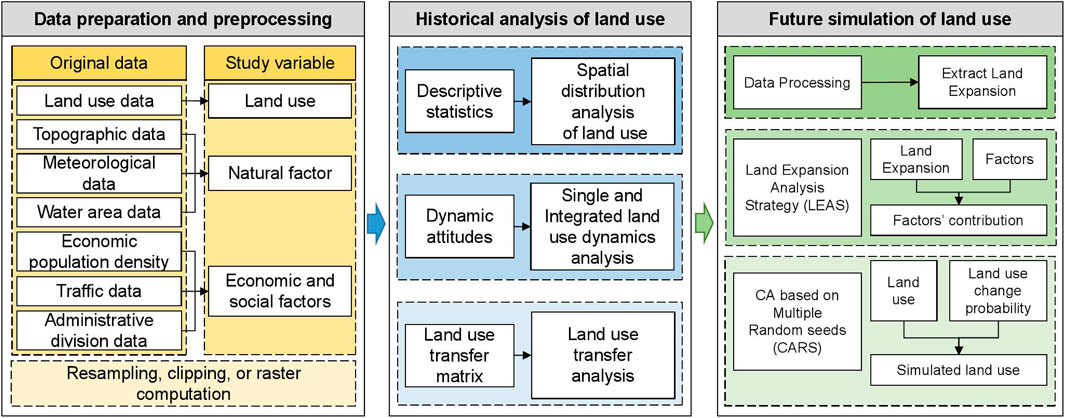
FIGURE 2. Analytical framework.
The land use transfer matrix reflects the values and direction of transfer of land use types in a region over the study period. The calculation formula is as follows:
Where n is the number of land classes, i,j
Land use dynamics quantifies the magnitude and rate of change occurring in each category (Yang et al., 2022), facilitating the study of the overall change and structural dynamics of land use types, with the single land use dynamic attitude as follows:
Where Ki denotes the single land use dynamic attitude of i land use type during the study period, Uai and Ubi are the area at the beginning and end of the study period for i land use type, and T denotes the study period.
The expression for the integrated land use dynamic attitude is
Where S denotes the integrated land use dynamic attitude of i land use type during the study period, Uai and Ubi are the area at the beginning and end of the study period for i land use type, and T denotes the study period.
To investigate the land use changes in the PRD under different development objectives and concerning relevant studies (Wang et al., 2023a), this paper sets up three scenarios: the inertial development scenario, the cropland protection scenario and the ecological protection scenario. These scenarios are used to predict the spatial pattern of land use in the PRD in 2030. In the ecological protection scenario, the conversion of forest, shrubland, grassland and water to other land types is restricted. The cost of each scenario is shown in Table 2.
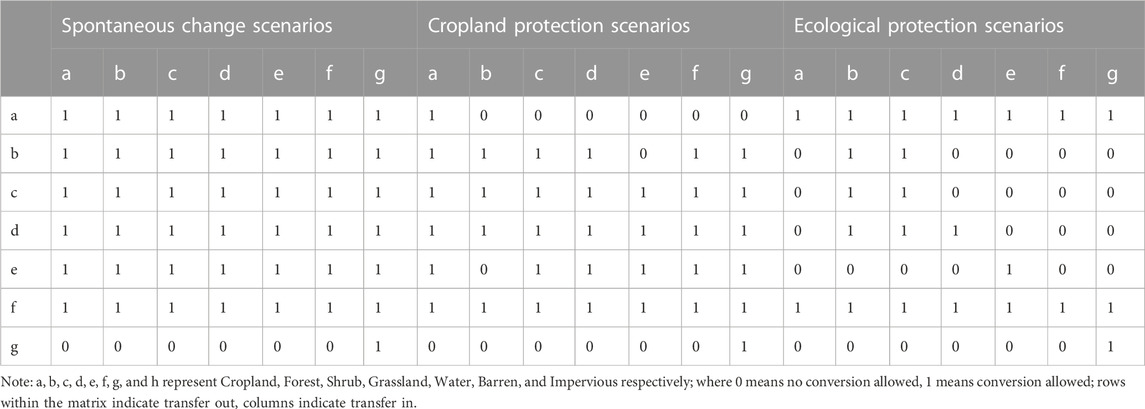
TABLE 2. Matrix of land use conversion costs by scenario.
The PRD primarily encompasses a flat region situated in the lower reaches of the Pearl River. Its topography exhibits higher elevations in the north and lower elevations in the south, resulting in a concave shape with elevated sides. These geographical features significantly influence its land use characteristics (refer to Figure 3). As of 2020, the dominant land use types in the PRD are cropland (27.40%), forest (55.07%) and construction land (12.57%), while grassland, shrub and barren are less common. Urban built-up land is mainly concentrated along the Pearl River Estuary and the Pearl River, forming large and medium-sized cities such as Guangzhou, Shenzhen, Dongguan, Foshan and Zhongshan. The hilly and mountainous areas are the main areas of ecological space, with forests, water bodies and wetlands occupying most of the land. Forests are mainly distributed in the green ecological barrier areas such as Rangke Mountain-Dinghu Mountain in Zhaoqing, Gudou Mountain in Jiangmen and Xiangtou Mountain-Lufushan in Huizhou. Water bodies are mainly distributed in the coastal and inland lakes in the east. Wetlands are mainly distributed in the Pearl River estuary and coastal mudflats.
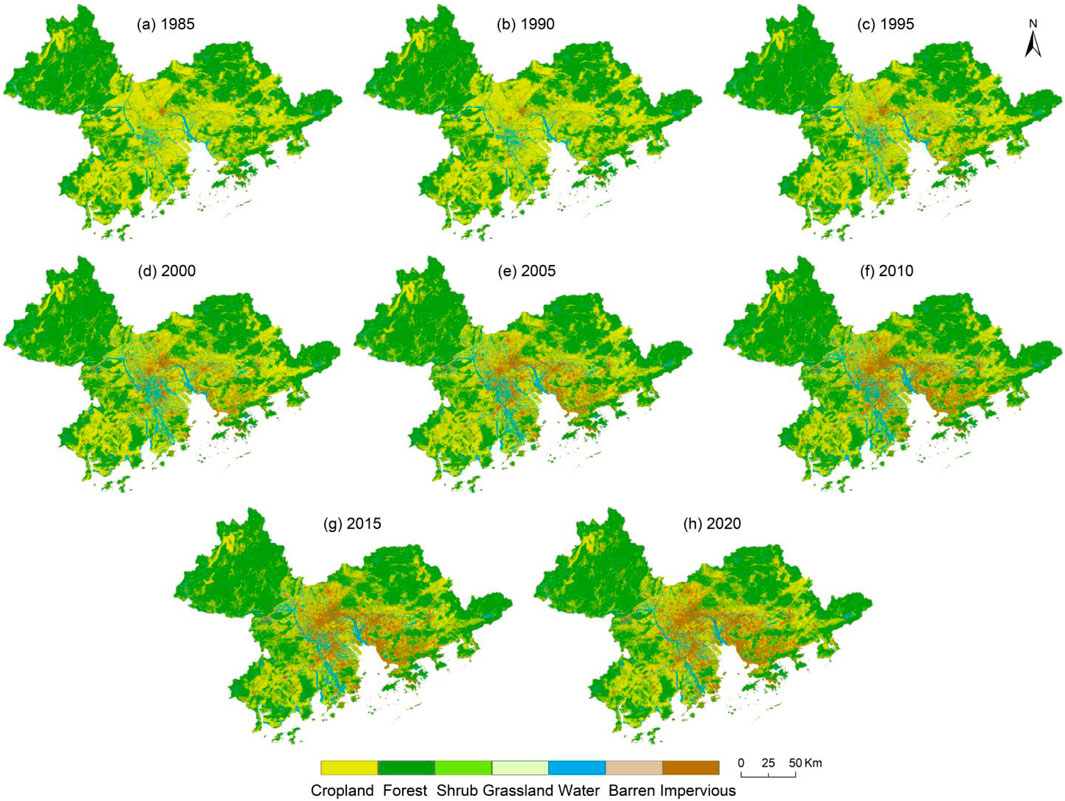
FIGURE 3. Land use distribution in the PRD, 1985–2020. (A) 1985. (B) 1990. (C) 1995. (D) 2000. (E) 2005. (F) 2010. (G) 2015. (H) 2020.
The PRD has experienced significant changes in land use types. The area of cropland decreased from 37.63% in 1985 to 27.40% in 2020, a decrease of 10.23%. The area share of forest and shrub also decreased slightly, while the area share of grassland, water and barren decreased as well. The area share of impervious increased from 1.81% in 1985 to 12.57% in 2020, an increase of 10.76%, indicating the rapid urbanisation of the PRD, which leads to a reduction in the amount of cropland and natural habitats, which could have adverse impacts on the ecology (Jiao et al., 2019).
Table 3 shows the changes in the various land use types over time. The area share of cropland decreases, while the area share of impervious increases, indicating the acceleration of urbanisation in the PRD. The area share of forest and shrub decreases slightly, while the area share of grassland, water and barren decreases as well. The integrated land use dynamics in the PRD increase overall, and the changes are relatively stable over time, which may indicate the diversification and balanced development of land use types in the PRD.
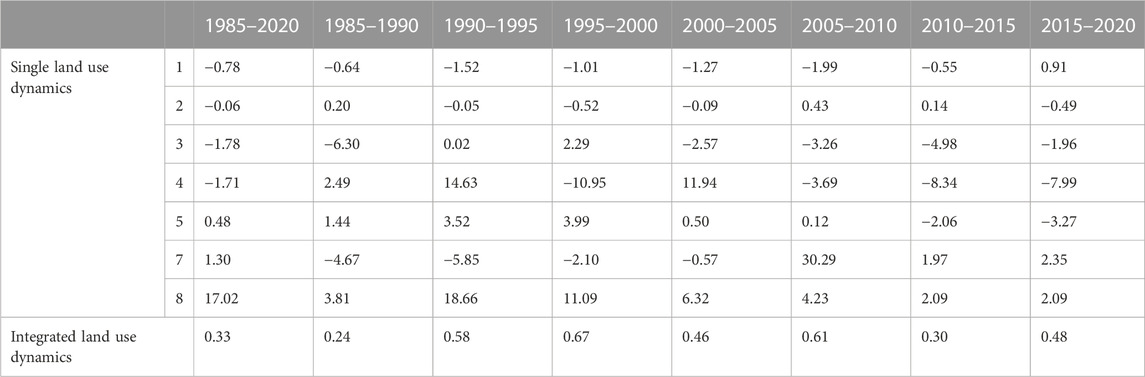
TABLE 3. Dynamics Attitudes of land use in the PRD by period 1985–2020 (Unit: %).
Table 4 shows the main trend of land use transfer in the PRD is the shift from cropland to urban building land and ecological space, reflecting the dual needs of urbanisation and ecological protection. The main features of land use transfer in the PRD by specific types are: Cropland has the largest reduction, with a decrease of about 8,039.44 km2 and a transfer out of 39.13%, mainly to impervious and forest. This indicates that cropland has been used for urban and construction development or through natural succession in the past decades. Barren has the largest proportion of transfer out, with 96.82% of transfer in, mainly to water and impervious. Impervious has the smallest proportion of transfer out and the largest increase, with an increase of about 5,909.39 km2. This reflects the accelerated urbanisation and construction activity, with many cropland and other land use types being converted to impervious, leading to a decrease in the ecosystem service of grain production in this region (Liu et al., 2019). Barren has the largest proportion of transfers in, with 97.82% of transfers in, mainly from cropland and water. The forest is the relatively stable type, with less change, mainly within the natural ecological space, reflecting the role of natural succession and anthropogenic disturbance.
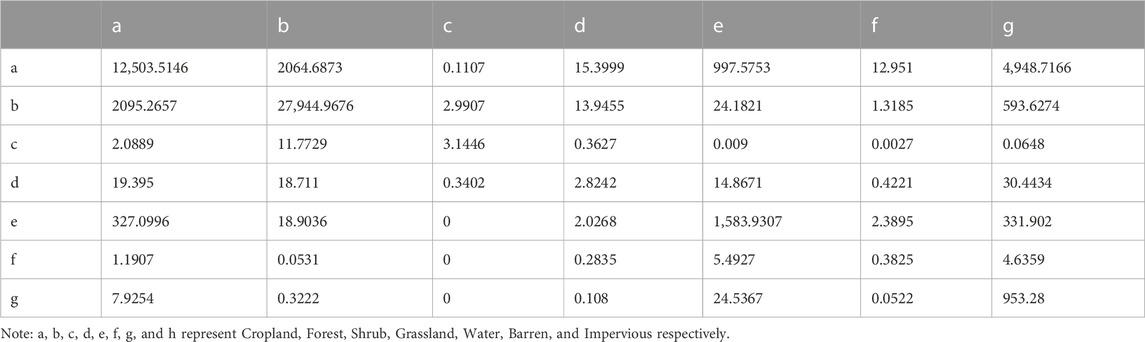
TABLE 4. PRD Land Use Type Transfer Matrix 1985–2020 (Unit: km2).
Land use change is driven by various factors, including distance from tertiary roads, temperature, and economic development (Figure 4). These drivers can affect the suitability of farmland for agricultural production, the growth and development of crops, and the shift in land use from farming to urbanization. Similarly, changes in forest areas may be attributed to population growth, topographic conditions, and soil types. Shrubland is also impacted by population growth, economic development, and urbanization. Grasslands, on the other hand, may experience a reduction in area due to population growth and changes in precipitation and temperature. Waters are influenced by topographic conditions and changes in temperature and precipitation, while barren areas are affected by accessibility, population growth, and transport and logistics development. Impervious areas are impacted by precipitation, temperature, and topography.
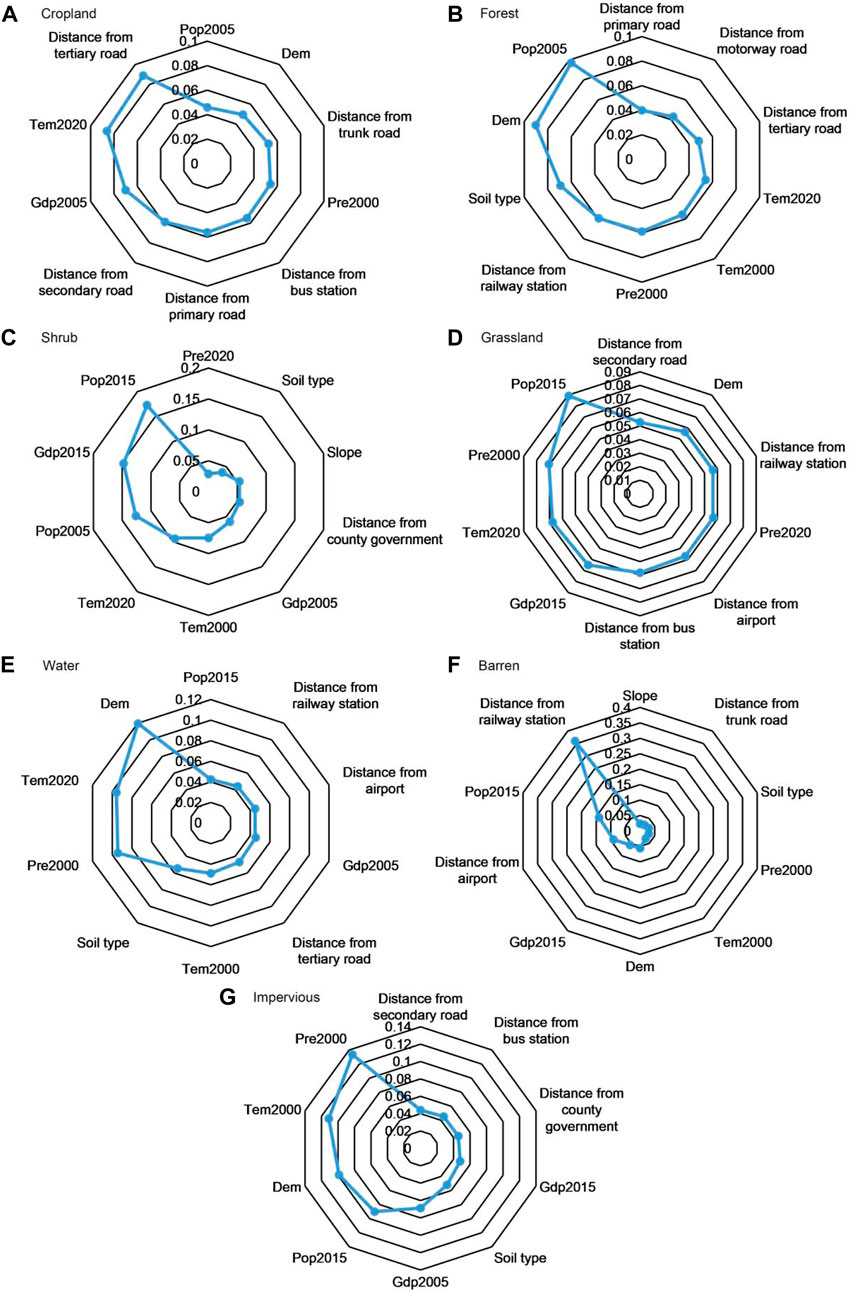
FIGURE 4. Contribution analysis of driving factors. (A) Cropland. (B) Forest. (C) Shrub. (D) Grassland. (E) Water. (F) Barren. (G) Impervious.
To evaluate the performance of the PLUS model, we used the 2010 land use data to simulate the land use spatial distribution in 2020 and compared it with the actual land use data in 2020 (Figure 4). We also sampled the actual land use data, constructed a confusion matrix between the simulated and actual images in 2020, and calculated the overall accuracy and Kappa coefficient. Figure 5 shows that the PLUS model simulation has a high degree of similarity with the actual distribution. However, due to the small area and sample size of Grassland and Barren in the study area, their simulation accuracy is relatively low. Nevertheless, the overall spatial simulation accuracy is high, with an overall accuracy of 0.902052 and a Kappa coefficient of 0.837767. These results indicate that the PLUS model meets the simulation requirements and is suitable for simulating the land use spatial distribution in the PRD.
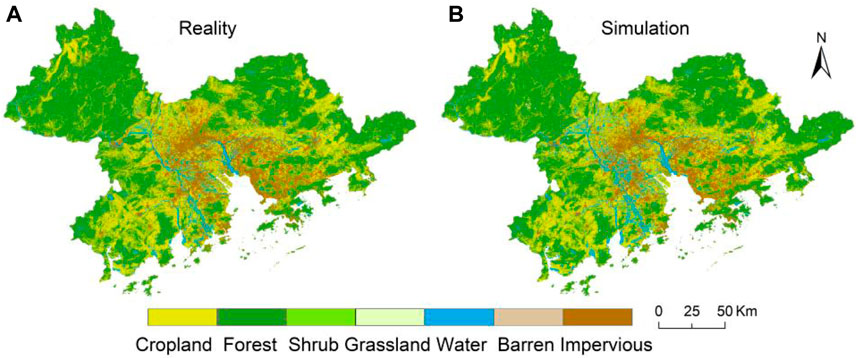
FIGURE 5. Spl comparison of simulated and actual land use in the PRD in 2020. (A) Acture land use. (B) Simulated land use.
We used the 2020 land use data of the study area as the initial value and applied the CARS module of the PLUS model to simulate the land use in 2030. The CARS module was based on the projected area results of the three scenarios, the land use cost transfer matrix and the neighbourhood weights. We obtained the simulation results of the 2030 land use (Figure 6) and the projected area table (Table 5) for the study area.
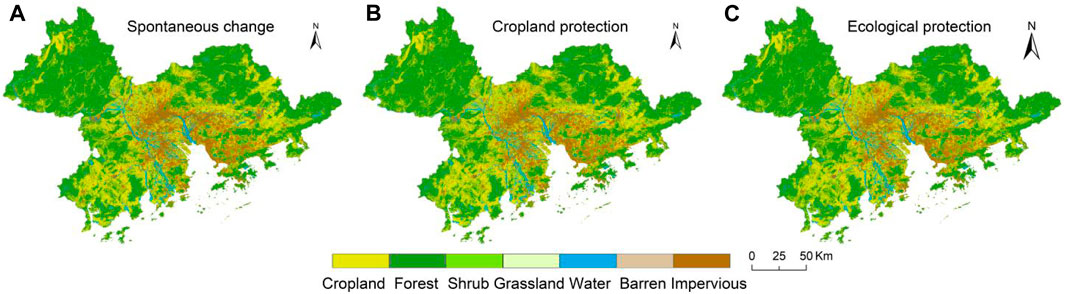
FIGURE 6. Spatial distribution of land use simulations in the PRD under the three scenarios. (A) Spontaneous change. (B) Cropland protection. (C) Ecological protection.
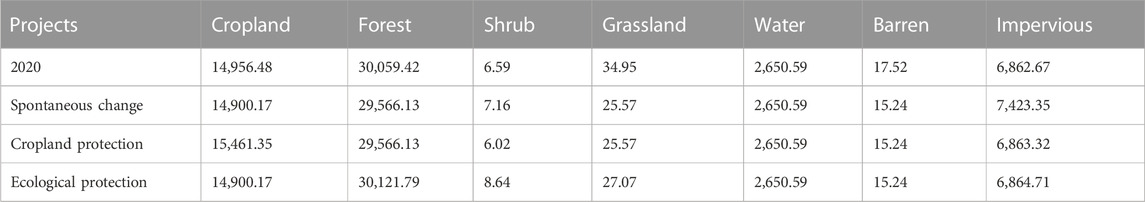
TABLE 5. Projected land use area under three scenarios for the PRD in 2030 (Unit: km2).
Under the Spontaneous change scenario, the impervious area of the PRD increases by 560.68–7,423.35 km2 in 2030, expanding from the urban centre to the periphery. Cropland decreases by 56.31 km2 compared to 2020, mainly converting to impervious. This scenario poses a serious threat to cropland protection and ecological construction in the study area.
Under the Cropland protection scenario, the impervious area of the PRD increases by 0.65–6,863.32 km2 in 2030, which is the lowest expansion among the three scenarios. This scenario effectively controls the growth of impervious areas, but reduces forest by 493.29 km2, shrub by 0.57 km2 and grassland by 9.38 km2 compared to 2020. This scenario also prevents the conversion of cropland to other land types, leading to efficient protection of cropland and food security.
Under the Ecological protection scenario, the forest area of the PRD increases by 62.37–30,121.79 km2 in 2030; shrub increases by 2.06 km2; grassland decreases by 7.88 km2, which is the smallest decrease among the three scenarios; cropland remains unchanged; water remains unchanged; and impervious increases slightly. This scenario reduces the occupation of ecological land by impervious infrastructure and limits the expansion of impervious areas to some extent, which is beneficial for ecological construction and economic development. However, this scenario does not protect cropland effectively, which may compromise food security in PRD.
The three scenarios reflect the different development orientations of the study area. The economic development scenario aims to accelerate the urbanisation and infrastructure construction in the PRD, resulting in a greater expansion and agglomeration of impervious areas than the other two scenarios. The cropland protection scenario aims to implement the cropland protection system and strengthen food security, resulting in a smaller reduction of cropland and a smaller loss of ecological land than the other two scenarios. It also controls the expansion of impervious areas effectively. The ecological protection scenario aims to consolidate and strengthen ecological protection and restoration efforts, resulting in a more compact distribution of ecological land than the other two scenarios. It also improves the encroachment of impervious areas on ecological land. In any scenario, impervious area expansion is inevitable due to urbanisation and socio-economic progress in the study area. It also shows that in the PRD region, more attention should be paid to the protection of ecological environment while developing the economy (Li et al., 2017).
Global land use change is confronted with multiple challenges and trends, including population growth, economic globalization, urbanization, agricultural expansion, forestry degradation, desertification, and land degradation, among others (Long et al., 2021). These challenges and trends interact with each other, forming a complex land use system that requires comprehensive analysis and management. In order to achieve the Sustainable Development Goals (SDGs), it is necessary to coordinate land use policies and actions across different scales and sectors, striking a balance between the supply and demand of ecosystem services, protecting and restoring natural capital, and promoting social equity and economic benefits (Zhou et al., 2022; Wei et al., 2023).
Human activities are the direct drivers of land use change, which are also constrained by natural factors and influenced by socio-economic factors (Zhou et al., 2015; Huang et al., 2019; Msofe et al., 2019). The demand for a greener environment and the implementation of ecological protection policies are the major drivers for restoring regional ecosystems (Wang et al., 2012; He et al., 2020; Qiu et al., 2022). The PRD is one of the most affluent and dynamic economic regions in China, as well as one of the most densely populated areas. Urbanisation in the PRD is driven by various factors such as economic development, policy support and social demand, leading to changes in land use/cover and ecology (Liu et al., 2019; Zhou et al., 2019). This study analyses the historical changes in land use/cover in the PRD and explores their evolutionary process. It then selects a high-precision model to simulate future land use scenarios. The results of this study can provide decision support for land use planning in the PRD. Most of the converted cropland was transformed into the impervious area and a small part was transformed into a forest under the ‘Food for Green’ policy. The impervious area expanded along the existing built-up areas (Jiao et al., 2019).
The future land use pattern of the PRD will be influenced by multiple factors, such as economic development, environmental protection and agricultural production. Economic growth drives urbanisation, which increases the demand for impervious areas and may reduce cropland, degrade the environment and threaten food security (Jiao et al., 2019; Li et al., 2020). The PRD was historically an important food production region in China, with agriculture dominating the land use pattern until the 1980s. The rapid urbanisation and industrialisation of the PRD changed the cropland pattern significantly (Jiao et al., 2019; Zhou et al., 2019). Cropland is an important source of food production, and its conservation and rational use are crucial for the sustainable development of agriculture in the PRD. The rapid urbanisation and industrialisation in the PRD also reduced and fragmented the ecological land, such as forest, shrub and grassland, causing ecosystem degradation, atmospheric pollution and water stress (Li et al., 2020; Li et al., 2023). In the future, the PRD needs to optimise its industrial and energy structures, improve land use efficiency, control the scale of impervious areas, and protect cropland and ecological land.
The urban agglomeration represented by the PRD region faces the daunting task of striking a balance between urbanization and sustainability. This challenge arises from the continuous expansion of impervious areas, which leads to the reduction of cropland and ecological land. To promote sustainable development in urban agglomeration, the government needs to control the growth of impervious areas and protect cropland and ecological land, which are essential for a liveable and sustainable ecological environment. Therefore, it is necessary to conduct land use modelling and scenario analysis based on different development objectives (e.g., regional economy, agricultural production and ecological protection). This approach can simulate different future land use structures and provide multiple perspectives for regional planning decision-makers. Through this approach, we can better predict and assess the trends of land use change in urban agglomeration and provide feasible policy recommendations to balance the different objectives and ensure sustainable urban development in the future.
This paper analyses the spatial and temporal changes in land use in the PRD from 1985 to 2020 and uses the PLUS model to analyse the drivers of land use expansion for each land type, validate the land use simulation and project the land use under different scenarios for 2030. The main conclusions are.
(1) The main land use types in the PRD are cropland, forest and impervious area, followed by grassland, shrub and barren. The area of cropland decreases from 37.63% in 1985 to 27.40% in 2020, while the area of impervious area increases from 1.81% in 1985 to 12.57% in 2020. The proportion of cropland and natural landscape land decreases as the urbanisation level increases.
(2) The main trend of land use transfer in the PRD is the conversion of cropland to the impervious area and ecological space, reflecting the dual needs of urbanisation and ecological protection. Cropland is the type with the largest decrease, with a reduction of about 8,039.44 km2 and a transfer out rate of 39.13%, mainly to impervious areas and forest. Impervious area is the type with the smallest transfer out rate and the largest increase, with an expansion of approximately 5,909.39 km2 and a transfer in the rate of 86.11%, mainly from cropland, forest and water.
(3) According to the driving force analysis, economic development, population growth, accessibility, climatic factors, and topographical conditions are the main drivers of land use change in the PRD. For cropland, the main drivers of change include distance from tertiary roads, temperature, and gross regional product. Population growth, topography, and soil type are the main drivers of forest change, while population growth and gross regional product are the main drivers of shrubland change. Population numbers, precipitation, and temperature drive grassland change, while topography, temperature, and precipitation are the main drivers of water change. For barren land, distance to rail stations and airports and population growth are significant drivers, while precipitation, temperature, and topography affect impervious surfaces.
(4) The PLUS model simulation meets the requirements with an overall accuracy of 0.902052 and a Kappa coefficient of 0.837767. In the Spontaneous Change scenario, there is a significant decrease in cropland and ecological land, while impervious areas expand by 560.68 km2 from the urban center to the periphery. This expansion poses a severe threat to cropland protection and ecological construction. The Cropland protection scenario prevents cropland conversion to other types, increasing cropland area by 504.87 km2 compared to 2020 and ensuring food security efficiently. The Ecological protection scenario limits the occupation of ecological land by impervious infrastructure and other areas, restricting the expansion of impervious areas to some extent. The forest area increases by 62.37 km2, promoting ecological construction and economic development. However, this scenario may not effectively protect cropland, potentially compromising food security in PRD.
This study analyzes the historical land use in the PRD and uses the PLUS model to simulate future land use structures under different scenarios. The PLUS model integrates the differential impacts of road networks on land use changes and controllable conversion rates under different scenarios. The simulation results reveal the spatial patterns of regional land use changes under different scenarios and propose effective regulatory pathways. However, this study has certain limitations. Firstly, the parameter settings of the PLUS model are subjective. Furthermore, the transfer cost matrix and neighborhood weight values are adjusted based on the existing land use structure and previous research experience in the study area, which may introduce errors.
Future research should explore a more objective and quantitative method for parameterization. When assessing the impact of land use changes on the ecological environment, a multidimensional, multiscale, and multi-indicator approach should be adopted to comprehensively reflect the impact of land use changes on ecosystem services, biodiversity, carbon emissions, and other aspects. In formulating land use planning and management strategies, the impact of land use changes on regional sustainable development under different scenarios should be fully considered to balance the relationship between urbanization, agricultural production, and ecological protection, and achieve the optimal allocation and rational utilization of land resources.
The raw data supporting the conclusion of this article will be made available by the authors, without undue reservation.
JG: Writing–original draft, Writing–review and editing. HD: Writing–review and editing. YS: Writing–original draft, Writing–review and editing. YZ: Writing–review and editing.
The author(s) declare financial support was received for the research, authorship, and/or publication of this article. This research was funded by the Science and Technology Innovation Capacity Building Project of Beijing Academy of Agriculture and Forestry Sciences, grant number KJCX20230501; the Collaborative Innovation Platform Construction Project of Beijing Academy of Agriculture and Forestry Sciences, grant number KJCX201913; the Guangdong Provincial Philosophy and Social Science Planning Project, grant number GD23XGL067.
We thank the journal editor and reviewers.
The authors declare that the research was conducted in the absence of any commercial or financial relationships that could be construed as a potential conflict of interest.
All claims expressed in this article are solely those of the authors and do not necessarily represent those of their affiliated organizations, or those of the publisher, the editors and the reviewers. Any product that may be evaluated in this article, or claim that may be made by its manufacturer, is not guaranteed or endorsed by the publisher.
Cabral, P., Campos, F. S., David, J., and Caser, U. (2021). Disentangling ecosystem services perception by stakeholders: an integrative assessment based on land cover. Ecol. Indic. 126, 107660. doi:10.1016/j.ecolind.2021.107660
Cai, Y. P., Huang, G. H., Wang, X., Li, G. C., and Tan, Q. (2011). An inexact programming approach for supporting ecologically sustainable water supply with the consideration of uncertain water demand by ecosystems. Stoch. Environ. Res. Risk Assess. 25 (5), 721–735. doi:10.1007/s00477-011-0477-5
Chang, X. Q., Xing, Y. Q., Wang, J. Q., Yang, H., and Gong, W. S. (2022). Effects of land use and cover change (LUCC) on terrestrial carbon stocks in China between 2000 and 2018. Resour. Conservation Recycl. 182, 106333. doi:10.1016/j.resconrec.2022.106333
Chen, K. Q., Long, H. L., Liao, L. W., Tu, S. S., and Li, T. T. (2020). Land use transitions and urban-rural integrated development: theoretical framework and China's evidence. Land Use Policy 92, 104465. doi:10.1016/j.landusepol.2020.104465
Feng, Y. J., Chen, S. R., Tong, X. H., Lei, Z. K., Gao, C., and Wang, J. F. (2020). Modeling changes in China's 2000-2030 carbon stock caused by land use change. J. Clean. Prod. 252, 119659. doi:10.1016/j.jclepro.2019.119659
Floreano, I. X., and de Moraes, L. A. F. (2021). Land use/land cover (LULC) analysis (2009-2019) with google Earth engine and 2030 prediction using markov-CA in the rondonia state, Brazil. Environ. Monit. Assess. 193 (4), 239. doi:10.1007/s10661-021-09016-y
Genga, B., Zhengb, X. Q., and Fua, M. C. (2017). Scenario analysis of sustainable intensive land use based on SD model. Sustain. Cities Soc. 29, 193–202. doi:10.1016/j.scs.2016.12.013
He, J., Shi, X. Y., Fu, Y. J., and Yuan, Y. (2020). Evaluation and simulation of the impact of land use change on ecosystem services trade-offs in ecological restoration areas, China. Land Use Policy 99, 105020. doi:10.1016/j.landusepol.2020.105020
He, S. T., Wang, D. J., Zhao, P., Chen, W. L., Li, Y., Chen, X. Q., et al. (2022). Dynamic simulation of debris flow waste-shoal land use based on an integrated system dynamics-geographic information systems model. Land Degrad. Dev. 33 (12), 2062–2075. doi:10.1002/ldr.4298
Himes, A., Puettmann, K., and Muraca, B. (2020). Trade-offs between ecosystem services along gradients of tree species diversity and values. Ecosyst. Serv. 44, 101133. doi:10.1016/j.ecoser.2020.101133
Huang, L. S., Wang, B., Niu, X., Gao, P., and Song, Q. F. (2019). Changes in ecosystem services and an analysis of driving factors for China's Natural Forest Conservation Program. Ecol. Evol. 9 (7), 3700–3716. doi:10.1002/ece3.4925
Huang, Z. H., Li, X. J., Du, H. Q., Mao, F. J., Han, N., Fan, W. L., et al. (2022). Simulating future LUCC by coupling climate change and human effects based on multi-phase remote sensing data. Remote Sens. 14 (7), 1698. doi:10.3390/rs14071698
Jiang, R. Y., Xie, C. K., Man, Z. H., Afshari, A., and Che, S. Q. (2023). LCZ method is more effective than traditional LUCC method in interpreting the relationship between urban landscape and atmospheric particles. Sci. Total Environ. 869, 161677. doi:10.1016/j.scitotenv.2023.161677
Jiao, M. Y., Hu, M. M., and Xia, B. C. (2019). Spatiotemporal dynamic simulation of land-use and landscape-pattern in the Pearl River Delta, China. Sustain. Cities Soc. 49, 101581. doi:10.1016/j.scs.2019.101581
Kozak, J., Gimmi, U., Houet, T., and Bolliger, J. (2017). Current practices and challenges for modelling past and future land use and land cover changes in mountainous regions. Reg. Environ. Change 17 (8), 2187–2191. doi:10.1007/s10113-017-1217-2
Li, B. W., Yang, Z. F., Cai, Y. P., Xie, Y. L., Guo, H. J., Wang, Y. Y., et al. (2022). Prediction and valuation of ecosystem service based on land use/land cover change: a case study of the Pearl River Delta. Ecol. Eng. 179, 106612. doi:10.1016/j.ecoleng.2022.106612
Li, L., Huang, X. J., Wu, D. F., and Yang, H. (2023). Construction of ecological security pattern adapting to future land use change in Pearl River Delta, China. Appl. Geogr. 154, 102946. doi:10.1016/j.apgeog.2023.102946
Li, Q., Zhang, X. F., Liu, Q. F., Liu, Y., Ding, Y., and Zhang, Q. (2017). Impact of land use intensity on ecosystem services: an example from the agro-pastoral ecotone of central inner Mongolia. Sustainability 9 (6), 1030. doi:10.3390/su9061030
Li, R. P., Guan, Q. F., and Merchant, J. (2012). A geospatial modeling framework for assessing biofuels-related land-use and land-cover change. Agric. Ecosyst. Environ. 161, 17–26. doi:10.1016/j.agee.2012.07.014
Li, Z. T., Li, M., and Xia, B. C. (2020). Spatio-temporal dynamics of ecological security pattern of the Pearl River Delta urban agglomeration based on LUCC simulation. Ecol. Indic. 114, 106319. doi:10.1016/j.ecolind.2020.106319
Liang, X., Guan, Q. F., Clarke, K. C., Liu, S. S., Wang, B. Y., and Yao, Y. (2021). Understanding the drivers of sustainable land expansion using a patch-generating land use simulation (PLUS) model: a case study in Wuhan, China. Comput. Environ. Urban Syst. 85, 101569. doi:10.1016/j.compenvurbsys.2020.101569
Liu, M. H., Chen, H. Y., Qi, L. I., and Chen, C. (2023). LUCC simulation based on RF-CNN-LSTM-CA model with high-quality seed selection iterative algorithm. Appl. Sci-Basel. 13 (6), 3407. doi:10.3390/app13063407
Liu, W., Zhan, J. Y., Zhao, F., Yan, H. M., Zhang, F., and Wei, X. Q. (2019). Impacts of urbanization-induced land-use changes on ecosystem services: a case study of the Pearl River Delta Metropolitan Region, China. Ecol. Indic. 98, 228–238. doi:10.1016/j.ecolind.2018.10.054
Liu, Y. B., Hou, X. Y., Li, X. W., Song, B. Y., and Wang, C. (2020). Assessing and predicting changes in ecosystem service values based on land use/cover change in the Bohai Rim coastal zone. Ecol. Indic. 56, 117, 106004. doi:10.1016/j.ecolind.2019.106004
Long, H. L., Zhang, Y. N., Ma, L., and Tu, S. S. (2021). Land use transitions: progress, challenges and prospects. Land 10 (9), 903. doi:10.3390/land10090903
Msofe, N. K., Sheng, L. X., and Lyimo, J. (2019). Land use change trends and their driving forces in the kilombero valley floodplain, southeastern Tanzania. Sustainability 11 (2), 505. doi:10.3390/su11020505
Ouyang, Y. R., Cai, Y. P., Xie, Y. L., Yue, W. C., and Guo, H. J. (2021). Multi-scale simulation and dynamic coordination evaluation of water-energy-food and economy for the Pearl River Delta city cluster in China. Ecol. Indic. 130, 108155. doi:10.1016/j.ecolind.2021.108155
Pellissier, V., Mimet, A., Fontaine, C., Svenning, J. C., and Couvet, D. (2017). Relative importance of the land-use composition and intensity for the bird community composition in anthropogenic landscapes. Ecol. Evol. 7 (24), 10513–10535. doi:10.1002/ece3.3534
Qiu, S. J., Peng, J., Zheng, H. N., Xu, Z. H., and Meersmans, J. (2022). How can massive ecological restoration programs interplay with social-ecological systems? A review of research in the South China karst region. Sci. Total Environ. 807, 150723. doi:10.1016/j.scitotenv.2021.150723
Rahnama, M. R. (2021). Forecasting land-use changes in Mashhad Metropolitan area using Cellular Automata and Markov chain model for 2016-2030. Sustain. Cities Soc. 64, 102548. doi:10.1016/j.scs.2020.102548
Sun, Y., Du, H. Y., Liu, B. Y., Kanchanaroek, Y., Zhang, J. F., and Zhang, P. (2022). Evolutionary game analysis for grassland degradation management, considering the livelihood differentiation of herders. Land 11 (10), 1776. doi:10.3390/land11101776
Wang, J., Chen, Y. Q., Shao, X. M., Zhang, Y. Y., and Cao, Y. G. (2012). Land-use changes and policy dimension driving forces in China: present, trend and future. Land Use Policy 29 (4), 737–749. doi:10.1016/j.landusepol.2011.11.010
Wang, J. B., Wu, Y. F., and Gou, A. P. (2023b). Habitat quality evolution characteristics and multi-scenario prediction in Shenzhen based on PLUS and InVEST models. Front. Environ. Sci. 11, 11. doi:10.3389/fenvs.2023.1146347
Wang, Q. Z., Guan, Q. Y., Sun, Y. F., Du, Q. Q., Xiao, X., Luo, H. P., et al. (2023a). Simulation of future land use/cover change (LUCC) in typical watersheds of arid regions under multiple scenarios. J. Environ. Manag. 335, 117543. doi:10.1016/j.jenvman.2023.117543
Wei, C. J., Meng, J. J., Zhu, L. K., and Han, Z. Y. (2023). Assessing progress towards sustainable development goals for Chinese urban land use: a new cloud model approach. J. Environ. Manag. 326, 116826. doi:10.1016/j.jenvman.2022.116826
Yang, H. F., Zhong, X. N., Deng, S. Q., and Nie, S. N. (2022). Impact of LUCC on landscape pattern in the Yangtze River basin during 2001-2019. Ecol. Inf. 69, 101631. doi:10.1016/j.ecoinf.2022.101631
Yang, J., and Huang, X. (2021). The 30 m annual land cover dataset and its dynamics in China from 1990 to 2019. Earth Syst. Sci. Data 13 (8), 3907–3925. doi:10.5194/essd-13-3907-2021
Yu, G. M., Zeng, Q., Yang, S., Hu, L. M., Lin, X. W., Che, Y., et al. (2010). On the intensity and type transition of land use at the basin scale using RS/GIS: a case study of the Hanjiang River Basin. Environ. Monit. Assess. 160 (1-4), 169–179. doi:10.1007/s10661-008-0666-y
Yu, J. Q., Zhou, K. L., and Yang, S. L. (2019). Land use efficiency and influencing factors of urban agglomerations in China. Land Use Policy 88, 104143. doi:10.1016/j.landusepol.2019.104143
Zhang, J. B., Zhu, H. R., Zhang, P. Y., Song, Y. P., Zhang, Y., Li, Y. Y., et al. (2022). Construction of gi network based on mspa and PLUS model in the main urban area of zhengzhou: a case study. Front. Environ. Sci. 10, 10. doi:10.3389/fenvs.2022.878656
Zhou, M., Ma, Y. X., Tu, J. T., and Wang, M. C. (2022). SDG-oriented multi-scenario sustainable land-use simulation under the background of urban expansion. Environ. Sci. Pollut. Res. 29 (48), 72797–72818. doi:10.1007/s11356-022-20904-9
Zhou, R. B., Lin, M. Z., Gong, J. Z., and Wu, Z. (2019). Spatiotemporal heterogeneity and influencing mechanism of ecosystem services in the Pearl River Delta from the perspective of LUCC. J. Geogr. Sci. 29 (5), 831–845. doi:10.1007/s11442-019-1631-0
Keywords: land use, PLUS model, multiple scenarios, policy simulation, the Pearl River Delta
Citation: Gong J, Du H, Sun Y and Zhan Y (2023) Simulation and prediction of land use in urban agglomerations based on the PLUS model: a case study of the Pearl River Delta, China. Front. Environ. Sci. 11:1306187. doi: 10.3389/fenvs.2023.1306187
Received: 03 October 2023; Accepted: 03 November 2023;
Published: 16 November 2023.
Edited by:
Hua Lu, Jiangxi University of Finance and Economics, ChinaReviewed by:
Haipeng Zhang, Henan University, ChinaCopyright © 2023 Gong, Du, Sun and Zhan. This is an open-access article distributed under the terms of the Creative Commons Attribution License (CC BY). The use, distribution or reproduction in other forums is permitted, provided the original author(s) and the copyright owner(s) are credited and that the original publication in this journal is cited, in accordance with accepted academic practice. No use, distribution or reproduction is permitted which does not comply with these terms.
*Correspondence: Yong Sun, c3VueW9uZ0Bnemh1LmVkdS5jbg==; Hongyan Du, ZGh5QGFncmkuYWMuY24=
Disclaimer: All claims expressed in this article are solely those of the authors and do not necessarily represent those of their affiliated organizations, or those of the publisher, the editors and the reviewers. Any product that may be evaluated in this article or claim that may be made by its manufacturer is not guaranteed or endorsed by the publisher.
Research integrity at Frontiers
Learn more about the work of our research integrity team to safeguard the quality of each article we publish.