94% of researchers rate our articles as excellent or good
Learn more about the work of our research integrity team to safeguard the quality of each article we publish.
Find out more
CORRECTION article
Front. Environ. Sci. , 11 October 2023
Sec. Atmosphere and Climate
Volume 11 - 2023 | https://doi.org/10.3389/fenvs.2023.1304145
This article is a correction to:
Interdecadal variation of precipitation over Yunnan, China in summer and its possible causes
A Corrigendum on
Interdecadal variation of precipitation over Yunnan, China in summer and its possible causes
by Dong Z, Gui S, Yang R, Cheng J, Yang H and Ma J (2023). Front. Environ. Sci. 11:1281202. doi: 10.3389/fenvs.2023.1281202
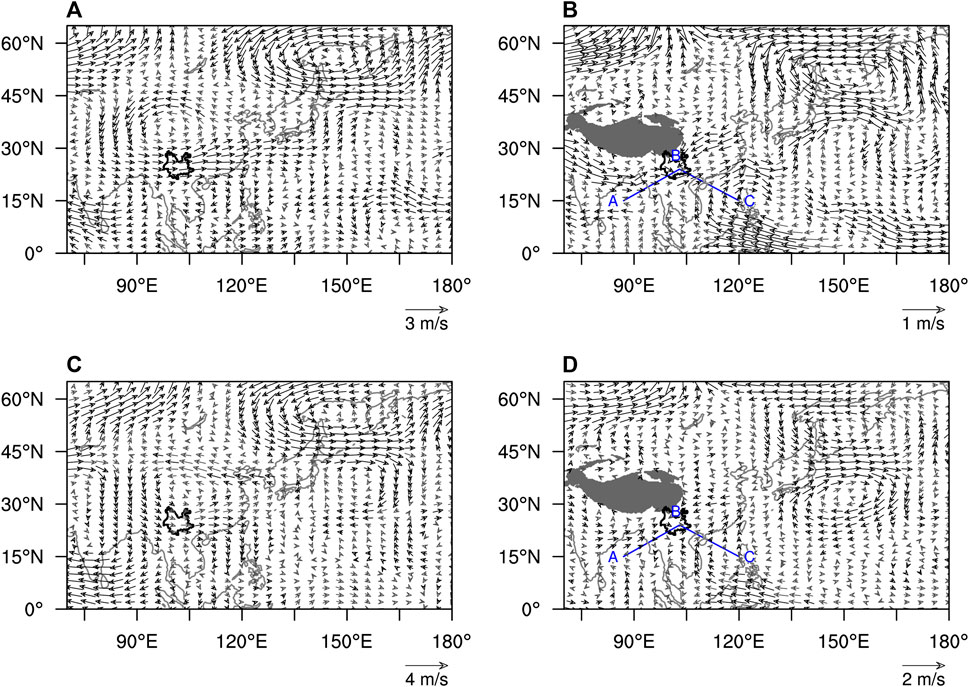
In the published article, there was an error in Figure 3 as published. The graphic printing shows abnormal amount of spacing between neighboring vectors. The corrected Figure 3 and its caption “FIGURE 3. Regression of the interdecadal component of the JJA mean (A) 200 hPa horizontal winds (vector, units: ms−1), (B) 700 hPa horizontal winds (vector, units: ms−1) against the ID-PC1. Panels (C,D) are the same as (A,B), except for the composite of the JJA mean variables between the wet and dry periods. The black vectors denote significance at the 95% confidence level. The letters (A–C) stand for three anomaly centers. The black solid line marks the boundary of Yunnan. The gray shadings in (B,D) represent the topography” appear below.

FIGURE 3. Regression of the interdecadal component of the JJA mean (A) 200 hPa horizontal winds (vector, units: ms−1), (B) 700 hPa horizontal winds (vector, units: ms−1) against the ID-PC1. Panels (C,D) are the same as (A,B), except for the composite of the JJA mean variables between the wet and dry periods. The black vectors denote significance at the 95% confidence level. The letters (A–C) stand for three anomaly centers. The black solid line marks the boundary of Yunnan. The gray shadings in (B,D) represent the topography.
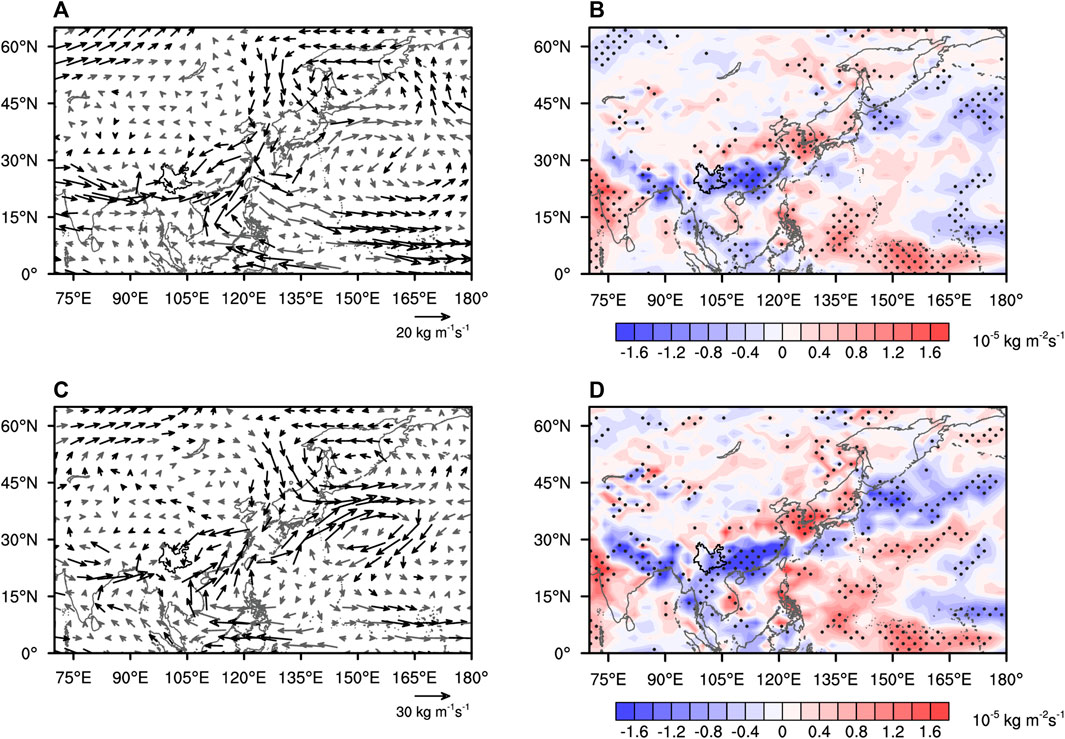
In the published article, there was an error in Figure 5 as published. The graphic printing shows abnormal amount of spacing between neighboring vectors. The corrected Figure 5 and its caption “FIGURE 5. The anomalous CIWVF in summer derived from (A) regression against the ID-PC1 and (C) composite between the wet and dry periods (units: kg m−1 s−1). Panels (B,D) are the same as (A,C) except for the CIWVFD (units: 10−5 kg m−2 s−1). The black vectors denote significance at the 95% confidence level. The stippling in (B,D) denotes significance at the 95% confidence level. The black solid line marks the boundary of Yunnan” appear below.

FIGURE 5. The anomalous CIWVF in summer derived from (A) regression against the ID-PC1 and (C) composite between the wet and dry periods (units: kg m−1 s−1). Panels (B,D) are the same as (A,C) except for the CIWVFD (units: 10−5 kg m−2 s−1). The black vectors denote significance at the 95% confidence level. The stippling in (B,D) denotes significance at the 95% confidence level. The black solid line marks the boundary of Yunnan.
The authors apologize for these errors and state that this does not change the scientific conclusions of the article in any way. The original article has been updated.
All claims expressed in this article are solely those of the authors and do not necessarily represent those of their affiliated organizations, or those of the publisher, the editors and the reviewers. Any product that may be evaluated in this article, or claim that may be made by its manufacturer, is not guaranteed or endorsed by the publisher.
Keywords: precipitation, interdecadal variation, SST configuration, Gill-Matsuno response, Bay of Bengal, Western Pacific warm pool, Western North Pacific subtropical high
Citation: Dong Z, Gui S, Yang R, Cheng J, Yang H and Ma J (2023) Corrigendum: Interdecadal variation of precipitation over Yunnan, China in summer and its possible causes. Front. Environ. Sci. 11:1304145. doi: 10.3389/fenvs.2023.1304145
Received: 29 September 2023; Accepted: 02 October 2023;
Published: 11 October 2023.
Edited and reviewed by:
Hainan Gong, Chinese Academy of Sciences (CAS), ChinaCopyright © 2023 Dong, Gui, Yang, Cheng, Yang and Ma. This is an open-access article distributed under the terms of the Creative Commons Attribution License (CC BY). The use, distribution or reproduction in other forums is permitted, provided the original author(s) and the copyright owner(s) are credited and that the original publication in this journal is cited, in accordance with accepted academic practice. No use, distribution or reproduction is permitted which does not comply with these terms.
*Correspondence: Ruowen Yang, eWFuZ3J1b3dlbkB5bnUuZWR1LmNu
†These authors have contributed equally to this work
Disclaimer: All claims expressed in this article are solely those of the authors and do not necessarily represent those of their affiliated organizations, or those of the publisher, the editors and the reviewers. Any product that may be evaluated in this article or claim that may be made by its manufacturer is not guaranteed or endorsed by the publisher.
Research integrity at Frontiers

Learn more about the work of our research integrity team to safeguard the quality of each article we publish.