 Ahmed M. El-Zeiny
 Hoda Nour-Eldin2
94% of researchers rate our articles as excellent or good
Learn more about the work of our research integrity team to safeguard the quality of each article we publish.
Find out more
ORIGINAL RESEARCH article
Front. Environ. Sci. , 07 December 2023
Sec. Environmental Informatics and Remote Sensing
Volume 11 - 2023 | https://doi.org/10.3389/fenvs.2023.1292495
Assessing natural vegetation through conventional methods faces considerable constraints, such as limited geographical scope, reduced precision, a lack of historical data, high expenses and time demands. The study aims to use environmental and spectral data to identify and map natural vegetation and plant species along the Mediterranean coast of Egypt. This involves employing spatial analyses and cartographic modeling techniques, marking an initial effort in this endeavor. To fulfill this aim, a total number of 70 wild plant habitats were surveyed and sampled for further laboratory identification of plant species. Multispectral and thermal bands of Landsat imagery were processed to generate land cover map, as well as calculate Normalized Difference Vegetation Index (NDVI) and Land Surface Temperature (LST) to be integrated with the naturally grown plants in a cartographic model to predict the wild plant habitats. Coastal wild plant habitats were sparsely located and associated with a vegetation density ranging from 0.096 to 0.280 with an average of 0.167. Besides, the LST of these habitats fluctuated from 30.559 to 38.652 with an average of 34.361°C. Although the wild plant habitats at the Northern coastal region of Egypt are similar in environmental and climatic conditions, there are variability in NDVI and LST of each single habitat (pure or mixed). On the other hand, the lowest LST were associated with Erodium laciniatum/Rumex pictus and Erodium laciniatum habitats reporting 30.559 and 30.741°C, respectively. However, Lotus halophilus mixed with Ifloga spicata habitats reported the highest LST (38.652°C). The high vegetation density is mainly characterized by low LST which indicates the mixed wild plant habitats. The developed cartographic model showed a narrow strip along the Mediterranean region as highly suitable habitats for wild plant growth. The model can be used to map pure and mixed habitats of various wild plants with an accuracy exceeding 90%. The model was applied for mapping Arthrocnemum macrostachyum showing that the middle coastal region is most suitable for its growth. It’s recommended to integrate remotely sensed data with spatial analyses for the environmental analyses of natural plants. Present findings support researchers and scientists interested in environmental, botanic, and medical studies.
The coastal region, with its diverse ecosystems, provides significant locations for the development of natural resources. These habitats are, however, being severely degraded as a result of the extraordinary urbanization. The population of the coastal urban areas in Egypt was 4246000 in 1980, and it was anticipated to rise. The country’s coastline is 2450 km long where many human activities that have a significant negative impact on all environmental factors are distributed in the coastal region (Shaltout et al., 1995; Elagami et al., 2022).
The most valuable rangeland in Egypt is found in the Mediterranean area. It is well known that the area was prosperous (from the perspective of land use) as early as Graeco-Roman periods. From the eleventh century A.D., unchecked farming, grazing, and chopping have severely degraded the soil and destroyed the natural ecosystems (Zahran and Willis, 2008). Due to the present growth in Egyptian population, Delta’s seashore is seeing more human disturbance. The development of tolerant crops with salinity, including rice, substantially helped to restore the fertility of these saline soils, and drains have been built to reduce water-logging and salinity dangers (Imam and Kosinova, 1972; Batanouny, 1999; Abd El-Hamid et al., 2023).
Although studies of the eastern region (east Alexandria), particularly those of the Nile Delta, are still scarce, those of the western Mediterranean desert (west Alexandria) have been the focus of extensive floristic, phytosociological, and ecological studies. Egypt’s most vegetative and florally diverse region is the Mediterranean coastal region west of Rosetta. This area is divided into two zones, one in the west, from Alexandria to Sallum near the Lybian border, and the other in the east, spanning from Rosetta to Alexandria (Batanouny and E1-Fiky, 1984; E1-Demerdash et al., 1994; Shaltout et al., 1992). Due to the Nile’s enrichment with clay minerals, the sediments in the eastern zone are low in carbonate content and generally dark in colour; in contrast, the sediments in the western zone are mostly made up of calcareous grains and are far less contaminated by clay deposits. The latter region, known as Mareotis (or Mariut), is distinguished by a variety of landforms that exhibit a wide range of environmental and vegetative spectral characteristics. Therefore, two different habitats are notable, one on hills and the other in depressions. The ridge habitats can be further sub-divided into two primary types: coastal ridges, which are primarily made of dunes and snow-white calcareous sand grains, and inland ridges, which are less calcareous (Bornkamm and Khel, 1990).
Habitats vary depending on how close to the soil surface the water table is, which affects salinity levels and the amount of waterlogging (Ayyad, 1973; Abd-ElGawad et al., 2020). Several researches have looked into the relations between land cover characteristics as well as changes and the LST distribution. The number of different land cover types present in a given spatial unit is known as the landscape composition. There is ample evidence that the composition of the terrain affects urban LST (Lu et al., 2020).
According to Gogoi et al. (2019), changes in land use and land cover over eastern India were responsible for 25%–50% of the observed overall warming. In Raipur, Guha et al. (2019) examined the link between seasonal variations in LST and spectral indices such the normalized difference vegetation index (NDVI) and the normalized difference built-up index (NDBI). Metrics for measuring the spatial qualities or arrangement of land cover patches are known as landscape configuration metrics. These measurements have been used to investigate the effects of land cover size, shape, and segmentation on LST (Li and Wang, 2009; Mohamed et al., 2019).
The association between landscape indicators including patch density, largest patch index, aggregation index, and surface temperature was described by Xie et al. (2020) using structural equation models. Despite these attempts, the variety of urban contexts prevents a complete understanding of the link between the UHI and land cover composition and spatial organization. In case studies of various towns, there have been conflicting connections between land cover patterns and LST. They also demonstrated that the relationship between LST and landscape composition depended on scale.
Many studies on remote sensing in vegetation have been conducted in the VNIR and SWIR areas, concentrating on the biochemical and biophysical characteristics of vegetation (Neinavaz et al., 2021). In studies of vegetation, thermal remote sensing has barely been investigated. The spectral behavior of plants in the TIR region has been somewhat misinterpreted due to a number of challenges, including the complexity of vegetation spectral properties and the lack of adequate instruments with a low signal to noise performance (Ullah et al., 2012; El-Zeiny and El-Kafrawy, 2017; Neinavaz et al., 2021).
Although remote sensing products have the potential to be used in plant biodiversity modelling (Cord et al., 2013; Turner, 2014), investigations of species-environment relationships have only lately focused on incorporating these data; majority of these research employ bioclimatic data (West et al., 2016). Early attempts suggested that remote sensing products did not appear to improve the accuracy of estimating species distributions; however, more recent research indicates that, in spite of these apparent drawbacks, remote sensing products offer improved spatial resolution that makes it possible to distinguish habitat characteristics that are not captured when using bioclimatic data. Additionally, they can be used as stand-ins for biotic and/or functional predictors, such as NDVI or LAI, which improve the performance of individual species models (Cord et al., 2013; Pinto-Ledezma and Cavender-Bares, 2020).
The Mediterranean coastal land of Egypt is vegetationally and floristically the richest part of Egypt and wasn’t spatially investigated. Consequently, the present paper aims to monitor the environmental variables associated with different plant species and delineate different habitats using remote sensing imagery and GIS technology. Further, a novel model will be generated in order to predict wild plant habitats in the coastal region of Egypt.
The research area is situated in the governorates of Damietta, Aldaqhliah, and Kafr Alshikh along the Mediterranean Sea coast. It lies between longitudes 31° 10′ to 31° 40′ E and latitudes 31° 25′ to 31° 35′ N at the Northern Nile Delta of Egypt. It covers a total area of 905.026 km2 and extends offshore of Damietta for around 7 km (Figure 1). Burullus Lake, Port Said Governorate, Aldaqhliah Governorate, and the Mediterranean Sea form its western, eastern, southern and northern borders, respectively. The research area’s shoreline stretches from Port Said city in the west to Gamasa city (Aldaqhliah Governorate) in the east for roughly 53 km. In the Nile Delta’s coastal zone, natural and human-induced changes have led to a variety of issues, including coastline erosion brought on by sedimentation in the inlets, estuaries, and ports of the coastal lagoons. The agricultural and urban regions along the delta promontories at Rosetta, Burullus, and Damietta have suffered from erosion. A prospective location for industrial activity and energy resources is the Nile Delta’s coastline zone. Moreover, it has significant wetland ecosystems. It has undergone several changes over the past few decades and has been significantly impacted by various forms of human activity as well as ongoing changes in the land use and cover of the region. This increases the amount of pollutants being released into the environment from many types of sources (El-Zeiny et al., 2022a).
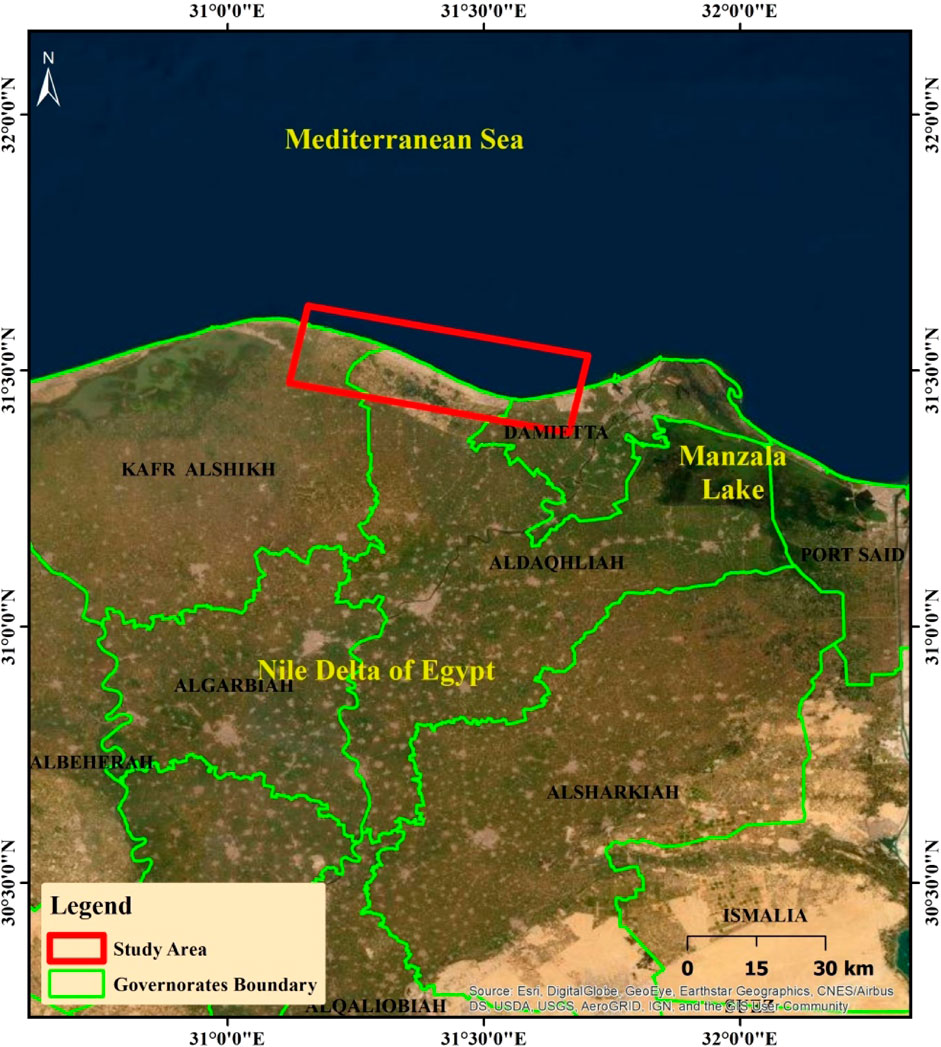
FIGURE 1. Location map showing the area of investigation.
The study area is located in Mediterranean climate, with varying monthly rainfall during the winter season, ranging from 26 mm in January to 18mm and 13 mm in February and March, respectively. Temperature levels are influenced by the season, with high temperatures in the summer, peaking at 31°C in August, and relatively cooler conditions in the winter, where temperatures dip to 18°C in January.With warm temperatures for the most of the year, the region’s climate is typical of the Mediterranean region. In the research area, the predominant wind direction is almost always northwest, which creates a broad, eastward-flowing longshore current. Statistics show that 81% of these waves originate in the northwest, 14% in the northeast, and 5% in the southwest. Although spring season virtually records the smallest wave height of 1.16 m that originates from the northwest direction, winter season nearly records the highest wave height of 4.2 m that is primarily from the west-northwest wave direction. Semi-diurnal tide changes vary between 25 and 30 cm along the delta shore (El-Zeiny et al., 2022b). The soil characteristics are classified as “thermic” for the soil temperature regime and “torric” for the soil moisture regime according to the USDA soil taxonomy system (soil survey sataff, 1996. Regarding soil texture, the northern part of the study area encompasses a range from various soils to loamy sand, while the southern region displays a diversity from loamy clay to sandy clay loam.
Throughout Egypt’s northern coastal region, 70 various stands were picked (Figure 2). Five plots of 25 m2 each were used to record all plant species for each stand, and one sample stand was used to determine species abundance (frequency, IV = 100). According to Boulos (1999-2005) and Tackholm (1974), the taxonomic nomenclature, identity, and chorotype of plant species were evaluated. Yet, biological forms were recognized using the Raunkiaer method (1937). All of the investigated stands’ geographic locations were noted in order to build a database using ArcGIS V 10.5 that was attributed with additional analysis.
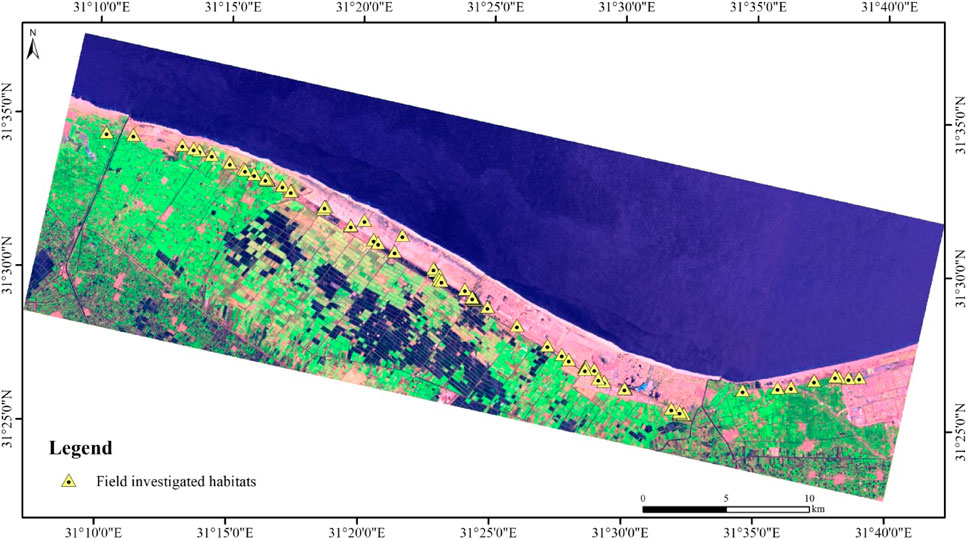
FIGURE 2. Location of field investigated localities.
Two multispectral Landsat imageries (ETM and OLI) from March 2012 and March 2022, respectively, were downloaded for the area under investigation. The geographic Tagged Image-File formatted dataset was produced by the U.S. Geological Survey (GeoTIFF). The data type is level 1, and it derives from sensor and satellite data that offers systematic radiometric and geometric correctness. The research area is located in one scene; 177-38. The fundamental preprocessing processes for rectifying Landsat data were radiometric calibration and atmospheric correction, after which a mosaic was made and clipped to resize the research region. It is required to do radiometric correction in order to track actual landscape changes as shown by fluctuations in surface reflectance from multitemporal satellite imageries. Corrections for topography and sun angle, the sensitivity of the distant sensor, and air scattering and absorption are only a few of the methods utilised in radiometric calibration, a procedure used in image processing.
To enhance visual details, image processing is used to modify and alert the original raw data. The data must be digital raster data in order to be used with image processing software. The Landsat data that is being used is already in digital raster format. Many mathematical procedures can be carried out using these picture elements (Pixels) (Lillesand and Kiefer (1994).
ENVI 5.3 was used to process multi-temporal calibrated Landsat image to create the Normalized Difference Vegetation Index (NDVI), a metric for the health of green vegetation. It is robust under a variety of situations due to the normalized difference formulation and usage of the maximum reflectance and absorption regions of chlorophyll. This index was used to describe each habitat for wild plants and keep track of changes to those habitats.
Maximum likelihood classifier was applied to pro-duce a land cover map for the study area to define the different land cover classes within Northern Coastal Zone of Egypt. The accuracy of classification was confirmed thought field validation visits. The original false-color images and GPS points were used to deter-mine and verify the locations in the classified images with the locations in the field. Depending on the supervised classification and field survey, the study area will be cate-gorized into 5 classes; urban, cultivated area, sea water, sand, and fish farms.
Temperature information is gathered by the Landsat 6, 8, and (ETM and OLI) sensors and is stored as a digital number (DN) with a range of 0–255. A comparison is possible because all of the photographs were shot at roughly the same time and during the same season. These DNs can be converted to degrees Kelvin using a two-step procedure. Using the bias and gain values specific to each scene, the DNs are first converted to radiance values in the second phase, which involves converting the radiance data from step one into degrees Kelvin (Coll et al., 2010).
The Level 1G (TM&OLI) imagery utilized in this study was broken down into its individual bands’ digital numbers (DNs), which were then translated into actual measurements of sensor radiance
For Landsat 6 TM thermal band:
For Landsat 8 OLI thermal band:
Where Q_cal is the band 10 image, A_L is the band specific additive rescaling factor, and O_i is the band 10 correction, where M_L represents the band-specific multiplicative rescaling factor.
Eq. 1 was applied to translate spectral radiance to at-sensor brightness temperature.
Where, TBis the brightness temperature in Kelvin (K), Lλ is the spectral radiance in Wm−2sr−1, K1 and K2 are the prelaunch calibration constants:
For Landsat-5: K1 is 607.76 and K2 is 1260.56.
For Landsat-8: K1 is = 774.8853 and K2 is = 1321.0789 (W
The brightness temperatures acquired above must be adjusted using the emissivity of surface materials in order to obtain the land surface temperatures. Urban surfaces have been treated with emissivity ranging from 0.87 to 0.97, with the majority of values falling within 0.92–0.95. This is a succinct overview of the technique; 1) The mean emissivity value utilized in this study was 0.97, and if the NDVI is less than 0.2, the pixel is thought to be bare soil. 2) If the NDVI is higher than 0.5, the pixel is taken to be fully vegetated, and an average value of 0.99 is used as the emissivity (ε) constant, 3) If the NDVI values are more than 0.2 and less than 0.5, the pixel is made up of a combination of bare soil and vegetation, and the emissivity is determined using Eqs. 2, 3.
where
After obtaining the emissivity photos, the LST can be determined using Eq. 4:
Where
The present methodology adopts an innovative approach for assessing and mapping the wild plant habitats through integrating multi-data sources (Figure 3). MSS and TIRS bands of Landsat imagery were processed to produce NDVI and LST at the northern Nile delta. A field survey was conducted to the wild plant habitats to define each locality and investigate the available plants. The environmental characteristics of various natural plant sites were defined and used for modeling all available wild plant habitats in the whole study area. The developed model is applicable in a similar environment and can be widely used. The density of vegetation and LST are the input criteria of the model that were reclassified considering their corresponding values at various wild plant habitats then a weighted overlay model was developed to aggregate the most suitable sites for natural plant growth. This model may be specified considering the levels of a certain plant presented as pure or mixed with other plant species. It was tested to map Arthrocnemum macrostachyum habitats (pure and mixed). The model was validated using the actually surveyed sites.
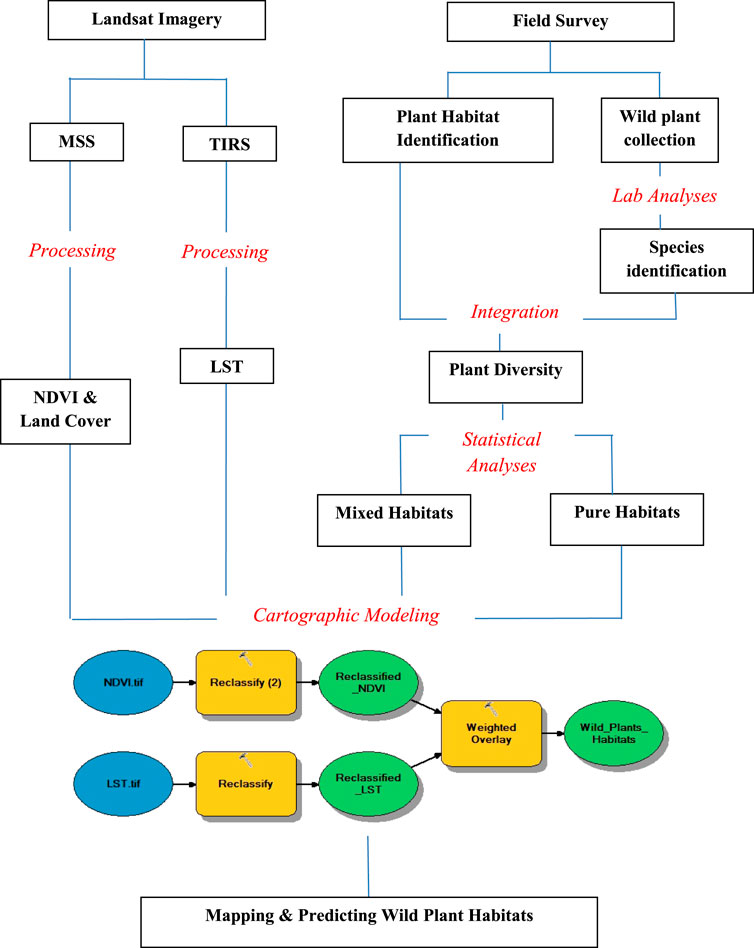
FIGURE 3. Methodology adopted to achieve the study aims.
Through 70 sites in the northern Nile Delta (Damietta, Aldaqhliah, and Kafr Alshikh Governorates), a total of 67 plant species were identified (37 annual, 1 biennial, and 29 perennial species) belonging to 56 genera and 21 families (Table 1). Rainy weather allowed for accurate sampling. Annuals have a better chance of flowering during the rainy season. Polygonaceae contained the fewest species, with just three, compared to 15, 13, 7, 4 and 4, found in Poaceae, Asteraceae, Chenopodiaceae, Brassicaceae, and Caryophyllaceae, respectively. Two species each were found in the families Cyperaceae, Zygophyllaceae, Boraginaceae, and Aizoacea. These nine families accounted for 80.61 percent of the recorded species and largely defined the floristic composition of the research region, whereas the other eleven were monotypic and accounted for just 17.91 percent of the species. Due to their ability to adapt to adverse circumstances and successfully disperse their diaspores by wind, the Asteraceae and Poaceae span a vast ecological range (Oudtshoorn and Rooyen, 1999). The poaceae family has adapted to withstand heavy grazing and prolonged periods of drought. They were able to successfully scavenge moisture from the soil due to the extensive network of shallow, highly rami-fied roots (Stanley, 1999). There are several main plant families in Egypt’s flora, not only the Asteraceae (Boulos, 2002; El-Amier and El Hayyany, 2020), which is the biggest and most extensively distributed family of flowering plants in the world.
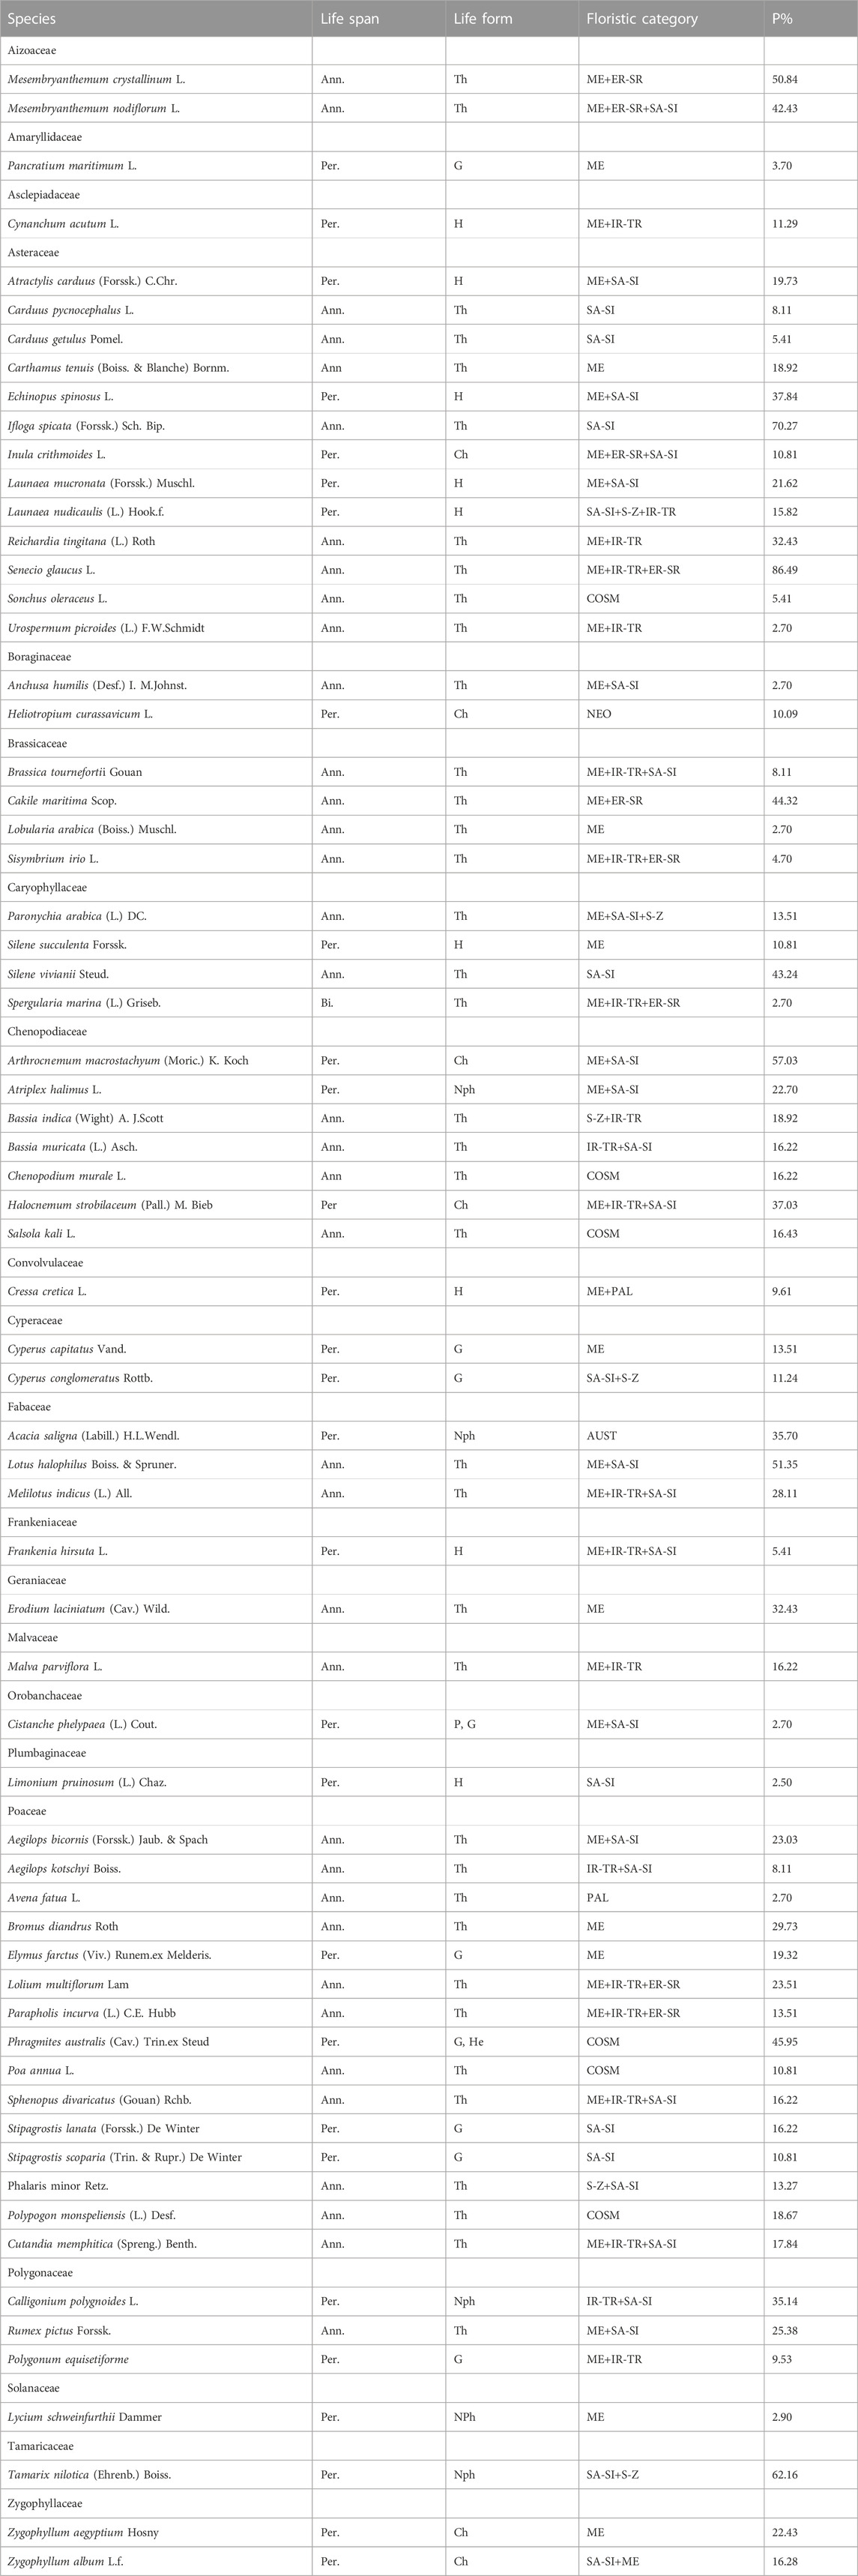
TABLE 1. The research area’s reported plant species feature a diversity of floral compositions and life forms: Th: Therophytes, G: Geophytes, P: Parasites, H: Hemicryptophytes, Ch: Chamaephytes, He: Helophytes, Nph: Nanophanerophytes; Chorotypes: COSM: Cosmopolitan, PAL: Palaeotropical, ME: Mediterranean, ER-SR: Euro-Siberian, SA-SI: Saharo-Sindian, IR-TR: Irano-Turanina, S-Z: Sudano-Zambezian, AUST: Australian.
Most of the species found in this study were therophytes (56.71%), followed by geophytes (14.93%), hemicryptophytes (13.43%), chamaephytes (8.96%), nanophanerophytes (7.46%), and parasites (1.49%). According to El-Amier et al. (2014), therophytes dominance over other living forms appears to be a reaction to the hot, dry climate, changes in the morphology of the land, and disturbances from people and animals. They can handle the heat and lack of rain in the area because they spend most of their lives as seeds (Asri, 2003; El-Husseini et al., 2008). These results match what El-Amier and Abdul-Kader (2015) found about the range of plants in dry areas of the Middle East. The chorological study of the listed plants found that 45 species, or 67.16%, were from the Mediterranean, while Saharo-Sindian groups made up 50.75% of the total number of species. The fact that Saharo-Sindian and Mediterranean elements were able to move into this area could explain why there are so many of them there, as well as the human effect. Plants from the Saharao-Arabian region are well suited to desert conditions, whereas Mediterranean species exhibit a more mesic environment, according to El-Demerdash et al. (1994); El Amier and El Hayyany (2020).
The study area was covered with five land use/cover classes. The sea water and cultivated area are the dominated classes which are represented 426.07km2 (47%), 310.89 km2 (34%) respectively. The study area contains a fish farm which is in the center of the study area and surrounded with cultivated land. The area of the fish farm is about 32 km2 (3%). The urban class in the produced LC map represents all residential and industrial areas in the study area (e.g., cities, villages, new/old buildings, and industries). It represents an area of 90.9 Km2 (10%) additionally sand class which is represented by an area 41.64 km2 (4%). Table 2 and Figure 4 show the land cover map of the study area and the areas of classes.
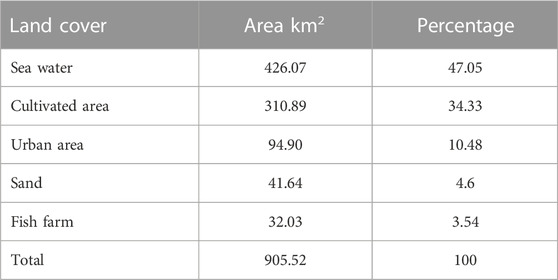
TABLE 2. The areas of land cover classes.
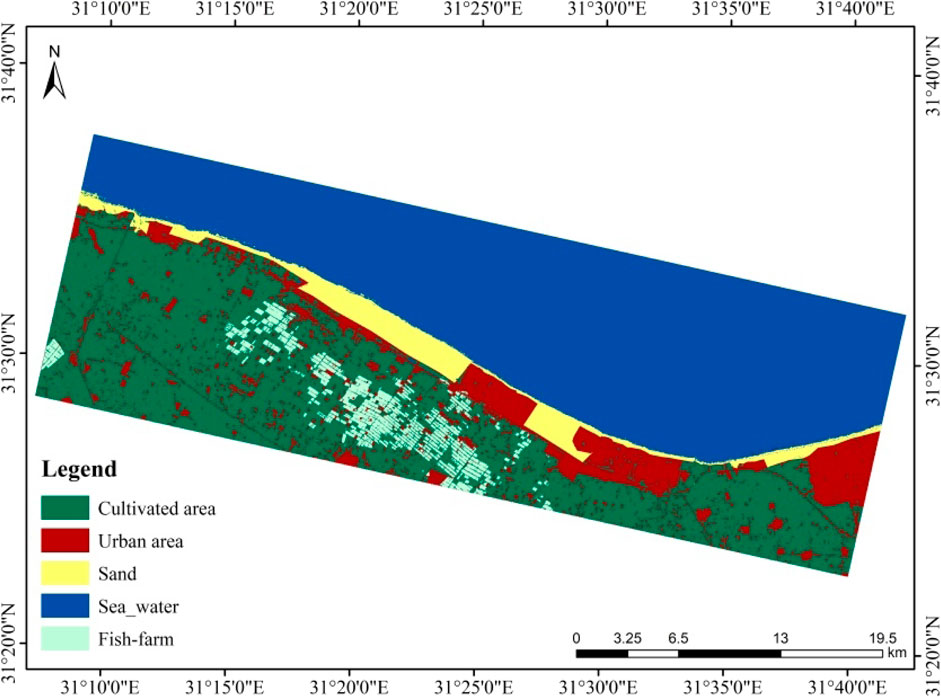
FIGURE 4. Land cover map of the study area.
Natural and anthropogenic activities accelerate the changes in natural habitats including wild plants. Thus, these changes were assessed in the present study considering the NDVI and LST changes during the period 2012-2022 (Figures 5, 6). The mean values of vegetation index increased from 0.03 to 0.08 at 2012 and 2022 respectively mainly due to the increase in vegetated areas along the investigated region (wild and crops). This might be due to the increase in natural plants as a result of natural factors (e.g., climate, rainfall, etc.) which can simulate the proliferation of wild plant habitats which is in agreement with El-Zeiny et al. (2022a).
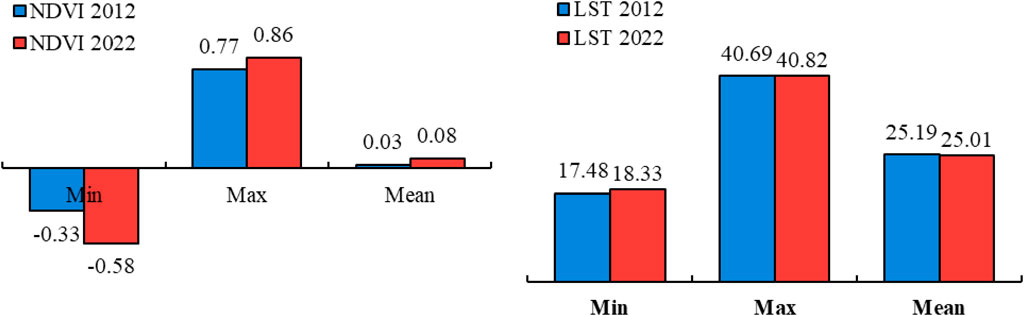
FIGURE 5. Changes in vegetation density.
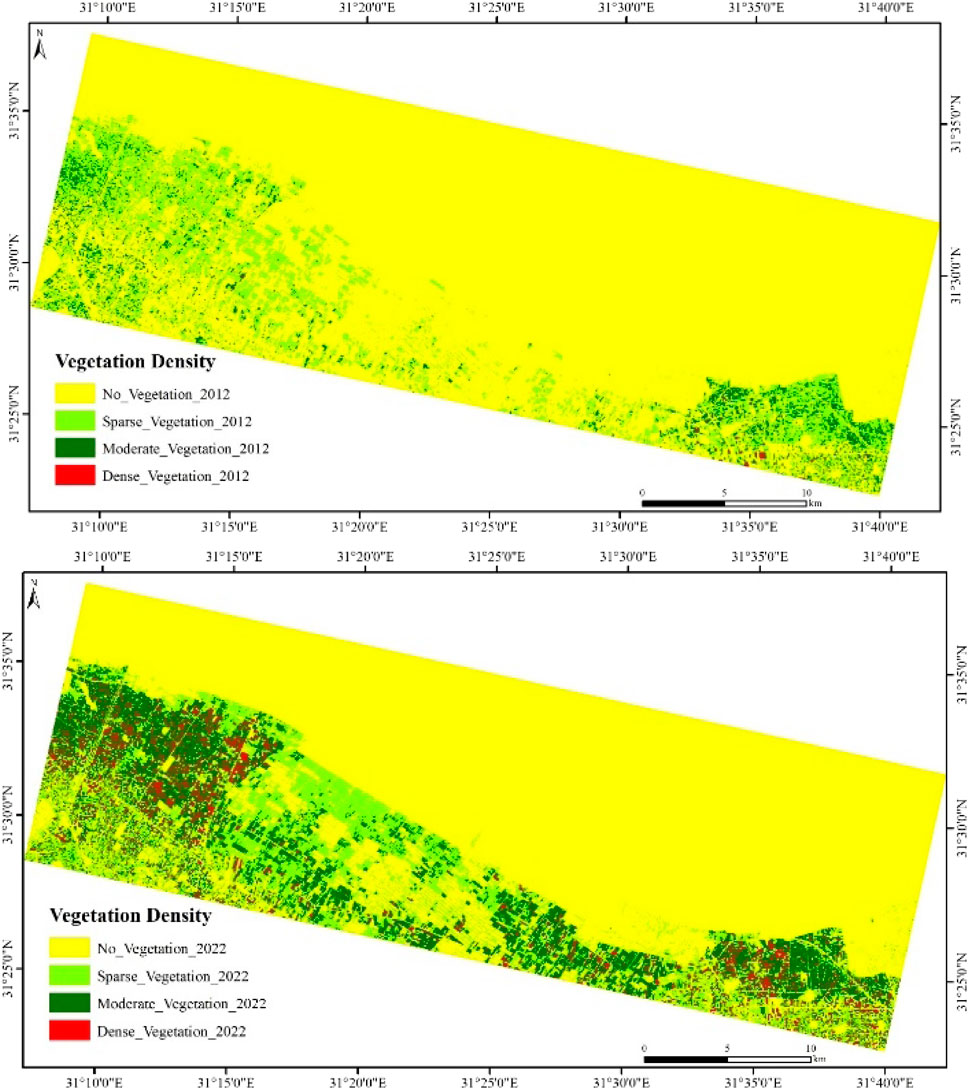
FIGURE 6. NDVI maps at 2012 (Upper) and 2022 (Lower).
By assessing the changes in density of each vegetation cover class, it was found significant increases in sparse class from 126.88 to 146.59 km2, moderate class from 29.47 to 129.50 km2 and dense class from 0.75 to 23.24 km2 due to the natural vegetation and agricultural lands expansion. The urban expansion and vegetation increase mainly occurred on expense of the bare lands along the coastal region. In general, human activity threatens biodiversity in at least five ways: the first is agricultural/industrial expansion, the second is overharvesting and logging of plant species, the third is pollution, the fourth is a significant driver of biodiversity loss, and the fifth is climate change, which exacerbates nature’s loss (Eid et al., 2020). The class of moderate and dense vegetation was characterized by an expansion of agricultural fields along with urban sprawl and residential amenities. As a result, this rise in the classes of vegetation that are sparse, moderate, and thick is offset by a decline in the class of vegetation that is nonexistent.
The maximum increase in dense vegetation was found in New Damietta and Baltim cities at the eastern and western boundaries respectively. However, the natural vegetation was mainly increased along Aldaqhliah shoreline specifically in Gamasa. These are pioneering regions for urbanization and industrialization (El-Sonbati et al., 2012; Mohamed et al., 2015; Hendawy et al., 2019). Although the northern coastal region is subject to continuous changes as a result of different factors and processes (Figures 7, 8), the mean LST doesn’t show a significant change between 2012 and 2022; 25.19 and 25.01°C respectively. This is due to the effect of the Mediterranean Sea which cause a stability in LST temperature as reported by El-Zeiny et al. (2022b) at Port Said Governorate.
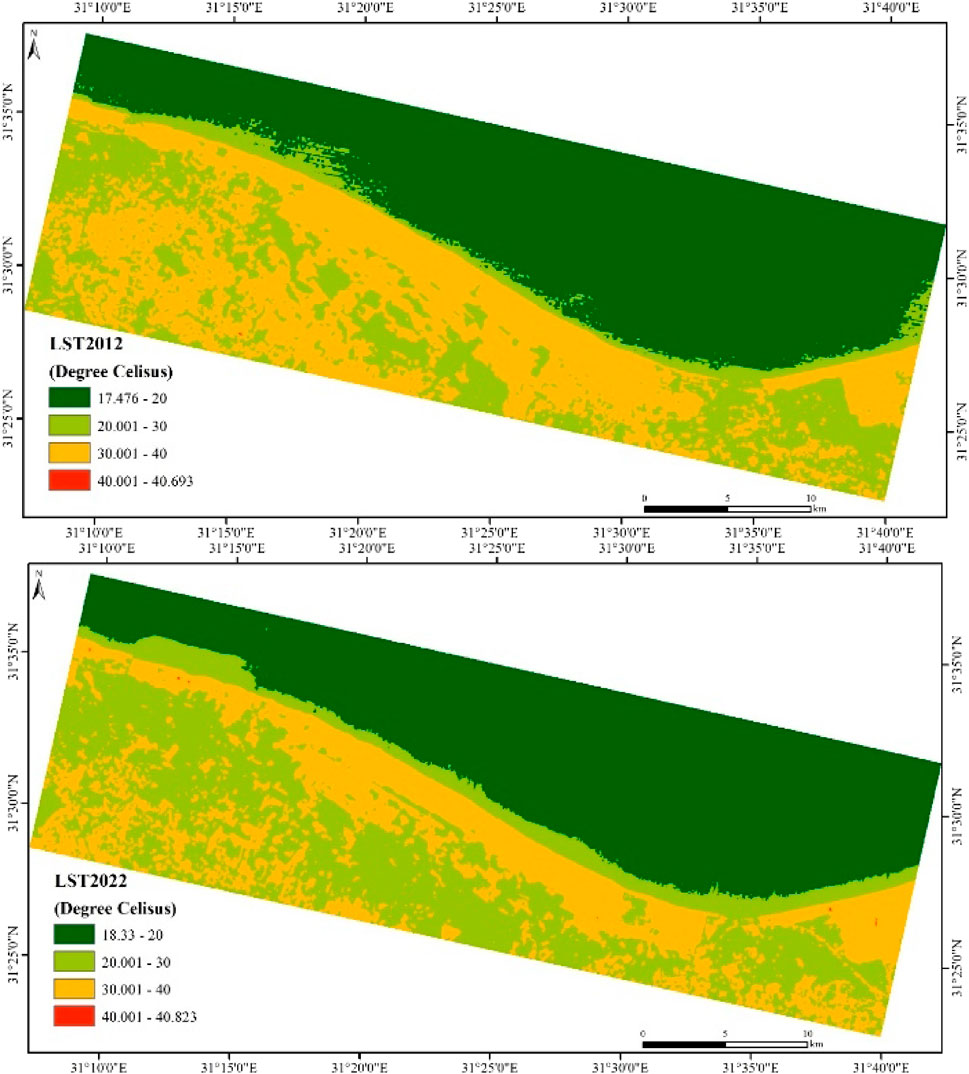
FIGURE 7. LST maps at 2012 (Upper) and 2022 (Lower).

FIGURE 8. Statistics of LST (oC) at different years.
To assess the density of vegetation and the optimal temperature for wild plant habitats in the northern parts, NDVI and LST were calculated and retrieved at the surveyed habitats as shown in Table 3. Coastal wild plant habitats are sparsely located and associated with a density ranging from 0.096 to 0.280 with an average of 0.167 as shown in NDVI analyses. Besides, the LST at these habitats fluctuated from 30.559 to 38.652 with an average of 34.361 C. Although the wild plant habitats at the Northern coastal region of Egypt are similar in environmental and climatic conditions, there are variability in NDVI and LST of each single habitat. This is a result of the quantity and variety of plants present. Pre-symptomatic or pre-visual water stress in vegetation can be identified and measured using TIRS measurements of plant temperature (Gerhards et al., 2019). Thus, the plants dominating each habitat were identified and represented considering LST and NDVI as shown in Figure 9. The lowest NDVI value (0.096) was associated with the mixed habitats containing Halocnemum strobilaceum and Rumex pictus however the highest density (0.280) was found in Melilotus indicus pure habitats. Some mixed wild plant habitats along the coastal region showed a moderate density such as Lotus halophilus/Ifloga spicata habitat and Cakile maritima/Anchusa humilis. On the other hand, the lowest LSTs were associated with Erodium laciniatum/Rumex pictus and Erodium laciniatum habitats reporting 30.559 and 30.741°C, respectively. However, Lotus halophilus mixed with Ifloga spicata habitats reported the highest LST (38.652 C). There are different factors affecting the thermal characteristics of each plant species. The reflectance of the upper and lower leaf surfaces varies, according to Gates and Tantraporn (1952). They added that older leaves and top leaf surfaces have considerably greater reflectance values than younger leaves and lower leaf surfaces.
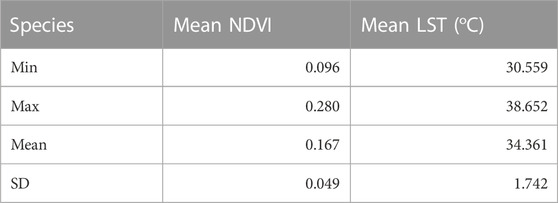
TABLE 3. Statistics of NDVI and LST at various wild plant habitats.
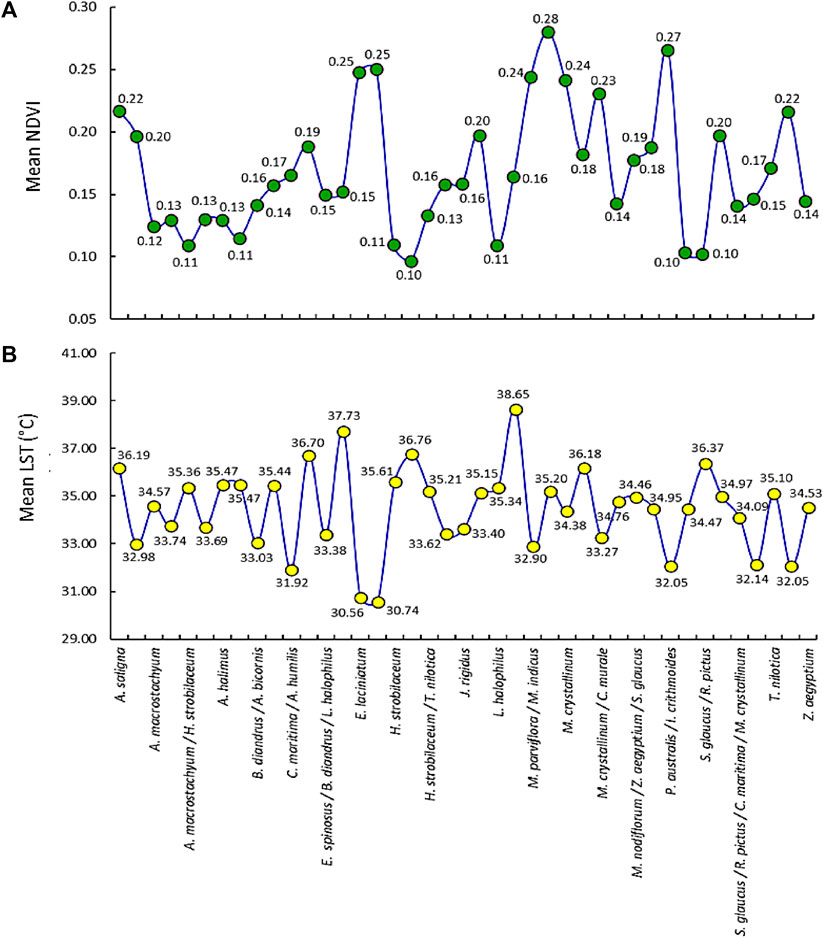
FIGURE 9. (A) mean values of NDVI, and (B) mean values of LST (°C) at different pure and mixed plant habitats.
Assessing the NDVI and LST at pure and mixed wild plant habitats showed an increase in density of mixed plants than the pure habitats (Tables 4, 5; Figures 10, 11). Reversely, the LST of mixed habitats are lower than the pure ones. NDVI ranged from 0.109 to 0.280 with a mean of 0.172 in pure habitats and from 0.115 to 0.266 with a mean of 0.182 in mixed habitats. Further, LST fluctuated from 30.741 to 37.728 with a mean 34.905 and from 30.559 to 38.652°C with a mean 33.859 C. Pure environments have similarities because the two leaf sides’ reflectance spectra are neither visibly nor consistently different. The reflectance spectra of leaves of the same species but of various ages are extremely similar in the TIR domain (Wong and Blevin, 1967).
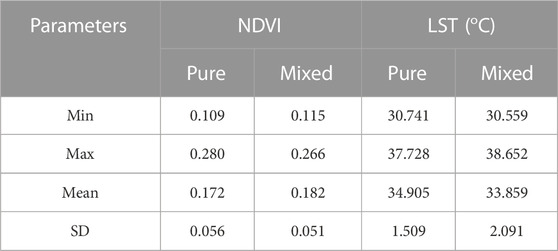
TABLE 4. Statistics of NDVI and LST for pure and mixed habitats.
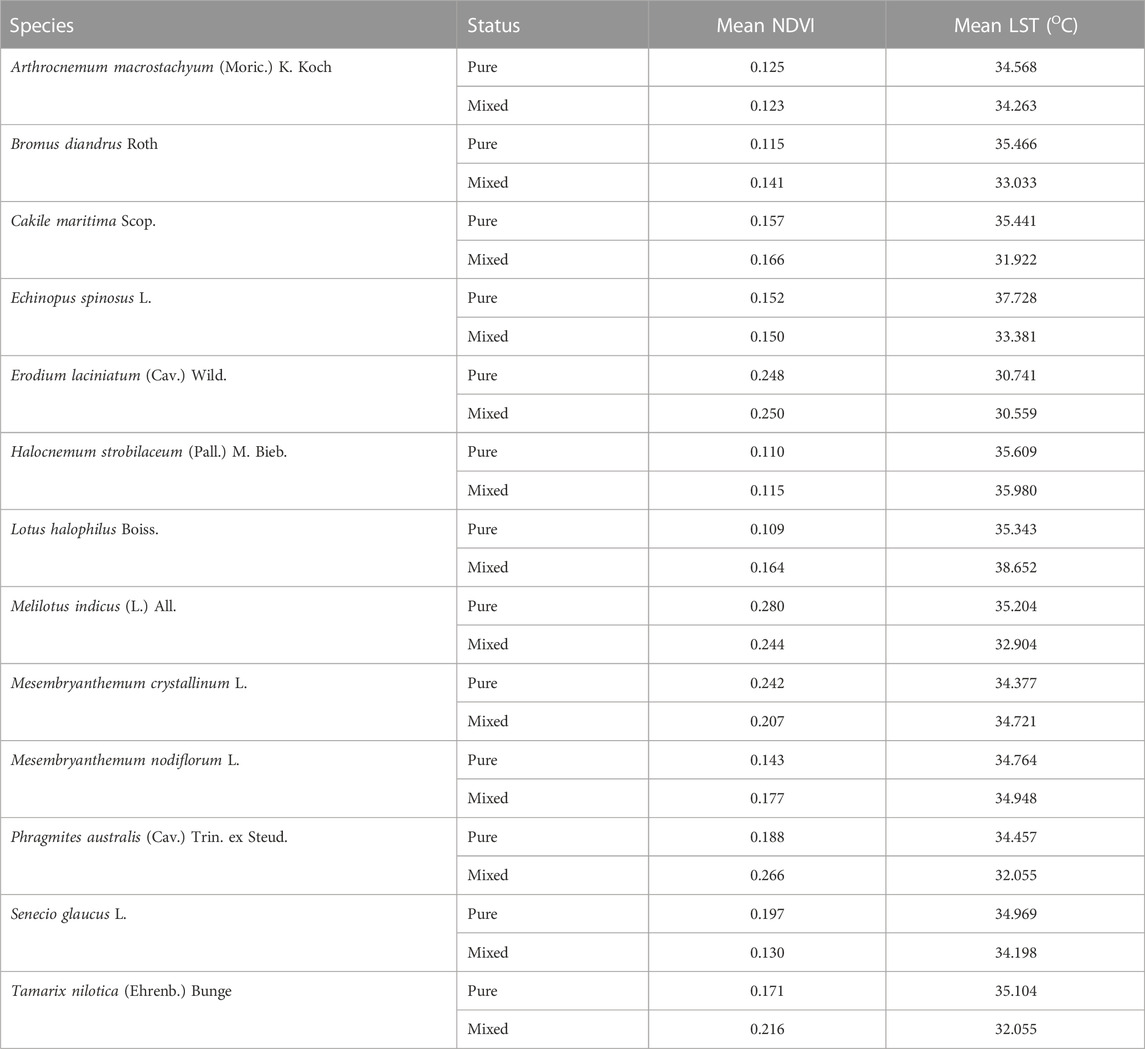
TABLE 5. Mean values of NDVI and LST for pure and mixed habitats.
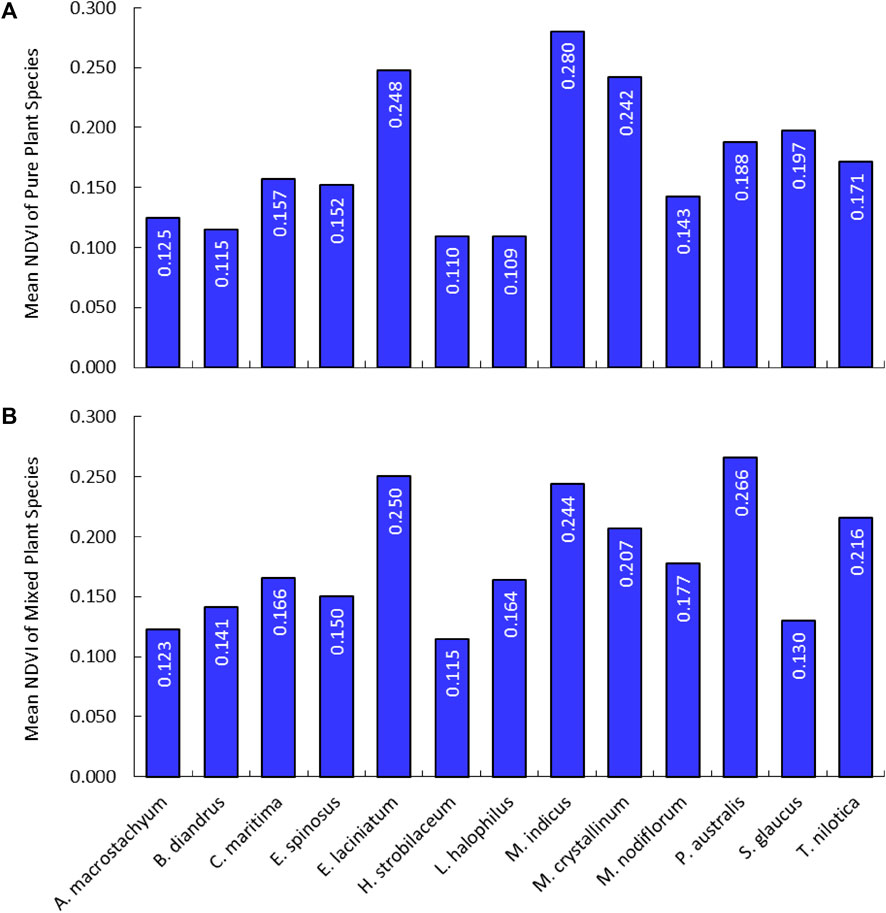
FIGURE 10. Distribution of NDVI means at (A) pure localities, and (B) mixed localities.
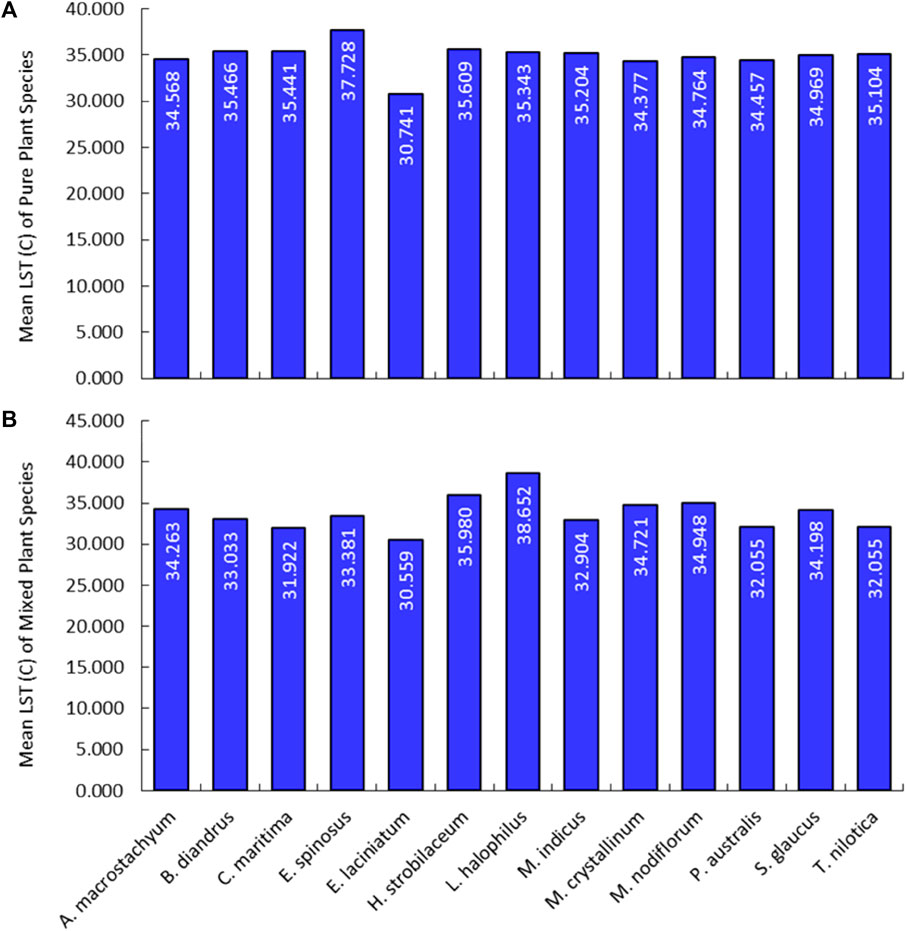
FIGURE 11. Distribution of LST means at (A) pure localities, and (B) mixed localities.
The high vegetation density is mainly characterized by low LST which indicates the mixed wild plant habitats. Mixed habitats of most investigated wild plant species (Bromus diandrus, Cakile maritima, Erodium laciniatum, Halocnemum strobilaceum, Lotus halophilus, Mesembryanthemum nodiflorum, Phragmites australis and Tamarix nilotica) showed an increase in the density cover than the pure habitats. In addition, the low LST characterizes the majority of the mixed habitats. However, some specific habitats such as Lotus halophilus are characterized by the relative high vegetation density and LST in mixed habitats than the pure ones. The TIR emissivity spectra of several plant species drastically varied under water or temperature stress (Buitrago et al., 2016).
Based on the optimal levels of NDVI and LST at various wild plant habitats in the Northern Coastal region, the GIS innovative model showed the suitable localities at the whole investigated region including the non-surveyed sites as shown in Figure 12. A narrow strip along the Mediterranean region showed highly suitable habitats for the wild plant growth.
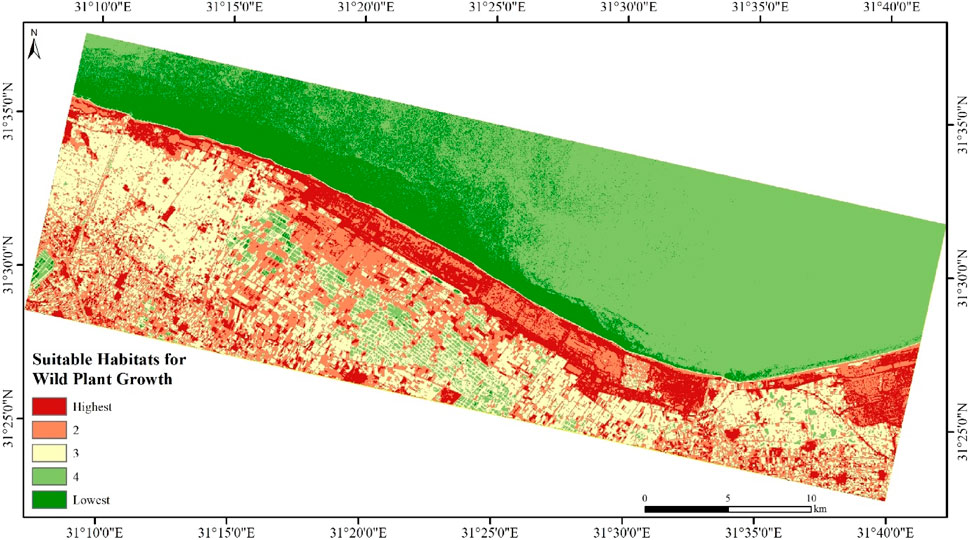
FIGURE 12. Suitable habitats for wild plant growth.
The model succeeded in mapping the natural vegetation in the whole region including the surveyed sites. To assess the model, the field surveyed habitats were used where 69 sites out of the 70 sites were correctly located at the high suitable class giving 98.57% accuracy (Figure 13). The outer sample was located at the second suitable category. This is a promising model for mapping these habitats at the Egyptian Mediterranean region. Remote sensing imagery can be used to map potential and actual vegetation areas, monitor vegetation classes over time, and generate multiple ecological variables (Rapinel and Hubert-Moy, 2021).
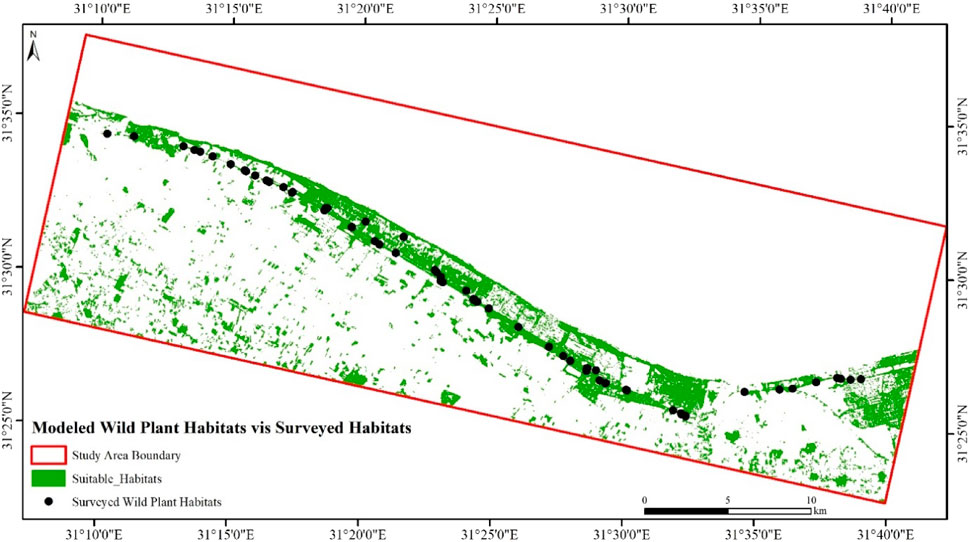
FIGURE 13. Validation of the model results.
Besides, this model can be used to map pure and mixed habitats of various wild plants. As an example, the specific values of NDVI and LST values were used to map the pure and mixed habitats of Arthrocnemum macrostachyum as shown in Figure 14. The middle coastal region is mostly suitable for the growth of Arthrocnemum macrostachyum as shown in the resultant map and as validated through the surveyed sites. This shows a matching between the predicted habitats and the field sampled sites since all sites are located inside the highly suitable class.

FIGURE 14. Suitability mapping of pure Arthrocnemum macrostachyum habitats.
The Arthrocnemum macrostachyum was found in association with other plants such as Senecio glaucus, Rumex pictus, Halocnemum strobilaceum and Tamarix nilotica in various mixed habitats which are different from the pure ones. The NDVI ranged from 0.081 to 0.166 and from 0.108 to 0.156 where LST fluctuated from 32.736 to 36.045 and from 31.480 to 35.359°C at pure and mixed habitats, respectively. Considering these values at the mixed habitats, the suitable localities were mapped in the whole region (Figure 15). Few scattered parts showed a suitability for growing the Arthrocnemum macrostachyum in association with other species. By assessing the predicted habitats considering the field surveyed sites, 80% of the predicted sites were matched with the highly suitable class and 20% were located in the second suitable class. This shows a promising result for mapping not only the wild plant habitats but also the specific habitats for each plant species whether pure or mixed with other species.
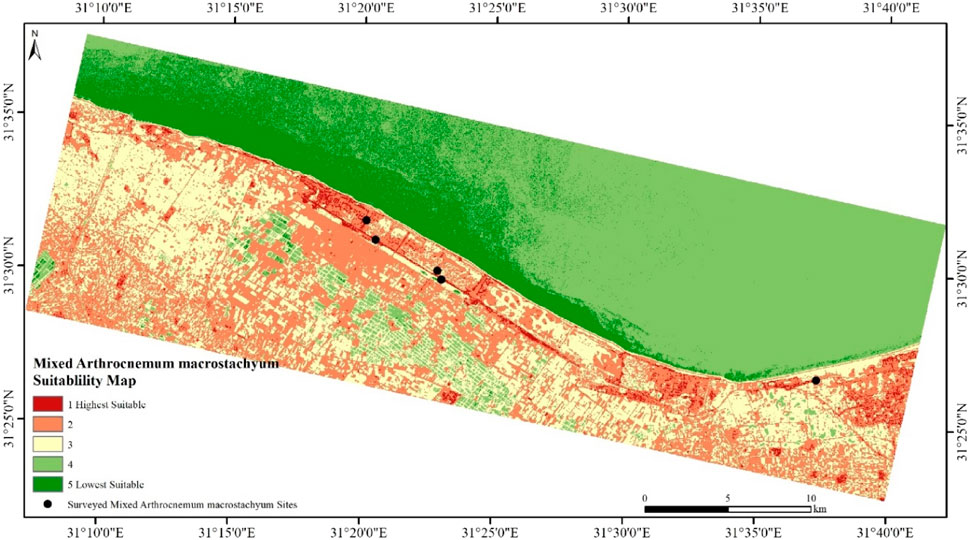
FIGURE 15. Suitability mapping of mixed Arthrocnemum macrostachyum habitats.
The present methodology adopts an innovative approach for assessing and mapping wild plant habitats through integrating multi-data sources and GIS modeling. MSS and TIRS bands of Landsat imagery were processed to produce NDVI and LST in the northern Nile delta that were used as input criteria for the model. The developed model is applicable in a similar environment and can be widely used. The natural vegetation mainly increased along Aldaqhliah shoreline specifically in Gamsa. Mixed habitats of most investigated wild plant species (Bromus diandrus, Cakile maritima, Erodium laciniatum, Halocnemum strobilaceum, Lotus halophilus, Mesembryanthemum nodiflorum, Phragmites australis and Tamarix nilotica) showed an increase in the density cover than the pure habitats. In addition, the low LST characterizes majority of the mixed habitats. However, some specific habitats such as Lotus halophilus are characterized by the relative high vegetation density and LST in mixed habitats than the pure ones. A narrow strip along the Mediterranean region showed highly suitable habitats for the wild plant growth. The middle coastal region is mostly suitable for the growth of Arthrocnemum macrostachyum. The paper considered the potentiality of using thermal characteristics of various wild plants to identify and map each species. This is a helpful approach to be investigated and encouraged to minimize field survey expenses and time-consuming lab analyses. The developed model showed a promising result and is applicable in coastal regions for mapping the wild plant habitats and each plant species whether pure or mixed with other plant species.
All data generated or analyzed during this study are included and available in this article.
AE-Z: Conceptualization, Methodology, Sampling and analyses, Images processing and model development, Writing–original draft preparation, writing–review and editing. HN-E: Conceptualization, Methodology, Images processing and model development, Writing–original draft preparation, writing–review and editing. EM: Writing–review and editing. NR: Writing–review and editing. YE-A: Conceptualization, Methodology, Sampling and analyses, Writing–original draft preparation, Writing–review and editing. All authors have read and agreed to the published version of the manuscript.
The author(s) declare that no financial support was received for the research, authorship, and/or publication of this article.
Authors acknowledge USGS for providing Landsat imagery to this paper.
The authors declare that the research was conducted in the absence of any commercial or financial relationships that could be construed as a potential conflict of interest.
All claims expressed in this article are solely those of the authors and do not necessarily represent those of their affiliated organizations, or those of the publisher, the editors and the reviewers. Any product that may be evaluated in this article, or claim that may be made by its manufacturer, is not guaranteed or endorsed by the publisher.
Abd-ElGawad, A. M., El-Amier, Y. A., Assaeed, A. M., and Al-Rowaily, S. L. (2020). Interspecific variations in the habitats of Reichardia tingitana (L.) Roth leading to changes in its bioactive constituents and allelopathic activity. Saudi J. Biol. Sci. 27 (1), 489–499. doi:10.1016/j.sjbs.2019.11.015
Abd El-Hamid, H., Alshehri, F., El-Zeiny, A., and Nour-Eldin, H. (2023). Remote sensing and statistical analyses for exploration and prediction of soil salinity in a vulnerable area to seawater intrusion. Mar. Pollut. Bull. 187, 114555. doi:10.1016/j.marpolbul.2022.114555
Asri, Y. (2003). Plant diversity in Touran biosphere reservoir. Tehran, Iran: Publishing research institute of forests and rangelands, 306.
Ayyad, M. A. (1973). Vegetation and environment of the western mediterranean coastal land of Egypt: I. The habitat of sand dunes. J. Ecol. 61 (2), 509–523. doi:10.2307/2259042
Batanouny, K. H. (1999). The mediterranean coastal dunes in Egypt: an endangered landscape. Coast. Shelf Sci. 49, 3–9. Supplement A. doi:10.1016/s0272-7714(99)80002-x
Batanouny, K. H., and El-Fiky, A. M. (1984). “Water hyacinth in Egypt: distribution and magnitude,” in Proc. Inter. Conf. On water hyacinth (Hyderabad, India: U.N. Envir. Prog.).
Bornkamm, R., and Khel, H. (1990). The plant communities of the western desert of Egypt. Phytocoenologia 19, 149–231. doi:10.1127/phyto/19/1990/149
Buitrago, M. F., Groen, T. A., Hecker, C. A., and Skidmore, A. K. (2016). Changes in thermal infrared spectra of plants caused by temperature and water stress. ISPRS J. Photogramm. Remote Sens. 111, 22–31. doi:10.1016/j.isprsjprs.2015.11.003
Coll, C., Galve, J., Sánchez, J., and Caselles, V. (2010). Validation of Landsat-7/ETM+ thermal-band calibration and atmospheric correction with ground-based measurements. IEEE Trans. Geosci. Remote Sens. 48 (1), 547–555. doi:10.1109/tgrs.2009.2024934
Cord, A. F., Meentemeyer, R. K., Leitão, P. J., and Václavík, T. (2013). Modelling species distributions with remote sensing data: bridging disciplinary perspectives. J. Biogeogr. 40 (12), 2226–2227. doi:10.1111/jbi.12199
Eid, A. N. M., Olatubara, C., Ewemoje, T., Farouk, H., and El-Hennawy, M. T. (2020). Coastal wetland vegetation features and digital Change Detection Mapping based on remotely sensed imagery: El-Burullus Lake, Egypt. Int. Soil Water Conserv. Res. 8, 66–79. doi:10.1016/j.iswcr.2020.01.004
Elagami, S. A., El-Zeiny, A., El-Halawany, E. S. F., and El-Amier, Y. A. (2022). Monitoring spatiotemporal environmental changes in Aldaqhliah governorate, Egypt using Landsat imagery. Let. Appl. NanoBioSci 11, 3843–3853.
El-Amier, Y. A., and Abdul-Kader, O. M. (2015). Vegetation and species diversity in the northern sector of Eastern Desert, Egypt. West Afr. J. Appl. Ecol. 23, 75–95.
El-Amier, Y. A., El-Halawany, E. F., and Abdullah, T. J. (2014). Composition and diversity of plant communities in sand formations along the northern coast of the Nile Delta in Egypt. Res. J. Pharm. Biol. Chem. Sci. 5, 826–847.
El-Amier, Y. A., and El Hayyany, L. Y. (2020). Floristic composition and species diversity of plant communities associated with genus Atriplex in Nile Delta coast, Egypt. Asian J. Conserv. Biol. 9, 11–24.
El-Demerdash, M., Hegazy, A., and Zilay, A. (1994). Distribution of the plant communities in Tihamah coastal plains of Jazan region, Saudi Arabia. Vegetation 112, 141–151. doi:10.1007/bf00044688
El-Husseini, N., El-Ghani, M. M. A., and El-Naggar, S. M. (2008). Biogeography and diversity of the tubiflorae in Egypt. Pol. Bot. J. 53, 105–124.
El-Sonbati, M., El-Zeiny, A., El-Gammal, M., and Ibrahim, M. (2012). Assessment of some water pollutants at New Damietta city-Egypt. J. Environ. Sci. 41, 267–282.
El-Zeiny, A., Effat, H., Mansour, K., Shahin, A., and Elwan, K. (2022b). Geo-environmental monitoring of coastal and land resources of Port Said Governorate, Egypt. Egypt. J. Remote Sens. Space Sci. 25 (1), 157–172. doi:10.1016/j.ejrs.2022.01.009
El-Zeiny, A., Elagami, S. A., Nour-Eldin, H., El-Halawany, E.-S. F., Bonanomi, G., Abd-ElGawad, A. M., et al. (2022a). Wild plant habitat characterization in the last two decades in the nile delta coastal region of Egypt. Agriculture 12, 108. doi:10.3390/agriculture12010108
El-Zeiny, A., and El-Kafrawy, S. (2017). Assessment of water pollution induced by human activities in Burullus Lake using Landsat 8 operational land imager and GIS. Egypt. J. Remote Sens. Space Sci. 20, S49–S56. doi:10.1016/j.ejrs.2016.10.002
Eone-Demerdash, M. A., Zahran, M. A., and Serag, M. S. (1990). On the ecology of the deltiac Mediterranean coastal land, Egypt. III. The habitat of salt marshes of Damietta-Port Said coastal region. Arab. Gulf J. Sci. Res. 8, 103–119.
Funk, V. A., Susanna, A., Stuessy, T., and Bayer, R. (2009). Systematics, evolution, and biogeography of the Compositae. Vienna: IAPT.
Gates, D. M., and Tantraporn, W. (1952). The reflectivity of deciduous trees and herbaceous plants in the infrared to 25 microns. Science 115, 613–616. doi:10.1126/science.115.2997.613
Gerhards, M., Schlerf, M., Mallick, K., and Udelhoven, T. (2019). Challenges and future perspectives of multi-/Hyperspectral thermal infrared remote sensing for crop waterstress detection: a review. Remote Sens. 11, 1240. doi:10.3390/rs11101240
Gogoi, P. P., Vinoj, V., Swai, D., Roberts, G., Dash, J., and Tripathy, S. (2019). Land use and land cover change effect on surface temperature over Eastern India. Sci. Rep. 9, 10.
Guha, S., Govil, H., and Diwan, P. (2019). Analytical study of seasonal variability in land surface temperature with normalized difference vegetation index, normalized difference water index, normalized difference built-up index, and normalized multiband drought index. J. Appl. Remote Sens. 13, 16.
Hendawy, E., Belal, A. A., Mohamed, E. S., Elfadaly, A., Murgante, B., Aldosari, A. A., et al. (2019). The prediction and assessment of the impacts of soil sealing on agricultural land in the North Nile Delta (Egypt) using satellite data and GIS modeling. Sustainability 11 (17), 4662. doi:10.3390/su11174662
Imam, M., and Kosinova, J. (1972). Studies on the weed flora of cultivated land in Egypt. 2. Weeds of rice fields. Bot. Jahrb. Syst. Stutgart 92, 139–153.
Lillesand, T. M., and Kiefer, R. W. (1994). Remote sensing and PhotoInterpretation. 3. New York: John Wiley & Sons, 750.
Liu, H., and Weng, Q. (2009). Scaling effect on the relationship between landscape pattern and land surface temperature: a case study of Indianapolis, United States. Photogramm. Eng. Remote Sens. 75, 291–304. doi:10.14358/pers.75.3.291
Lu, L., Weng, Q., Xiao, D., Guo, H., Li, Q., Hui, W., et al. (2020). Spatiotemporal variation of surface urban heat islands in relation to land cover composition and configuration: a multi-scale case study of Xi’an, China. Remote Sens. 12, 2713. doi:10.3390/rs12172713
Mohamed, E. S., Abu-hashim, M., AbdelRahman, M. A., Schütt, B., and Lasaponara, R. (2019). Evaluating the effects of human activity over the last decades on the soil organic carbon pool using satellite imagery and GIS techniques in the Nile Delta Area, Egypt. Sustainability 11 (9), 2644. doi:10.3390/su11092644
Mohamed, E. S., Belal, A., and Shalaby, A. (2015). Impacts of soil sealing on potential agriculture in Egypt using remote sensing and GIS techniques. Eurasian Soil Sci. 48, 1159–1169. doi:10.1134/s1064229315100075
Neinavaz, E., Schlerf, M., Darvishzadeh, R., Gerhards, M., and Skidmore, A. K. (2021). Thermal infrared remote sensing of vegetation: current status and perspectives. Int. J. Appl. Earth Obs. Geoinf 102, 102415. doi:10.1016/j.jag.2021.102415
Oudtshoorn, V., and Rooyen, V. (1999). “Restriction of dispersal due to reduction of dispersal structures,” in Dispersal biology of desert plants (Cham: Springer), 93–119.
Pinto-Ledezma, J. N., and Cavender-Bares, J. (2020). “Using remote sensing for modeling and monitoring species distributions,” in Remote sensing of plant biodiversity. Editors J. Cavender-Bares, J. A. Gamon, and P. A. Townsend (Cham: Springer). doi:10.1007/978-3-030-33157-3_9
Rapinel, S., and Hubert-Moy, L. (2021). One-class classification of natural vegetation using remote sensing: a review. Remote Sens. 13, 1892. doi:10.3390/rs13101892
Raunkiaer, C. (1937). The life forms of plants and statistical plant geography. London: Translated by Carter Fausboll and Tansley; Oxford Univ. Press.
Shaltout, K. H., El-Kady, H. E., and Al-Sodany, Y. M. (1995). Vegetation analysis of the mediterranean region of nile delta. Vegetation 116, 73–83. doi:10.1007/bf00045280
Shaltout, K. H., Sharf El, D. A., and El-Fahar, R. A. (1992). Weed communities of the common crops in the Nile Delta region. Flora 187, 329–339. doi:10.1016/s0367-2530(17)32240-5
Sobrino, J. A., Jimenez-Munoz, J. C., and Paolini, L. (2004). Land surface temperature retrieval from Landsat TM5. Remote Sens. Environ. 9, 434–440. doi:10.1016/j.rse.2004.02.003
Soil survey staff (1996). “Natural resources conservation service,” in Keys to soil taxonomy (Washington, DC, USA: United States Department of Agriculture), 644.
Stanley, K. E. (1999). Evolutionary trends in the grasses (poaceae): a review; ann arbor, MI. UAS: Michigan Publishing, University of Michigan Library.
Täckholm, V. (1974). Student flora of Egypt. Beirut: Publishing Cairo University, Printed by Cooperative Printing Co.
Ullah, S., Schlerf, M., Skidmore, A. K., and Hecker, C. (2012). Identifying plant species using mid-wave infrared (2.5–6μm) and thermal infrared (8–14μm) emissivity spectra. Remote Sens. Environ. 118, 95–102. doi:10.1016/j.rse.2011.11.008
West, A. M., Evangelista, P. H., Jarnevich, C. S., Young, N. E., Stohlgren, T. J., Talbert, C., et al. (2016). Integrating remote sensing with species distribution models; mapping tamarisk invasions using the software for assisted habitat modeling (SAHM). J. Vis. Exp. 116, 54578. doi:10.3791/54578
Wong, C. L., and Blevin, W. R. (1967). Infrared reflectances of plant leaves. Aust. J. Biol. Sci. 20 (3), 501–508. doi:10.1071/bi9670501
Xie, M. M., Chen, J., Zhang, Q. Y., Li, H. T., Fu, M. C., and Breuste, J. (2020). Dominant landscape indicators and their dominant areas influencing urban thermal environment based on structural equation model. Ecol. Indic. 111, 105992. doi:10.1016/j.ecolind.2019.105992
Keywords: natural vegetation, environmental modeling, land cover, remote sensing, spatial analyses, wild plant habitat
Citation: El-Zeiny AM, Nour-Eldin H, Mohamed ESS, Rebouh NY and El-Amier YA (2023) Environmental characterization and cartographic modeling of wild plant habitats at the northern coastal zone of Egypt. Front. Environ. Sci. 11:1292495. doi: 10.3389/fenvs.2023.1292495
Received: 11 September 2023; Accepted: 16 November 2023;
Published: 07 December 2023.
Edited by:
Chaitanya B. Pande, Indian Institute of Tropical Meteorology (IITM), IndiaReviewed by:
Vinay Kumar Gautam, Maharana Pratap University of Agriculture and Technology, IndiaCopyright © 2023 El-Zeiny, Nour-Eldin, Mohamed, Rebouh and El-Amier. This is an open-access article distributed under the terms of the Creative Commons Attribution License (CC BY). The use, distribution or reproduction in other forums is permitted, provided the original author(s) and the copyright owner(s) are credited and that the original publication in this journal is cited, in accordance with accepted academic practice. No use, distribution or reproduction is permitted which does not comply with these terms.
*Correspondence: Ahmed M. El-Zeiny, YWVsemVueUBuYXJzcy5zY2kuZWc=
Disclaimer: All claims expressed in this article are solely those of the authors and do not necessarily represent those of their affiliated organizations, or those of the publisher, the editors and the reviewers. Any product that may be evaluated in this article or claim that may be made by its manufacturer is not guaranteed or endorsed by the publisher.
Research integrity at Frontiers
Learn more about the work of our research integrity team to safeguard the quality of each article we publish.