 Chao Liu
 Wei Wang
 Chenhui Ding
 Xianzhong Teng3
94% of researchers rate our articles as excellent or good
Learn more about the work of our research integrity team to safeguard the quality of each article we publish.
Find out more
ORIGINAL RESEARCH article
Front. Environ. Sci., 30 November 2023
Sec. Environmental Economics and Management
Volume 11 - 2023 | https://doi.org/10.3389/fenvs.2023.1287811
The impacts of the digital economy on regional carbon emissions have attracted much concerns from all regions of China. Using panel data for 30 Chinese provinces and cities from 2011 to 2020, the study empirically examined the bilateral effects of the digital economy on regional carbon emissions (RCBs) and the heterogeneous characteristics under different conditions by various econometric models. The results indicate that, the inhibition effect of digital economy development on regional carbon emissions is stronger than the promotion effect, which is 13.38% lower and 12.11% higher than the frontier level respectively. When both effects are combined, it makes regional carbon emissions 1.27% below the frontier boundary. In addition, the inhibition effect of the digital economy on carbon emissions (DECEs) predominant and presents a declining trend during the study period. And the inhibition effect of the digital economy on carbon emissions in the eastern region is highest among all the regions. Moreover, the level of different factors such as digital economy, human capital and economic development, can effectively strengthen the inhibition effect of digital economy on regional carbon emissions. This work will be conducive to fully leveraging the important role of the digital economy in regional environmental governance in China, and promote the achievement of China’s carbon peaking and carbon neutrality goals.
There exists a key factor, global warming which affects sustainable development of regions (Xu et al., 2022). Recently, extreme phenomena such as glacier melting all over the world, sea level rising, alongside drought and flood polarization due to the continuous increase of CO2-based greenhouse gases have occurred frequently (Miao et al., 2022), which have caused serious influences upon agricultural production, human life, and social and economic activities, additionally, hamper the sustainable development all over the world. Under such circumstances, the ways to promote low-carbon development have been an important issue around the world (Zhang and Feng, 2021). And Chinese government has already taken the lead in undertaking the responsibility of carbon emission reduction (CER) and made its emission reduction commitment at the United Nations General Assembly, putting forward strategic targets of striving for carbon peak by 2030 as well as carbon neutrality by 2060, which has intensified the stress of carbon emission reduction to an unprecedented level in China. However, the extensive development mode of China for the long-term is characterized by factor-driven pattern, as well as industrialization and urbanization, which has caused severe problems with environment pollution and energy consumption these years (Shi et al., 2018). In the light of the World Energy Statistics Yearbook 2021 statistics, carbon emissions in China varied between 8.83 billion tons and 9.90 billion tons from 2011 to 2020, denoting that China will confront the long-run stress for CER (Miao et al., 2019). Reducing regional carbon emissions (RCBs) has already been a vital problem with widespread concern within various regions of China. Several researches have conducted to promote the low-carbon development of regions. The determinants such as low-carbon technology (Wen et al., 2022), local government environment (Li and Wen, 2023), energy efficiency (Li et al., 2022), and economic development (Sadik-Zada and Ferrari, 2020; Zhang and Liang, 2022), are usually considered as effective ways to reduce carbon emissions. Nowadays, the digital economy, showing its unique features of high penetration, high added value and relatively lower cost, has been regarded as an effective way to cope with the dramatic changes in this new era of China (Zhang et al., 2021). For another, that economy is capable of bringing profound changes in the way of management and production, thus giving birth to new business models and industries. And with the environment-friendly features of digital economy itself, it is able to impede the progress space of elevated-energy and elevated-emission domains by crowding out effect, and improve the urban industry development (Yang et al., 2020), providing new opportunities and impetus for CER (Xu et al., 2022). On the flip side, the digital economy has gradually unleashed its important role in environmental governance. The informal environmental regulation effect generated by it can promote urban air quality improvement, and instruct the public to establish a green concept, a favorable atmosphere for the whole society to collaborate in environmental management would be thus created. According to the data released in the White Paper on the Development of China’s Digital Economy (2022), input of China`s digital economy continued to rise, from 9.5 trillion RMB in 2011 to 45.5 trillion RMBB in 2021. Besides, its proportion to GDP had also increased, with a ratio of 39.8% in 2021 and a growth rate of 16.2%, which significantly exceeds the nominal growth rate of GDP during the identical period. Furthermore, the rapid development attracted continuous attention from all sectors of society. Since carbon peaking and carbon neutrality were proposed, CER has captivated extensive concerns in various regions of China. So, is the digital economy capable of efficiently lessening carbon emissions in regions?
Presently, researchers have implemented numerous useful discussions on the relation between the digital economy and carbon emissions. In general, it contains three types of views as follows. To begin with, the digital economy or digital elements are capable of increasing carbon emissions. The speedy progression of ICTs (the information and communication technology) and industries have triggered the elevated demand for intermediate production inputs such as electricity and carbon-intensive materials, leading to rapid growth in power consumption (Salahuddin and Alam, 2015) and generating painfully much carbon emissions (Erdmann and Hilty, 2010; Wissner, 2011; Hamdi et al., 2014; Yi et al., 2022). A few researchers have claimed that the digital economy is able to reinforce carbon emissions (Park et al., 2018; Raheem et al., 2020). What`s more, apart from digital upgrading and application, establishment of data centers will accelerate to extract resources and consume energies, therefore carbon emissions could be triggered (Miao et al., 2022). Ultimately, it has also been proposed that digital development does not conduce to energy effectiveness enhancements, carbon emissions will thus be exacerbated (Zhang et al., 2022a).
Also, the digital economy or digital elements could implement CER. Several researches have uncovered that the technology of information, as a nuclear part of the above-described economy, is capable of enhancing the environment quality through lessening greenhouse gas emissions through communication technology penetration (Ulucak et al., 2020; Bhujabal et al., 2021). Some researchers have also confirmed that the use and the spread of Internet (Haseeb et al., 2019) is able to prominently implement CER in the long term (Shobande, 2021). Meanwhile, it has also been found that the above-described economy is able to lessen carbonous emissions (Wang et al., 2022a; Dong et al., 2022; Hao et al., 2022), which can be achieved via technological advancement (Wang and Guo, 2022; Xie, 2022), energy consumption structure (Yang et al., 2020), energy utilization efficiency (Cai et al., 2019; Nibedita and Irfan 2021), upgrading of industrial structure (Ge et al., 2022), resource allocation efficiency (Zhang et al., 2021), industry progress, alongside energy depletion (Hao et al., 2022).
Next, the impacts of that economy or digital elements on carbon emissions are non-linear. A few researchers contend that there exists an inverted U-shaped correlation between RCEs and ICT, as well as the correlation between RCEs and digital economy (Salahuddin et al., 2016; Li and Wang, 2022). Similarly, the study by Miao et al. (2022) verifies that there exists nonlinear relationship of inverted U-shaped between RCEs and digital economy, while Ge et al. (2022) further claimed that industrial construct transformation and upgrading are capable of boosting the early formation of the inverted U-shaped correlation between RCEs and digital economy.
In the view of existing studies, researchers have implemented much beneficial detection on influences of the above-mentioned economy upon RCEs, but the conclusions have not reached an agreement yet. Moreover, most literature only focus on the unilateral impact system of DECEs, ignoring composite features of the influences of that economy upon society and economy (Chen, 2020; Zhao et al., 2020), and fails in completely discussing the distinctions of the impacts of DECEs in disparate conditions. Accordingly, a bilateral theoretical analysis framework of digital economy concerning Chinese RCEs was established in this article, and used various econometric models to assess and analyze the impacts and evolution characteristics of the above-described economy on RCEs. The main functions of the article are listed below. Firstly, proposition about the bilateral influences of DECEs is presented based upon dual attributes of the digital economy, which theoretically expands the research perspective of carbonous emissions. Secondly, on the grounds of the two-tier random frontier pattern, composite outcomes contributed by the digital economy are gauged specifically, and the space and time distribution features of bilateral effects of DECEs are also fully analyzed, which provides empirical evidence for understanding the internal correlation between carbonous emissions and digital economy. Subsequently, apart from the heterogeneous impacts of the above-described economy upon the net effect of carbonous emissions under different conditions of human resources capital, economic advancement levels are explored in depth, which could help to enhance the practical significance of this research.
The other parts of this paper is organized listed: theoretical models and mechanism of the relationship between digital economy and RCEs are illustrated in “Theoretical models and mechanism analysis” section; the variables, approaches, alongside data sources adopted in this article are introduced in “Materials and methods” section; the empirical consequences are depicted in “Empirical Analysis” section, as well as the relevant analysis; the conclusions are summed up and the policy recommendations of this research are brought forward in “Conclusions and policy implications” section.
With a view to detecting the influences of the DECEs at the level of the theory, the research attempts to set up one theoretical model with the objective to analyzing it. Drawing on the study of Li and Wang (2022), the primary model is built as follows, which contains one production function.
In Eq. 1, Q represents economic output, E, N, and K represent energy, labor, and capital inputs. A represents the level of technology, and L represents economic growth driven by the digital economy. α (0 < α < 1) and β (0 < β < 1) represent the contribution of labor and energy inputs to output, respectively.
In Eq. 2,
In Eq. 3,
Drawing on the study of Sheng (2017), the expression of the carbon emission function can be presented.
In Eq. 5, W is the total carbon emission, Z denotes the carbon emission of the marginal output affected by the digital economy;
What’s more, in an ideal competitive market circumstance, p is considered to be the product price, b refers to the variable cost. The fixed cost and carbon abatement cost are represented by
On the basis of the above equation, as for the parameter L, its first-order derivative is found, and the optimal output level as well as carbon emissions are obtained under the condition of profit maximization, which is calculated by the following equation.
In Eq. 7,
According to the Eq. 8 and Eq. 9, we can further obtain the best level F0 of digital economy restricted by carbon emission targets as below.
The total carbon emissions can reach the maximum value F0 when
In Eq. 11,
Showing unique characteristics, the digital economy is capable of playing its inhibitory part in carbon emissions through the following ways. Firstly, the above-mentioned economy is capable of boosting the upgrading of conventional industries through technology penetration and industrial convergence (Wang et al., 2022b; Li and Wang, 2022; Xue et al., 2022). For another, digital technology is able to assist in enhancing the carbon trading marketplace and boosting the carbon emission rights transferring among enterprises with different levels of energy use efficiency, and facilitate energy saving and emission decrease of corporations (Liu et al., 2015; He and Song, 2022). In addition, platforms of digital network could boost interdisciplinary resource sharing via scale and competition, achieve deep integration of industries, and upgrade conventional industrial production, value chains, alongside supply chains. Accordingly, aside from energy structure, the operational efficiency of industry organizations is capable of being enhanced during this process, which will also issue in CER (Moyer and Hughes, 2012; Zhou et al., 2020; Zhang et al., 2022b). Secondly, digital economy is capable of bringing various changes in technological innovation, which can affect carbon emission efficiency. For example, the above-mentioned economy has helped regions to overcome the inherent deficiency of uneven distribution of traditional innovation resource endowments, and improve overall innovation level and energy utilization efficiency (Kloppenburg and Boekelo, 2019; Chen et al., 2021). Meanwhile, that economy breaks the administration obstacles of geography and promotes the spillover of technological renovation, bring the enhancement of innovation levels and the CER in different regions (Pan et al., 2022). What’s more, the digital economy could be conduce to flows of talent and technology as well, thus accelerating the spillover effects of green technologies and regional low-carbon transition (Markandya et al., 2016; Schultes et al., 2018; van den Buuse and Kolk, 2019). Thirdly, the digital economy increases effective information based on the network effect, which can improve the price mechanism, realize supply matching, change the transaction and circulation activities, and thereby enhance resource allocation efficiency (Carlsson, 2004; Pan et al., 2022). Meanwhile, enterprise producers can optimize their production processes based on digital technologies, optimize the resource allocation, alongside energy construct, and enhance resource use efficiency. Thereby carbon emissions can be reduced (Wang et al., 2022c). What`s more, digital finance is also capable of lessening the corporate financing constraints and alleviate resource mismatch, thus regional total factor productivity and energy use efficiency can be promoted (Wang et al., 2022d; Wang and Guo, 2022). Based on these theoretical mechanisms, this hypothesis is capable of being put forward as below.
Hypothesis 1. The digital economy can significantly inhibit the RCE.
The above-mentioned economy also has a certain “green blindness,” which brings negative externalization on the circumstance and consequences in carbon emission increasing (CEI). Firstly, digital technological advancement is going to induce corporations with the intention of reseting production equipment capacity, expand production scale, and increase production by expanding the resource exploitation and energy consumption, conducing to the CEI (Li et al., 2021; Zhang et al., 2022a; Li and Wang, 2022). In particular, that technology has been widely used in mining industries which can lead to an increasing scale of rare metals and minerals, bringing about resource overconsumption as well as negative environmental problems (Miao et al., 2022). Secondly, advancement and usage of green technologies, alongside the environmental protection effects are usually in need of a time lag or a relatively long cycle. Therefore, non-green technology progression showing far more economic growth effects is frequently more appropriate, which will intensify carbonous emissions at last. Thirdly, the above-described economy is facilitated with software and information technology services, alongside telecommunications, and is a high power-intensive form of economy. In addition, there is an elevated percentage of coal-based electricity in our country. As a result, as to the related industries, their electricity consumption will bring more coal consumption and carbonous emissions (Wang et al., 2022a). Based upon the theoretical mechanisms, the hypothesis is capable of being presented as below.
Hypothesis 2. The digital economy can significantly promote the regional carbon emission.
According to the above-mentioned analysis, the analysis on system for the impacts of DECEs is depicted in Figure 1.
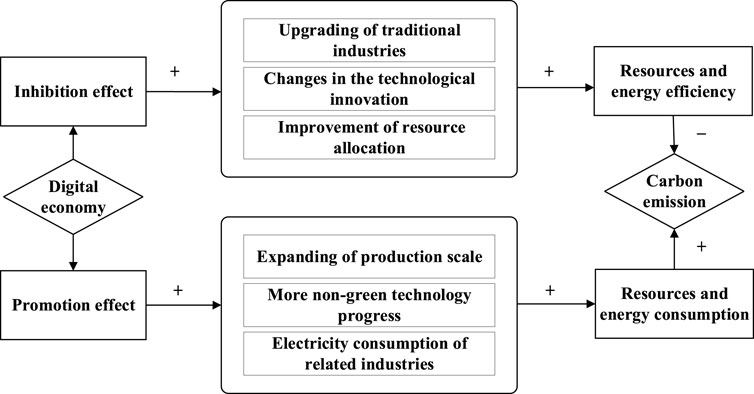
FIGURE 1. The mechanism analysis for the impacts of digital economy on carbon emissions.
With a view to addressing composite impacts of DECEs and accurately analyzing the system of interaction between digital economy and RCEs, a two-tier stochastic frontier model is constructed referring to researches of Kumbhakar and Parmeter. (2009), Papadopoulos (2021) and Hu and Pei (2020).
where
According to Eq. 12, the actual carbon emissions are affected by positive and negative effects upon account of the digital economy. Specifically, the promotion effect makes carbon emissions exceed the frontier level, whereas the inhibition effect enables carbon emissions to be under the frontier level. And the deviation of actual carbon emissions is measured by calculating the net effect of their combined effects. Furthermore, considering the biased results obtained from OLS estimation, the use of MLE can be used to obtain valid estimation results. Therefore, the assumptions about the residual distribution can be set as follows.
In addition, the error terms need to be independent with one another, and are also uncorrelated with inter-provincial variables. On the grounds of the above-described hypotheses, the probability density calculation of
In this equation,
On the basis of the parameter estimation of Eq. 14, the expression of MLE is constructed below.
wherein,
Then the conditional expectations of
With the Eq. 18 and Eq. 19, it is possible to estimate the absolute level of carbon emissions deviation from the frontier level attributed to combination of the bias effects. For our further comparison, it is necessary to convert the absolute deviation value into a ratio of the deviation from the optimal level based on the Eq. 20 and Eq. 21.
Accordingly, the net effects on carbon emissions can be obtained and calculated as follows.
Wherein NE refers to the distinction between promotion and inhibition effects. When NE > 0, it suggests that the promotion effect dominates, compared to the inhibition effect; while NE < 0, it indicates the inhibition effect dominates, compared to the promotion effect.
(1) Carbon emissions
In view of the fact that no official carbon emission data is published, the formula provided by Intergovernmental Panel on Climate Change (IPCC) is select for the purpose of figuring out greenhouse gas (GHG) emissions. Besides, based on the approach of Kuang et al. (2022), GHG emissions at the production side are considered, and eight energy sources, containing coke, gasoline, natural gas, raw coal, fuel oil, crude oil, kerosene, alongside diesel are selected for the end consumption. Then the carbon emissions are figured out in the light of the listed formula.
In this equation, t is the year; i is the region; j is the energy resource; M is the energy consumption; CE is the
(2) Level of digital economy development
According to Zhao et al. (2020), the integrated advancement degree of the above-described economy is evaluated on the part of digital financial inclusion and Internet progress. Concerning methods of Liu et al. (2020) and Huang et al. (2019), the level of Internet progress is capable of being evaluated via Internet penetration rate, employees in related industries, and telecommunication services. Moreover, the quantity of Internet broadband users in 100 individuals is chosen to characterize the Internet penetration rate; the percentage of workers in computer and software service to the quantity of workers in urban units is used to represent the employees in related industries; the overall quantity of telecommunication services per caput, alongside the quantity of cell phone users among 100 individuals are used to measure telecommunication services. Meanwhile, digital inclusive finance becomes the important reflection of the above-described economy progression. Compiled by Guo et al. (2020), we select digital financial inclusion indices for different provinces to measure regional digital financial inclusion in China, which includes depth and breadth of utilization, alongside digitization. The entropy weight method is then adopted finally with the objective to attaining the level of regional digital economy advancement, which is meant as Sdig.
(3) Other inter-provincial characteristic variables
Following the research of Kuang et al. (2022), population density is chosen to measure the population scale, which is coped with logarithmic treatment then and denoted as lnPM; Referring to the study of Kang and Ru (2020), government financial expenditure is characteristic of the percentage of general financial budget cost to GDP. That is coped with logarithmic then and denoted as lnGOF; the degree of industrialization is represented by added value of the secondary sector as a share of GDP, and which is coped with logarithmic then and denoted as lnInd; the economic advancement level is shown via GDP per caput (Han et al., 2019), which is coped with logarithmic then and denoted as lnPGdp; urbanization is expressed by the share of non-farm population (Xu et al., 2022), which is coped with logarithmic then and denoted as lnCity; environment regulation is characteristic of the quantity of investing in environment pollution to GDP, which is denoted as EG; energy structure is gauged by coal depletion to overall energy depletion (Shao et al., 2016), which is denoted as EnS; the intensity of energy is gauged by energy consumption each GDP unit (Ren et al., 2021), which is illustrated as EQ. Overall, the depicted statistics consequences of variables are exhibited in Table 1.
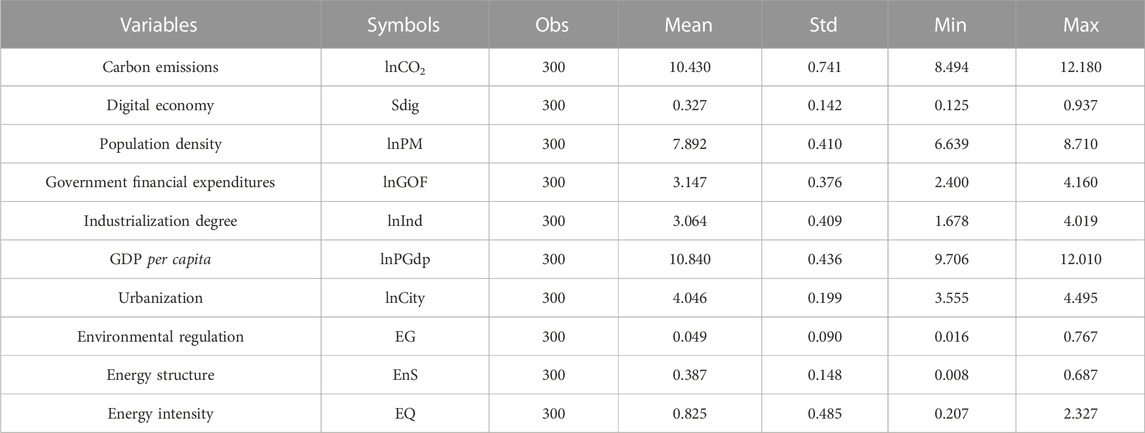
TABLE 1. Descriptive statistics of variables.
The figures applied to the research is chosen from China Statistical Yearbook (2012–2021), ESP Global Database, alongside China Science and Technology Statistical Yearbook (2012–2021). On account of the data availability, four zones of Tibet, Taiwan, Macao and Hong Kong, Macao, are not contained in this research. Besides, variables involving price factors are deflated according to the base year of 2011. And all provinces are split into three sections based upon the geographical position, which is the eastern, the central and the western regions. The eastern parts are comprised of 11 provinces or cities, and they are Fujian, Jiangsu, Hebei, Zhejiang, Liaoning, Hainan, Beijing, Guangdong, Shandong, Tianjin, and Shanghai. The central parts are comprised of 8 provinces or cities, which is Heilongjiang, Shanxi, Hubei, Jilin, Hunan, Anhui, Jiangxi, and Henan. And the western parts are comprised of 11 provinces or cities, which is Sichuan, Yunnan, Inner Mongolia, Ningxia, Guangxi, Xinjiang, Gansu, Guizhou, Chongqing, Shaanxi, and Qinghai.
Related composite effects are decomposed according to Eq. 12, based upon the MLE estimation. And these consequences are depicted in Table 2. Among them, these consequences based on OLS model is presented in the second column. The results based on model (2) is used to obtain the estimation without considering area and time fixed effects; model (3) is established taking the area fixed effects into account only; and model (4) is adopted when considering both time and area fixed effects. Besides, Model (5) is a one-sided estimation concerning merely the passive impact of regional digital economy; model (6) is a one-sided estimation considering only the opposite impact; Furthermore, model (7) is estimation taking both positive and passive outcomes of the above-mentioned economy into account. Based upon the likelihood ratio experiment (LR) as well as the deviation effect, it is found that comparing to the OLS estimation and the residual model, the model (7) is more appropriate to be chosen to analyze the digital economy’s bilateral effect decomposition.
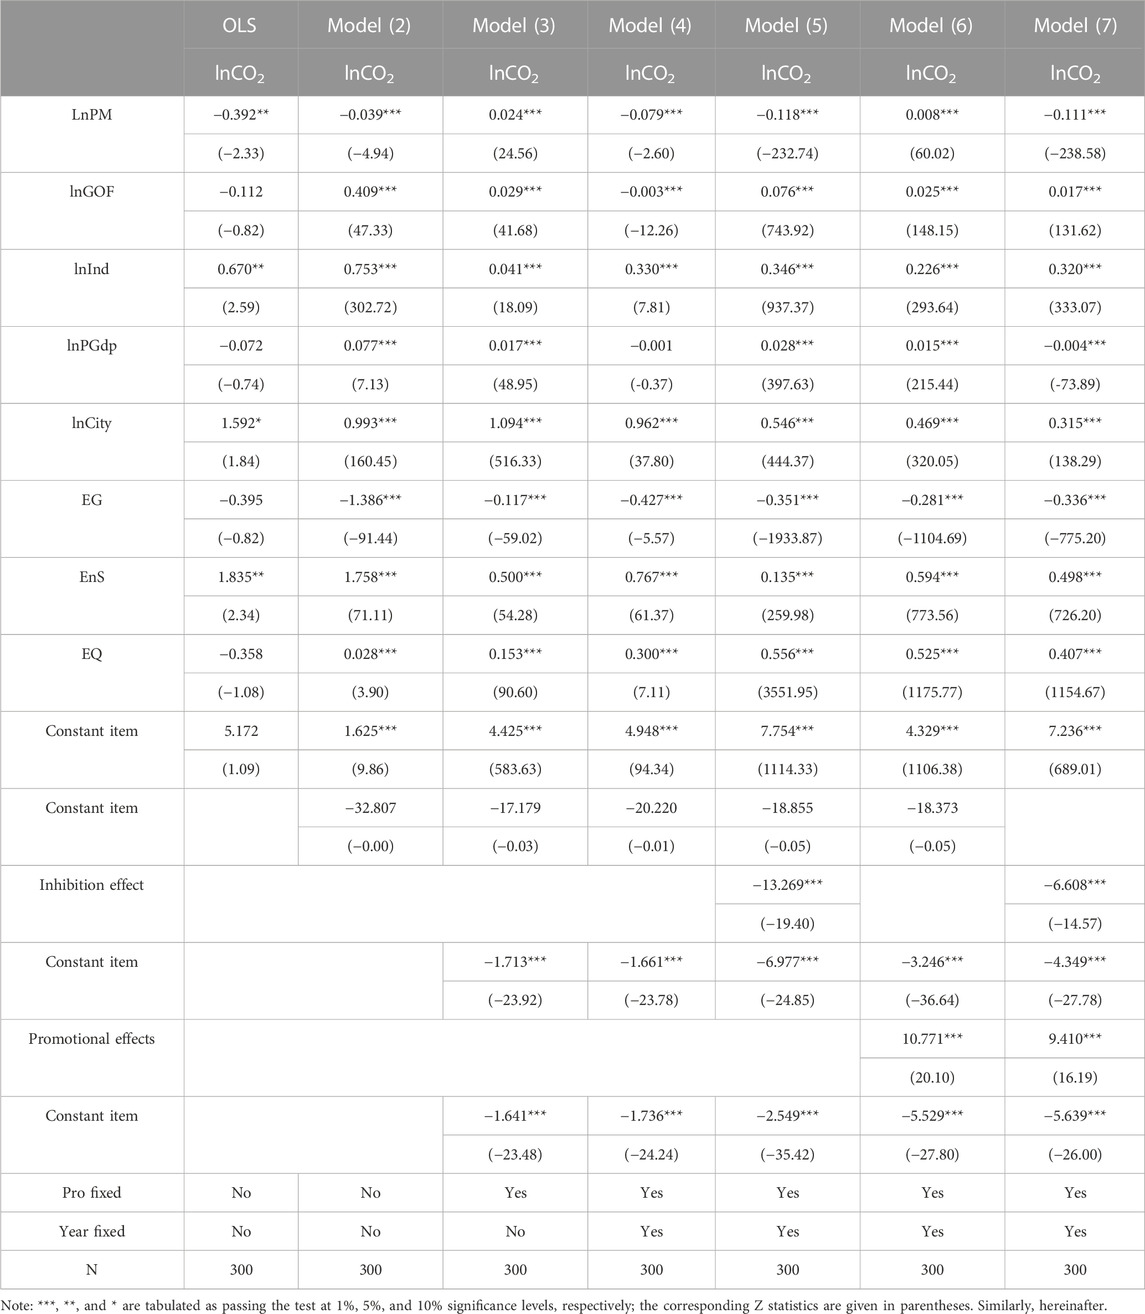
TABLE 2. Basic regeression results of the outcomes contributed by digital economy.
The promotion and inhibition effects are further decomposed based upon model (7). Moreover, the decomposition consequences are depicted in Table 3. The effects of DECEs are researched within this chapter. Promotion and inhibition effects reach 0.2050 and 0.3024, separately. And the net effect is E (

TABLE 3. Variance decomposition of the effects contributed by digital economy.
Furthermore, the dual effects is also estimated based upon the decomposition model. As shown in Table 3, the inhibition effect reaches 68.52%, while the promotion effect accounts for 31.48%. Additionally, the inhibition effect significantly exceeds the promotion effect, showing that the inhibition effect dominates, thus verifying once again the accuracy of the above estimation.
After examining how the DECEs, Eqs 19–21 are used to further determine the RCEs’ divergence from the optimal carbon emission level. Through the above formula, we can get the actual ratio of deviation from the optimal level and the above-mentioned net effect. These consequences are put forward in Table 4. And on this basis, by comparing the percentages of promotion effect and inhibition effect, we can determine the practical influences. According to the consequences in Table 4, the promotion effect makes carbon emissions exceeding the frontier level by 12.11%, whereas the inhibition effect enables carbon emissions to be less than that level by 13.38%. Thereby, the combined effect of those two effects enables carbonous emissions to be less than that level by 1.27%, which indicates that the bilateral effects impede the carbon emissions. Specifically, under p25 and p50 quartiles, the above-mentioned economy lessens carbonous emissions by 5.16% and 0.23%, respectively. It indicates that the inhibition effect offsets the promotion effect, thus keeping the conclusion that the digital economy impedes the carbon emissions. However, under the p75 percentile, the effect of the DECEs is reversed, with the promotion effect obviously exceeding the inhibition effect. It indicates that energy depletion is often excessive at places with the elevated degree of digital economy. The possible cause maybe that the energy consumption of related digital industries in China is still dominated by thermal power, which will bring an energy rebound effect on electricity, and thus contribute to the increase of RCEs.
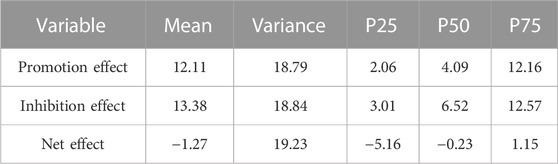
TABLE 4. Estimation of the effects of digital economy on carbon emissions (%).
Furthermore, frequency distribution of different kinds of effects contributed by digital economy is given in Figure 2. The inhibition effect shows a right trailing feature, indicating that carbon emissions in some provinces are very sensitive to variations of digital economy. And the promotion effect ends at roughly 90%, which is prominently less than the inhibition effect. Besides, consequences of the net effect distribution demonstrates that inhibition effect contributed by digital economy dominates in most of provinces, showing that the above-described economy exerts an active function upon lessening carbonous emissions and tend achieve the “carbon peaking and carbon neutrality” target.
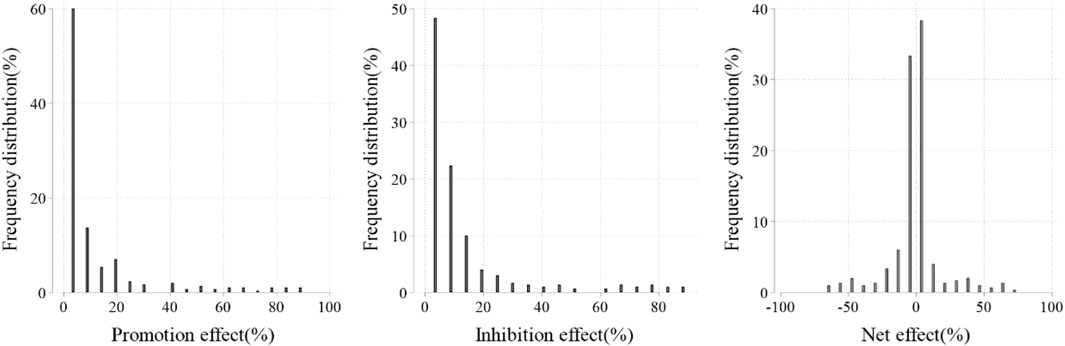
FIGURE 2. Frequency distribution of the effects contributed by digital economy.
These features of the net effect distribution in different regions are further examined. Additionally, the consequences are illustrated in Table 5, and the net effects are negative in the overall three regions, which is −7.03%, −5.90%, and −2.83%, respectively. It indicates that regional digital economy prominently limits carbon emissions within these regions. Specifically, the inhibition effect in the eastern region is highest in the overall regions. The possible cause is that, there are obvious advantages in digital infrastructure and industry in the east of the region, and the dividend of digital economy has been released during these years. Moreover, aside from innovation capital, vast quantities of digital innovation talents have gathered to support the technological progress and green development, resulting in the stronger inhibition effect within this region. However, the above-described economy between central and western regions is still at an initial stage of advancement, and the carbon emissions from infrastructure construction and resource depletion are partially offset by the inhibition effect of the above-described economy, bringing about one weaker inhibition function by the regional digital economy. Overall, the spatial pattern of digital economy’s effects upon carbon emissions in disparate regions exhibits these features of a decreasing spatial distribution within the eastern, central and western regions.
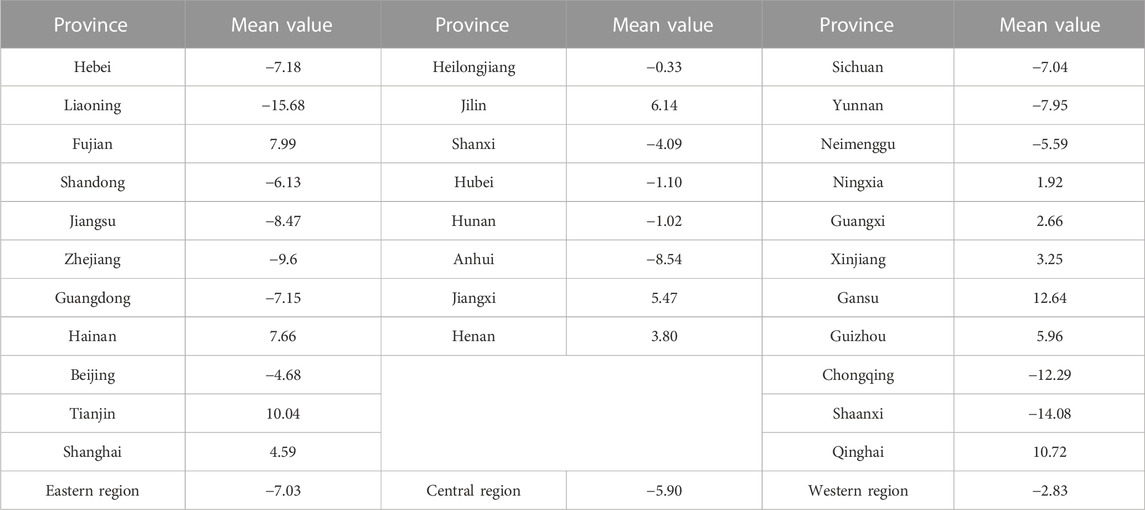
TABLE 5. Characteristics of the net effect of the digital economy on regional carbon emissions (%).
The time variation trend of above-mentioned impacts is further identified. Additionally, these consequences are illustrated in Figure 3. The net effect contributed by digital economy takes the lead during these years is ranging from −0.2% to −4.0%. It indicates that the inhibiting impact predominates and presents a decreasing tendency in the study period. The main cause of this consequence might be that, the progression of the above-described economy is often together with by a prominent growth in the need of energy, which will bring more energy consumption and resource investment. However, with the progression of the above-described economy, the digital technology utilization has accelerated the process of energy construct transformation, and enhanced the energy efficiency, thus greatly facilitating the fulfillment of energy saving and emission reduction targets.
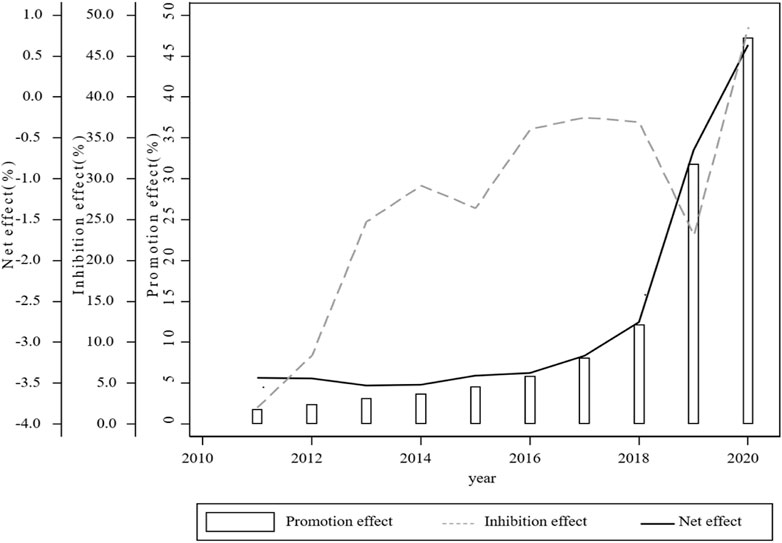
FIGURE 3. Temporal characterization of the impacts contributed by digital economy (%).
Bilateral effects at disparate digital economy levels are presented inside Table 6. And the results under 25%, 50%, and 75% quartiles are also demonstrated simultaneously. With the increase of the digital economic advancement level, the mean value of promotion effect on carbon emissions increases from 1.75% for Sdig ≤ 0.223 to 34.09% for Sdig > 0.408, respectively. And the average value of the inhibition effect increases from 5.33% for Sdig ≤ 0.223 to 35.56% for Sdig > 0.408, respectively. Besides, the net effect is always negative. These consequences means that, as the digital economic level raises, the inhibition effect always dominates.
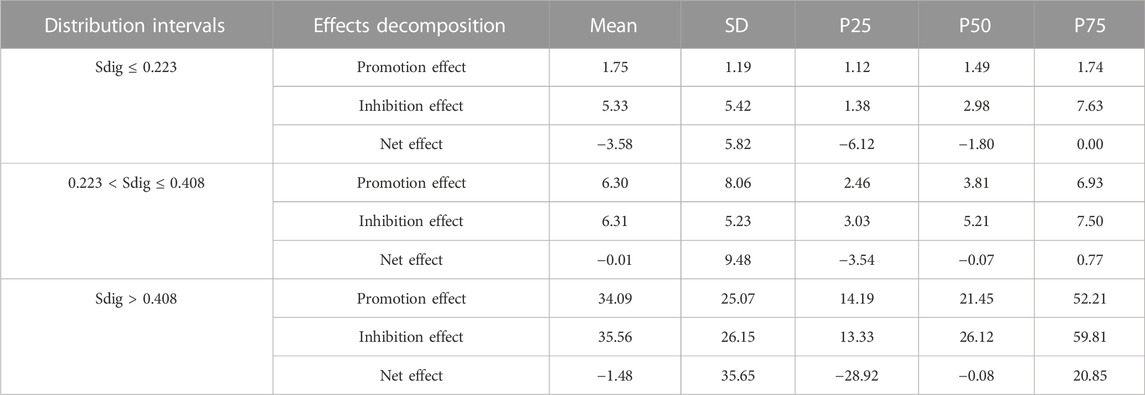
TABLE 6. Differences of the bilateral effects at various digital economy levels (%).
The regional human capital is just one of the macro-social environmental elements for the above-described economy operation. It is capable of offering favorable conditions for regional knowledge dissemination and technological innovation, and have a great impact of the function of digital economy upon the carbon emission. Herein, the average years of education (EDU) is selected to represent human capital, and the formula for calculating the indicator of EDU is: average years of education per capita = proportion of primary school educated population * 6 + proportion of junior high school educated population * 9 + proportion of senior high school educated population * 12 + proportion of college and above educated population * 16. Then we divide the human capital into three groups according to the 25%, 50%, and 75% quartile, and the consequences are depicted in Table 7. When EDU ≤ 8.725, the net effect of digital economy is 0.76%; when 8.725 < EDU ≤ 9.485, the net effect reaches −1.62%; when EDU > 9.485, the net effect reaches −2.59%. According to the above analysis, with the continuous increase of human capital, the net effect varies from positive to negative, which means the inhibition utility of the DECEs takes the dominant position step by step. These consequences indicate that the inhibition effect can be strengthened by the element of human capital, and it primarily consists these conclusions of Guo et al. (2022).
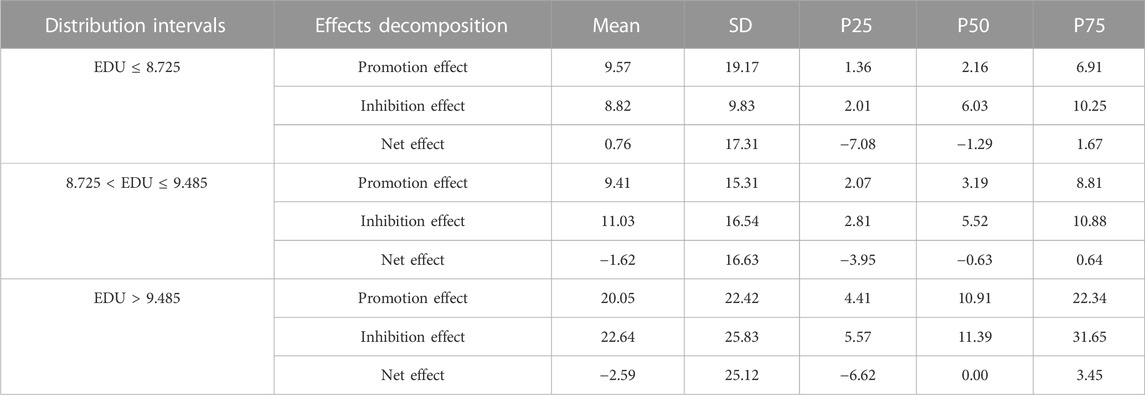
TABLE 7. Differences of the bilateral effects under various human capital levels (%).
The regional economic development is one of the macro-economic environmental elements for the digital economy operation. It is highly correlated with local markets and industrial structure, and subsequently lead to a huge influence of digital economy upon carbon emission. As a result, GDP per capita (PGdp) are selected with the intention of representing the regional economic advancement. What`s more, it is also divided into three groups according to the 25%, 50%, and 75% quartile as the above. The consequences are illustrated in Table 8. The net effect is −1.07% when PGdp ≤ 3.717, and −1.13% when 3.717 < PGdp ≤ 6.686. According to the above analysis, the inhibition effect gradually increases as the economic development rises, indicating that the economic development can reinforce the inhibition effect.
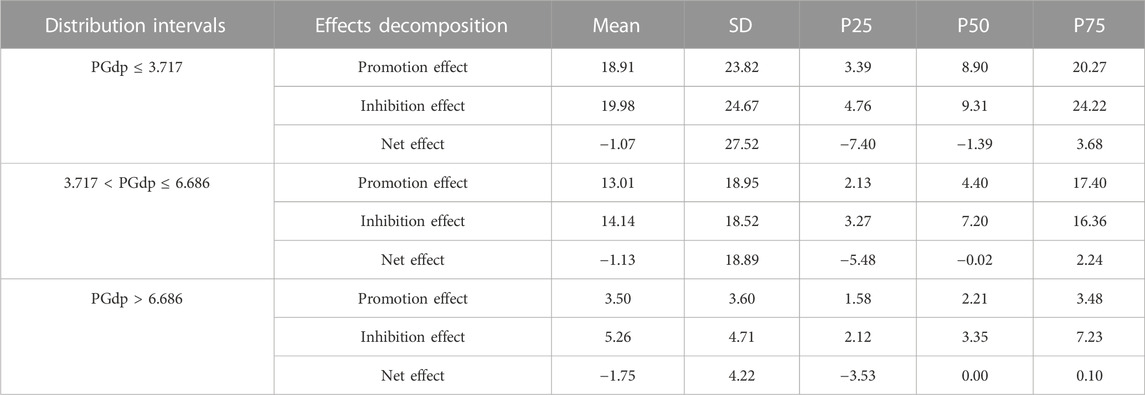
TABLE 8. Differences of the bilateral effects under various economic development levels (%).
With a view to verifying the consequence robustness, according to the research by Guo et al. (2022), the percentage of total RCEs to gross domestic product (GDP) in cities is chosen to represent the carbon emissions. In this respect, the bilateral effects are evaluated again, additionally, these consequences are illustrated in Table 9. The consequences exhibit that the promotion effect reaches 0.5590, furthermore, the inhibition effect is 0.9486. It indicates that there are bilateral effects of digital economy on RCEs, which is still consistent with the discoveries obtained above. In addition, according to influencing weights, the promotion and inhibition impact of the above-mentioned economy account for 25.8% and 74.2% of it, respectively. It shows that the inhibition effect plays a dominant part all the time during these years, thus further verifying the consequence robustness we obtained above.
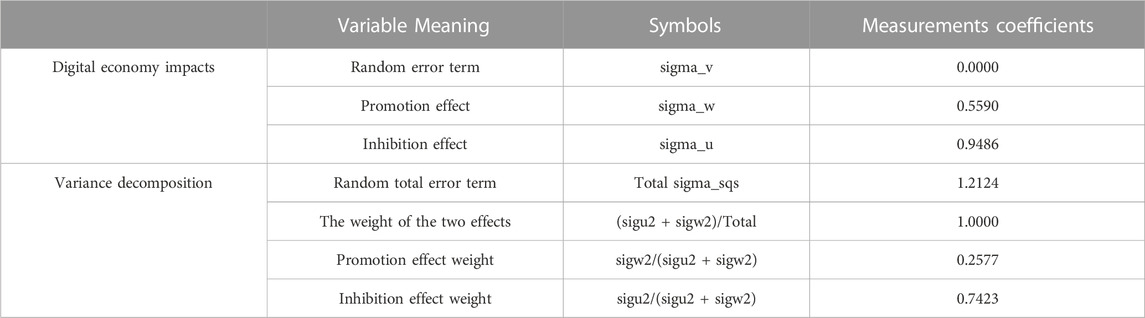
TABLE 9. Robustness tests for the effects and variance decomposition.
The deviation of inhibition effect, the net effect and the promotion effect are then estimated again. And these consequences of deviation are illustrated in Table 10. It is discovered that, with the advancement of the digital economy, its promotion effect raises RCEs by 3.04%, whereas the inhibition effect reduces regional carbon emissions by 12.71%. And the net effect makes the practical RCEs less than the frontier level by 9.67%, which is in line with the conclusions obtained above.
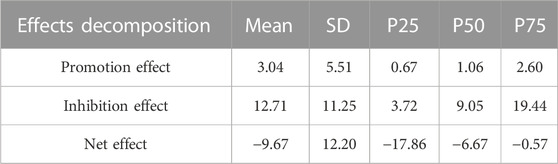
TABLE 10. Robustness test for the deviation of digital economy’s impacts on regional carbon emissions (%).
This study intends to investigate the mechanisms and the actual functions of DECEs in China. Via panel data originating in 30 provinces in China between 2011 and 2020, the two-tier stochastic frontier pattern has been adopted with the intention of gauging the inhibition effect, the promotion effect, alongside the net effect of the digital economy in this research. What`s more, the consequences denote that: the promotion effect of digital economy enables the level of the carbon emission to exceed the optimal level by 12.11%, while the inhibition effect enables the level of the carbon emission level to be less than the optimal level by 13.38%. With the combination of these two effects, the actual effect of the above-mentioned economy enables the carbonous emissions to be lower than the frontier boundary by 1.27%. In addition, on the part of space and time temporal distribution, the inhibition effect of the above-mentioned economy upon carbon emissions predominant and presents a declining trend during the study period. However, the inhibition effect in the east of the region is the highest in all of the other regions. Moreover, the digital economic level, economic advancement and human resource capital can also enhance the inhibition effect of DECEs.
In accordance with the conclusions above, some of policy recommendations are proposed as follows.
To begin with, it is in great need of accelerating the progression of the digital economy in all regions of China. Therefore, the establishment of a novel generation of information infrastructure needs to be established rapidly, the infrastructure containing big data centers, 5G network base stations, artificial intelligence, block-chain services, and the like, with the intention of sustaining the above-described economy transformation and expanding the digital economy function in reducing carbonous emissions. Besides, the data risk supervision laws and regulations also need to be enhanced as well as upgrading of the top-level design and mechanism construction of regional development.
Secondly, on the grounds of the regional development distinctions, the heterogeneous digital guidance and supporting strategies should be implemented. It is suggested that the government need to regulate the rate of above-described economy advancement in any of the regions, break up the industry barriers and geographical limitations of the novel models and novel commerce models, and improve the synergetic effect of digital economy governance in regions. Specifically, in the center and west of the regions, several strategies can be adopted. For example, the construction of information and communication infrastructure, innovation support and subsidy policies need to be implemented. And the digital industry support from the eastern region can be undertook as well. Meanwhile, in the east region, on the premise of maintaining the stable growth of the quality and scale of the original digital industry, the governments can expand the utilization scenarios of big data, facilitate the extensive usage of information technology and data elements in social and economic activities, and also explore new models of digital management and application.
Thirdly, the talent environment and economic development environment for China’s green and low-carbon transition are needed to be improved. On the one hand, the governments should upgrade the talent training model, deepen the discipline construction in the fields related to digital economy, actively cultivate high quality and comprehensive talents, so as to enhance the number and quality of regional talent. What`s more, apart from scientific &technological innovation, the regional industrial structure should be promoted in order to improve the core competitiveness and regional green development. Moreover, the new energy economy and the renewable energy industries are also needed to be accelerated, as well as improving the public’s awareness of energy conservation and energy efficiency, so as to gradually replace the traditional fossil resources with new energy and improve the energy conversion rate.
The research concentrates upon the bilateral effects of the DECEs, providing a theoretical reference to facilitate the regional green and sustainable development. Nevertheless, there still exist certain limitations which demands to be enhanced further. For one thing, on account of data availability, the indicators we choose cannot accurately cover the various aspects of the digital economy in zones, additionally, a more complicated evaluation system is preferred to enhance the practical significance of relative researches. For another, the study focuses upon the above-mentioned bilateral effects from a macro perspective, and fails in thinking about the analysis on effects of micro corporation digital transformation on emission reduction and regional energy conservation, which will be the expanded orientation of the follow-up work.
The raw data supporting the conclusion of this article will be made available by the authors, without undue reservation.
CL: Conceptualization, Writing–original draft, Writing–review and editing. WW: Investigation, Writing–review and editing. CD: Methodology, Writing–original draft. XT: Funding acquisition, Writing–review and editing. YY: Investigation, Writing–review and editing. ZZ: Investigation, Writing–review and editing.
The authors declare financial support was received for the research, authorship, and/or publication of this article. The work was supported by the National Social Science Fund (21BJY254), General Project of Philosophy and Social Sciences Research in colleges and Universities of Jiangsu Province (2023SJYB0042), and Graduate Research and Innovation Projects of Jiangsu Province (KYCX22_0691).
The authors declare that the research was conducted in the absence of any commercial or financial relationships that could be construed as a potential conflict of interest.
All claims expressed in this article are solely those of the authors and do not necessarily represent those of their affiliated organizations, or those of the publisher, the editors and the reviewers. Any product that may be evaluated in this article, or claim that may be made by its manufacturer, is not guaranteed or endorsed by the publisher.
Bhujabal, P., Sethi, N., and Padhan, P. C. (2021). ICT, foreign direct investment and environmental pollution in major Asia Pacific countries. Environ. Sci. Pollut. Res. 28 (31), 42649–42669. doi:10.1007/s11356-021-13619-w
Cai, W., Lai, K. H., Liu, C. H., Wei, F., Ma, M., Jia, S., et al. (2019). Promoting sustainability of manufacturing industry through the lean energy-saving and emission-reduction strategy. Sci. Total Environ. 665, 23–32. doi:10.1016/j.scitotenv.2019.02.069
Carlsson, B. (2004). The Digital Economy: what is new and what is not? Struct. Change Econ. Dyn. 15 (3), 245–264. doi:10.1016/j.strueco.2004.02.001
Chen, Q., Gao, X., Xie, S., Sun, L., Tian, S., and Hamori, S. (2021). On the predictability of China macro indicator with carbon emissions trading. Energy 14 (5), 1271. doi:10.3390/en14051271
Chen, Y. M. (2020). Improving market performance in the digital economy. China Econ. Rev. 62, 101482. doi:10.1016/j.chieco.2020.101482
Dong, F., Hu, M. Y., Gao, Y. J., Liu, Y., Zhu, J., and Pan, Y. (2022). How does digital economy affect carbon emissions? Evidence from global 60 countries. Sci. Total Environ. 852, 158401. doi:10.1016/j.scitotenv.2022.158401
Erdmann, L., and Hilty, L. M. (2010). Scenario analysis: exploring the macroeconomic impacts of information and communication technologies on greenhouse gas emissions. J. Industrial Ecol. 14, 826–843. doi:10.1111/j.1530-9290.2010.00277.x
Ge, L. Y., Mo, L. J., and Huang, N. B. (2022). Development of digital economy, upgrading of industrial structure and urban carbon emission. Mod. Finance Economics-Journal Tianjin Univ. Finance Econ. 10, 20–37. doi:10.19559/j.cnki.12-1387.2022.10.002
Guo, F., Wang, J. Y., Wang, F., Kong, T., and Zhang, X. (2020). Measuring the development of digital inclusive finance in China: indexing and spatial characteristics. China Econ. Q. 19 (04), 1401–1418. doi:10.13821/j.cnki.ceq.2020.03.12
Guo, F., Yang, S. G., and Ren, Y. (2022). Digital economy, green technology innovation and carbon emissions - empirical evidence from China at the city level. J. Shaanxi Normal Univ. (Philosophy Soc. Sci. Ed. 51 (03), 45–60. doi:10.15983/j.cnki.sxss.2022.0507
Hamdi, H., Sbia, R., and Shahbaz, M. (2014). The nexus between electricity consumption and economic growth in Bahrain. Econ. Model. 38, 227–237. doi:10.1016/j.econmod.2013.12.012
Han, X. F., Song, W. F., and Li, B. X. (2019). Can the Internet become a new driving force for regional innovation efficiency in China? China Ind. Econ. 7, 119–136. doi:10.19581/j.cnki.ciejournal.2019.07.007
Hao, X., Wen, S., Li, Y., Xu, Y., and Xue, Y. (2022). Can the digital economy development curb carbon emissions? Evidence from China. Front. Psychol. 13, 938918. doi:10.3389/fpsyg.2022.938918
Haseeb, A., Xia, E. J., Saud, S., Ahmad, A., and Khurshid, H. (2019). Does information and communication technologies improve environmental quality in the era of globalization? An empirical analysis. Environ. Sci. Pollut. Res. 26 (9), 8594–8608. doi:10.1007/s11356-019-04296-x
He, Y. Z., and Song, W. (2022). Analysis of the impact of carbon trading policies on carbon emission and carbon emission efficiency. Sustainability 14 (16), 10216. doi:10.3390/su141610216
Hu, Z., and Pei, K. B. (2020). Bi-directional R&D spillovers and operating performance: a two-tier stochastic frontier model. Econ. Lett. 195, 109485. doi:10.1016/j.econlet.2020.109485
Huang, Q. H., Yu, Y. X., and Zhang, S. L. (2019). Internet development and manufacturing productivity improvement: intrinsic mechanisms and China's experience. China Ind. Econ. 8, 5–23. doi:10.19581/j.cnki.ciejournal.2019.08.001
Kang, P. H., and Ru, S. F. (2020). Bilateral effects of environmental regulation on green innovation. China Popul. Resour. Environ. 30 (10), 93–104.
Kloppenburg, S., and Boekelo, M. (2019). Digital platforms and the future of energy provisioning: promises and perils for the next phase of the energy transition. Energy Res. Soc. Sci. 49, 68–73. doi:10.1016/j.erss.2018.10.016
Kuang, C., Li, W., and Huang, X. (2022). Spatial and temporal evolution of the coupling and coordination of carbon emission intensity and high-quality economic development in the middle reaches of Yangtze River city cluster and the driving factors. Econ. Geogr. 42 (08), 30–40. doi:10.15957/j.cnki.jjdl.2022.08.004
Kumbhakar, S., and Parmeter, C. (2009). The effects of match uncertainty and bargaining on labor market outcomes: evidence from firm and worker specific estimates. J. Prod. Analysis 31, 1–14. doi:10.1007/s11123-008-0117-3
Li, G., and Wen, H. W. (2023). The low-carbon effect of pursuing the honor of civilization? A quasi-experiment in Chinese cities. Econ. Analysis Policy 78, 343–357. doi:10.1016/j.eap.2023.03.014
Li, R. R., Li, L. J., and Wang, Q. (2022). The impact of energy efficiency on carbon emissions: evidence from the transportation sector in Chinese 30 provinces. Sustain. Cities Soc. 82, 103880. doi:10.1016/j.scs.2022.103880
Li, X. Y., Liu, J., and Ni, P. J. (2021). The impact of the digital economy on CO2 emissions: a theoretical and empirical analysis. Sustainability 13 (13), 7267. doi:10.3390/su13137267
Li, Z. G., and Wang, J. (2022). The dynamic impact of digital economy on carbon emission reduction: evidence city-level empirical data in China. J. Clean. Prod. 351, 131570. doi:10.1016/j.jclepro.2022.131570
Liu, J., Yang, Y. J., and Zhang, S. F. (2020). A study on the measurement and drivers of China's digital economy. Shanghai J. Econ. 6, 81–96. doi:10.19626/j.cnki.cn31-1163/f.2020.06.008
Liu, L. W., Chen, C. X., Zhao, Y. F., and Zhao, E. (2015). China's carbon-emissions trading: overview, challenges and future. Renew. Sustain. Energy Rev. 49, 254–266. doi:10.1016/j.rser.2015.04.076
Markandya, A., Arto, I., González-Eguino, M., and Román, M. V. (2016). Towards a green energy economy? Tracking the employment effects of low-carbon technologies in the European Union. Appl. Energy 179, 1342–1350. doi:10.1016/j.apenergy.2016.02.122
Miao, L. J., Chen, J., and Fan, T. Z. (2022). The impact of digital economy development on carbon emissions-a panel data analysis of 278 prefectural-level cities. Front. Environ. Sci. 10, 45–57.
Miao, Z., Balezentis, T., Tian, Z. H., Shao, S., Geng, Y., and Wu, R. (2019). Environmental performance and regulation effect of China’s atmospheric pollutant emissions: evidence from “three regions and ten urban agglomerations”. Environ. Resour. Econ. 74, 211–242. doi:10.1007/s10640-018-00315-6
Moyer, J. D., and Hughes, B. B. (2012). ICTs: do they contribute to increased carbon emissions? Technol. Forecast. Soc. Change 79 (5), 919–931. doi:10.1016/j.techfore.2011.12.005
Nibedita, B., and Irfan, M. (2021). The role of energy efficiency and energy diversity in reducing carbon emissions: empirical evidence on the long-run trade-off or synergy in emerging economies. Environment Science and Pollution Research 28 (40), 56938–56954. doi:10.1007/s11356-021-14642-7
Pan, W. R., Xie, T., Wang, Z. W., and Ma, L. S. (2022). Digital economy: an innovation driver for total factor productivity. J. Bus. Res. 139, 303–311. doi:10.1016/j.jbusres.2021.09.061
Papadopoulos, A. (2021). Measuring the effect of management on production: a two-tier stochastic frontier approach. Empir. Econ. 60 (6), 3011–3041. doi:10.1007/s00181-020-01946-9
Park, Y., Meng, F. C., and Baloch, M. A. (2018). The effect of ICT, financial development, growth, and trade openness on CO2 emissions: an empirical analysis. Environ. Sci. Pollut. Res. 25 (30), 30708–30719. doi:10.1007/s11356-018-3108-6
Raheem, I. D., Tiwari, A. K., and Balsalobre-Lorente, D. (2020). The role of ICT and financial development in CO2 emissions and economic growth. Environ. Sci. Pollut. Res. 27 (2), 1912–1922. doi:10.1007/s11356-019-06590-0
Ren, S. Y., Hao, Y., Xu, L., Wu, H., and Ba, N. (2021). Digitalization and energy: how does internet development affect China’s energy consumption? Energy Econ. 98, 105220. doi:10.1016/j.eneco.2021.105220
Sadik-Zada, E. R., and Ferrari, M. (2020). Environmental policy stringency, technical progress and pollution haven hypothesis. Sustainability 12 (9), 3880. doi:10.3390/su12093880
Salahuddin, M., and Alam, K. (2015). Internet usage, electricity consumption and economic growth in Australia: a time series evidence. Telematics Inf. 32 (4), 862–878. doi:10.1016/j.tele.2015.04.011
Salahuddin, M., Alam, K., and Ozturk, I. (2016). The effects of Internet usage and economic growth on CO2 emissions in OECD countries: a panel investigation. Renew. Sustain. Energy Rev. 62, 1226–1235. doi:10.1016/j.rser.2016.04.018
Schultes, A., Leimbach, M., Luderer, G., Pietzcker, R. C., Baumstark, L., Bauer, N., et al. (2018). Optimal international technology cooperation for the low-carbon transformation. Clim. Policy 18 (9), 1165–1176. doi:10.1080/14693062.2017.1409190
Shao, S., Li, X., Cao, J. H., and Yang, L. L. (2016). Economic policy options for haze pollution control in China: a spatial spillover perspective. Econ. Res. J. 51 (09), 73–88.
Sheng, P. F. (2017). Environmental pollution and the income gap between urban and rural residents: impacting mechanism and evidence from China's economic facts. China Popul. Resour. Environ. 27 (10), 56–63.
Shi, K. F., Chen, Y., Li, L. Y., and Huang, C. (2018). Spatiotemporal variations of urban CO2 emissions in China: a multiscale perspective. Appl. Energy 211, 218–229. doi:10.1016/j.apenergy.2017.11.042
Shobande, O. A. (2021). Decomposing the persistent and transitory effect of information and communication technology on environmental impacts assessment in africa: evidence from mundlak specification. Sustainability 13 (9), 4683. doi:10.3390/su13094683
Ulucak, R., Danish., , and Khan, S. U. D. (2020). Does information and communication technology affect CO2 mitigation under the pathway of sustainable development during the mode of globalization? Sustain. Dev. 28 (04), 857–867. doi:10.1002/sd.2041
Van-Den-Buuse, D., and Kolk, A. (2019). An exploration of smart city approaches by international ICT firms. Technol. Forecast. Soc. Change 142, 220–234. doi:10.1016/j.techfore.2018.07.029
Wang, H. L., and Guo, J. G. (2022). Impacts of digital inclusive finance on CO2 emissions from a spatial perspective: evidence from 272 cities in China. J. Clean. Prod. 355, 131618. doi:10.1016/j.jclepro.2022.131618
Wang, J., Luo, X., and Zhu, J. (2022a). Does the digital economy contribute to carbon emissions reduction? A city-level spatial analysis in China. Chin. J. Popul. Resour. Environ. 20 (2), 105–114. doi:10.1016/j.cjpre.2022.06.001
Wang, J. D., Dong, X. C., and Dong, K. Y. (2022b). How digital industries affect China’s carbon emissions? Analysis of the direct and indirect structural effects. Technol. Soc. 68, 101911. doi:10.1016/j.techsoc.2022.101911
Wang, X., Ren, X. H., and Wen, F. H. (2022d). Can digital financial inclusion affect CO2 emissions of China at the prefecture level? Evidence from a spatial econometric approach. Energy Econ. 109, 105966. doi:10.1016/j.eneco.2022.105966
Wang, Y. H., Wen, Z. G., Cao, X., and Dinga, C. D. (2022c). Is information and communications technology effective for industrial energy conservation and emission reduction? Evidence from three energy-intensive industries in China. Renew. Sustain. Energy Rev. 160, 112344. doi:10.1016/j.rser.2022.112344
Wen, H. W., Liang, W. T., and Lee, C. C. (2022). China's progress toward sustainable development in pursuit of carbon neutrality: regional differences and dynamic evolution. Environ. Impact Assess. Rev. 98, 106959. doi:10.1016/j.eiar.2022.106959
Wissner, M. (2011). The smart grid-a saucerful of secrets? Appl. Energy 88, 2509–2518. doi:10.1016/j.apenergy.2011.01.042
Xie, Y. F. (2022). The effect and mechanism of digital economy on regional carbon emission intensity. Contemp. Econ. Manag. 44 (02), 68–78. doi:10.13253/j.cnki.ddjjgl.2022.02.008
Xu, W. X., Zhou, J. P., and Liu, C. J. (2022). The impact of digital economy on urban carbon emissions: based on the analysis of spatial effects. Geogr. Res. 41 (01), 111–129.
Xue, Y., Tang, C., Wu, H. T., Liu, J., and Hao, Y. (2022). The emerging driving force of energy consumption in China: does digital economy development matter? Energy Policy 165, 112997. doi:10.1016/j.enpol.2022.112997
Yang, J., Cai, W., Ma, M. D., Li, L., Liu, C., Ma, X., et al. (2020). Driving forces of China’s CO2 emissions from energy consumption based on Kaya-LMDI methods. Sci. Total Environ. 711, 134569. doi:10.1016/j.scitotenv.2019.134569
Yi, M., Liu, Y. F., Sheng, M. S., and Wen, L. (2022). Effects of digital economy on carbon emission reduction: new evidence from China. Energy Policy 171, 113271. doi:10.1016/j.enpol.2022.113271
Zhang, H., and Feng, C. (2021). Innovative and low-carbon city: the impact of innovative city construction on carbon emission performance. South China J. Econ. 03, 36–53. doi:10.19592/j.cnki.scje.380220
Zhang, K., and Liang, Q. M. (2022). Quantifying trade-related carbon emission in China's provinces: insight from sectoral production technology heterogeneity. J. Clean Prod. 344, 131141. doi:10.1016/j.jclepro.2022.131141
Zhang, L., Mu, R. Y., Zhan, Y. F., Yu, J., Liu, L., Yu, Y., et al. (2022a). Digital economy, energy efficiency, and carbon emissions: evidence from provincial panel data in China. Sci. Total Environ. 852, 158403. doi:10.1016/j.scitotenv.2022.158403
Zhang, T., Jiang, F. X., and Wei, Z. T. (2021). Can digital economy become a new drivincg force for China’s high – quality economic development? Inq. into Econ. Issues 1, 25–39.
Zhang, W., Liu, X. M., Wang, D., and Zhou, J. P. (2022b). Digital economy and carbon emission performance: evidence at China’s city level. Energy Policy 165, 112927. doi:10.1016/j.enpol.2022.112927
Zhao, T., Zhang, Z., and Liang, S. K. (2020). Digital economy, entrepreneurship, and high-quality economic development: empirical evidence from urban China. J. Manag. World 36 (10), 65–76. doi:10.19744/j.cnki.11-1235/f.2020.0154
Keywords: digital economy, carbon emissions, promotion effect, inhibition effect, heterogeneous characteristics
Citation: Liu C, Wang W, Ding C, Teng X, Ye Y and Zhang Z (2023) The bilateral effects of digital economy on regional carbon emissions in China. Front. Environ. Sci. 11:1287811. doi: 10.3389/fenvs.2023.1287811
Received: 02 September 2023; Accepted: 13 November 2023;
Published: 30 November 2023.
Edited by:
Elkhan Richard Sadik-Zada, Ruhr University Bochum, GermanyCopyright © 2023 Liu, Wang, Ding, Teng, Ye and Zhang. This is an open-access article distributed under the terms of the Creative Commons Attribution License (CC BY). The use, distribution or reproduction in other forums is permitted, provided the original author(s) and the copyright owner(s) are credited and that the original publication in this journal is cited, in accordance with accepted academic practice. No use, distribution or reproduction is permitted which does not comply with these terms.
*Correspondence: Chenhui Ding, MjAwMjEzMTIwMDAyQGhodS5lZHUuY24=
Disclaimer: All claims expressed in this article are solely those of the authors and do not necessarily represent those of their affiliated organizations, or those of the publisher, the editors and the reviewers. Any product that may be evaluated in this article or claim that may be made by its manufacturer is not guaranteed or endorsed by the publisher.
Research integrity at Frontiers
Learn more about the work of our research integrity team to safeguard the quality of each article we publish.