
94% of researchers rate our articles as excellent or good
Learn more about the work of our research integrity team to safeguard the quality of each article we publish.
Find out more
ORIGINAL RESEARCH article
Front. Environ. Sci., 16 November 2023
Sec. Environmental Informatics and Remote Sensing
Volume 11 - 2023 | https://doi.org/10.3389/fenvs.2023.1280268
This article is part of the Research TopicGeophysical, Climatological and Anthropogenic Hazards and Disaster: Vulnerability, Risk Assessment, and SustainabilityView all 11 articles
 Martiwi Diah Setiawati1
 Uday Chatterjee2*
 Yudha Setiawan Djamil3
 La Ode Alifatri1
 Muhammad Rizki Nandika1Herlambang Aulia Rachman4
 Indarto Happy Supriyadi1
 Nuraini Rahma Hanifa5
 Aidy M. Muslim6Tsuyoshi Eguchi7Bayu Prayudha1
 Aulia Oktaviani5
 Novi Susetyo Adi8
 Jeverson Renyaan1Siti Sulha1,9Sam Wouthuyzen1
 Subodh Chandra Pal10*
 Abu Reza Md. Towfiqul Islam11,12*
 Edris Alam13,14
 Md Kamrul Islam15
Jakarta, the biggest city in Indonesia, has one district that consists of hundreds of islands that face severe climate hazards called the Seribu Islands complex. This study explores the evidence of local climate trends, the potential impact, and its policy intervention on Seribu Islands, which are classified as small island states and widely recognized as being especially at risk from climate change, threatening their economic and social growth. Long-term in-situ climate data, satellite data, interviews with local stakeholders, and literature reviews were utilized to conduct an exploratory descriptive analysis. The result revealed that Seribu Island experienced a 2.2°C increase in minimum temperature from 1980 until 2021, 3.5-fold of the frequency of extreme temperature and precipitation, 4.17 mm/year of sea level rise, and 10.8 ha land expansion in the densest island. Moreover, about 67% of the inhabitant’s islands were occupied by built-up areas that cover more than 50% of the region. Further, under the worst-case SLR scenario, about 58.4% of the area will be affected, and about 29 islands will disappear. This evidence was also reinforced by every single local respondent’s viewpoint who felt that climate change is occurring in the region. Even though the region faces a severe threat of climate change, the issue of climate change adaptation has not been mainstreamed yet into their local policy. Therefore, the urgency of a real-time climate ground station, a real-time early warning system, and establishing a Regional Disaster Management Agency (BPBD) at the district level have yet to be addressed. Furthermore, the knowledge gained from such case studies is outlined, along with some scientific evidence that may assist small island states in better fostering the opportunities provided by climate change adaptation.
Climate change has been recognized as a severe concern, threatening people’s lives by generated hazards and environmental deterioration (Fujimori et al., 2019). Policies regarding climate change are widely acknowledged as a viable approach to address global warming, which includes a set of rules or tactics developed by a nation or state/province (Meckling and Allan, 2020). In the past few years, more nations have developed applicable climate policies focused on their local or international needs, aiming to create a resilient society for future generations. Thus, various policy measures can be utilized to combat climate change, including legislation, monetary interventions such as taxes and levies, financial aid in subsidies, volunteerism strategies, and educational initiatives (Zheng et al., 2023).
Various policy measures have multiple functions in addressing the effects of climate change. Economic tools, for example, primarily manage financial difficulties by providing funds, subsidies, tax breaks, credits, and direct investment. Legislative instruments, on the other hand, are focused on improving energy use efficiency and increasing renewable energy generation by obligatory criteria like norms, standards, and obligation schemes (Liu et al., 2019). While the threat of climate change grows, policies have been reinforced and improved. Yet, some nations are constrained by the present policy combination. For example, Brazil employed mixed policies for climate change adaptation, but instead of promoting sustainable production and climate risk management, it frequently encourages the accomplishment of societal vulnerability targets (Milhorance et al., 2020). Another study revealed that most adaptation strategies demonstrated “one-size-fits-all governance arrangements,” which were mostly voluntary activities, lacked a coordination hub and relied on sectoral self-interest, and those policies are insufficient to tackle complex issues such as climate change (Clar and Steurer, 2019). Local conditions, a limited choice of policy tools, a lack of robust supervisory procedures, poor awareness of environmental protection, and a missing political will can all lead to policy setbacks (Sokolowski and Heffron, 2022).
Indonesia is listed as one of the most vulnerable countries regarding climate risk, with a high vulnerability to flooding and extreme temperatures (Neumann et al., 2015). Moreover, recent studies revealed that nine growing cities in Indonesia are exposed to serious sea level rise (SLR) and floods (Nagu et al., 2016); for instance, the SLR in Ternate City leads to sea salt intrusion of groundwater and a decline in the supply of clean water (Gaborit, 2022). Another study also revealed that there is a 1.37% decline in the number of foreign visitors to Indonesia for every 1% increase in temperature and relative humidity (Susanto et al., 2020), which is a significant loss for the country since six percent of Indonesia’s GDP came from tourism (World Travel and Tourism Council, 2019). Moreover, climate change also affects public health in the country, whereas Sumatra has experienced an increase in respiratory illnesses during the past 20 years due to the complex linkages of soil degradation, deforestation, and climatic change (Gan et al., 2021). Also, the severity of these threats is projected to increase in the future (The World Bank Group and Asian Development Bank, 2021). In addition, by 2050, Indonesia is projected to experience a loss of 8.6 billion USD, or 1.3% of the current Indonesian GDP (USAID, 2016). Besides, without effective adaptation, this country will face permanent flooding by 2070, impacting millions of people (The World Bank Group and Asian Development Bank, 2021). Therefore, addressing the climate change impact becomes a severe issue.
Seribu Islands district is a group of small islands located in the capital city of Indonesia, Jakarta. The territory consists of 116 islands which are located 30 km away from the northern part of Jakarta. This district has about 28 thousand inhabitants by 2021 who shared a total land area of 8.7 km2 (BPS Seribu Islands, 2022). Its nominal Gross Regional Domestic Product (GRDP) at Current Market Prices in 2021 was 0.5 billion USD which equals 0.28% of Jakarta’s GRDP. Moreover, in the past 5 years, mining and quarrying (i.e., 77%) remain the highest contributor to the GRDP in the region, followed by agriculture, forestry, and fishing (5.4%) (BPS Seribu Islands, 2022). Mining and quarrying mainly involved oil, gas, and geothermal in the islands. In recent years, the hospitality industry has been developed, with a total number of visitors in 2021 of 159 thousand people (BPS Seribu Islands, 2022), but still, it is not the region’s primary revenue.
Even though the region is within the territory of Jakarta Province, all of the population lived in the rural, remote islands. Also, among five districts in Jakarta city, Seribu Islands has the highest poverty rate (i.e., 15%) and the lowest human development index (BPS DKI Jakarta, 2021). Therefore, like other small island developing States, Seribu Islands are very vulnerable to the adverse impact of climate change due to its geographic conditions and socio-economic aspects (Enssle and Kabisch, 2020). Extreme weather events such as drought, heat stress, ocean acidification, tropical cyclones and related storm surge, shifting patterns of precipitation, sea level rise, and coastal flooding endanger inhabitants’ livelihoods and impact all economic sectors (Change, 2014). In other words, climate change is an obstacle to economic and social development in a region. Moreover, research conducted by ICCR (2010) stated that Indonesia experienced SLR with an average rate of 6 mm/year, and it is almost threefold than the global SLR rate (2.2 mm/year). Also, six islands (i.e., Ubi Besar Island, Ubi Kecil Island, Salak Island, Nyamuk Besar Island, Dakun Island, and Anyer Kecil) were reported disappeared in the region due to the abrasion (Kompas, 2015). Consequently, appropriate mitigation and adaptation plans are critical to human resilience and survival against climate change.
Most of the studies in Seribu Islands focused on benthic habitat and mangrove biodiversity (Johan et al., 2015; Cahyarini et al., 2016; Draisma et al., 2018), marine pollution and particular natural disasters (Lestari et al., 2022) in this region and those topics were explored in separate issues. However, almost no paper conducted integrated studies on the local evidence of climate change and its related impact on the communities in this area. Therefore, this research explores the local realities of climate change evidence, potential impact, and local preparedness in the Seribu Islands by utilizing climate dataset, satellite imageries, literature review on policy documents and deep interview with local stakeholders. This type of research will assist policymakers in developing development plans by incorporating scientific assessment through a multidisciplinary approach.
This study is an exploratory analysis that integrated four main data sets; the time series climate data, satellite data, interview and field survey and literature review (Figure 1). The climate data set was used to determine the trend of temperature and rainfall patterns over the 41 years period in the study area. We utilized the climate dataset in Kemayoran Station (i.e., the longest and closest climate data station near Jakarta Bay), Jakarta (Figure 2) because there is no available long term in-situ climate dataset within the Seribu Islands complex (i.e., the government just installed the Automatic Weather System within the islands in June 2020) (DKI Jakarta Government, 2023). The satellite data set was used to analyze the possible impact of climate change and anthropogenic pressure in the region. The literature review was utilized to record the historical trend of climate-related hazard in the area, to determine the potential impact on society, and to identify the national and local policies of each hazard type in the small islands. While interview with local stakeholders were used as a validation for the finding and to explore more on their personal experience on climate change along with their capacity and adaptation effort. Moreover, field survey was conducted to map the native land of the densest island by considering local resident perception. Table 1 shows the list of the data set used in this study.
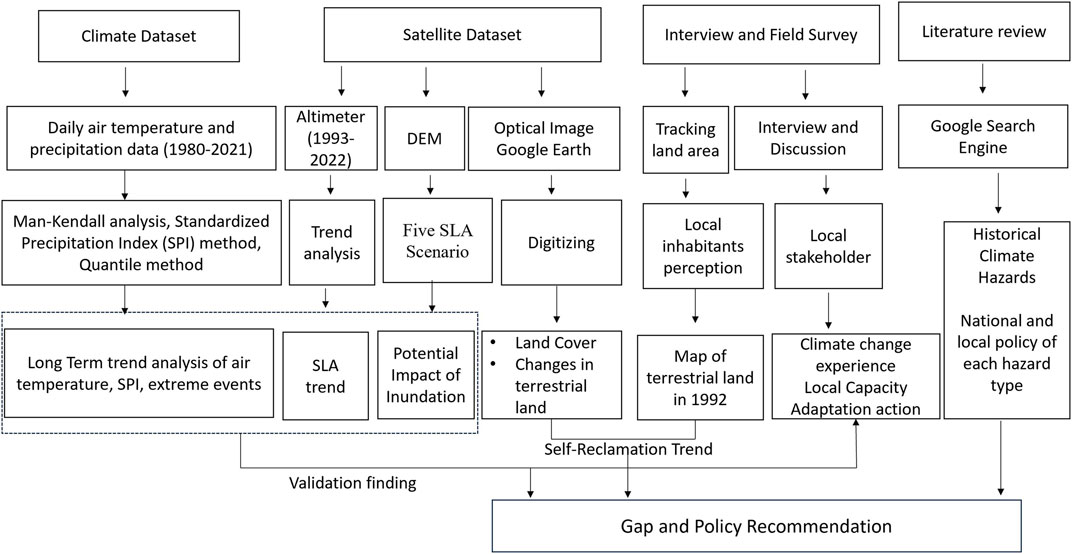
FIGURE 1. Flow chart for research methodology. DEM and SLA stands for Digital Elevation Model and Sea level Anomaly.
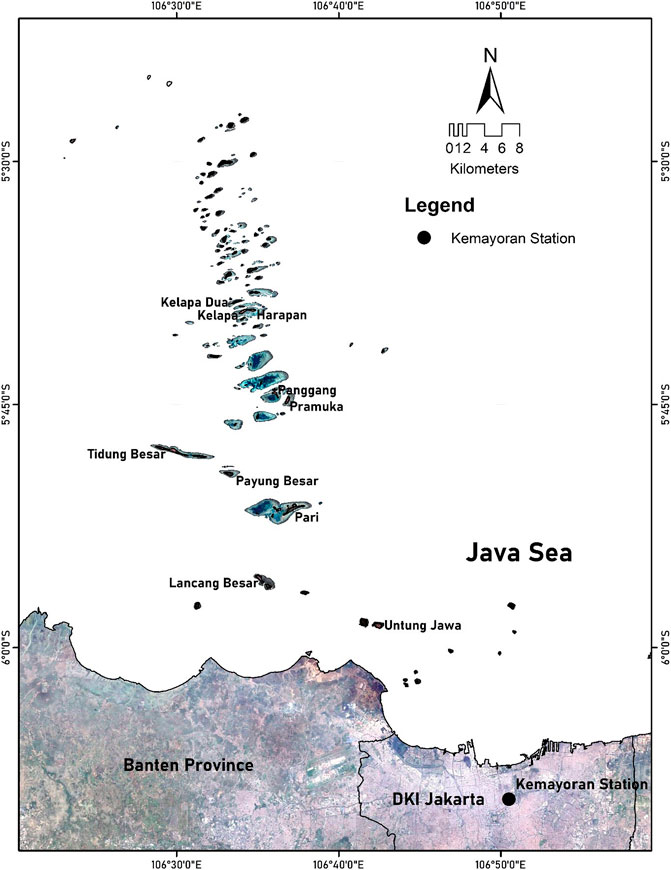
FIGURE 2. Map of the study area at Seribu Islands Complex, Jakarta. Basemap of Seribu Islands Complex: Sentinel 2A- 24 April 2021 and Sentinel 2B-28 July 2021.
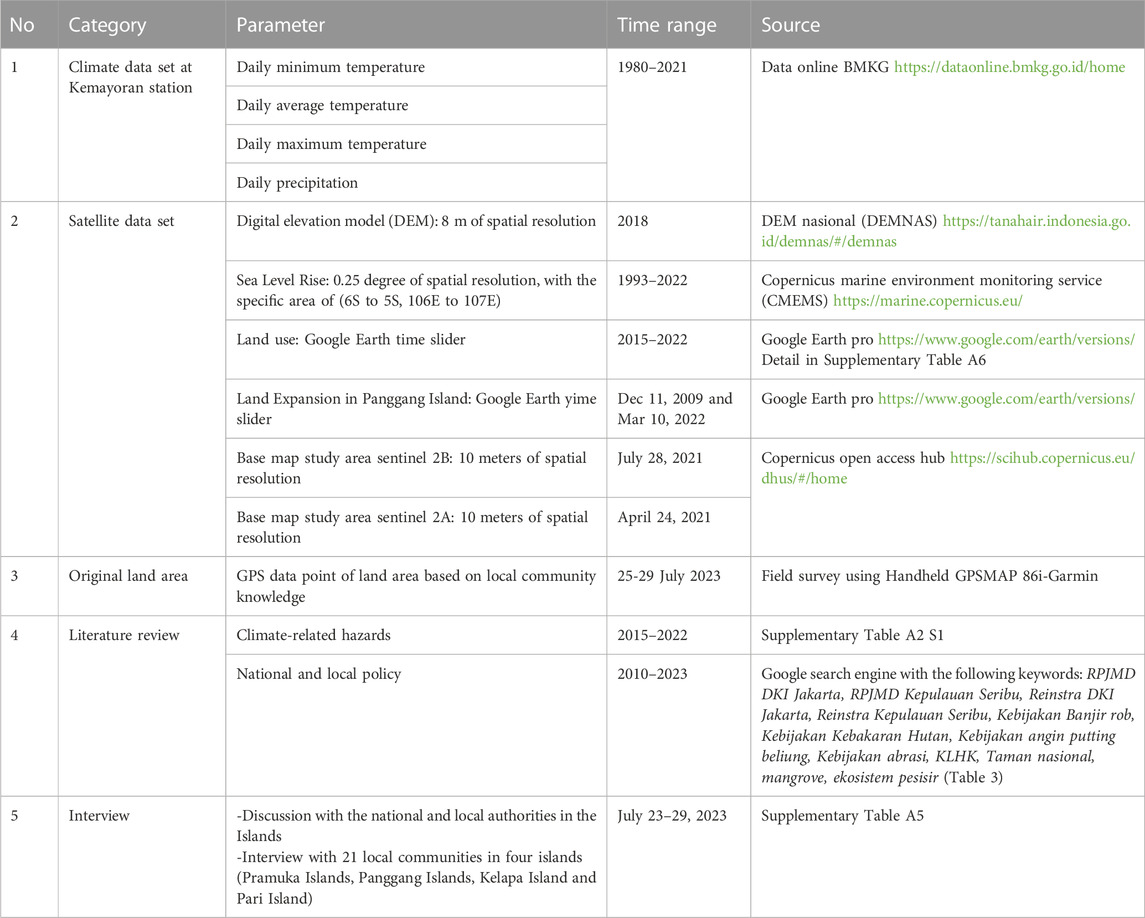
TABLE 1. The detailed dataset used in this study.
Figure 2 shows the area coverage of the study area of the Seribu Islands. This administrative map was obtained from Indonesian Geospatial Agency in 2010. Based on the figure, Seribu Islands consists of 106 islands with names and 8 islands without names. The area of the islands ranged from 0.04 ha to 59.9 ha with an average area of 8.7 ha. Therefore, there are no rivers or springs on the Seribu Islands, which are sources of surface hydrology. Despite the size of the island being relatively small, most of this region was categorized as a low-lying area where the elevation ranged from 0 to 31.88 m with an average of 3.9 m above sea level (DEMNAS, 2018). Since it is located in the tropical region the temperature is almost similar throughout the year. The annual average rainfall and wind speed were 1888.74 mm and 4–10 m/s, respectively (BPS Seribu Islands, 2022). The highest precipitation rate and wind speed mainly occurred during the West monsoon (November to April), while dry condition occurs in the East Monsson (June to September). The monsoon condition affects the daily life of local communities in the regions that mostly relies their job on natural resources.
Seribu Islands has two main sub-districts: The North Seribu Islands and The South Seribu Islands. The population in the North is higher than in the South, but the population density in the South is higher than in the North (BPS Seribu Islands, 2022). Moreover, the population has increased by 30% from 2009 until 2021 (BPS DKI Jakarta, 2022), which means the population will double by 2045. This condition put heavy anthropogenic pressure on these small islands, affecting the coastal ecosystem and local communities.
This paper utilized long-term daily climate data sets such as minimum temperature, average temperature, and maximum temperature from the Kemayoran climate station in Jakarta (Table 1). To visualize the trend of the air temperature in the study area, we conducted a moving average analysis with three types of time scales (i.e., monthly, 12-month scale, and 60-month scales) and calculated the frequency of extreme temperature (i.e., percentile 90 and percentile 99). Moreover, in order to know the significant of the temperature trend, we utilized Mann-Kendal (MK) Test. Detailed on how to calculate the MK test can refer the equation from Kandya et al., 2021. This MK test is non-parametric test that has been suggested by the world meteorological organization (World Meteorological Organization, 2012b) due to its data distribution and outlier consideration (Nashwan and Shahid. 2018).
Since the precipitation amount and pattern have seasonal variation, we conducted the standardized precipitation Index (SPI) under the WMO 2012a methodology (WMO, 2012a) and the frequency of extreme precipitation (i.e., percentile 99) to determine the wet and dry levels and the possible impact. Moreover, we estimated the trend of sea level anomaly (SLA), as an impact of the anthropogenic global warming, around Seribu Islands by using satellite multi-mission altimeter data from the E. U. Copernicus Marine and Environment Monitoring Service (CMEMS) (Table 1). This CMEMS dataset was recommended by Fenoglio-Marc et al. (2012) following the validity of the SLA trend from the dataset with the in-situ data from deep-water tide gauges around western Maritime Continent. For the shallow-water area, such as Seribu Islands, despite the overestimation of the SLA trend by the satellite data over the tide-gauges’s, their range of uncertainties remain overlapped (Nurmaulia et al., 2010).
In this paper, we used five SLR scenarios; 1 m, 2 m, 3 m, 4 m, and 5 m, and utilized geographic information system (GIS) software (ArcGIS 10.8.2) to extract the inundation zone based on the DEM data set. We utilized this scenario because it was previously applied by the world bank for a global impact assessment report (Dasgupta et al., 2009; Pickering et al., 2017), and it also was due to the variation of the elevation of the region of interest. The dimension of the potentially affected area will be the percentage of the affected area, number of populations, and number of missing islands.
In this paper land cover analysis and land expansion analysis was conducted by digitizing the feature using Google Earth Pro. We utilized the latest recorded image of Google earth time slider in order to digitize the land cover (Detailed in Supplementary Table A6). The land cover analysis was only conducted in the inhabitant islands (ten islands), while land expansion analysis only was conducted in the most-dense island in the region (Panggang Island). Meanwhile for land expansion we did field survey for mapping the original land area based on local communities’ perception (i.e., people who live more than 30 years within the region) and we digitized in the Google Earth Pro of the oldest very high-resolution image (2009) and the newest high - resolution image in the targeted areas (2022) (Table 1). Finally, all the dataset then converted to shapefile and proceed for land calculation in the Arc. GIS 10.8.2.
For the policy study, an assessment of the literature was carried out using the Google search engine. In this study, we didn’t use a scientific internet search engine to find the grey literature since most action plans usually exist in governmental development plan documents, governmental regulations, or project reports. Additionally, we limited our keyword searches to Bahasa Indonesia as the primary language since we focused on national and local policy intervention in disaster risk reduction. The following keywords were used in this study: RPJMD DKI Jakarta, RPJMD Kepulauan Seribu, Reinstra DKI Jakarta, Reinstra Kepulauan Seribu, Kebijakan Banjir rob, Kebijakan Kebakaran Hutan, Kebijakan angin putting beliung, Kebijakan abrasi, KLHK, Taman nasional, mangrove, ekosistem pesisir. Moreover, we also did a research dissemination and discussion to three representative of Kepulauan Seribu local authorities and one representative of the national park and deep interviews with 21 local communities in four islands (Panggang, Pramuka, Pari, and Kelapa Islands) from 23–29 July 2023 to qualitatively validate our climate hazard analysis and to know what kind of local authorities/communities action had been taken to tackle those disasters.
Figure 3 shows the air temperature trend over 41 years period within the study area. As shown in the figure, the annual minimum, average, and maximum air temperature ranged from 23.9°C to 25.8°C, 26.1°C–29.9°C and 29°C–34.5°C, respectively. Morever, based on the Man Kendall test, it can be inferred that the minimum, average and maximum temperature over the study period has statistically significant of increasing trend at 99% confidence level Supplementary Table A3. Moreover, Based on the linear regression of the 60-month scale of moving average analysis, the minimum temperature (Figure 3A) and average temperature (Figure 2B) have a strong tendency of an increasing trend with a correlation coefficient of 0.97 and 0.84, respectively. Meanwhile, the maximum temperature (Figure 3C) depicts a low tendency of warming trend with a coefficient correlation of 0.53, respectively. Also, the study area’s minimum and average temperatures experienced an increasing trend of 0.05°C/year and 0.03°C/year. It means, from the initial year (1980) until 2021, the study area experienced a 1.4°C increase in average temperature and 2.2°C in minimum temperature, respectively.
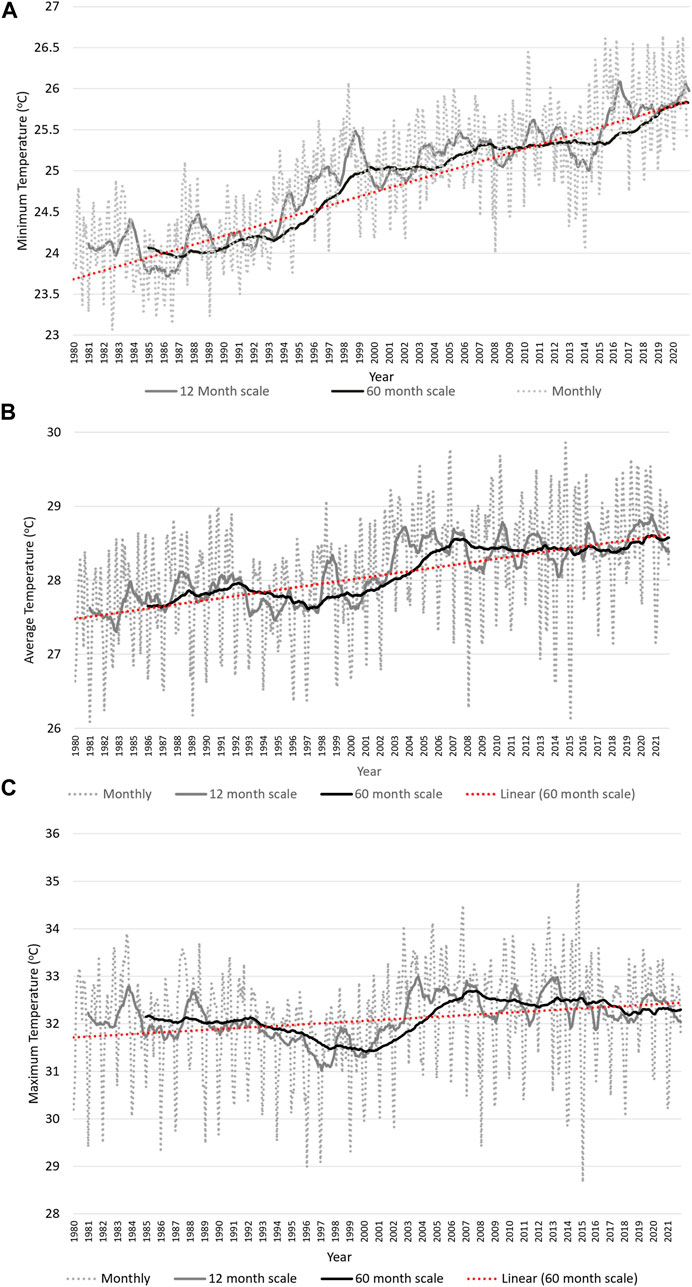
FIGURE 3. The minimum temperature (A), average temperature (B), and maximum temperature (C) trend from 1980 to 2021 in the study area.
Figure 4 depicts the annual frequency of extreme temperatures that occurred in Seribu Islands. The P99 and P90 define as the frequency of the top one percent (i.e., ≥35.2°C) and 10% (≥34°C) hottest temperature during the study period. Based on Figure 4, almost every year, the study area experienced an extreme temperature of P90 and P99 with an average of 36 times/year and four times/year. However, the frequency of extreme temperatures (P90 and P99) is more frequent after the year 2002, with the peak occurrences in 2014 (i.e., P90 ∼ 107 times/year and P99∼30 times/year). Moreover, compared with the period of 1980–2001, the millennium period shows 150% and 324% of P90 and P99 more frequently, which means the frequency of potential natural disasters might double/triple. Also, based on the MK test depicted that the extreme temperature has statistically increasing trend over 41 years in the study area at confidence level of 95% (Supplementary Table A3).
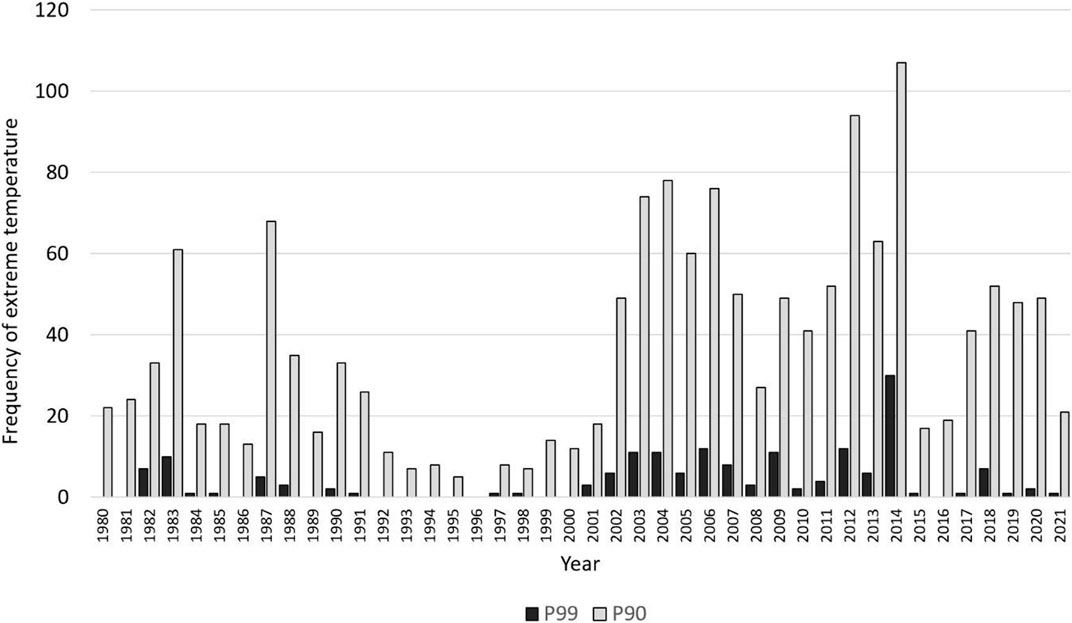
FIGURE 4. The frequency of annual extreme temperature in the study area. The extreme temperature was defined as the top 1% (P99) and top 10% (PP90) of the hottest daily maximum temperature during the study period.
Figure 5 describes the wetness and the drought level in a certain period in Seribu Islands. The range of 12-month scale of the SPI index ranged from-3 to +3.5, which defined that the study area experienced extreme dryness (≤-2) and extreme wetness (≥+2). The annual extreme dry occurred in 1997/1998 and 2015/2016, while the extreme wetness occurred in 2013/2014 and 2020/2021. Moreover, the study area experienced a long-term wetness period (red color) from 2007 to 2021, where from 2013 to 2021 experienced three periods of extreme wetness. Meanwhile, from 1997 until 2013, the region continuously experienced moderate to extreme dryness levels (red color). Moreover, in the period between 1980 and 1996, the study area depicts a normal condition (i.e., -1≤SPI≤1).
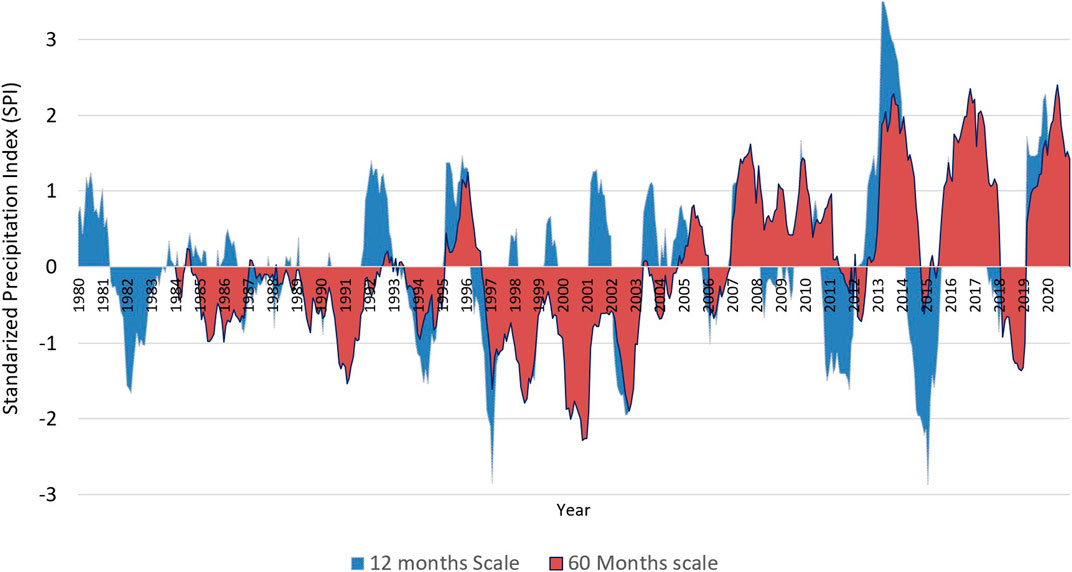
FIGURE 5. Standardized Precipitation Index (SPI) from 1980 to 2020 with 12-month scale (blue) and 60-month scale (red).
Figure 6 shows SLA trend within the study area for 29 years based on CMEMS dataset. The figure shows that the study area experienced an increase of SLA of 4.17 ± 0.83 mm/year from 1993 to 2022 (Figure 6). The result generally indicated future SLA increases and showed a slow-rising trend. Furthermore, this research area has seen a rise in sea level of almost 150.8 mm since 1993. This number looks very small, but when it occurs during the spring tide or during the storm surge, the impact is adverse for the local communities (i.e., it exceeds 250 mm). Moreover, since the turn of the century, the global sea level has risen by around 178 mm, and by the end of the century, SLR may have risen by 0.3–1.8 m (Jevrejeva et al., 2016).
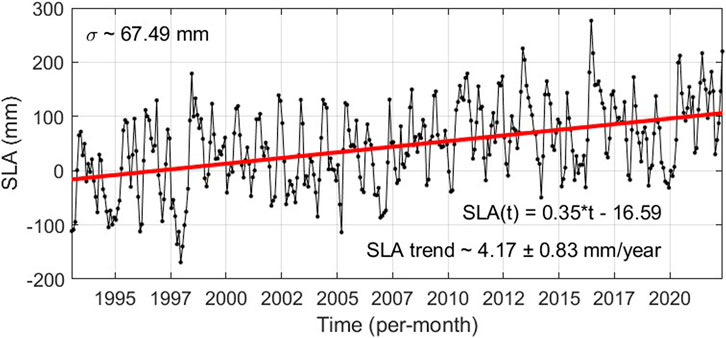
FIGURE 6. Monthly sea level anomaly (SLA) for the period of 1993–2022 from the CMEMS satellite altimeter dataset averaged around Seribu Islands area (6S to 5S, 106E to 107E). Red line is the long-term trend of the monthly SLA based on linear regression with its equation below it. The yearly trend is also presented with its range of uncertainty at 95% confidence level. Sigma is the standard deviation of the detrended SLA.
Therefore, we simulated the potential impact using some worst-case scenarios as introduced by Dasgupta et al., 2009; Pickering et al., 2017. Table 2 depicts the summary of SLR impact in Seribu Islands, and Figure 7 shows the simulations in three inhabitants islands (i.e., Harapan, Kelapa, and Kelapa Dua Island) under five SLR scenario. The result revealed that under a 1 m SLR scenario, 25.8% of the Seribu Islands area would be inundated, affecting about seven thousand people. Moreover, under this scenario, about 20 islands will disappear within the study area. Additionally, under a 5 m SLR scenario, about 29 islands will disappear, with about 16.5 thousand people will be affected.
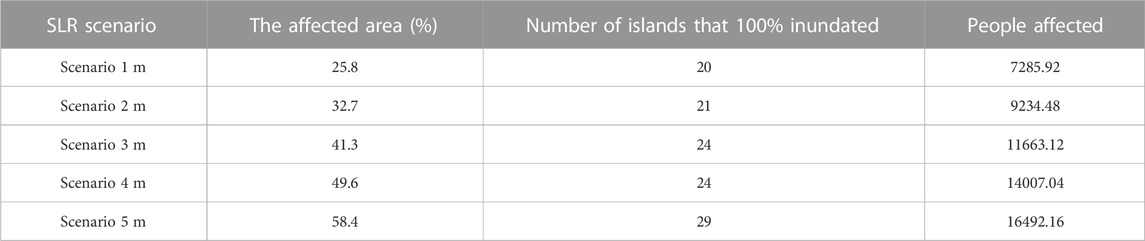
TABLE 2. Impact of sea level rise (SLR) in the study area. The calculation based on DEMNAS dataset.
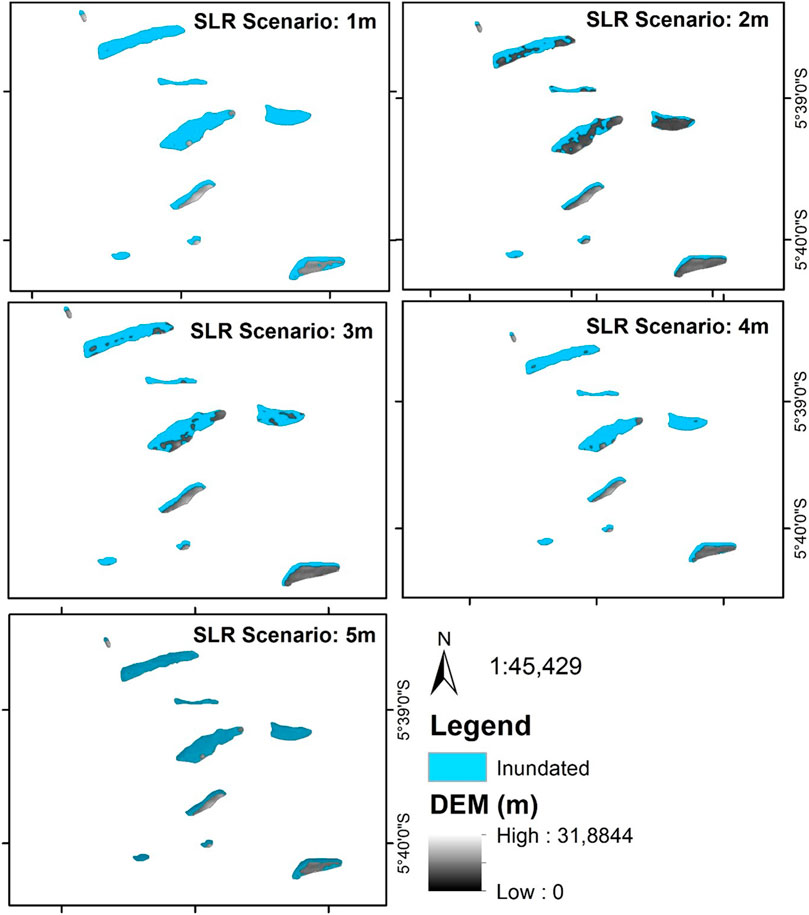
FIGURE 7. Simulation of inundation area from various SLR scenarios in Harapan dan Kelapa Islands. Basemap: DEMNAS 2018 with spatial resolution of 8 m
Figure 7 depicts a simulation of nine islands in the study area; three have inhabitants. The blue color indicates the inundated area, while the grey gradation color presents the basemap of DEM. Among the three islands, Kelapa Islands has the highest population, followed by Harapan Island and Kelapa Dua Islands. In Kelapa Islands, under a 1 m SLR scenario, around 16.7% area will be inundated. Meanwhile, under a 2 m SLR scenario, nearly 43% of the site will be permanently inundated, which means about 2703 people would be severely affected. Moreover, in Harapan Island and Kelapa Dua Island, nearly 83% and 93% of the areas would be permanently inundated under the 3 m SLR scenario.
Kelapa, Kelapa Dua, and Harapan Islands were known as one of the main tourist destinations, especially for domestic visitors around Jakarta Capital City. For instance, in 2021, even during the pandemic, domestic visitors reached 22,251 people in those islands (BPS Seribu Islands 2022). Therefore, having permanent inundation on that island would create a massive economic loss for the coastal communities (i.e., major job losses, loss of properties, and massive migration to the mainland). Moreover, under the worst-case scenario (5 m), those three inhabitants’ islands would disappear, and the condition would create the mainland of Jakarta city severely affected by sea level rise, storm surge, and salt intrusion due to no natural protection anymore.
Figure 8 shows the descriptive statistics on how local communities experience the climate change along its capacity to cope the problem within the Seribu Island Complex. Based on the interview from 21 respondent from four different islands, all the respondent experienced the change of climate whereas most of them experience changing seasonality/unpredictable weathers followed by extreme heat, erratic winds and frequent climate hazards. Moreover, tidal flooding and tornados were the most common severe climate hazards faced by the local inhabitants. Since the climate hazards were frequent hit the islands, the local communities did the adaptation effort as follows: pay attention with the movement of tornados, evacuate in the safer place and modifying the house structure. However, not all local communities are resilient of climate severe climate hazards since 45% and 35% of the respondent does not have saving and job alternative and 4% responded did not have access to early warning system. Furthermore, nearly half of respondent received the early warning system from Whatssapp group followed by BMKG information and Windy application.
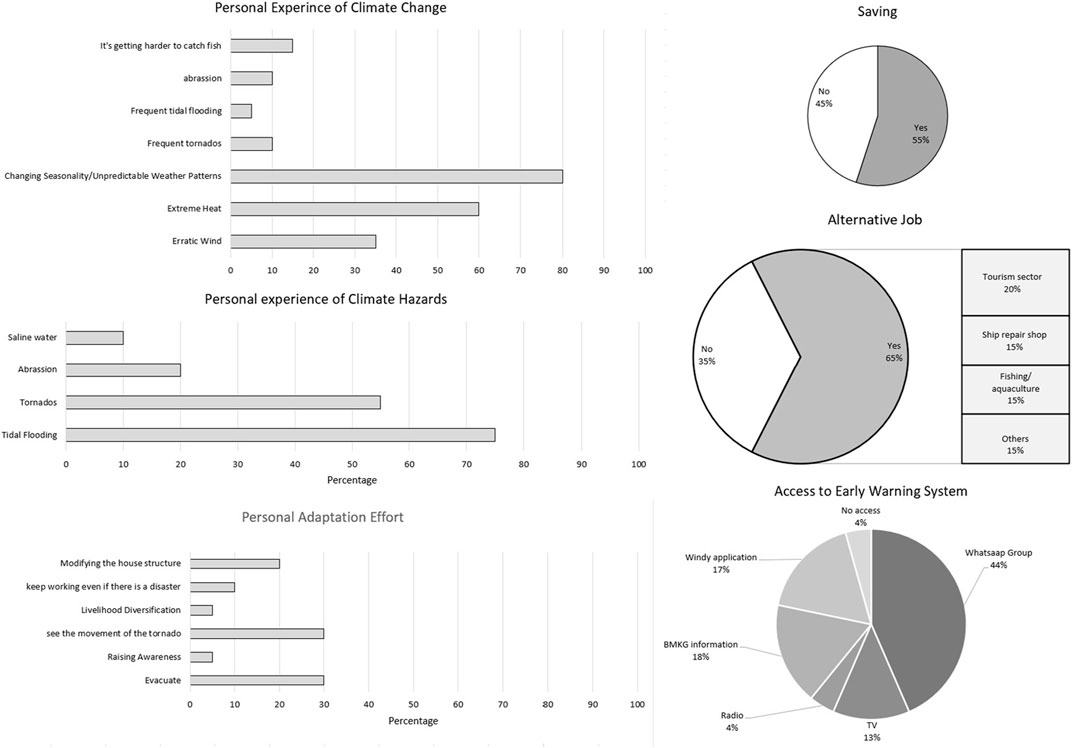
FIGURE 8. Personal experience of local communities towards climate change, climate hazards, adaptation effort, and its capacity to do the adaptation.
Table 3 depicts the national and local policy/commitment on mitigating the climate hazards within the study area. In this study, the climate hazards was referred to threats posed by the climate and weather condition such as tidal flooding, cyclone, tornados, flooding, forest fires etc. (Setiawati et al., 2023a). According to the Table 3, the regulation regarding specified climate hazard preventing and mitigating program mostly issued by the national government such as forest fire, tidal flooding and extreme weather. In case of abrasion and tidal flooding, the provincial government put an extra effort to tackle the problem within Seribu Islands complex; whereas they put tidal flooding as the top priority issues and various provincial government program to reduce the risk of those hazards. However, at the district level development program, they mainly worked on the general disaster management such as providing the basic needs after the disaster, raising awareness, cross-sectoral coordination during/after the disaster, and conducting data collection. According to Mid-term Strategic Plan (Reinstra) of Seribu Islands Regency 2023–2026, there is two main climate hazards that pose severe impacts within the region; tornados and tidal flooding. However, the specific national regulation or provincial mid-term development program have not addressed this issue yet.
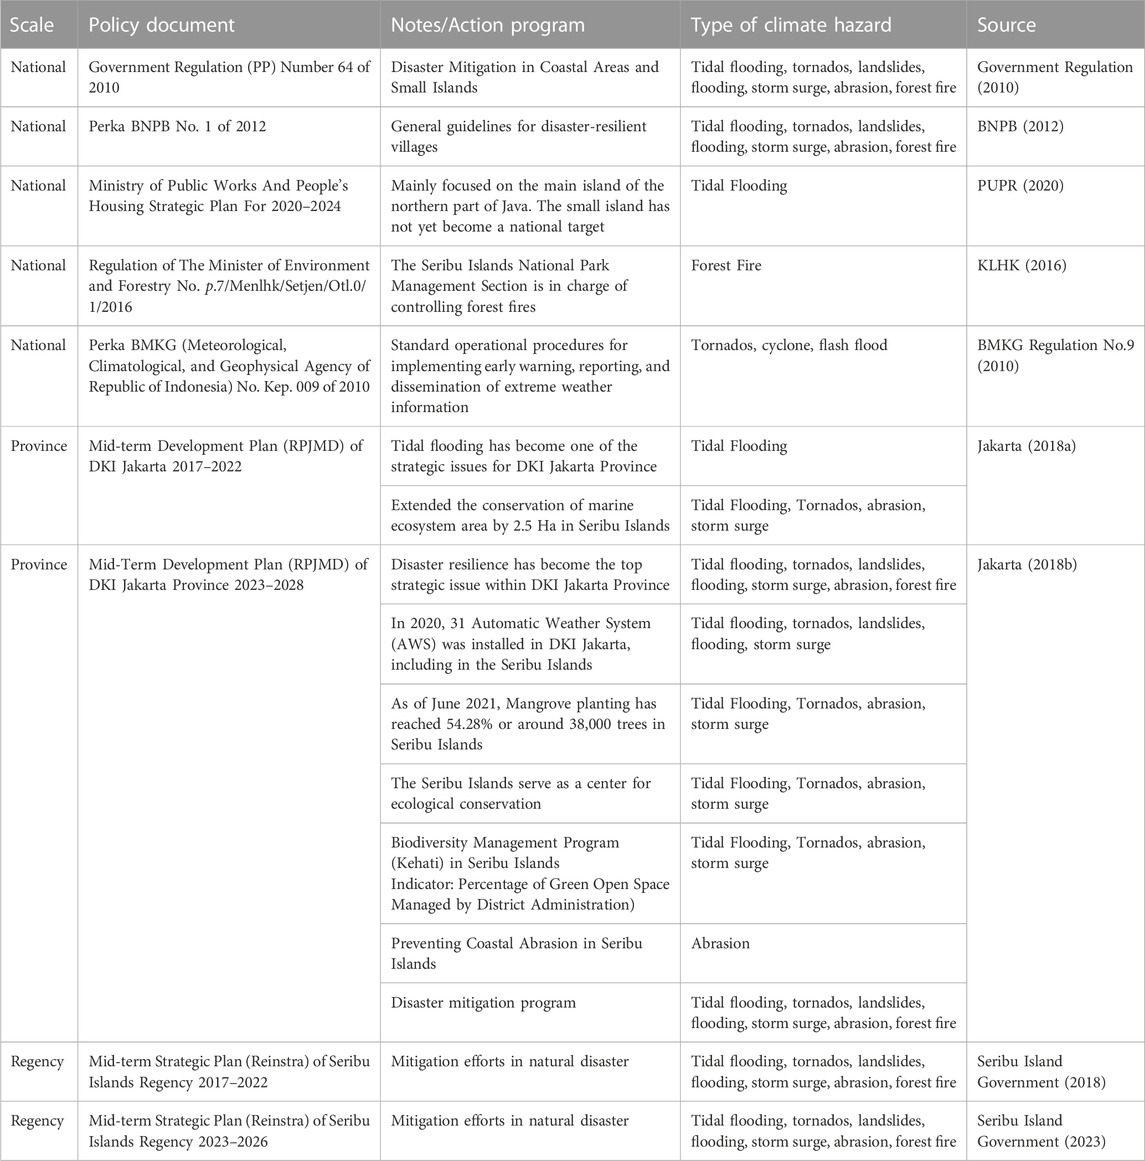
TABLE 3. Summary of the national and local policy of each hazard type in the Seribu Islands.
The primary objective of this study was to reveal the local evidence of climate change and its potential impact on the Seribu Islands. The study shows that these islands were exposed to a significant increase in air temperatures and the frequency of extreme temperatures during the study period (Figures 3, 4). The IPCC, 2022 suggests limiting the warming temperature to below 2°C by 2030. However, the study area experienced a warming temperature of 2.2°C by 2021 (Figure 3A) and without any significant policy change, the temperature will continue to increase. This warming temperature also exist in other small islands region in the tropical region, such as Bintan Island (Setiawati et al., 2023b); Mauritius Island (Doorga, 2022); Carribian SIDS (Taylor et al., 2018) and other small Island states (Nurse et al., 2001). The study also revealed that the frequency of extreme temperatures of P99 since 2002 was almost 3.5-fold more often than in the year between 1980 and 2001 (Figure 4). This condition implies that the pilot study will face more frequent and severe climate-related hazards.
We also interviewed local communities in four islands within the region, and 60% of the respondents said that it is tough to live within the islands without air conditioner (AC) (Figure 8). Also, the weather is getting hotter, even at night. Moreover, 80% of Panggang and Kelapa Islands respondents confirmed that the weather is getting hotter and uncomfortable both day and night, which caused increasing electricity bills. The increase in the minimum and the extreme temperatures significantly contribute to heat stress. Obradovich et al. (2017) stated that the increasing minimum temperature causes insufficient sleep to the 765 thousand respondents of US citizens. This sleep deprivation has an implication for lower productivity at work (McKibben et al., 2010), increasing Posttraumatic Stress Disorder (PTSD) severity (Brown et al., 2011), and the mortality rate (Cappuccio, 2010). Moreover, a recent study by Samaniego-Rascón et al. (2019) revealed that compared to typical days, the extreme heat stress level could accelerate the risk of death by 43%, where the elderly population, people without education, and outdoor workers are among the most vulnerable inhabitants. Considering the socio-economic condition of the islands where 82.7% of inappropriate roof types that were worsening the indoor temperature environment (BPS Seribu Islands 2022), 94.7% of outdoor workers (BPS Seribu Islands 2022), and 17% of the vulnerable age group (BPS Seribu Islands., 2022), the region has big exposure and sensitive demographic condition toward thermal stress (Setiawati et al., 2023a).
Despite the extreme heat stress, the study area is also vulnerable to frequent coastal flooding, drought and tornados, as shown in Supplementary Tables A2, A5. According to the SPI index of 60-month scales, the study area experience long-term moderate to extreme wetness from 2007 until 2021 and moderate to extreme dryness from 1997 to 2004 (Figure 5). Previous study also revealed that extreme precipitation significantly influences island countries and is frequently linked to flooding and tropical storms (Khouaki et al., 2017; IPCC 2018). This condition is also supported by the Supplementary Table A1, which states that extreme precipitation is more frequent from 2013 until 2021. Moreover, the study area also faced a slow onset phenomenon called an increasing trend sea level anomaly (Figure 6).
These conditions imply that the study area also faced frequent climate-related hazards during recent years, particularly coastal flooding and tornados (Supplementary Table A2). Moreover, all respondents in the Pari Islands stated that they experienced frequent coastal flooding (5–8 times a year) recently, with the worst flooding in 2022, where the inundation depth ranged from 10 cm to 130 cm (Supplementary Table A2). Also, nearly 80% respondents in Pari Islands confirmed that there is massive abrasion of terrestrial land in Pari Island due to the sea level rise (Supplementary Table A5). The local respondent also stated that the sea level rise, abrasion and coastal flooding in this island decreased the water quality for freshwater supply, increased the cost for having the water (i.e., purchasing reverse osmosis water and bottle water), and killed the terrestrial plant. This condition also reported by previous studies which states that the ratio of fresh water availability and water demand decreased by 67%, while water quality decreased significantly (Wulan et al., 2023).
On the other hand, in Kelapa Island, all the respondents experienced tornados in recent years, whereas last year, they experienced three times a year. Most of the respondents said that in the past, there was no such frequent coastal flooding and tornados on Pari Island and Kelapa Island, and they could predict the west and east monsoon seasons. However, after 2000, they could not expect the season anymore (Figure 8), so it is hard for them to plan proper fishing activities, do home business for women, have more risk to go to the sea for the fisherman, and increase fishing capital costs. Increasing extreme condition, unpredictable season and slow onset phenomenon (i.e., abrasion and sea level rise) also faced others small island region such as Bintan Islands (Setiawati et al., 2023b), Solomon Islands (Albert et al., 2016), Micronesia (Nunn et al., 2017), Carribian Islands (Oberle et al., 2017).
Seribu Islands consist of 116 islands, but in this paper, we only analyze 114 islands (Figure 2) due to data limitations of DEM dataset. The land area ranged from 0.05 ha to 59.9 ha, and among 114 islands, only two islands have a land area larger than 50 ha, and only 10 islands have inhabitants. The small island states are the most vulnerable to climate change considering their size, elevation, and climate variability. As the SLR scenario of 2 m (Table 2), the islands with inhabitants will mostly be inundated since the average elevation of those islands is 2.4 m above the sea level, and under the 3 m SLR scenario, all inhabitant’s islands will be fully inundated (Figure 7). Since those islands have low-land areas with mostly dense built-up areas (Table 4), the area will face an economic loss due to frequent coastal flooding or other related climate hazards. Particularly, Panggang Island, Harapan Island, Kelapa Island, Pramuka Island, Pabelokan Island, Tidung Besar, Lancang Besar and Kelapa Dua face a serious impact of climate change because the built-up area occupancy was over 45%, respectively (Table 4). Those local communities not only have an economic loss due to the direct impact but will also face cascading effects such as waterborne diseases, respiratory diseases, etc. (Setiawati et al., 2023a).
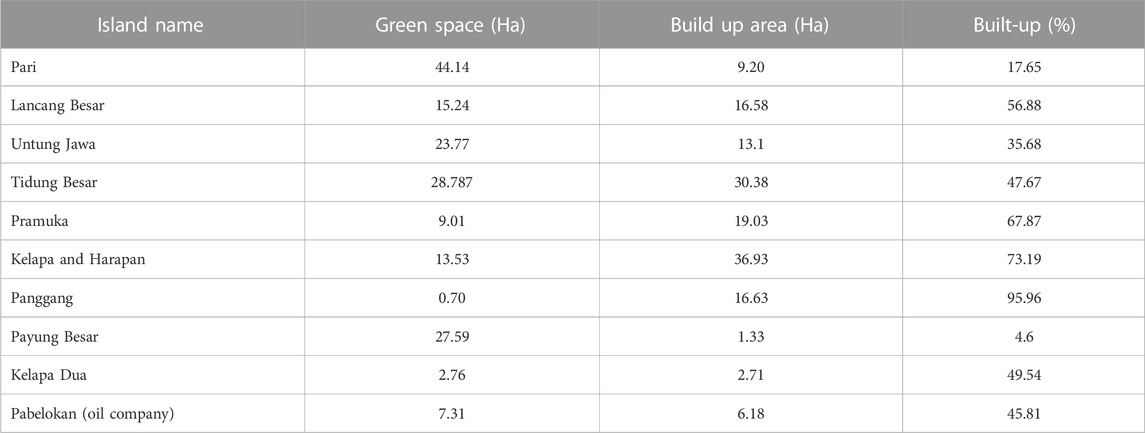
TABLE 4. The built-up area coverage in the inhabitants (local communities and oil company) islands.
As stated above, the Seribu Islands face a severe risk of climate change (Figures 3–8; Tables 2, 4). Moreover, the mid-term strategic plan document (Reinstra) for 2017–2022 and Reinstra for 2023–2026 stated that climate-related hazards are the primary challenge of the mid-term development plan within the region (Seribu Island Government, 2018; Seribu Island Government, 2023). Therefore, tackling climate-related hazards was one of the main strategic issues in this area. However, the association between the issue, policy direction, and action to reduce natural disaster risk was not coherent. That incoherency was clearly stated in the performance indicators for each stated program/action (Seribu Island Government, 2018; Seribu Island Government, 2023). For instance, the index of public satisfaction with public services and the number of disaster victims who received fast food are the main indicators for the disaster mitigation program (Seribu Islands Government 2020), which is only short-term problem-solving. Mainstreaming the issue of natural disaster mitigation in the Reinstra is a good start, but achieving resilient communities toward climate change through those actions was not enough.
As a small island district with high exposure to climate change hazards, this region should have its own Regional Disaster Management Agency (BPBD) and not only rely on BPBD Jakarta main island since Seribu Islands has different geographic features and challenges. So, having its own BPBD is necessary so that the region has its own local assessment of potential risk due to the disaster and has good planning both for prevention and mitigation of climate hazards as other small island districts did in Indonesia (e.g., Bintan, Natuna, East Flores, etc.). Moreover, in the Jakarta Midterm Development Planning Agenda of 2017–2022 (RPJMD), the issue of climate-related hazards only focused on the main island of Jakarta Province, and the issue of climate change only focused on mitigation (reducing greenhouse gasses emissions) without considering the adaptation action (Jakarta., 2018a; Jakarta, 2018b). The neglect of adaptation issues can be seen from the unavailability the long-term of in situ climate data measurement stations within the island complex which can record daily temperature, precipitation, wind speed, tide, and humidity. This in-situ climate data is crucial since the area is an archipelagic district that the communities have to commute on a daily basis by vessel where accurate weather prediction is necessary for safety reasons. Moreover, having local climate data is also essential for developing an early warning system for climatic hazards, which benefits local communities, commercial entities, and tourists. Developing a proper early warning system is highly suggested by the IPCC Working Group 1 and II (Lal et al., 2012).
Despite the unavailability of the District level of BPBD, the provincial government put a lot of effort into tackling the climate change impact on the Seribu Islands in the current RPJMD (Table 3), which includes hard infrastructure (i.e., installed Automatic Weather System, coastal abrasion program, tidal flood mitigation program), ecosystem-based approach (i.e., mangrove planting, deciding the region as center for ecological conservation) and soft technique (i.e., rising awareness, strengthening the adaptive capacity for local authorities). Seribu Islands have two main climate hazards: tidal flooding and tornados (Seribu Island Government. 2023). However, most of the effort from the local authorities was to tackle tidal flooding and abrasion; this commitment was reflected by the construction of concrete sea walls along the inhabitant islands (Table 3), building a breakwater, constructing infiltration wells, constructing water canals, constructing rainwater tanks, creating portable pumps for tidal flood defences, creating vertical drainage to handle local rainfall, and creating floodgates to regulate tides (Supplementary Table A5). However, national and local governments did not pay serious attention to tornados that frequently hit the Seribu Utara sub-district, even though this disaster caused severe damage in 2008, 2012, 2014, 2016, 2017, and 2018 (Supplementary Table A2).
As mentioned above, the study area also experienced the abrasion which indicated by the shoreline changes. For example, in Tidung Island, the abrasion caused a 6.4 ha land mass loss from 1913 to 2007 (Farhan and Lim, 2011). Moreover, in the Western and Eastern land area of Pari Island was lost about 4.1 ha from 1999 to 2017 (Farhan and Lim, 2011). Therefore, to overcome the problem the local authorities built the concrete seawall and breakwater and national and local authorities as well as local communities did massive mangrove planting in Pramuka island, Rambut Island and Pari Island. Even the mangrove planting was targeted by the local government in the RPJMD 2023–2026 and this is part of ecosystem-based approach (EBA) to climate change adaptation. This EBA is a sustainable way to minimize the risk of climate change and increase the resilience of the local communities (Colls et al., 2009). A proper mangrove planting is one of the ideal adaptation strategies since it does not have no-regret strategies, a flexible approach (one program can achieve multiple targets), involve local communities, multi-partner strategy development, and apply an adaptive management approach (Colls et al., 2009).
The Seribu Islands experienced abrasion and did land expansion, particularly in the densely populated island (i.e., Panggang Island). No residents want to migrate outside the island, while population growth in these locations is high with very dense area (Table 4). So, the local communities did self-reclamation using organic rubbish and reef stone, which has been taking place for over 30 years (Figure 9, Supplementary Tables A4, A5). Therefore, the land area was expanded nearly 165% from 1992 to 2022, as shown in Figure 9. Before 2009, land reclamation was conducted on both sides (West and East). Still, since 2009, they reclaimed the land toward the east since the eastern side has yet to be built by the seawall, and the depth of the beach is relatively shallow. When the local government does not act decisively to stop the reclamation, most of the benthic habitat around the area (i.e., seagrass and coral reef) will disappear in the future and be replaced by the built-up areas.
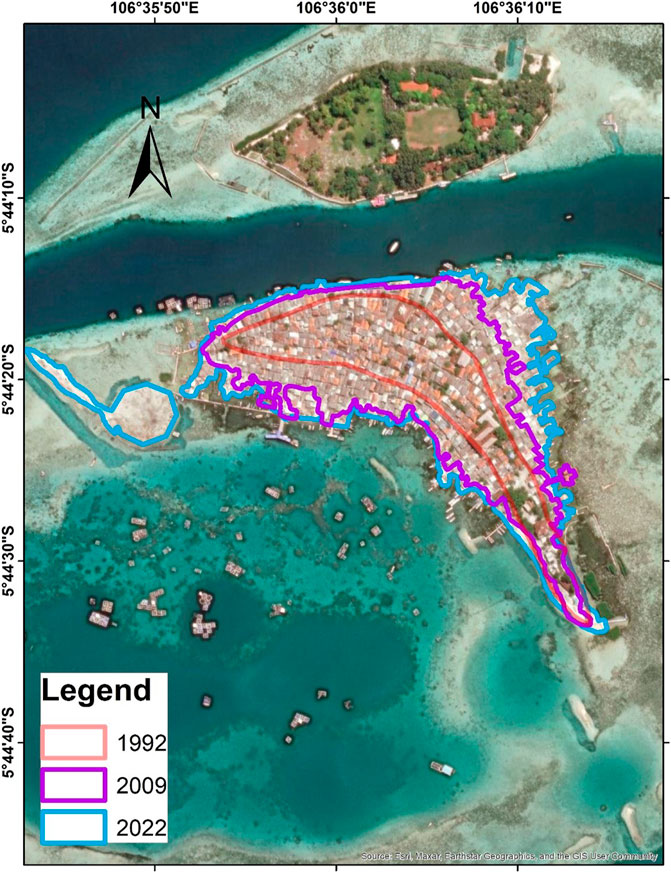
FIGURE 9. The Land expansion of Panggang Island from 1992 to 2022. Basemap: ESRI and Maxar, Earthstar Geographics and GIS User Community.
Moreover, the under-control self-reclamation sacrifices the ideal marine ecosystem health in the region, which also influences the surrounding island communities for their economic income. For instance, the sand area (underwater) on Panggang Island was reduced significantly and transformed into seagrass, followed by deep sea water, and disappeared (Ningsih et al., 2021). Moreover, since 2000, the seaweed cultivation business in Panggang and Pramuka Island has entirely stopped because the yield has decreased due to the poor quality of the environment (Bahri et al., 2017) (Supplementary Table A5).
Due to the island’s small size, the high exposure to climate hazards, and the locals’ unwillingness to leave the area, Seribu Island residents have had to adapt intensively by maintaining or expanding their islands to prevent them from being eroded by sea waves. Pramuka Island and Pari Island are two islands that decided to grow mangroves since 2004 to prevent abrasion and retain silt (Supplementary Table A5). In contrast, Panggang Island takes particularly active measures to complete its reclamation (Figure 9, Supplementary Table A4). Also, locals attempt to diversify their employment in the previously dominated fishing industry service sector (Figure 8). Without considering any consequences, the local community’s adaptation is categorized as a reaction to incidental activity (Shahid et al., 2021).
Local authorities put climate change as the severe challenge for Seribu Islands in their mid-term development planning agenda. However, there needed to be more consistency between the effort taken and the severe climate hazard the local communities faced. For instance, tornadoes in the Northern part of Seribu Island are crucial hazards that need to be addressed to reduce the risk; however, local authorities did not mention specific efforts in their development planning agenda. Moreover, massive mangrove planting that has been carried out since 2004 needs to be evaluated. Some local communities complained they could not see the sea scenery and enjoy the cool weather because dense mangrove forests blocked it. Moreover, law enforcement on illegal self-reclamation by reef stone must be realized since fringing reefs, coral reefs, and seagrass are vital to reducing the force of waves and currents around the coastal region.
This paper highlights the importance of understanding the effects of climate change on small islands and identifying appropriate local solutions. Based on the long-term climate data and spatial analysis results, Seribu Island faces a severe threat of climate change, such as accelerating air temperature, frequent extreme events, increasing SLR, massive land expansion in Panggang Island and under the worst-case scenarios one-quarter of the islands complex will be fully inundated in the future. The analysis of the significant threat of climate change within the study area helps us to 1) identify the main climate hazards faced by the local inhabitants in different islands and 2) urge the need for real-time weather station within the islands complex along with the real-time early warning system 3) urge the need of having district-level BPBD 4) align local populations’ needs for additional land with those of natural capital, protect natural ecosystems, and use their ecosystem services to face climate change. A limitation of the present study was the unavailability of a long-term climate data ground station within the islands complex; therefore, we utilized the closest station to the study area. Moreover, we only involved twenty-one local communities who were spread over four islands, one national authorities and three local authorities as our objective was to obtain a thorough understanding of their individual experiences of climate change and its capacity to cope with the problem rather than to reach statistical significance. For future research, it is necessary to have more quantitative analysis for future projections of climate data sets and combine it with the socio-economic vulnerability analysis. Then, an integrated risk assessment that considers the role of natural capital, climate change scenarios, and local communities within the study area could be built for future studies.
The original contributions presented in the study are included in the article/Supplementary Material, further inquiries can be directed to the corresponding author.
MS: Conceptualization, Data curation, Formal analysis, Funding acquisition, Investigation, Methodology, Supervision, Validation, Visualisation, Writing–original draft, Writing–review and editing. UC: Conceptualization, Methodology, Writing–review and editing. YD: Formal analysis, Investigation, Visualisation, Writing–review and editing. LA: Investigation, Formal analysis, Visualisation. MN: Investigation. HR: Investigation. IS: Investigation, Writing–review and editing. NH: Investigation, Validation, Visualisation. AM: Conceptualization, Funding acquisition, Writing–review and editing. TE: Writing–review and editing. BP: Investigation, Supervision. AO: Investigation. NA: Writing–review and editing. JR: Investigation. SS: Investigation, Project administration. SW: Investigation, Writing–review and editing. SCP: Writing–review and editing. AI: writing–review and editing. EA: writing–review and editing. MI: writing–review and editing.
The author(s) declare financial support was received for the research, authorship, and/or publication of this article. Research Funding: Asia Pacific Network for Global Change Research- CRRP2022-06MY-Muslim project. This work was financially supported by the Deanship of Scientific Research at the King Faisal University, Saudi Arabia (grant: 4,060).
We would like to thank Asia Pacific Network for Global Change Research for funding this research under the CRRP 2022-06MY-Muslim project. We also thank to Wanda Andella Putri for digitizing the land area of Panggang Island.
The authors declare that the research was conducted in the absence of any commercial or financial relationships that could be construed as a potential conflict of interest.
All claims expressed in this article are solely those of the authors and do not necessarily represent those of their affiliated organizations, or those of the publisher, the editors and the reviewers. Any product that may be evaluated in this article, or claim that may be made by its manufacturer, is not guaranteed or endorsed by the publisher.
The Supplementary Material for this article can be found online at: https://www.frontiersin.org/articles/10.3389/fenvs.2023.1280268/full#supplementary-material
Albert, S., Leon, J. X., Grinham, A. R., Church, J. A., Gibbes, B. R., and Woodroffe, C. D. (2016). Interactions between sea-level rise and wave exposure on reef island dynamics in the Solomon Islands. Environ. Res. Lett. 11 (5), 054011. doi:10.1088/1748-9326/11/5/054011
Bahri, A. D., Hamdani, A., and Wibowo, A. (2017). Di balik krisis agraria dan ekosistem kepulauan Seribu: apakah wisata bahari adalah jawabannya. https://terbitan.sajogyo-institute.org/wp-content/uploads/2017/08/Laporan-Final-Seribu_Draft-0_2017-April-28.pdf.
BMKG Regulation No.9 (2010). Peraturan kepala badan meteorologi, klimatologi, dan geofisika tentang prosedur standar operasional pelaksanaan peringatan dini, pelaporan, dan diseminasi informasi cuaca ekstrim [regulation of the head of the meteorology, climatology and geophysics agency concerning standard operational procedures for implementing early warning, reporting and dissemination of extreme weather information]. https://peraturan.bpk.go.id/Home/Details/191418/perka-bmkg-no-kep9-tahun-2010.
Bnpb, (2012). PEDOMAN UMUM DESA/KELURAHAN TANGGUH BENCANA (General guidelines for disaster-resilient villages). https://bnpb.go.id/storage/app/media/uploads/24/peraturan-kepala/2012/perka-1-tahun-2012.pdf.
BPS DKI Jakarta (2021). Tabel dinamis subjek indeks pembangunan manusia (table on human development index). https://jakarta.bps.go.id/subject/26/indeks-pembangunan-manusia.html#subjekViewTab5.
BPS DKI Jakarta (2022). Persentase penduduk miskin menurut kabupaten/kota di Provinsi DKI Jakarta (persen), 2020-2022. https://jakarta.bps.go.id/indicator/23/1125/1/persentase-penduduk-miskin-menurut-kabupaten-kota-di-provinsi-dki-jakarta.html.
BPS Seribu Islands (2022). Seribu islands regency in figures. https://kepulauanseribukab.bps.go.id/publication/2022/02/25/6565bcc5c12b74dbfcbfcf17/kabupaten-kepulauan-seribu-dalam-angka-2022.html.
Brown, T. H., Mellman, T. A., Alfano, C. A., and Weems, C. F. (2011). Sleep fears, sleep disturbance, and PTSD symptoms in minority youth exposed to Hurricane Katrina. J. Trauma. stress 24, 575–580. doi:10.1002/jts.20680
Cahyarini, S. Y., Zinke, J., Troelstra, S., Aldrian, E., and Hoeksema, B. W. (2016). Coral Sr/Ca-based sea surface temperature and air temperature variability from the inshore and offshore corals in the Seribu Islands, Indonesia. Mar. Pollut. Bull. 110, 694–700. doi:10.1016/j.marpolbul.2016.04.052
Cappuccio, F. P., and D'Elia, L. (2010). Sleep duration and all-cause mortality: a systematic review and meta-analysis of prospective studies. Sleep Durat. all-cause Mortal. a Syst. Rev. meta-analysis Prospect. Stud. 33, 585–592. doi:10.1093/sleep/33.5.585
Change, I. C. (2014). Impacts, adaptation and vulnerability. Part A: global and sectoral aspects. Contribution of working group II to the fifth assessment report of the intergovernmental Panel on Climate Change 1132. https://www.ipcc.ch/report/ar5/wg2/.
Clar, C., and Steurer, R. (2019). “Climate change adaptation at different levels of government: characteristics and conditions of policy change,” in Natural resources forum (Hoboken, New Jersey, United States: Online Library), 121–131.
Colls, A., Ash, N., and Ikkala, N. (2009). Ecosystem-based Adaptation: a natural response to climate change. Switzerland: Iucn Gland.
Dasgupta, S., Laplante, B., Meisner, C., Wheeler, D., and Yan, J. (2009). The impact of sea level rise on developing countries: a comparative analysis. Clim. Change 93, 379–388. doi:10.1007/s10584-008-9499-5
DKI Jakarta Government (2018). Mid-term development plan of DKI Jakarta 2017-2022. Access on https://bappeda.jakarta.go.id/rpjmd/September 6, 2023).
DKI Jakarta Government (2023). Mid-term development plan of DKI Jakarta province 2023-2028. Access on https://bappeda.jakarta.go.id/dokumen-rencana-pembangunan-daerah-tahun-2023-2026/September 6, 2023).
Doorga, J. R. (2022). Climate change and the fate of small islands: the case of Mauritius. Environ. Sci. Policy 136, 282–290. doi:10.1016/j.envsci.2022.06.012
Draisma, S. G., Prud’homme van Reine, W. F., Herandarudewi, S. M., and Hoeksema, B. W. (2018). Macroalgal diversity along an inshore-offshore environmental gradient in the Jakarta Bay–Thousand Islands reef complex, Indonesia. Estuar. Coast. Shelf Sci. 200, 258–269. doi:10.1016/j.ecss.2017.11.010
Enssle, F., and Kabisch, N. (2020). Urban green spaces for the social interaction, health and well-being of older people—an integrated view of urban ecosystem services and socio-environmental justice. Environ. Sci. policy 109, 36–44. doi:10.1016/j.envsci.2020.04.008
Farhan, A. R., and Lim, S. (2011). Resilience assessment on coastline changes and urban settlements: a case study in Seribu Islands, Indonesia. Ocean Coast. Manag. 54, 391–400. doi:10.1016/j.ocecoaman.2010.12.003
Fenoglio-Marc, L., Schöne, T., Illigner, J., Becker, M., Manurung, P., and Khafid, (2012). Sea level change and vertical motion from satellite altimetry, tide gauges and GPS in the Indonesian region. Mar. Geod. 35 (Suppl. 1), 137–150. doi:10.1080/01490419.2012.718682
Fujimori, S., Hasegawa, T., Krey, V., Riahi, K., Bertram, C., Bodirsky, B. L., et al. (2019). A multi-model assessment of food security implications of climate change mitigation. Nat. Sustain. 2, 386–396. doi:10.1038/s41893-019-0286-2
Gaborit, P. (2022). Climate adaptation to multi-hazard climate related risks in ten Indonesian cities: ambitions and challenges. Clim. Risk Manag. 37, 100453. doi:10.1016/j.crm.2022.100453
Gan, C. C., Oktari, R. S., Nguyen, H. X., Yuan, L., Yu, X., Kc, A., et al. (2021). A scoping review of climate-related disasters in China, Indonesia and Vietnam: disasters, health impacts, vulnerable populations and adaptation measures. Int. J. Disaster Risk Reduct. 66, 102608. doi:10.1016/j.ijdrr.2021.102608
Government Regulation, (2010). Mitigasi bencana di wilayah pesisir dan pulau pulau Kecil (disaster mitigation in coastal areas and small islands). Access on https://peraturan.bpk.go.id/Details/5088 September 6, 2023).
Intergovernmental Panel on Climate Change (2018). “Global warming of 1.5°C. An IPCC special report on the impacts of global warming of 1.5°C above pre-industrial levels and related global greenhouse gas emission pathways,” in The context of strengthening the global response to the threat of climate change, sustainable development, and efforts to eradicate poverty. Editors V. Masson-Delmotte, P. Zhai, H.-O. Pörtner, D. Roberts, J. Skeaet al. (Geneva, Switzerland: Intergovernmental Panel on Climate Change).
Jakarta, D. L. H. (2018a). Rencana strategis 2017-2022 dinas lingkungan hidup Jakarta. https://lingkunganhidup.jakarta.go.id/program/rencanastrategis.
Jakarta, DSDA (2018b). Rencana strategis dinas sumberdaya air provinsi jakara. https://dsda.jakarta.go.id/dokumen/Renstra-DSDA-20172022_1668138187.pdf.
Johan, O., Bengen, D. G., Zamani, N. P., and Sweet, M. J. (2015). The distribution and abundance of black band disease and white syndrome in Kepulauan Seribu, Indonesia. HAYATI J. Biosci. 22, 105–112. doi:10.1016/j.hjb.2015.09.001
Khouakhi, A., Villarini, G., and Vecchi, G. A. (2017). Contribution of tropical cyclones to rainfall at the global scale. J. Clim. 30 (1), 359–372. doi:10.1175/jcli-d-16-0298.1
KLHK (2016). Regulation of the minister of environment and forestry No. P.7/Menlhk/Setjen/Otl.0/1/2016. Access on https://ksdae.menlhk.go.id/assets/news/peraturan/P.7_ORGANISASI_DAN_TATA_KERJA_UPT_TN_.pdf September 6, 2023).
Kompas, (2015). DKI terancam kehilangan 23 pulau di Seribu islands. https://megapolitan.kompas.com/read/2015/09/14/15311201/DKI.Terancam.Kehilangan.23.Pulau.di.Kepulauan.Seribu#:∼:text=Adapun%20enam%20pulau%20yang%20telah,Kecil%20seluas%200%2C55%20hektar.AksesFebruary 9, 2023).
Lal, P. N., Mitchell, T., Aldunce, P., Auld, H., Mechler, R., Miyan, A., et al. (2012). “National systems for managing the risks from climate extremes and disasters,” in Managing the risks of extreme events and disasters to advance climate change adaptation field. Editors V. Barros, T. F. Stocker, D. Qin, D. J. Dokken, K. L. Ebi, M. D. Mastrandreaet al. (Cambridge, UK: Cambridge University Press), 339–392.
Lestari, F., Adiwibowo, A., Kadir, A., and Ramadhan, N. A. (2022). Validating the 6 year (2016–2021) anthropogenic induced small island wildfire hazards in Pulau Seribu archipelago, Indonesia. Prog. Disaster Sci. 14, 100236. doi:10.1016/j.pdisas.2022.100236
Liu, W., Zhang, X., and Feng, S. (2019). Does renewable energy policy work? Evidence from a panel data analysis. Renew. energy 135, 635–642. doi:10.1016/j.renene.2018.12.037
McKibben, J. B., Fullerton, C. S., Ursano, R. J., Reissman, D. B., Kowalski-Trakofler, K., Shultz, J. M., et al. (2010). Sleep and arousal as risk factors for adverse health and work performance in public health workers involved in the 2004 Florida hurricane season. Disaster Med. public health Prep. 4, S55–S62. doi:10.1001/dmp.2010.9
Meckling, J., and Allan, B. B. (2020). The evolution of ideas in global climate policy. Nat. Clim. Change 10, 434–438. doi:10.1038/s41558-020-0739-7
Milhorance, C., Sabourin, E., Le Coq, J.-F., and Mendes, P. (2020). Unpacking the policy mix of adaptation to climate change in Brazil’s semiarid region: enabling instruments and coordination mechanisms. Clim. Policy 20, 593–608. doi:10.1080/14693062.2020.1753640
Nagu, N., Lessy, M. R., and Achmad, R. T. (2018). Adaptation strategy of climate change impact on water resources in small island coastal areas: case study on ternate island-north maluku. KnE Soc. Sci. 3, 424–441. doi:10.18502/kss.v3i5.2347
Nashwan, M. S., and Shahid, S. (2018). Spatial distribution of unidirectional trends in climate and weather extremes in Nile river basin. Theor. Appl. Climatol. 137, 1181–1199. doi:10.1007/s00704-018-2664-5
Neumann, B., Vafeidis, A. T., Zimmermann, J., and Nicholls, R. J. (2015). Future coastal population growth and exposure to sea-level rise and coastal flooding-a global assessment. PloS one 10, e0118571. doi:10.1371/journal.pone.0118571
Ningsih, E. N., Setiawan, A., Hartoni, H., and Fauziyah, F. (2021). Perubahan luasan pulau Pramuka, pulau Panggang dan pulau karya kepulauan Seribu DKI Jakarta menggunakan data citra satelit penginderaan jauh. J. Penelit. Sains 23, 84–90. doi:10.56064/jps.v23i2.628
Nunn, P. D., Kohler, A., and Kumar, R. (2017). Identifying and assessing evidence for recent shoreline change attributable to uncommonly rapid sea-level rise in Pohnpei, Federated States OF Micronesia, Northwest Pacific Ocean. J. Coast. Conserv. 21 (6), 719–730. doi:10.1007/s11852-017-0531-7
Nurmaulia, S., Fenoglio-Marc, L., and Becker, M. (2010). Long-term sea level change from satellite altimetry and tide gauges in the Indonesian region. Proc. ESA Living Planet Symp.
Nurse, L. A., Sem, G., Hay, J. E., Suarez, A. G., Wong, P. P., Briguglio, L., et al. (2001). “Small island states,” in Climate change 2001. Impacts, adaptation and vulnerability. Contribution of working group II to the third assessment report of the intergovernmental panel on climate change. Editors J. J. McCarthy, O. F. Canziani, N. A. Leary, D. J. Dokken, and K. S. White (Cambridge, UK: Cambridge University Press), 844–875.
Obradovich, N., Migliorini, R., Mednick, S. C., and Fowler, J. H. (2017). Nighttime temperature and human sleep loss in a changing climate. Sci. Adv. 3, e1601555. doi:10.1126/sciadv.1601555
Pickering, M. D., Horsburgh, K. J., Blundell, J. R., Hirschi, J.-M., Nicholls, R. J., Verlaan, M., et al. (2017). The impact of future sea-level rise on the global tides. Cont. Shelf Res. 142, 50–68. doi:10.1016/j.csr.2017.02.004
Presidential Regulation 73 (2012). STRATEGI NASIONAL PENGELOLAAN EKOSISTEM MANGROVE (National strategy for managing mangrove ecosystems). Access on https://peraturan.go.id/id/perpres-no-73-tahun-2012 September 6, 2023).
PUPR (2020). Peraturan menteri pekerjaan umum dan perumahan rakyat tentang peraturan menteri pekerjaan umum dan perumahan rakyat tentang perubahan atas peraturan menteri pekerjaan umum dan pekerjaan rakyat nomor 27/PRT/M/2015 tentang bendungan [regulation of the minister of public works and public housing concerning regulation of the minister of public works and public housing concerning amendments to the PUPR regulation (27) year 2015 concerning dams]. Access on https://peraturan.bpk.go.id/Home/Details/144523/permen-pupr-no-6-tahun-2020 September 6, 2023).
Samaniego-Rascón, D., Gameiro da Silva, M. C., Ferreira, A. D., and Cabanillas-Lopez, R. E. (2019). Solar energy industry workers under climate change: a risk assessment of the level of heat stress experienced by a worker based on measured data. Saf. Sci. 118, 33–47. doi:10.1016/j.ssci.2019.04.042
Seribu Island Government, (2017). Rencana strategis kabupaten administrative kepulauan Seribu 2017-2022 (mid term strategic plan of Seribu islands regency 2017-2022). Access on https://pulauseribu.jakarta.go.id/file/1.%20RENSTRA%20Kabupaten%20Tahun%202017-2022.pdf September 6, 2023).
Seribu Island Government, (2023). Mid-term strategic plan (Reinstra) of Seribu islands regency 2023-2026. Access on https://pulauseribu.jakarta.go.id/file/20230619141944.pdf September 6, 2023).
Setiawati, M. D., Jarzebski, M. P., Miura, F., Mishra, B. K., and Fukushi, K. (2023a). “The public health risks of waterborne pathogen exposure under a climate change scenario in Indonesia,” in Ecological footprints of climate change: adaptive approaches and sustainability (Berlin, Germany: Springer), 607–624.
Setiawati, M. D., Nandika, M. R., Supriyadi, I. H., Iswari, M. Y., Prayudha, B., Wouthuyzen, S., et al. (2023b). Climate change and anthropogenic pressure on Bintan Islands, Indonesia: an assessment of the policies proposed by local authorities. Regional Stud. Mar. Sci. 66, 103123. doi:10.1016/j.rsma.2023.103123
Shahid, R., Shijie, L., Shahid, S., Altaf, M. A., and Shahid, H. (2021). Determinants of reactive adaptations to climate change in semi-arid region of Pakistan. J. Arid Environ. 193, 104580. doi:10.1016/j.jaridenv.2021.104580
Sokolowski, M. M., and Heffron, R. J. (2022). Defining and conceptualising energy policy failure: the when, where, why, and how. Energy Policy 161, 112745. doi:10.1016/j.enpol.2021.112745
Susanto, J., Zheng, X., Liu, Y., and Wang, C. (2020). The impacts of climate variables and climate-related extreme events on island country’s tourism: evidence from Indonesia. J. Clean. Prod. 276, 124204. doi:10.1016/j.jclepro.2020.124204
Taylor, M. A., Clarke, L. A., Centella, A., Bezanilla, A., Stephenson, T. S., Jones, J. J., et al. (2018). Future caribbean climates in a world of rising temperatures: the 1.5 vs 2.0 dilemma. Am. Meteorol. Soc. 31 (7), 2907–2926. doi:10.1175/JCLI-D-17-0074.1
USAID (2016). Indonesia: costs of climate change 2050 policy brief. access on https://www.climatelinks.org/sites/default/files/asset/document/Indonesia%20Costs%20of%20CC%202050%20Policy%20Brief.pdf September 11, 2023).
WMO (World Meteorological Organization) (2012a). Standardized precipitation index user guide. https://library.wmo.int/doc_num.php?explnum_id=7768.
World Travel, , and Tourism Council, (2019). Travel and tourism: world economic impact 2019. Curr. Issues Tour., doi:10.2167/cit/mp004.0
World Meteorological Organization (WMO), 2012b: Standardized precipitation index user. Guide. Access on September 6, 2023 at https://www.droughtmanagement.info/literature/WMO_standardized_precipitation_index_user_guide_en_2012.pdf
Wulan, D. R., Sintawardani, N., Marganingrum, D., Triyono, T., Bararah, V., Santoso, H. B., et al. (2023). Water sources, consumption, and water-related sanitation on Pari Island, Indonesia: a mixed-focus group discussion and survey study. AQUA — Water Infrastructure, Ecosyst. Soc. 72 (8), 1359–1372. doi:10.2166/aqua.2023.137
Keywords: Seribu islands, climate change, longterm climate data, anthropogenic pressure, climate change adaptation, land expansion
Citation: Setiawati MD, Chatterjee U, Djamil YS, Alifatri LO, Nandika MR, Rachman HA, Supriyadi IH, Hanifa NR, Muslim AM, Eguchi T, Prayudha B, Oktaviani A, Adi NS, Renyaan J, Sulha S, Wouthuyzen S, Pal SC, Islam ARMT, Alam E and Islam MK (2023) Seribu islands in the megacities of Jakarta on the frontlines of the climate crisis. Front. Environ. Sci. 11:1280268. doi: 10.3389/fenvs.2023.1280268
Received: 19 August 2023; Accepted: 30 October 2023;
Published: 16 November 2023.
Edited by:
Sandipan Das, Symbiosis International University, IndiaReviewed by:
Rebeka Sultana, University of Rajshahi, BangladeshCopyright © 2023 Setiawati, Chatterjee, Djamil, Alifatri, Nandika, Rachman, Supriyadi, Hanifa, Muslim, Eguchi, Prayudha, Oktaviani, Adi, Renyaan, Sulha, Wouthuyzen, Pal, Islam, Alam and Islam. This is an open-access article distributed under the terms of the Creative Commons Attribution License (CC BY). The use, distribution or reproduction in other forums is permitted, provided the original author(s) and the copyright owner(s) are credited and that the original publication in this journal is cited, in accordance with accepted academic practice. No use, distribution or reproduction is permitted which does not comply with these terms.
*Correspondence: Uday Chatterjee, cmFqLmNoYXR0ZXJqZWU0NTlAZ21haWwuY29t; Subodh Chandra Pal, Z2VvLnN1Ym9kaEBnbWFpbC5jb20=; Abu Reza Md. Towfiqul Islam, dG93ZmlxX2RtQGJydXIuYWMuYmQ=
Disclaimer: All claims expressed in this article are solely those of the authors and do not necessarily represent those of their affiliated organizations, or those of the publisher, the editors and the reviewers. Any product that may be evaluated in this article or claim that may be made by its manufacturer is not guaranteed or endorsed by the publisher.
Research integrity at Frontiers
Learn more about the work of our research integrity team to safeguard the quality of each article we publish.