 Zijing Ding1
 Chen Li2*
- 1School of Economics and Management, Wuhan University, Wuhan, China
- 2School of Management, Shanghai University of Engineering Science, Shanghai, China
Introduction: Green innovation is an important driving force for reducing pollution and achieving high-quality development. Environmental factors are important external variables that affect innovation and are crucial to innovation development. There is a close relationship between environmental quality and green innovation performance. This paper takes the single environmental factor and combination of environmental factors of environmental quality heterogeneity as the explanatory variables, the traffic scale, economic scale, industrial scale and consumption scale as the control variables, and the per capita GDP of each city as the threshold variable, and calculates the impact of the single environmental factor and combination of environmental quality factors on the green innovation performance of 286 cities in China under different per capita GDP thresholds.
Methods: We used Data Envelopment Analysis (DEA) and Threshold Regression model to measure the relationship between environmental quality and green innovation.
Results: 1) under different thresholds, a single environmental factor has different impacts on the comprehensive level of innovation drive in Chinese cities. Comparing the single environmental factor under different threshold values of per capita GDP, when the per capita GDP is low, attention should be paid to improving the centralized treatment rate of urban sewage treatment plants and the comprehensive utilization rate of general industrial solid waste; When the per capita GDP is high, the harmless treatment rate of domestic waste, the centralized treatment rate of sewage treatment plants, the green coverage rate of the built-up area, and the green area can all have different promotion effects on the driving capacity of cities along the line. 2) Under different thresholds, the elasticity coefficient of the total ecological environment, the total ecological environment has a relatively obvious promoting effect on the innovation-driven development of cities along the line, but this promoting effect shows a further weakening trend with the increase of per capita GDP.
Conclusion: This study helps to explain environmental quality and green innovation, which is important for promoting sustainable economic development. The government should control environmental pollution and introduce laws and policies to ensure innovation.

1 Introduction
The greater the degree of human’s conquest of nature, the greater the risks they face. Innovation that enhances conquest is not sustainable. The growth of material wealth is limited, so the development marked by the growth of material wealth is unsustainable (Zhao et al., 2021). Green innovation is an innovation to protect the natural environment and maintain ecological health, and an innovation to seek the harmonious coexistence of human and nature. Green development supported by green innovation is truly sustainable development, and civilization that can ensure green development is truly sustainable civilization (Chen and Kim, 2023). From the development history of industrial civilization, the war of conquering nature and the war between people are intertwined and intrinsically related. Only by stopping the two wars and realizing what Marx called “two reconciliation” can we move towards ecological civilization. Materialism culture is the soil that breeds two kinds of wars. Deconstructing materialism culture and cultivating non-materialism culture are things that everyone can start from self-choice. So, how to seek the sustainable development of human civilization? Some western scholars believe that today, there are three conditions closely related to development: environmental protection, economic wealth and social equity, which are considered as the three pillars of sustainable development (Chen, 2023).
The Chinese government is steadfast in fulfilling its carbon emission reduction commitments, ensuring strict environmental policies to achieve carbon peak by 2030 and carbon neutrality by 2060. Emission reduction is not to reduce productivity or eliminate emissions, but to promote green transformation of economic development (Miradna and Hale, 2002; Mark and Kurt, 2017). Development is the key to solving all problems. Addressing global climate change stems from development and can only be resolved through better development (Brown, 2001; Sun and Yi, 2020; Folayan et al., 2023). If we still follow the traditional extensive growth model characterized by “high investment, high pollution, high energy consumption” and continue to make rapid progress regardless of the cost, then the requirement to achieve the “dual carbon” target will undoubtedly hinder economic growth. Only by unifying economic development and environmental protection, vigorously developing green and low-carbon industries, and reducing energy consumption and pollution emissions, can we ensure the consistency between the “double carbon” goal and economic growth (David and Van de Klundert, 1965; Porterba, 1997; Cremer et al., 2004; Caselli, 2014; Chen et al., 2016; Weng, 2023). Essentially, achieving carbon peak and carbon neutrality goals is an inevitable choice in moving towards a high-quality stage of the economy, and it is also the only way to properly handle economic development and ecological environment protection. Existing research suggests that there is an inverted U-shaped relationship between environmental pollution and economic growth. When economic development is at a lower level, environmental governance is relatively high. With the improvement of economic development level, environmental quality has begun to significantly decline. But after reaching a certain turning point, the environmental quality will tend to improve (Rees, 1992; Ripatti and Vilmunen, 2001; Ramdhani et al., 2017; Hotchkiss et al., 2021).
In order to help enterprises make contributions to the creation of sustainable society while maintaining their competitiveness, the World Business Council for Sustainable Development (WBCSD) put forward the concept of environmental quality, which is one of the important contributions of industry to sustainable development put forward during the 1992 United Nations Conference on Environment and Development. WBCSD defines environmental quality in this way: on the premise of reducing the environmental impact of the whole life cycle of goods and resources and keeping the environmental impact at least within the limit of the earth’s carrying capacity, it can meet people’s needs and improve the quality of life by providing competitive prices of goods and services. The goal of improving environmental quality is to adopt production methods that are coordinated with ecological sustainable society (Gerschenkron, 1962; Fare et al., 1994; Fisher-Vanden et al., 2006; Wang et al., 2022a). This will also be beneficial for achieving green and low-carbon product production processes. Since the 21st century, the original concept of environmental quality has been widely concerned as the principle of industrial production and commercial decision-making, and has been condensed into a simple slogan: doing more with less, that is, using less resources, producing less waste and pollution, and producing more goods and services. This movement has produced many concepts and methods.
In order to improve environmental quality, enterprises and even many social organizations must reverse the direction of innovation: from innovation without considering environmental impact to green innovation. Green innovation refers to the systematic green and low-carbon development model that utilizes innovative means, covering the entire process of raw material collection, production and manufacturing, and product sales. The implementation of green innovation requires enterprises to select environmentally friendly materials in production, and select materials with low energy consumption in production process to save materials to the maximum extent; It is required to make the product easy to reuse, recycle and degrade during product development; Effectively reduce the discharge of hazardous substances and wastes in the production process; Effectively recycle waste during production; Effectively reduce water consumption and energy consumption in the production process; Effectively reduce the use of raw materials in the production process. Green innovation is also ecological innovation (Gordon, 2000; Greening et al., 2000; Chen et al., 2023; Hao and Chen, 2023). For a long time, ecological innovation has mainly focused on the development and application of environmental technology, and now there are more and more requirements beyond this. This reflects the deepening understanding of non-technical aspects of innovation. Non-technical ecological innovation (refer to the definitions of OECD and Eurostat in 2005) includes organizational innovation, marketing innovation, etc. This also shows the fact that ecological innovation focusing on sustainable development requires changes in the broad structure of the whole society.
Ecological innovation is different from conventional innovation in two important aspects. First, because it is an innovation that clearly represents the reduction of environmental impact (whether intentional or unintentional), it is not an unlimited concept. Second, ecological innovation is multi-dimensional, and the boundary of production process is increasingly blurred. It is not limited to the technical innovation within the organization, but also involves the production process reengineering, structural adjustment and system management. It is necessary to cooperate with competitors, companies and stakeholders in other sectors such as government, retailers and consumers in the supply chain (Hicks, 1932; Kalt, 1978; Hertwich and Peters, 2009; Jira and Toffel, 2013; Makkonen, 2021; Chen, 2022).
Fundamentally, the rise of green innovation or ecological innovation represents a fundamental change in the direction of human innovation: from the innovation that pursues the growth of conquest to the innovation that seeks the harmonious coexistence of human and nature. This kind of innovation is truly sustainable innovation. The development promoted by this kind of innovation is green development, and green development is truly sustainable development. The civilization that can ensure green development is ecological civilization.
On the issue of the relationship between environment and development, China has long since gotten rid of the shackles of the traditional concept of “pollution first, then governance”. Facts have proved that taking the path of ecological priority and green development has not affected economic growth, but has improved the efficiency of economic development and transformed the mode of economic development (Liu et al., 2020; Sadik-Zada and Ferrari, 2020; Sadik-Zada and Loewenstein, 2020; Fan et al., 2021a; Bastos et al., 2021; Sadik-Zada and Gatto, 2021). China is influenced by its stage of development, with a focus on economic development and a neglect of environmental protection in the early stages. Faced with increasingly serious environmental pollution and ecological damage, China needs to develop a green and low-carbon economy to promote sustainable economic development. The task of achieving carbon peak and carbon neutralization is quite arduous. Therefore, in future development, China should focus on the relationship between economic development and environmental protection, ensure ecological security, energy security, industrial security, and effectively respond to the many risks and challenges brought about by changes in international and domestic forms, and effectively deal with the economic, financial and social risks that may arise in the process of green and low-carbon transformation (Newell et al., 1999; Liu et al., 2002; Mannea and Richels, 2004; Romer, 2006; Niccolucci et al., 2009; Fan et al. 2022; Zhang et al., 2022b; Wang et al., 2022b).
In contrast to previous articles that have focused heavily on innovation, this paper focuses on a more sustainable and potentially green innovation, which is crucial in the context of achieving the Sustainable Development Goals (SDG). As green innovation is a research direction that has emerged recently, at present, the relationship between innovation and environmental quality is more focused on the impact of the overall innovation development on the environmental change, and there is less research on the dynamic relationship between green innovation Performance (GIE) and Environmental quality. It is worth noting that ignoring this dynamic relationship and focusing only on static conditions reduces the credibility of the research conclusions. Taking into account the differences in economic development, technological level and other aspects, the performance of green innovation of Chinese cities has the characteristics of temporal evolution, urban diversity and unbalanced spatial distribution. Therefore, there is a nonlinear relationship between environmental quality heterogeneity and GIE. Therefore, this paper uses the threshold panel model to study the relationship between the GIE of Chinese cities and environmental quality heterogeneity.
2 Methodology and data
2.1 Research methodology
2.1.1 SBM model
Data Envelopment Analysis (DEA) is a commonly used method for calculating efficiency levels. The traditional CCR model and BBC model do not consider the influence of slack variables, random error terms, or the external factors on efficiency. In order to compensate for the shortcomings of traditional DEA efficiency methods, a new non-angle and non-radial efficiency calculation method was proposed by Tone (2002) based on previous study (Sanstad et al., 2006; Santo and Morita, 2009; Fan et al., 2023).
The SBM model has significant advantages. It effectively overcomes the non-zero slack vector problem in the efficiency calculation process, and also incorporates the impact of unexpected outputs on efficiency into the calculation of the model. The mathematical expression is as follows: In formulae (2),
2.1.2 Threshold regression model
Hansen proposed a calculation method for the panel threshold regression model in 1999. Its basic idea is that when an explanatory variable is in different intervals, its impact on the explained variable is significantly different (Bastos et al., 2021). According to the previous discussion, the relationship between regional environmental quality and green innovation may not be a simple linear relationship, but rather a non-linear relationship. Traditional linear regression models will no longer be suitable for research on nonlinear problems, while panel threshold models have unique advantages in nonlinear regression analysis (Schumpter, 1934; Sato, 1970; Serrano and Timmer, 2002; Shima et al., 2009; Fan et al., 2021b). To this end, this paper first sets a single threshold regression model:
In formula (3), Y is the explained variable, i is time (year), t is region, X is a set of control variables, and
2.2 Data source
The data source covers 286 cities in China from 2002 to 2021. All data in the indicator system are from the Statistical Yearbook of Chinese Cities (2003–2022), the Statistical Yearbook of China (2003–2022), the Statistical Yearbook of Science and Technology (2003–2022), the statistical yearbook of the provinces where the relevant cities are located, and the website of the Ministry of Science and Technology of the People’s Republic of China and the State Intellectual Property Office. China’s urban GIE is the explained variable; China’s urban per capita GDP is the threshold variable; the single environmental factor and the combined environmental factor are the explanatory variables, representing the environmental quality. The control variables are the traffic scale, economic scale, industrial scale and consumption scale of each city.
3 Empirical analysis
3.1 Analysis of single environmental factor impact mechanism
What is the impact of regional environmental quality on GIE? This section empirically analyzes the relationship between regional environmental quality and GIE from the perspective of econometrics. This paper takes urban GIE INit as the explanatory variable, and selects five secondary indicators in the urban environmental quality indicator system as the core explanatory variables, including E1: comprehensive utilization rate of general industrial solid waste (%), E2: harmless treatment rate of domestic waste (%), E3: centralized treatment rate of sewage treatment plant (%) E4: green coverage rate of the built-up area (%), E5: green area (ha). The per capita GDP level of 286 cities from 2002 to 2021 as the threshold variable, traffic scale, industrial scale, economic scale and consumption scale will be used as control variables.
In order to study the impact of the environmental quality indicators on the GIE of each city under the theoretical framework, according to the GIE of each city and the composite data of each indicator, the empirical analysis is carried out using the urban panel data with the help of Stata17.0. Hausman test shows that the original hypothesis is rejected, so the fixed effect model is adopted. The inspection and calculation results are obtained through Stata17.0. The sampling method used in this study is the Bootstrap method, which involves randomly sampling 300 times to ensure more reliable estimation results (Shima et al., 2009). The results are shown in Table 1.
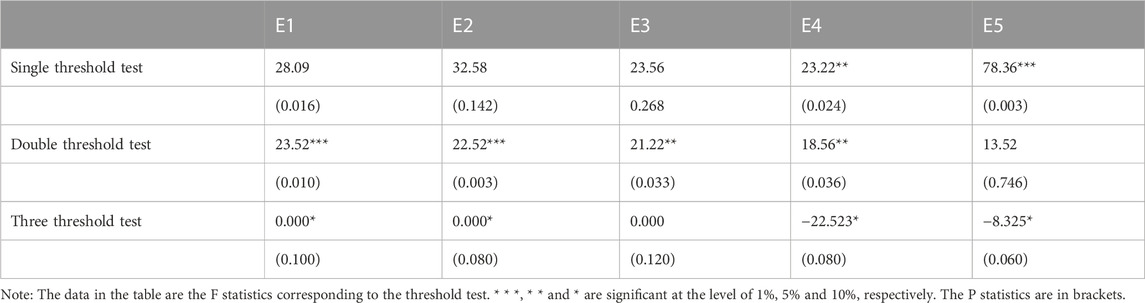
TABLE 1. Threshold effect test of single environmental factor.
This study first tests the number of thresholds to determine the form of the model. The test results are shown in Table 2. Only E4 and E5 of the five core explanatory variables passed the single threshold effect significance test at 5% and 1% levels respectively; E1, E2, E3 and E4 passed the significance test of double threshold effect at 1%, 1%, 5% and 5% levels respectively; E1, E2, E4 and E5 all passed the significance test of triple threshold effect at 10% level. Finally, according to the results of the test, the core explanatory variables E1, E2 and E3 choose the double threshold model, and E4 and E5 choose the single threshold model. Next, the threshold estimates are tested. Table 2 shows the threshold estimates.
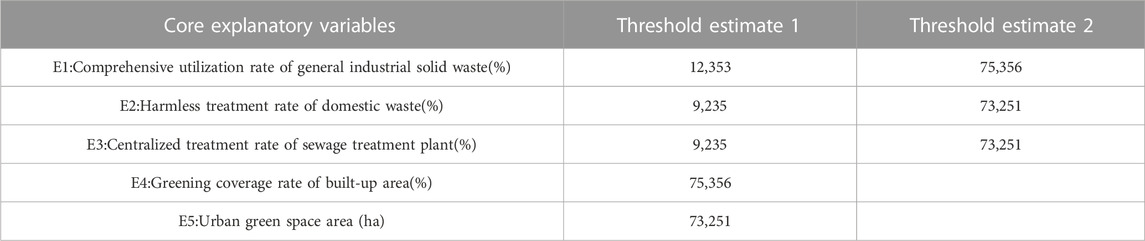
TABLE 2. Threshold estimation of single environmental factor.
Under different thresholds, comprehensive utilization rate of general industrial solid waste (E1) has different impacts on the GIE of each city. When the per capita GDP is below 12,353, the elastic coefficient of E1 to GIE is 0.0003; After crossing this threshold, its elasticity coefficient of GIE becomes 0.0015; After crossing the second threshold of 75,356, E1 has no impact on the GIE of the city. The impact mechanism between the comprehensive utilization rate of general industrial solid waste and the GIE shows that when the per capita GDP is lower than 75,356, E1 will have a certain role in promoting the GIE of cities. This is because the pillar industries that promote the rapid development of the urban economy are basically energy-intensive and high-polluting industries. The improvement of E1 can, to a certain extent, represent the transformation of business philosophy and the progress of production technology. When the per capita GDP is higher than the second threshold, E1 will promote the GIE of most cities. It is mainly reflected in that with the technological progress of industrial enterprises, the utilization rate of industrial waste has been improved, which not only saves the production costs of enterprises, but also reduces the waste of resources in the production process of enterprises. It is worth noting that the cities that have crossed the second threshold are mostly concentrated in the eastern part of China, except for the provincial capital cities in the middle reaches. These cities have a good economic development status, the living standards of residents are in the forefront, and the industrial structure is constantly optimizing and upgrading. The innovation power for the economic development of these cities is mainly in the high-end service industry and high-tech industry. Therefore, E1 has little impact on its GIE.
Under different thresholds, the harmless treatment rate of domestic waste (E2) has different impact on the performance of urban green innovation. When the per capita GDP is below 9,235, the elastic coefficient of E2 to GIE is −0.0002; After crossing this threshold, its impact on GIE is not significant; After crossing the second threshold of 73,251, the elastic coefficient of E2 on the GIE of the city is 0.0002. The impact mechanism between E2 and the GIE shows that when the per capita GDP is lower than 9,235, the improvement of E2 will not only contribute to the GIE of the city, but also lead to the decline of the GIE. This is because E2 represents the impact of urban waste and its derivatives on the environment. The living standard of urban residents within the first threshold is low, and the urban infrastructure construction is backward. No matter what the state of the urban ecological environment is, it has no attraction for high-tech talents. Most innovative talents choose regional central cities with good service facilities and rich resources. Cities within the first threshold lack talent resources for innovation, and the performance of cities will also decline to a certain extent. By observing the sample, only Zhaotong City in Yunnan Province did not cross this threshold in 2011, and all cities have crossed the first threshold since 2012. When the per capita GDP of a city is between 9,235 and 73,251, E2 has no significant impact on the performance of green innovation. This is because the income and living standard of residents in such cities meet the basic living requirements of most innovative talents, so the demand for a beautiful urban ecological environment can be reduced. The improvement of the harmless treatment rate of domestic waste has a significant role in promoting the GIE of these cities, because such cities have perfect infrastructure and can provide diversified services for innovative enterprises and innovative talents, including the demand of high-end talents for a beautiful living environment in cities.
Under different thresholds, the elastic coefficient of the centralized treatment rate of sewage treatment plants (E3) on the GIE of cities shows that with the increase of the per capita GDP of cities, its role in promoting the improvement of the GIE of cities will be more and more significant. When the per capita GDP is below 9,235, the elasticity coefficient of the centralized treatment rate of the sewage treatment plant to the GIE is 0.0003; After crossing this threshold, its impact on GIE is not significant; After crossing the second threshold of 73,251, the elasticity coefficient of E3 on the city’s GIE is 0.0018. The impact mechanism between E3 and the GIE shows that when the per capita GDP is lower than 9,235, the improvement of E3 will contribute to the GIE of cities. This is because E3 represents the proportion of urban domestic sewage and industrial wastewater in the total sewage discharge. Most of the cities within the first threshold are located in the middle and lower reaches of the region. These cities have a single industrial structure, more extensive production, and at the same time undertake the industrial transfer in the lower reaches, so the overall GIE of the region is not high. The reduction of industrial wastewater discharge of enterprises also represents a certain technological progress factor of enterprises and has a positive effect on the GIE of cities, but this positive effect is small. By observing the sample, no city is within the first threshold after 2012. When the per capita GDP of the city is between 9,235 and 73,251, E3 has no significant impact on the performance of green innovation. By observing the sample, since 2012, most cities have been located between the first threshold and the second threshold, and these cities are mainly concentrated in the eastern and central regions of China; Cities with per capita GDP higher than the second threshold are mainly concentrated in eastern China, and cities with different thresholds have obvious spatial differentiation characteristics. In contrast, cities in the eastern region are faced with factors such as industrial transformation and upgrading, industrial transfer, technological progress and other factors in the process of development. E3 has significantly improved the performance of urban green innovation.
The green coverage rate of the built-up area (E4) has different impacts on the GIE of the city under different thresholds. When the per capita GDP is below 75,356, the elasticity coefficient of E4 to the GIE is −0.0008; After crossing this threshold, its elasticity coefficient of GIE becomes 0.0004. The impact mechanism between the E4 and the GIE of the city shows that when the per capita GDP is low, E4 will not only not contribute to the GIE of the city, but will also lead to the decline of the GIE of the city. This is because for cities with lower living standards, the infrastructure services are relatively backward, and high-tech talents cannot fully play their value, At the same time, it causes the waste of ecological resources.
Green space area (E5) has a positive impact on urban GIE under different thresholds. When the per capita GDP of a city is below 73,251, the elasticity coefficient of E5 to sustainable development efficiency is 0.012; When the threshold is crossed, the elastic coefficient rises to 0.032; The elasticity coefficient of E5 to urban GIE shows that E5 has always promoted the improvement of urban GIE, and with the increase of urban per capita GDP, E5 plays an increasingly strong role in promoting urban GIE. The green area has always promoted the improvement of the GIE of the city. Whether it is scientific and technological innovation talent resources or enterprises, they are willing to choose a city with good green environment and beautiful ecological environment. However, there are few cities where the green space area plays a major role in promoting innovation-driven development, and most of them are concentrated in the lower reaches and the provincial capital cities in the middle reaches, and the effect time is relatively short Table 3.
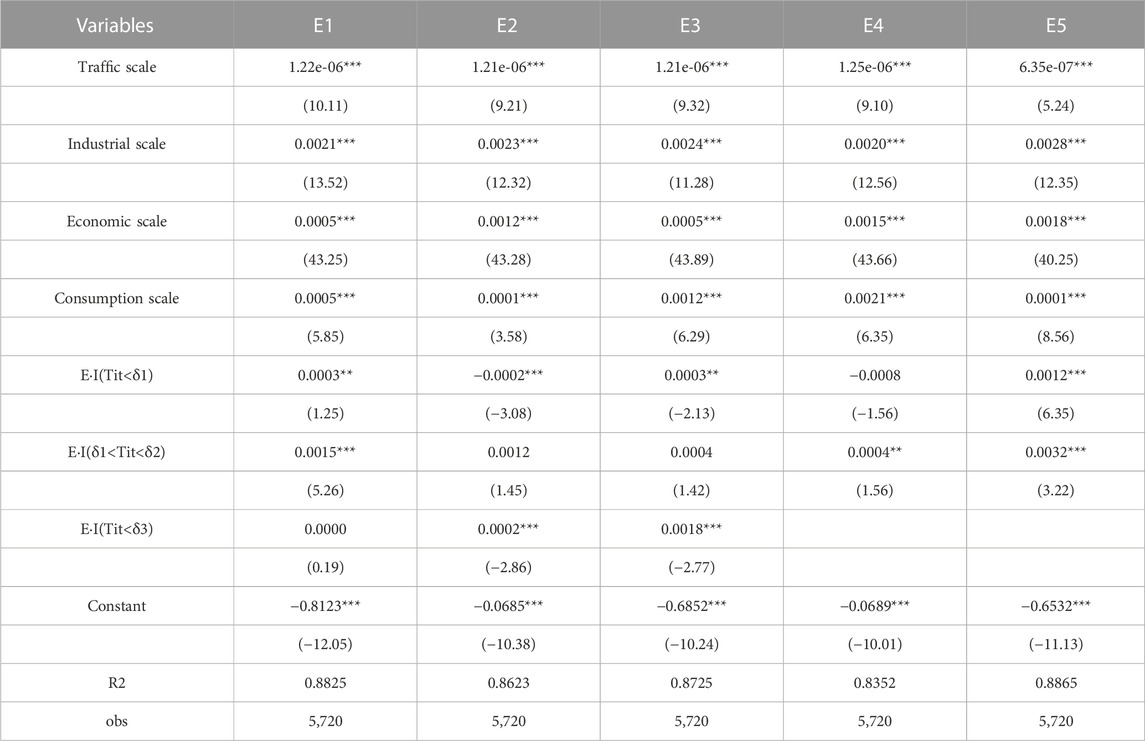
TABLE 3. Parameter estimation results of single environmental element double-threshold model.
To sum up, a single environmental factor has different impacts on the GIE of cities under different thresholds. E1 has a significant double-threshold effect on the GIE of cities. Under the threshold of different per capita GDP, the positive impact on the GIE of each city is different, but its contribution to the GIE of cities is relatively small. Under different thresholds, E2 has a significant double-threshold effect on urban GIE, and its impact on GIE is different in size and direction. Only when the per capita GDP is high can it promote GIE. E3 has a significant double-threshold effect on the urban GIE under different thresholds. It has a promoting effect on the urban GIE in different periods, and the coefficient of effect is increasing with the increase of GDP per capita. E4 has a significant single threshold effect on the GIE of the city under different thresholds, and the elastic coefficient of the green coverage rate in the built-up area on the GIE is different in size and direction. E5 has a significant single threshold effect on urban GIE under different thresholds, and its positive effect on urban GIE gradually increases with the increase of GDP per capita.
3.2 Analysis of impact mechanism of environmental factor combination
Section 3.1 focuses on the impact of sub indicators on GIE, while this article focuses on the impact of comprehensive indicators on GIE. According to the GIE of each city and the composite data of various indicators, the empirical analysis is carried out using the urban panel data with the help of Stata17.0. Hausman test shows that the original hypothesis is rejected, so the fixed effect model is adopted. The inspection and calculation results are obtained through Stata17.0. The sampling method used in this study is the Bootstrap method, which involves randomly sampling 300 times to ensure more reliable estimation results The results are shown in Table 4.

TABLE 4. Test of threshold effect of combination of environmental factors.
The threshold test is conducted for the pollution treatment, green environment and total environmental quality of the combination of environmental factors. EG and E passed the single-threshold test, and EP, EG and E passed the double-threshold test. Therefore, the single threshold test is used to analyze the green environment (EG), and the double threshold test is used to analyze the pollution treatment (EP) and the total environmental quality (E), because: 1) the single threshold of the green environment is the most significant; 2) For pollution treatment, only the double threshold is significant, and the total environmental quality double threshold is significant, which is greater than the single threshold and three threshold tests Table 5.
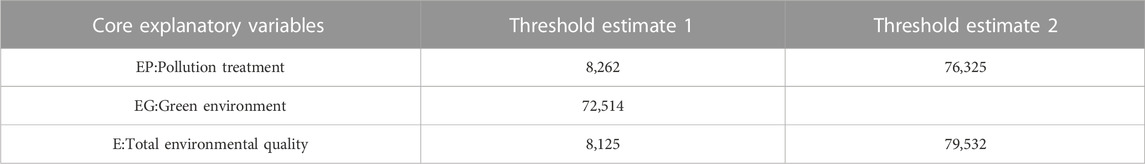
TABLE 5. Estimation of environmental factor combination threshold.
Under different thresholds, the impact of three wastes pollution treatment (EP) on the GIE of each city is different in size and direction. When the per capita GDP is below 8,262, the elasticity coefficient of urban three wastes pollution treatment on GIE is −0.0021; After crossing this threshold, its elasticity coefficient of GIE becomes 0.0282, and the three wastes pollution treatment has significant role in promoting the GIE of cities; After crossing the second threshold of 76,325, the coefficient changed to 0.026. Although it decreased slightly, the three wastes pollution treatment still contributed to the GIE of each city. The impact mechanism of “three wastes” pollution treatment and GIE shows that when the per capita GDP is lower than 8,262, “three wastes” pollution treatment has a certain inhibiting effect on the GIE of cities. This is because in the early stage of the development of urban industrial economy and capital investment is also the basis of technological innovation of enterprises. In the case of limited funds, pollution control investment often has a crowding out effect, which will hinder the innovation-driven development to a certain extent. By observing the samples, cities have all crossed the second threshold after 2012. Therefore, after 2012, the treatment of three wastes has promoted the improvement of urban GIE. When the per capita GDP is higher than 8,262 and lower than 76,325, the three wastes pollution treatment has improved the GIE of the city, which is mainly reflected in the development of industrial economy, most enterprises have already established the business foundation and capital chain. With the improvement of the investment intensity of enterprises in technological innovation is also increasing, which can not only reduce the pollution to the environment, but also increase the recycling and reuse of industrial enterprises’ waste, It avoids unnecessary waste of resources in the process of enterprise operation and reduces the production cost of the enterprise.
Under different thresholds, the elasticity coefficient of green environment (EG) on the GIE of cities shows that with the increase of GDP per capita, its role in promoting the improvement of GIE of cities will be more and more significant. When the per capita GDP is below 72,514, the coefficient of green environment to GIE is 0.0288; After crossing this threshold, its elasticity coefficient of GIE becomes 0.1125. The impact mechanism between the green coverage rate of the built-up area and the GIE of the city shows that when the per capita GDP is low, the green environment has a small contribution to the GIE of the city; With the increase of per capita GDP, after crossing the first threshold, the promotion of green environment on the GIE of cities has significantly improved. It can be found that the performance of green environment on urban green innovation has shown obvious spatial differentiation after 2010. The cities with strong green environmental impact on urban GIE are mostly concentrated in the lower reaches of the Yangtze River and the provincial capital cities in the middle and upper reaches of the Yangtze River. This is because, with the increase of per capita GDP, the infrastructure construction of the city is increasingly improved, and the living standard of residents is continuously improved. After the social and economic development level of the city reaches a certain level, more attention will be paid to the construction of urban ecological civilization and green environment. Human resources and high-tech enterprises are more inclined to choose urban agglomeration with good green environment and beautiful living environment.
Under different thresholds, the elasticity coefficient of total environmental quality (E) on GIE shows that with the increase of per capita GDP, its effect on urban GIE varies in size and direction. When the per capita GDP is below 8,125, the elasticity coefficient of total environmental quality on urban GIE is −0.0042, but the impact on it is not significant; After crossing this threshold, the coefficient of total environmental quality to urban GIE is 0.0294; After crossing the second threshold of 81,345, the coefficient of the total environmental quality to the city’s GIE is 0.012.
The impact mechanism of total environmental quality (E) and GIE shows that when the per capita GDP is lower than 9,456, the optimization of total environmental quality will not contribute to the GIE of the city, but will play a certain inhibiting role. This is mainly because environmental regulatory policies will increase the cost of corporate pollution control. It makes enterprises increase the investment in relevant technology improvement to reduce pollution, which is not conducive to the improvement of enterprise production efficiency. The impact mechanism of total environmental quality (E) and GIE shows that when the per capita GDP is higher than 9,456 and lower than 81,345, the optimization of total environmental quality will make a significant contribution to the GIE of cities. This is because although environmental regulation will increase the production cost of enterprises, it also stimulates the technological innovation of enterprises to a certain extent. The technological innovation of enterprises will bring the “compensation effect” of innovation. The benefits of this “compensation effect” of innovation are greater than the cost of environmental regulation, so it improves the production efficiency of enterprises and the ability of urban innovation to drive economic development. The impact mechanism of total environmental quality (E) and GIE shows that with the increase of per capita GDP, when per capita GDP is higher than 81,345, the optimization of total environmental quality can reduce the promotion of urban GIE. The reason is that these cities with high per capita GDP, with the continuous development of urban economy and society, human resources and high-tech enterprises continue to gather, but also put forward higher requirements for urban ecological environment protection. Therefore, enterprises need to offset their production costs with more technological innovation compensation. Although the overall environmental quality of cities still plays a role in promoting their innovation-driven development ability, However, this promotion has weakened Table 6.
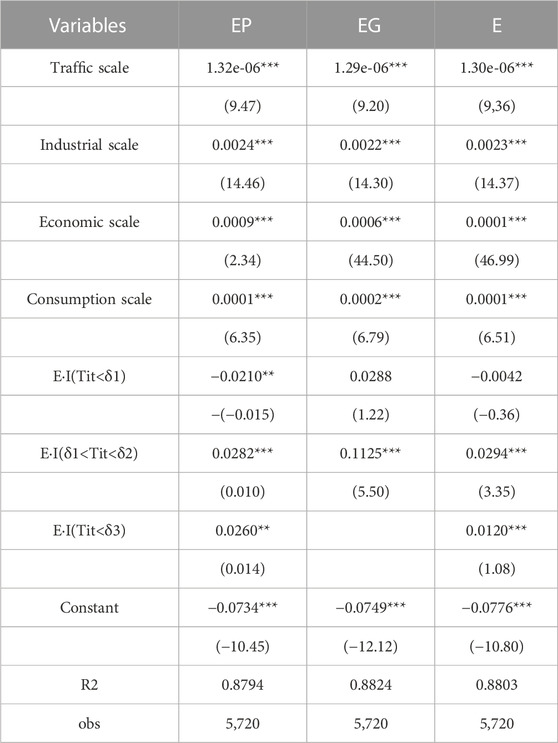
TABLE 6. Parameter estimation of environmental factor combination double-threshold model.
To sum up, the combination of environmental factors has different impacts on the GIE of cities under different thresholds. Three wastes pollution treatment (EP) has an obvious double threshold effect on innovation-driven development. Under the different threshold of per capita GDP, the impact on the GIE of each city is different in size and direction. The green environment (EG) has an obvious single-threshold effect on the city’s innovation drive, and its elasticity coefficient shows that with the increase of GDP per capita, it will promote the improvement of the city’s GIE more and more (Soytas et al., 2007; Stafford, 2007; Silva et al., 2013; Wang et al., 2016). Total environmental quality (E) has an obvious double-threshold effect on urban GIE. Under different thresholds, its elasticity coefficient shows that with the increase of per capita GDP, its effect on urban GIE varies in size and direction. When per capita GDP is low, total environmental quality (E) has a more obvious inhibitory effect on urban innovation, and with the continuous increase of per capita GDP, The total environmental quality (E) has a relatively obvious promoting effect on the urban innovation, but this promoting effect shows a further weakening trend with the increase of GDP per capita (Chang et al., 2021; Adhikari et al., 2022; Lan et al., 2022; Tang et al., 2022; Zhang et al., 2022a).
Compare the impact of three wastes pollution treatment (EP), green environment (EG) and total environmental quality (E) on urban GIE under different threshold values of GDP per capita. We find that when the per capita GDP is below 8,262, the total environmental quality and the treatment of three wastes have a certain inhibiting effect on the innovation-driven development of cities, and the green environment has a relatively obvious promoting effect on the innovation-driven development of cities; When the per capita GDP is between 9,456 and 76,325, the comprehensive utilization rate of general industrial solid waste and green environment have a greater impact on the performance of urban green innovation; When the per capita GDP is higher than 76,325, the contribution of the combination of environmental factors to urban innovation-driven development will be weakened to a certain extent. In this process, the difference of urban per capita GDP is reflected. The contribution of urban total environmental quality to innovation-driven development is different.
4 Conclusion and policy implication
4.1 Conclusion
This paper takes the single environmental factor and combination of environmental factors of environmental heterogeneity as the explanatory variables, the traffic scale, economic scale, industrial scale and consumption scale as the control variables, and the per capita GDP of each city as the threshold variable, and calculates the impact of the single environmental factor and combination of environmental factors of each city on the GIE under the threshold of different per capita GDP. The results show that.
(1) Under different thresholds, a single environmental factor has different impacts on the GIE of cities. E1 has an opposite effect on GIE in cities with different per capita GDP; E2 has different impact direction and size on the GIE of cities with different per capita GDP, but its promotion effect is the largest when the per capita GDP is high; The elasticity coefficient of E3 on the GIE of cities shows that with the increase of GDP per capita, it has a greater role in promoting the GIE of cities; E4 has different impacts on the GIE of cities with different per capita GDP. E5 has a positive impact on urban GIE under different thresholds. Comparing the single environmental factor under different threshold values of per capita GDP, when the per capita GDP is low, attention should be paid to improving E1 and E4; When the per capita GDP is high, E2, E3, E4, and E5 can all have different promotion effects on the urban driving capacity.
(2) The combination of environmental factors has different impacts on the GIE of cities under different thresholds. The impact mechanism between EP and the GIE shows that when the per capita GDP is low, the three wastes pollution treatment will inhibit the GIE of the city, and when the per capita GDP is high, the three wastes pollution treatment significantly promote the GIE of the city; The coefficient of EG in cities with different per capita GDP shows that with the increase of per capita GDP, the green environment will promote the improvement of GIE of cities more and more. Under different thresholds, the elasticity coefficient of the E to the GIE shows that with the continuous improvement of GDP per capita, the total environmental quality has a relatively obvious role in promoting the innovation-driven development of cities, but this role is further weakened with the increase of GDP per capita. Compare the impact of environmental factor combination factors on urban GIE under different threshold values of per capita GDP. When the per capita GDP is low, the green environment has a more obvious role in promoting the innovation drive of the city; When per capita GDP is high, the combination of environmental factors will play a positive role urban innovation-driven development, but this role will be weakened by the increase of per capita GDP.
4.2 Policy implication
(1) Comparing the single environmental factor under different threshold values of per capita GDP, when the per capita GDP is low, attention should be paid to improving the centralized treatment rate of urban sewage treatment plants and the comprehensive utilization rate of general industrial solid waste; When the per capita GDP is high, the harmless treatment rate of domestic waste, the centralized treatment rate of sewage treatment plants, the green coverage rate of the built-up area, and the green area can all have different promotion effects on the driving capacity of cities along the line.
(2) The government should continue to encourage innovation and further introduce incentive policies to support green innovation in regions, cities and enterprises. It is necessary to further increase R&D investment in green innovation, improve the efficiency of transformation of innovation results, and promote the transformation of scientific research results into productive forces at lower cost and higher efficiency.
4.3 Limitations
As described above, this paper has done a lot of work on green innovation, hoping to contribute academic strength to green innovation. However, the research in this paper still has some shortcomings: 1) The research in this paper focuses on the urban scale, and more research on global, national and enterprise scales can be considered in the future; 2) In the era of digital economy, regional green innovation is also undergoing potential changes. In the future, we can further explore the impact of digital economy on regional green technology innovation and the realization path.
Data availability statement
Publicly available datasets were analyzed in this study. This data can be found here: The Statistical Yearbook of Chinese Cities (2003–2022), the Statistical Yearbook of China (2003–2022), the Statistical Yearbook of Science and Technology (2003–2022).
Author contributions
ZD: Writing–original draft, Writing–review and editing.
Funding
The author(s) declare that no financial support was received for the research, authorship, and/or publication of this article. Project of Philosophy and Social Science of Shanghai “Study on the Role of Population Ageing on Economic Growth in the Yangtze River Delta Urban Agglomeration” (2023ZSH002).
Conflict of interest
The authors declare that the research was conducted in the absence of any commercial or financial relationships that could be construed as a potential conflict of interest.
Publisher’s note
All claims expressed in this article are solely those of the authors and do not necessarily represent those of their affiliated organizations, or those of the publisher, the editors and the reviewers. Any product that may be evaluated in this article, or claim that may be made by its manufacturer, is not guaranteed or endorsed by the publisher.
References
Adhikari, B. N., Behera, A. K., Mahapatra, R. N., and Das, H. C. (2022). Retracted: effect of driving domain on driving attitude profiles in winter seasons of India. Growth Chang. 53, 4–34. doi:10.1111/grow.12366
Bastos, E. C., Sengik, A. R., and Tello-Gamarra, J. (2021). Fifty years of University-industry collaboration: a global bibliometrics overview. Sci. Public Policy 48, 177–199. doi:10.1093/scipol/scaa077
Brown, M. A. (2001). Market failures and barriers as a basis for clean energy policies. Energy Policy 29, 1197–1207. doi:10.1016/s0301-4215(01)00067-2
Caselli, M. (2014). Trade, skill-biased technical change and wages in Mexican manufacturing. Appl. Econ. 46 (3), 336–348. doi:10.1080/00036846.2013.848033
Chang, Y.-C., Chen, P.-H., and Teng, M.-J. (2021). How do institutional changes facilitate university-centric networks in Taiwan? The Triple Helix model of innovation view. Sci. Public Policy 48, 309–324. doi:10.1093/scipol/scaa076
Chen, G., Thomas, W., Yafei, W., and Hadjikakou, M. (2016). Transnational city carbon footprint networks-exploring carbon links between Australian and Chinese cities. Appl. Energy 184, 1082–1092. doi:10.1016/j.apenergy.2016.08.053
Chen, P. (2022). Subsidized or not, the impact of firm internationalization on green innovation—based on a dynamic panel threshold model. Front. Environ. Sci. 10, 303. doi:10.3389/fenvs.2022.806999
Chen, P. (2023). Curse or blessing? The relationship between sustainable development plans for resource cities and corporate sustainability-Evidence from China. J. Environ. Manag. 341, 117988. doi:10.1016/j.jenvman.2023.117988
Chen, P., Dagestani, A. A., and Kim, S. (2023). Corporate social responsibility and green exploratory innovation-the moderating role of three environmental regulations. Technol. Analysis Strategic Manag., 1–13. doi:10.1080/09537325.2023.2196585
Chen, P., and Kim, S. (2023). The impact of digital transformation on innovation performance-The mediating role of innovation factors. Heliyon 9 (3), e13916. doi:10.1016/j.heliyon.2023.e13916
Cremer, H., De Donder, P., and Gahvari, F. (2004). Political sustainability and the design of environmental taxes. Int. Tax Public Finance 11, 703–719. doi:10.1023/b:itax.0000045327.33446.3c
David, P. A., and Van de Klundert, T. (1965). Biased efficiency growth and capital-labor substitution in the US, 1899-1960. Am. Econ. Rev. 55 (3), 357–394.
Fan, F., Dai, S. Z., Yang, B., and Ke, H. (2023). Urban density, directed technological change, and carbon intensity: an empirical study based on Chinese cities. Technol. Soc. 72 (2), 102151–102217. doi:10.1016/j.techsoc.2022.102151
Fan, F., Dai, S. Z., Zhang, K. K., and Ke, H. (2021b). Innovation agglomeration and urban hierarchy: evidence from Chinese cities. Appl. Econ. 53, 6300–6318. doi:10.1080/00036846.2021.1937507
Fan, F., Zhang, X. R., Yang, W. Y., and Liu, C. (2021a). Spatiotemporal evolution of China’s ports in the international container transport network under upgraded industrial structure. Transp. J. 60, 43–69. doi:10.5325/transportationj.60.1.0043
Fan, F., Zhang, X. Y., and Wang, X. L. (2022). Are there political cycles hidden inside collaborative innovation efficiency? An empirical study based on Chinese cities. Sci. Public Policy 45 (5), 101093005.
Fare, R., Grosskopf, M., and Zhang, Z. (1994). Productivity growth, technical progress and efficiency changes in industrialized countries. Am. Econ. Rev. 101, 263–275.
Fisher-Vanden, K., Jefferson, G. H., Ma, J., and Xu, J. (2006). Technology development and energy productivity in China. Energy Econ. 28, 690–705. doi:10.1016/j.eneco.2006.05.006
Folayan, M., Zuñiga, R., Quadri, M. F. A., Lusher, J., Gaffar, B., Ellakany, P., et al. (2023). Associations between mental health and COVID-19 status among 18- and 19-year-old adolescents: a multi-country study. Adolescents 3 (1), 131–140. doi:10.3390/adolescents3010010
Gordon, R. J. (2000). Does the “new economy” measure up to the great inventions of the past? J. Econ. Perspect. 14 (4), 49–74. doi:10.1257/jep.14.4.49
Greening, L. A., Greene, D. L., and Difiglioc, C. (2000). Energy efficiency and consumption-the rebound effect-a survey. Energy Policy 28, 389–401. doi:10.1016/s0301-4215(00)00021-5
Hao, Y., and Chen, P. (2023). Do renewable energy consumption and green innovation help to curb CO2 emissions? Evidence from E7 countries. Environ. Sci. Pollut. Res. 30 (8), 21115–21131. doi:10.1007/s11356-022-23723-0
Hertwich, E. G., and Peters, G. P. (2009). Carbon footprint of Nations: a global, trade-linked analysis. Environ. Sci. Technol. 43 (16), 6414–6420. doi:10.1021/es803496a
Hotchkiss, J. L., and Rupasingha, A. (2021). Individual social capital and migration. Growth Chang. 52, 808–837. doi:10.1111/grow.12470
Jira, C., and Toffel, M. W. (2013). Engaging supply chains in climate change. Manuf. Serv. Operations Manag. 15 (4), 559–577. doi:10.1287/msom.1120.0420
Kalt, J. P. (1978). Technological change and factor substitution in the United States. Int. Econ. Rev. 19, 761–775. doi:10.2307/2526339
Lan, T., Zhang, H., and Li, Z. (2022). Exploring the evolution of road centrality: a case study of Hong Kong from 1976 to 2018. Appl. Geogr. 146, 102767. doi:10.1016/j.apgeog.2022.102767
Liu, Q. Q., Wang, S. J., Li, B., and Zhang, W. Z. (2020). Dynamics, differences, influencing factors of eco-efficiency in China: a spatio temporal perspective analysis. J. Environ. Manag. 264, 110442. doi:10.1016/j.jenvman.2020.110442
Liu, W. Q., Gan, L., and Zhang, X. L. (2002). Cost-competitive incentives for wind energy development in China: institutional dynamics and policy changes. Energy Policy 30 (9), 753–765. doi:10.1016/s0301-4215(01)00136-7
Makkonen, H. (2021). Information processing perspective on organisational innovation adoption process. Technol. Anal. Strat. Manag. 33, 612–624. doi:10.1080/09537325.2020.1832218
Mannea, A., and Richels, R. (2004). The impact of learning-by-doing on the timing and costs of CO2 abatement. Energy Econ. 26 (4), 603–619. doi:10.1016/j.eneco.2004.04.033
Mark, S., and Kurt, K. (2017). The carbon footprint of European households and income distribution. Ecol. Econ., 136.
Miradna, M. L., and Hale, B. (2002). A Taxing environment: evaluating the multiple objectives of environmental Taxes. Environ. Sci. Technol. 36, 5289–5295. doi:10.1021/es025637s
Newell, R. G., Jaffe, A. B., and Stavins, R. N. (1999). The induced innovation hypothesis and energy-saving technological change. Q. J. Econ. 114 (3), 941–975. doi:10.1162/003355399556188
Niccolucci, V., Bastianoni, S., Tiezzi, E. B. P., Wackernagel, M., and Marchettini, N. (2009). How deep is the footprint? A 3D Representation. Ecol. Model. 220 (220), 2819–2823. doi:10.1016/j.ecolmodel.2009.07.018
Porterba, J. M. (1997). “The rate of return to corporate capital and factor shares: new estimates using revised national income accounts and capital stock data,” in Proceedings of the National bureau of economic reserch, Cambrige, MA, November 1997.
Ramdhani, M. A., Hilmi, A. H., Andri, I. A., and Mauluddin, Y. (2017). Model of green technology adaptation in small and medium-sized tannery industry. J. Eng. Appl. Sci. 12, 954–962.
Rees, W. E. (1992). Ecological footprints and appropriated carrying capacity: what urban economics leaves out. Environ. Urbanization. 4, 121–130. doi:10.1177/095624789200400212
Ripatti, A., and Vilmunen, J. (2001). Decling labor share-Evidence of a change in underlying production technology? Ssrn Electron. J. 22 (5-6), 20–98.
Sadik-Zada, E. R., and Ferrari, M. (2020). Environmental policy stringency, technical progress and pollution haven hypothesis. Sustainability 12 (9), 3880. doi:10.3390/su12093880
Sadik-Zada, E. R., and Gatto, A. (2021). The puzzle of greenhouse gas footprints of oil abundance. Socio-Economic Plan. Sci. 75, 100936. doi:10.1016/j.seps.2020.100936
Sadik-Zada, E. R., and Loewenstein, W. (2020). Drivers of CO2-emissions in fossil fuel abundant settings: (pooled) mean group and nonparametric panel analyses. Energies 13 (15), 3956. doi:10.3390/en13153956
Sanstad, A. H., Roy, J., and Sathaye, J. A. (2006). Estimating energy-augmenting technological change in developing country industries. Energy Econ. 28, 720–729. doi:10.1016/j.eneco.2006.07.005
Santo, P., and Morita, T. (2009). Quantity or quality: the impact of labor saving innovation on US and Japanese growth rates, 1960-2004. Jpn. Econ. Rev. 60, 407–434.
Sato, R. (1970). The estimation of biased technical progress and the production function. Int. Econ. Rev. 11, 179–201. doi:10.2307/2525662
Schumpter, J. A. (1934). The theory of economic development: an inquiry into profits capital credit, interest and the business cycle. Soc. Sci. Electron. Publ. 25 (1), 90–91.
Serrano, L., and Timmer, M. P. (2002). Is technical change directed by the supply of skills? the case of South Korean. Econ. Lett. 76 (2), 289–293. doi:10.1016/s0165-1765(02)00058-7
Shima, K., Tamura, Y., Tsuji, T., Kandori, A., Yokoe, M., and Sakoda, S. (2009). “Estimation of human finger tapping forces based on a fingerpad-stiffness model,” in Proceedings of the 2009 Annual International Conference of the IEEE Engineering in Medicine and Biology Society, Minneapolis, MN, USA, September 2009, 2663–2667.
Silva, A., Afonso, O., and Africano, A. P. (2013). Economic performance and international trade engagement: the case of Portuguese manufacturing firms. Int. Econ. Econ. Policy 10, 521–547. doi:10.1007/s10368-012-0221-8
Soytas, U., Sari, R., and Ewing, B. T. (2007). Energy consumption, income, and carbon emissions in the United States. Ecol. Econ. 62 (62), 482–489. doi:10.1016/j.ecolecon.2006.07.009
Stafford, S. L. (2007). Can consumers enforce environmental regulations? The role of the market in hazardous waste compliance. J. Regul. Econ. 31 (1), 83–107. doi:10.1007/s11149-006-9006-8
Sun, C., and Yi, Y. (2020). The research of the dual effects of financial development on the optimization of marine industrial structure. J. Coast. Res. 108, 140–143. doi:10.2112/jcr-si108-028.1
Tang, H. Y., Zhang, J. Q., Fan, F., and Wang, Z. W. (2022). High-speed rail, urban form, and regional innovation: a time-varying difference-in-differences approach. Technol. Anal. Strateg. Manag. 34, 2026322.
Wang, S., Chu, C., Chen, G., Peng, Z., and Li, F. (2016). Efficiency and reduction cost of carbon emissions in China: a non-radial directional distance function method. J. Clean. Prod. 113, 624–634. doi:10.1016/j.jclepro.2015.11.079
Wang, X. L., Wang, L., Zhang, X., and Fan, F. (2022b). The spatiotemporal evolution of COVID-19 in China and its impact on urban economic resilience. Chn. Econ. Rev. 74, 101806. doi:10.1016/j.chieco.2022.101806
Wang, Z. W., Yin, H., Fan, F., Fang, Y., and Zhang, H. (2022a). Science and technology insurance and regional innovation: evidence from provincial panel data in China. Technol. Anal. Strateg. Manag. 34, 1–19. doi:10.1080/09537325.2022.2053518
Weng, Z. (2023). Regional differences and drivers of patent transfer-in between Chinese cities: a city absorptive capacity perspective. Technol. Anal. Strateg. Manag. 35 (8), 542–556.
Zhang, C., Chen, P., and Hao, Y. (2022a). The impact of digital transformation on corporate sustainability-new evidence from Chinese listed companies. Front. Environ. Sci. 10, 1047418. doi:10.3389/fenvs.2022.1047418
Zhang, H., Lan, T., and Li, Z. L. (2022b). Fractal evolution of urban street networks in form and structure: a case study of Hong Kong. Int. J. Geogr. Inf. Sci. 36, 1100–1118. doi:10.1080/13658816.2021.1974451
Keywords: environmental quality, green innovation, performance, threshold variable, China
Citation: Ding Z and Li C (2023) Can regional environmental quality improve green innovation performance? an empirical analysis from China. Front. Environ. Sci. 11:1276224. doi: 10.3389/fenvs.2023.1276224
Received: 11 August 2023; Accepted: 06 November 2023;
Published: 22 November 2023.
Edited by:
Elkhan Richard Sadik-Zada, Ruhr University Bochum, GermanyCopyright © 2023 Ding and Li. This is an open-access article distributed under the terms of the Creative Commons Attribution License (CC BY). The use, distribution or reproduction in other forums is permitted, provided the original author(s) and the copyright owner(s) are credited and that the original publication in this journal is cited, in accordance with accepted academic practice. No use, distribution or reproduction is permitted which does not comply with these terms.
*Correspondence: Chen Li, bGljaGVuQHN1ZXMuZWR1LmNu