
94% of researchers rate our articles as excellent or good
Learn more about the work of our research integrity team to safeguard the quality of each article we publish.
Find out more
DATA REPORT article
Front. Environ. Sci., 18 October 2023
Sec. Water and Wastewater Management
Volume 11 - 2023 | https://doi.org/10.3389/fenvs.2023.1271711
This article is part of the Research TopicAdvances in Ecotechnologies for the Control of Non-Point Source Pollution in Agricultural and Urban WatershedsView all 5 articles
 Marcelino Antonio Zúñiga-Estrada1
 Liliana Lizárraga-Mendiola2
 Carlos Alfredo Bigurra-Alzati2
 Gabriela A. Vázquez-Rodríguez1*
Bioretention cells are widespread blue and green infrastructure (BGI) solutions consisting of depressions filled with a coarse-grained layer at the base to allow water drainage. Other layers, usually of sand or engineered adsorbents, are placed above, followed by soil and a vegetative cover. The benefits of bioretention include the improvement of urban runoff (UR) quality, the management of runoff volume, the mitigation of urban heat islands, and local biodiversity support, among others (Vijayaraghavan et al., 2021).
Some characteristics of arid and semi-arid zones are their low annual precipitation rate (less than 500 mm), long dry periods, and short-lived storms, which are becoming more extreme because of climate change (Wasko et al., 2021). Concerning water quality, the long time between successive storms in arid and semi-arid zones allows for a substantial pollutant build-up on urban surfaces. This build-up leads to significant pollution loads in the resulting UR and higher contents of total suspended solids (TSS), organic matter, nutrients, and heavy metals than in the samples obtained in humid or temperate zones (Zúñiga-Estrada et al., 2022). The first storms of the rainy season increase the concentrations of these non-point pollutants, which is known as the seasonal first flush (Ortiz-Hernández et al., 2016). In sum, the particularities of arid and semi-arid climates must be considered in designing BGI solutions such as bioretention cells. Moreover, these devices must be monitored once constructed to validate their potential to improve runoff quality.
However, the implementation of bioretention cells in arid and semi-arid regions still needs to increase, as do studies evaluating their performance there. Bioretention advantages in these zones have been demonstrated primarily through modeling, while field studies are relatively scarce, particularly those related to water quality monitoring (Meerow et al., 2021). This lack of reports hinders the generalized adoption of bioretention as a water conservation strategy at the urban scale, precisely where it is most urgent to alleviate water scarcity (Zúñiga-Estrada et al., 2022).
Consequently, this work aimed to evaluate the depollution performance of a field-scale bioretention cell built in a flood-prone urban semi-arid area. So far, the hydrological validation of this bioretention cell, designed to endure long dry periods, has been carried out only through the US Environmental Protection Agency Stormwater Management Model (SWMM; Zúñiga-Estrada et al., 2022). First, we explored the pollution sources in the site through hydrological modeling. The considered pollutants were TSS, organic matter, nutrients, and two heavy metals (manganese and lead). Then, we evaluated their elimination in the bioretention cell experimentally during three actual storm events (SEs).
The study site was our university’s campus (Universidad Autónoma del Estado de Hidalgo) in Mineral de la Reforma (Hidalgo, Mexico; Figure 1). Its coordinates are 20°05′047''(north latitude) and 98°42′37''(west longitude) at 2,426 m above sea level. The average air temperature is 14.6°C, and the annual rainfall is 375.9 mm (CONAGUA, 2020). Rainfall occurs mainly from April to September (SMN, 2019).
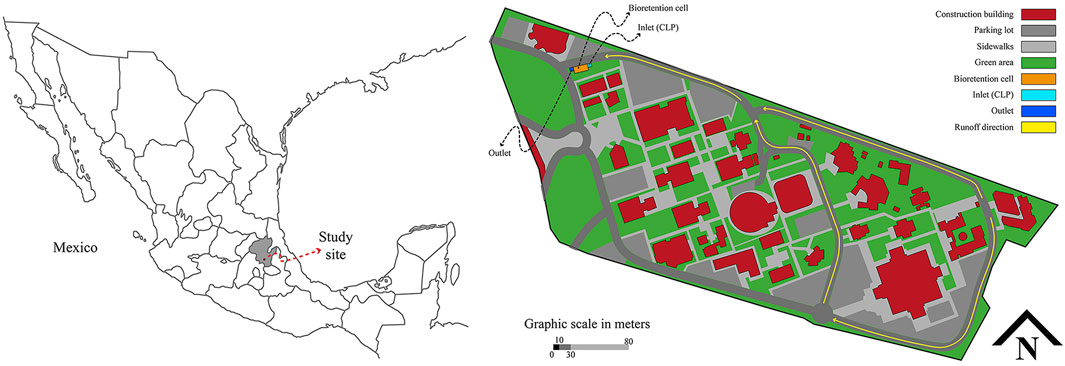
FIGURE 1. Study site.
This study develops an integrated urban catchment pipe monitoring and modeling approach to diagnose the impact of UR contaminants from stormwater drainage on a bioretention cell constructed in the catchment lowest point (CLP) as a receiving water body. Urban runoff flow patterns and the primary land uses in the study site were determined to define the possible origin of the pollutants examined (Figure 1). During the dry period, feces of fauna that regularly transit over the surface of the study area accumulate, while grease and oil from vehicles that circulate on the main road or remain in the parking lots are distributed throughout the university campus. Moreover, sediments transported by wind or due to the irrigation of green areas accumulate downstream. During the first flush, these substances are kept through the pores of the diverse types of surfaces or washed and driven from various places toward the main channel due to gravity. Finally, most of these substances are deposited at the CLP, where the bioretention cell is found.
The SWMM software was developed in the 1970s (EPA, 1978), and since then, its applications and scopes have continued to grow. Today, it has evolved into a dynamic rainfall–runoff path simulation model capable of modeling water quantity and quality for long-term event-based simulations (Rossman, 2010). The dry weather time step is used when there is no rain and standing water in the catchment. In this study, a dry weather time step of 1 h was found to be adequate for simulation time and model accuracy. We used the 5-s routing time step to calculate the flow through the drainage network to ensure the numerical stability of the model. Finally, we calculated the infiltration through the modified Horton method. We adopted the base parameters of the model for the study catchment from Zúñiga-Estrada et al. (2022), whose study incorporates an analysis of the water quality present in the study area. The parameters used in the SWMM specific to the bioretention cell built in the study site are presented in the Supplementary Material. We entered the concentrations of the water quality parameters into the software: TSS, organic matter (measured as chemical oxygen demand, COD), ammonia nitrogen (N-NH4+), nitrate nitrogen (N-NO3-), and total orthophosphates (PO43- tot), manganese (Mn tot), and lead (Pb tot). The concentrations of these contaminants at the bioretention cell inlet, found in the CLP, were modeled to find what variations occurred during the path of surface runoff through the study site after three rainfall depths (51, 30, and 9 mm), which correspond to the actual SEs described below (SE1, SE2, and SE3, respectively). The results of this exploratory simulation allowed us to find the possible origin from where the contaminants are transported to the bioretention cell. The results and discussion section analyze these aspects.
The bioretention cell constructed in the study site (Figure 2) has the configuration and dimensions fully presented in Supplementary Figure S1. The cell was built parallel to the road in the CLP of the study site and has a complementary upstream solids trap. This trap reduces the coarse solids entering through the drain grate via a 4″C-PVC pipe to the bioretention cell and is connected from its entrance at 10 cm from its surface. We built the cell with a general slope of 2% toward a maintenance hole, to which a storage tank was connected (corresponding to the outlet of the bioretention cell; Supplementary Figure S1). The following filter material layers were introduced in the cell (from the bottom to the surface): Ø ¾" tezontle (volcanic scoria, 30 cm), ¾" gravel (50 cm), ½" gravel (40 cm); Ø 2 mm sand (30 cm) and Ø < 0.6 mm soil (50 cm). Earlier tests had shown the suitability of this configuration, specifically for removing heavy metals such as Mn and Pb (Zúñiga-Estrada et al., 2020). A 4″C-PVC pipe was placed over the first 15 cm of the sand layer. This pipe was distributed throughout the width and length of the cell and had holes every 5 cm on its surface to partially catch and transport the infiltrated water to the tank. A geotextile layer was installed beneath the soil to hold it in place. The soil used in the study had a sandy loam texture and a cation exchange capacity (CEC) of 31.25 Cmol(+)/kg (or meq/100 g). The complete mineralogical characterization of these materials is presented elsewhere (Zúñiga-Estrada et al., 2020). Six specimens of Agave tequilana, two of A. salmiana, and four of Yucca sp. were placed as the vegetal cover of the cell. We chose the plants based on the following considerations. Agave and Yucca are genera of succulent rosettes ubiquitous in the North American drylands. These plants have evolved to cope with drought through internal water storage (that is, succulence) or the arrangement of their massive leaves, allowing the fog conduction into the stem tissues (that is, the rosette morphology) (Martorell and Ezcurra, 2002). Both traits are desirable in the vegetative cover used in the BGI built in arid and semi-arid zones, where external water supply is limited during the year. The bioretention system construction was finished in December 2016, and since then, the system has only received occasional irrigation and maintenance. The original vegetation is still in place.
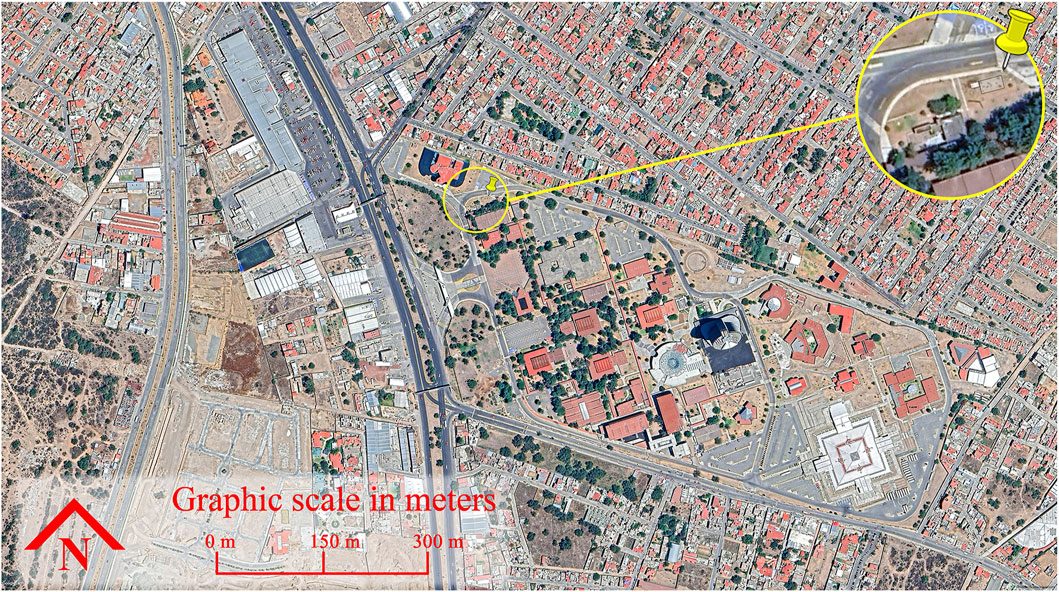
FIGURE 2. Localization of the bioretention cell in the study site (Source: Google Earth).
Due to the large size of the bioretention cell, the small rainfall depths do not produce an outflow. Consequently, the water quality monitoring was limited to SEs with significant rainfall depths, which occur sparingly in the study zone. That is why field runoff quality monitoring was conducted on 28 June 2017 (storm event 1, SE1), 4 June 2019 (SE2), and 5 June 2019 (SE3). The three SEs consisted of events lasting less than 90 min. Two of them (SE1 and SE2) represent the seasonal first flush in two different years. Rainfall depths were 51, 30, and 9 mm, respectively. For each SE, sampling was conducted at the inlet (CLP) of the bioretention cell and the outlet (Supplementary Figure S1). Individual samples of approximately 250 mL were collected during the first part of the storms as soon as the runoff water was deep enough to be sampled. These individual samples were composited into a plastic container washed with nitric acid to a total volume of three liters. The collected samples were transported to the laboratory and kept at 4°C until analysis.
Unless stated otherwise, the samples were analyzed in triplicate and followed standard methods (APHA, 2012). The parameters analyzed were TSS, COD, N-NH4+, N-NO3- (Mubarak et al., 1977), PO43- tot, Mn tot, and Pb tot. We present full details of the analytical methods in the Supplementary Material. For each parameter analyzed, the arithmetic means of the triplicates were calculated and reported. We analyzed significant differences in water quality parameters and removal percentages through one-way ANOVAs with Tukey’s post hoc comparison tests in Minitab v. 16 (Minitab Inc., College State, PA, USA).
The model obtained in the SWMM allowed us to appreciate the capacity of the study site to remove contaminants during the three SEs. In the graphs included in the Supplementary Material, it is possible to identify where more significant or lesser depollution occurred, as discussed below.
TSS, N-NH4+, and PO43- tot - In SE1, the TSS, N-NH4+, and PO43- tot concentrations were high (>900, 1.8, and 4.5 mg/L, respectively) throughout the entire catchment (Supplementary Figures S2–S4, respectively). In some areas, their concentrations diminished in SE2 compared to SE1 and were further reduced during SE3 and in larger campus areas. The only difference in the three SEs was the amount of rainfall, which was highest in SE1 (51 mm). This fact was not accompanied by the best removal capacity, possibly because the surfaces did not keep these pollutants enough or because the amount transported was such that the runoff volume could not dilute it enough, allowing its accumulation at the CLP.
COD–In the study site, similar COD concentrations (higher than 280 mg/L) were mostly modeled for SE1 and SE2; these concentrations decreased in the green areas and bare ground spaces during SE3 (Supplementary Figure S5). This fact highlights the importance of keeping unbuilt spaces to mitigate the transport of pollutants in urbanized catchments. COD concentrations in the CLP were the lowest during SE2. During the next day (SE3), this pollutant was diluted along the entire catchment, transporting the remains toward the cell inlet.
N-NO3- - The highest concentrations of this pollutant (>4.5 mg/L) were modeled in SE2. However, the surfaces where its concentration was inferior to 1.5 mg/L (signaled in blue in Supplementary Figure S6) did increase inversely with the rainfall depth (SE3 > SE2 > SE1).
Mn tot and Pb tot - For both contaminants, their concentrations followed the order SE1 > SE3 > SE2 (Supplementary Figures S7, S8). The spatial distribution of these metals is similar and, differently from what the bibliography states, did not track the TSS pattern (Djukić et al., 2016). The concentrations of both metals were exceptionally high in parking lots, which are well-known sources of these pollutants. We hypothesized that the permanence of the vehicles during the day eases a significant accumulation of these pollutants; the low slope of these surfaces also helped their retention during SE2 and up to SE3. The concentrations of both pollutants were higher in SE3 than in SE2 as a result of these two events occurring on two consecutive days.
Table 1 presents the characterization results of the UR sampled at the bioretention cell inlet in the three SEs and the corresponding concentrations simulated by the SWMM after 1 hour. The values previously measured in the same site in the wet and dry seasons are also included as a reference (Ortiz-Hernández et al., 2016), as are the values of the Mexican water quality standard for aquifer recharge (NOM-015-CONAGUA-2007; NOM, 2007). We also show the ANOVA results indicating statistically significant differences between the three samplings for most water quality parameters.
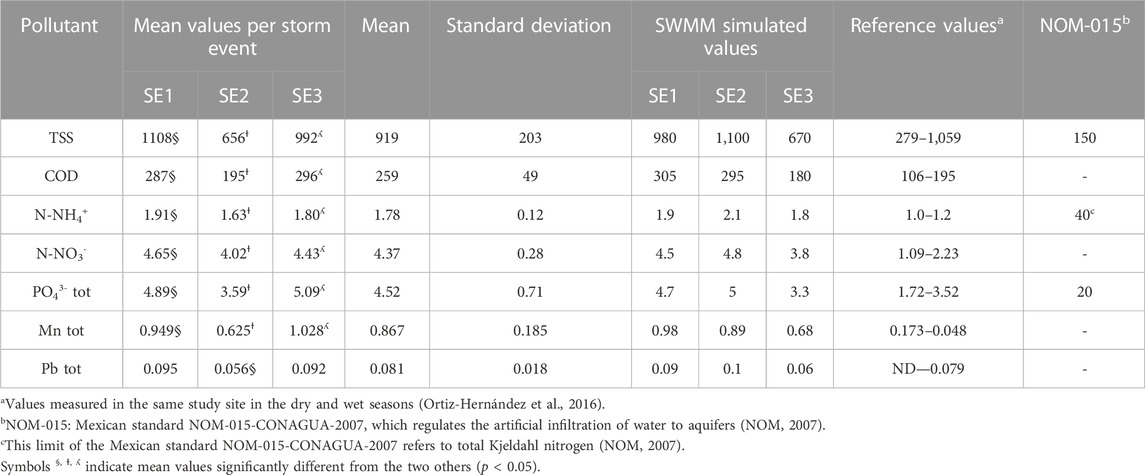
TABLE 1. Pollutant concentrations (mg/L) in the urban runoff sampled at the bioretention cell inlet in the three storm events (SEs).
The concentrations of all pollutants, except TSS, exceeded the highest values measured in that earlier study (Ortiz-Hernández et al., 2016). Moreover, the concentrations of nitrates determined in the three SEs were similar or superior to other significant values reported in the bibliography as upper limits (3.97 mg N-NO3- in Asaf et al., 2004, 4.6 mg N-NO3-/L in Ivanovsky et al., 2018). The same occurred with the phosphates’ contents, which have been reported in the 0.1–4.69 mg/L range in urban stormwater sampled in a semi-arid coastal zone (Mahmoud et al., 2019). The high contents of pollutants measured in the study site can be attributed to the intensity of the three SEs, particularly SE1 and SE2, which caused flooding and a considerable mobilization of crustal material and pollution build-up in the study site. Consequently, the URs produced in the three SEs were not adequate for artificial aquifer recharge because their TSS contents surpassed the maximum permissible limit set up by the Mexican standard NOM-015-CONAGUA-2007 (150 mg/L; Table 1) (NOM, 2007).
Concerning the values simulated by the SWMM, the best estimations were obtained for SE1 (Table 1). For this SE, the absolute errors (data not shown) encompassed between 0.5% and 11.6% for the N-NH4+ and TSS concentrations, respectively. For SE2, the absolute errors were from 19.4% (N-NO3-) to 78.6% (Pb tot), and for SE3, from 0% (N-NH4+) to 34.8% (Pb tot).
The characterization results of the samples taken in the three SEs at the bioretention cell outlet and the corresponding pollutant removal efficiencies are shown in Tables 2, 3, respectively. These results confirm the capacity of bioretention cells for removing several urban runoff pollutants, particularly TSS and heavy metals, as reported in the bibliography (Mahmoud et al., 2019; Sharma and Malaviya, 2021).
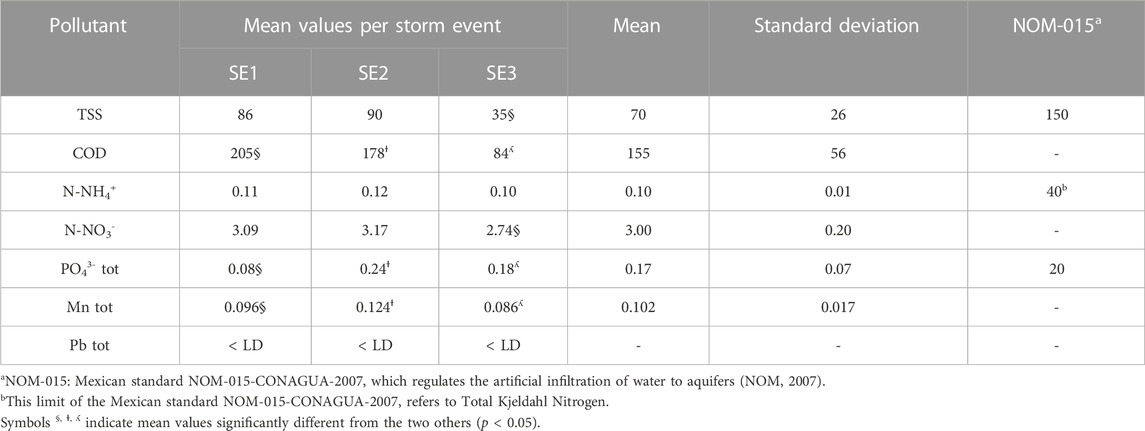
TABLE 2. Pollutant concentrations (mg/L) in the bioretention cell effluent in the three storm events (SEs).
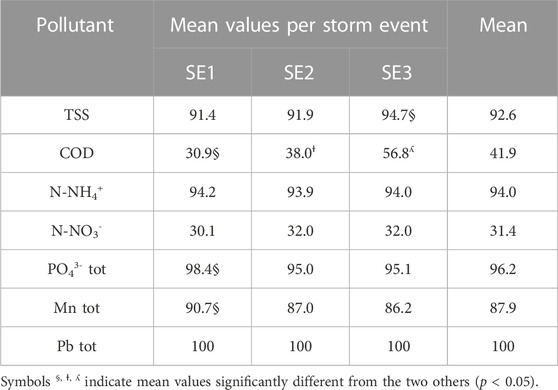
TABLE 3. Pollutant removal efficiencies (%) of the bioretention cell in the three storm events (SEs).
TSS are among the best-removed pollutants in bioretention cells, with elimination efficiencies ranging from 58% to 99% (Mahmoud et al., 2019; Ho and Lin, 2022). It has been pointed out that TSS removal is better (higher than 88%) in devices with internal water storage than in cells devoid of this space (TSS removal was between 25% and 65%) (Li et al., 2014). In our study, the TSS eliminations were higher than 90% in the three SEs, which agrees with the previously mentioned study, because the layers beneath the soil function as an internal water storage layer (Supplementary Figure S5). The bioretention cell effluents followed the Mexican standard NOM-015-CONAGUA-2007 (NOM, 2007), which enables their reuse for artificial aquifer recharge concerning this parameter (Table 2).
We measured moderate COD removals, ranging from 30.9% to 56.8% (Table 3), which is common in the bibliography. For example, in the long-term monitoring of a field-scale bioretention cell in Chaohu Lake, China, COD was mildly removed (25%–33%) within the first year after the cell construction. The COD elimination rate augmented up to 50%–69% in the following year due to the entire establishment of a microbial system able to biodegrade this pollutant (Ho and Lin, 2022). These authors further improved COD (and phosphorus) removal by using a mix of zeolite, organic materials, iron slag, and soil instead of the gravel layer at the bottom of the cell. This adaptation would have contributed to maintaining an active microbial population degrading COD by supplying an additional carbon source (Ho and Lin, 2022).
When it comes to the removal of nutrients, bioretention cells have shown mixed performance, probably due to the complexity of the chemistry of these species and their leaching from soil and vegetation (Davis et al., 2009). For N-NH4+, removal efficiencies ranging from 64% to 96% have been reported in field studies, which are commonly attributed to the cation exchange capacity of the media, vegetation uptake (Osman et al., 2019), nitrification (Hunt et al., 2008), or internal water storage (Li et al., 2014). In our cell, N-NH4+ was removed at high rates (around 94%; Table 3), probably through a combination of these factors, although the soil’s high CEC could have been the major factor. CEC measures a soil’s ability to keep cationic nutrients (such as NH4+) for plant use. However, in a bioretention cell, it is also related to the exchange of heavy metals between the UR and the soil, thereby reducing their leaching. Several guidelines recommend that soils to be used in bioretention have CEC equal to at least 5 meq/100 g (Hodgins and Seipp, 2018; City of Tacoma, 2021), which underscores the high capacity of the study cell’s upper layer to keep several of the study pollutants (NH4+, Mn, and Pb). In contrast, N-NO3- was the least-eliminated pollutant in the cell, with removal rates of around 30% (Table 3). As a very soluble anion, nitrates are poorly kept by soil. However, microbial denitrification (that converts nitrates into N2) can occur in a bioretention cell following carbon amendments, the installation of a submerged zone within the cell leading to anoxic conditions, or the use of less permeable soils extending contact time (Davis et al., 2009; Sharma and Malaviya, 2021). Depending on their growth stage, some plant species may also contribute to N-NO3- removal (Osman et al., 2019).
Phosphate removal relies primarily on adsorption on solid media surfaces such as Fe and Al oxides or organic matter, where phosphates accumulate, and eventually, a breakthrough ensues (Sharma and Malaviya, 2021). Phosphates are available for plant uptake while they stay adsorbed on the media layers, although precipitation via cation complexing may also occur. These mechanisms explain the high removal phosphorus rates reported in field bioretention studies (77%–79%; Davis et al., 2009), although leaching from media is also described, particularly from phosphorus-rich soils, compost amendments, or long-running systems (Jiang et al., 2017). In the three SEs we monitored, removal rates were higher than 95% (Table 3).
Likewise, bioretention devices are usually reported as efficient for removing heavy metals from UR, which occurs in the upper layers (top 25 cm) of media (Davis et al., 2009). Their elimination is mainly due to mechanisms associated with filter materials, such as cation exchange, complexation, adsorption, or precipitation. It has been stated that, in bioretention cells, plants have a minor role in heavy metal removal, which increases at warmer temperatures due to the vegetation action as solar metal pumps (Sharma and Malaviya, 2021). For Pb eliminations, 98% has been reported in field- and lab-scale studies (Mahmoud et al., 2019), while for Mn, lower values (28%–98%) have been obtained at the lab scale (Beral et al., 2023). In our study, Pb was not detected at the effluents of the bioretention cell obtained in the three SEs; for Mn, the removal rates ranged from 86.2% to 90.7% (Table 3). As signaled above, Mn and Pb eliminations could be attributed to the soil’s high cation exchange capacity.
Hydrological modeling confirmed the conveyance of the study pollutants to the catchment’s lowest point and their ensuing build-up in significant storm events, showing the bioretention cell’s proper location. Monitoring the quality of the urban runoff generated in the three storm events allowed us to validate the hydrological model and the depollution carried out by the cell, which was designed to endure the long dry periods typically occurring in this semi-arid region. Although the bioretention cell removed nitrates poorly, its overall performance was similar to or better than those of the bibliography reports. According to the corresponding Mexican standard, and unlike the raw urban runoff, the bioretention cell effluents can be reused for artificial aquifer recharge regarding TSS concentrations. This fact confirms the potential of the proposed bioretention design for alleviating non-point pollution in semi-arid catchments, even in the case of first-flush events, which is the main achievement of the study.
Nonetheless, the main drawback of this work is the limited number of outflow samples that could be collected from the bioretention cell. Since the outflow samplings were limited to significant rainfall depths, this study must continue to bring a more extensive water quality dataset. With further experimental validation, this work could be a practical example of fostering BGI application in arid and semi-arid zones.
The original contributions presented in the study are included in the article/Supplementary Material, further inquiries can be directed to the corresponding author.
MZ-E: Methodology, Writing–original draft, Investigation, Software. LL-M: Conceptualization, Funding acquisition, Project administration, Supervision, Writing–review and editing, Data curation, Formal Analysis, Resources. CB-A: Resources, Software, Supervision, Visualization, Writing–review and editing. GV-R: Conceptualization, Funding acquisition, Methodology, Project administration, Supervision, Writing–original draft, Writing–review and editing.
The authors declare financial support was received for the research, authorship, and/or publication of this article. This work was supported by the Autonomous University of the State of Hidalgo (Universidad Autónoma del Estado de Hidalgo, UAEH) through the Programa Anual de Investigación (PAI). Open Access funding was provided by the PAO-2023 project (UAEH), “Fortalecimiento de los Programas Educativos, Cuerpos Académicos y Grupos de Investigación del Área Académica de Ingeniería y Arquitectura”.
The authors thank Erandi Gabriela Hernández-Sánchez for her technical assistance in the obtention and analysis of urban runoff samples and to the members of the Cuerpo Académico de Biotecnología y Microbiología Ambientales (UAEH) for their contribution to the PAI project.
The authors declare that the research was conducted in the absence of any commercial or financial relationships that could be construed as a potential conflict of interest.
All claims expressed in this article are solely those of the authors and do not necessarily represent those of their affiliated organizations, or those of the publisher, the editors and the reviewers. Any product that may be evaluated in this article, or claim that may be made by its manufacturer, is not guaranteed or endorsed by the publisher.
The Supplementary Material for this article can be found online at: https://www.frontiersin.org/articles/10.3389/fenvs.2023.1271711/full#supplementary-material
APHA (2012). Standard methods for the examination of water and wastewater. 22nd edition. Washington D.C: American Public Health Association/American Water Works Association/Water Environment Federation.
Asaf, L., Nativ, R., Shain, D., Hassan, M., and Geyer, S. (2004). Controls on the chemical and isotopic compositions of urban stormwater in a semi-arid zone. J. Hydrol. 294 (4), 270–293. doi:10.1016/j.jhydrol.2004.02.010
Beral, H., Dagenais, D., Brisson, J., and Kõiv-Vainik, M. (2023). Plant species contribution to bioretention performance under a temperate climate. Sci. Total Environ. 858, 160122. doi:10.1016/j.scitotenv.2022.160122
City of Tacoma (2021). Stormwater management manual. Tacoma, WA: Environmental Services, Science and Engineering Division.
CONAGUA (National Water Commission) (2020). Sistema CLICOM (in Spanish). National climatological database. Mexico: Comisión Nacional del Agua. Available at: http://clicom-mex.cicese.mx (Accessed November 27, 2020).
Davis, A. P., Hunt, W. F., Traver, R. G., and Clar, M. (2009). Bioretention technology: overview of current practice and future needs. J. Environ. Eng. 135 (3), 109–117. doi:10.1061/(ASCE)0733-9372(2009)135:3(109)
Djukić, A., Lekić, B., Rajaković-Ognjanović, V., Veljović, D., Vulić, T., Djolić, M., et al. (2016). Further insight into the mechanism of heavy metals partitioning in stormwater runoff. J. Environ. Manage. 168, 104–110. doi:10.1016/j.jenvman.2015.11.035
EPA (1978). Proceedings storm water management model (SWMM) users group meeting. May 4-5, 1978. Miscellaneous Report Series. US Environmental Protection Agency. EPA-600/9-78-019.
Ho, C. C., and Lin, Y. X. (2022). Pollutant removal efficiency of a bioretention cell with enhanced dephosphorization. Water 14 (3), 396. doi:10.3390/w14030396
Hodgins, B., and Seipp, B. (2018). Bioretention system design specifications. Ellicott City, MA: Center for Watershed Protection Inc.
Hunt, W. F., Smith, J. T., Jadlocki, S. J., Hathaway, J. M., and Eubanks, P. R. (2008). Pollutant removal and peak flow mitigation by a bioretention cell in urban Charlotte, NC. J. Environ. Eng. 134 (5), 403–408. doi:10.1061/(ASCE)0733-9372(2008)134:5(403)
Ivanovsky, A., Belles, A., Criquet, J., Dumoulin, D., Noble, P., Alary, C., et al. (2018). Assessment of the treatment efficiency of an urban stormwater pond and its impact on the natural downstream watercourse. J. Environ. Manag. 226, 120–130. doi:10.1016/j.jenvman.2018.08.015
Jiang, C., Li, J., Li, H., Li, Y., and Chen, L. (2017). Field performance of bioretention systems for runoff quantity regulation and pollutant removal. Water, Air, & Soil Pollut. 228, 468. doi:10.1007/s11270-017-3636-6
Li, M. H., Swapp, M., Kim, M. H., Chu, K. H., and Sung, C. Y. (2014). Comparing bioretention designs with and without an internal water storage layer for treating highway runoff. Water Environ. Res. 86 (5), 387–397. doi:10.2175/106143013X13789303501920
Mahmoud, A., Alam, T., Rahman, M. Y. A., Sanchez, A., Guerrero, J., and Jones, K. D. (2019). Evaluation of field-scale stormwater bioretention structure flow and pollutant load reductions in a semi-arid coastal climate. Ecol. Eng. 142, 100007. doi:10.1016/j.ecoena.2019.100007
Martorell, C., and Ezcurra, E. (2002). Rosette scrub occurrence and fog availability in arid mountains of Mexico. J. Veg. Sci. 13 (5), 651–662. doi:10.1111/j.1654-1103.2002.tb02093.x
Meerow, S., Natarajan, M., and Krantz, D. (2021). Green infrastructure performance in arid and semi-arid urban environments. Urban Water J. 18, 275–285. doi:10.1080/1573062X.2021.1877741
Mubarak, A., Howald, R. A., and Woodriff, R. (1977). Elimination of chloride interferences with mercuric ions in the determination of nitrates by the phenoldisulfonic acid method. Anal. Chem. 49 (6), 857–860. doi:10.1021/ac50014a047
NOM (2007). Infiltración artificial de agua a los acuíferos. Características y especificaciones de las obras y del agua (in Spanish). Artificial infiltration of water to aquifers. Characteristics and specifications of the works and the water. Mexico: Secretaría de Medio Ambiente y Recursos Naturales. Available at: http://dof.gob.mx/nota_detalle.php?codigo=5105754&fecha=18/08/2009 (Accessed June 16, 2023).
Ortiz-Hernández, J., Lucho-Constantino, C., Lizárraga-Mendiola, L., Beltrán-Hernández, R. I., Coronel-Olivares, C., and Vázquez-Rodríguez, G. A. (2016). Quality of urban runoff in wet and dry seasons: a case study in a semi-arid zone. Environ. Sci. Pollut. Res. 23, 25156–25168. doi:10.1007/s11356-016-7547-7
Osman, M., Wan Yusof, K., Takaijudin, H., Goh, H. W., Abdul Malek, M., Azizan, N. A., et al. (2019). A review of nitrogen removal for urban stormwater runoff in bioretention system. Sustainability 11 (19), 5415. doi:10.3390/su11195415
Rossman, L. A. (2010). Storm water management model user’s manual version 5.0. Cincinnati, OH 45268: National Risk Management Research and Development, US Environmental Protection Agency.
Sharma, R., and Malaviya, P. (2021). Management of stormwater pollution using green infrastructure: the role of rain gardens. Wiley Interdiscip. Rev. Water 8 (2), e1507. doi:10.1002/wat2.1507
SMN (National Meteorological Service) (2019). Pronóstico del Tiempo por Municipios (in Spanish). Forecasted Weather for Municipalities. Mexico: Servicio Metereológico Nacional. Available at: http://smn.cna.gob.mx/es/pronostico-del-tiempo-por-municipios (Accessed September 4, 2022).
Vijayaraghavan, K., Biswal, B. K., Adam, M. G., Soh, S. H., Tsen-Tieng, D. L., Davis, A. P., et al. (2021). Bioretention systems for stormwater management: recent advances and future prospects. J. Environ. Manage. 292, 112766. doi:10.1016/j.jenvman.2021.112766
Wasko, C., Nathan, R., Stein, L., and O'Shea, D. (2021). Evidence of shorter more extreme rainfalls and increased flood variability under climate change. J. Hydrol. 603, 126994. doi:10.1016/j.jhydrol.2021.126994
Zúñiga-Estrada, M. A., Lizárraga-Mendiola, L., Bigurra-Alzati, C. A., Aldana-Alonso, S. E., Ramírez-Núñez, J. S., and Vázquez-Rodríguez, G. A. (2022). Preliminary model-based evaluation of water conservation strategies in a semi-arid urban zone. Land 11 (1), 101. doi:10.3390/land11010101
Zúñiga-Estrada, M. A., Vázquez-Rodríguez, G. A., Ramírez-Cardona, M., and Lizárraga-Mendiola, L. (2020). Mineralogical evidence of unfavorable geochemical interactions between urban runoff pollutants and filter materials in low-impact systems. J. Hazard. Mater. 390, 122136. doi:10.1016/j.jhazmat.2020.122136
Keywords: blue and green infrastructure, urban stormwater, semi-arid climates, non-point pollution, water quality, modeling, SWMM
Citation: Zúñiga-Estrada MA, Lizárraga-Mendiola L, Bigurra-Alzati CA and Vázquez-Rodríguez GA (2023) Depollution of first flush urban runoff in a field-scale bioretention cell adapted to semi-arid climates. Front. Environ. Sci. 11:1271711. doi: 10.3389/fenvs.2023.1271711
Received: 02 August 2023; Accepted: 28 September 2023;
Published: 18 October 2023.
Edited by:
Mathieu Nsenga Kumwimba, Chinese Academy of Sciences (CAS), ChinaReviewed by:
Fidele Suanon, University of Abomey-Calavi, BeninCopyright © 2023 Zúñiga-Estrada, Lizárraga-Mendiola, Bigurra-Alzati and Vázquez-Rodríguez. This is an open-access article distributed under the terms of the Creative Commons Attribution License (CC BY). The use, distribution or reproduction in other forums is permitted, provided the original author(s) and the copyright owner(s) are credited and that the original publication in this journal is cited, in accordance with accepted academic practice. No use, distribution or reproduction is permitted which does not comply with these terms.
*Correspondence: Gabriela A. Vázquez-Rodríguez, Z3ZhenF1ZXpAdWFlaC5lZHUubXg=
Disclaimer: All claims expressed in this article are solely those of the authors and do not necessarily represent those of their affiliated organizations, or those of the publisher, the editors and the reviewers. Any product that may be evaluated in this article or claim that may be made by its manufacturer is not guaranteed or endorsed by the publisher.
Research integrity at Frontiers
Learn more about the work of our research integrity team to safeguard the quality of each article we publish.