 Shuang Cheng
 Guoqiao Zhang2
95% of researchers rate our articles as excellent or good
Learn more about the work of our research integrity team to safeguard the quality of each article we publish.
Find out more
ORIGINAL RESEARCH article
Front. Environ. Sci. , 11 January 2024
Sec. Environmental Informatics and Remote Sensing
Volume 11 - 2023 | https://doi.org/10.3389/fenvs.2023.1267752
Accurate monitoring of ozone (O3) concentrations by remote sensing is essential for achieving pollution control and ecological protection. However, the existing O3 remote sensing data with a low spatial resolution do not facilitate fine-grained studies of small-scale urban clusters. In this study, the multiscale geographically weighted regression kriging (MGWRK) method was used to spatially downscale O3 remote sensing products (10 km × 10 km). Downscaling factors were selected from meteorological factors and vegetation, aerosol optical thickness (AOD), and air pollutant emission inventory data. Spatial heterogeneity and scale differences among the factors were considered and compared via multiple regression kriging (MLRK) and geographically weighted regression kriging (GWRK) to generate 1-km annual and seasonal O3 remote sensing products. The results showed that I) the downscaling accuracy of each model can be expressed as MGWRK > GWRK > MLRK; the local downscaling model yields data that are more consistent with the actual spatial distribution of O3 after considering the spatial heterogeneity of the influencing factors; and the downscaled annual and seasonal data exhibit satisfactory spatial texture characteristics and consistency with the original spatial distribution of O3, while the distribution boundary problem of image elements is eliminated. II) Nitrogen oxide (NOx) and volatile organic compound emissions and temperature exhibit strong positive correlations with O3, while wind speed, humidity, the normalized difference vegetation index, and AOD indicate weak positive correlations with O3. Moreover, precipitation exhibits a weak negative correlation with O3. III) The coefficient of determination (R2) of the 1-km resolution annual O3 concentration data after downscaling based on the MGWRK model reaches 0.93, while the RRMSE and MAE values are only 3% and 1.86, respectively, with a coefficient of variation of 9.55%; the downscaling accuracy of the seasonal O3 concentration data is higher in summer and winter than during the other seasons, with R2 greater than 0.85, further confirming the spatial and temporal downscaling advantages of the MGWRK model for O3 in the Chang-Zhu-Tan city cluster. This further corroborates the feasibility of the MGWRK model for spatial and temporal O3 downscaling in the Chang-Zhu-Tan urban area.
Near-surface ozone (O3) has become a major pollutant in some urban areas in recent years, especially in spring and summer (Liu et al., 2021). It is an important secondary pollutant that is mainly produced by a series of photochemical reactions that occur between nitrogen oxides (NOx) and volatile organic compounds (VOCs) that enter the atmosphere in the presence of sunlight (Chen et al., 2022). Transient or prolonged exposure to high ozone concentrations can cause asthma and respiratory and cardiovascular diseases, which can be fatal for certain populations (e.g., pregnant women, infants, and children) (Chan et al., 2006; Li et al., 2021). The 2030 agenda of the Sustainable Development Goals released by the United Nations clearly states that by 2030, proactive and effective measures should be developed to significantly reduce the number of deaths and illnesses caused by air pollution, including O3 (United Nations, 2015).
Fine-scale information on the spatial distribution of near-surface ozone is needed to implement precise pollution prevention and control measures. Currently, ozone monitoring based on remote sensing satellites can compensate for the shortcomings of traditional air pollution monitoring stations, but the spatial resolution of existing ozone remote sensing product data or inverse ozone data is not fine enough to support studies on small regional scales (Yang et al., 2021). Downscaling techniques can effectively address this shortcoming, and statistical regression-based downscaling techniques have been increasingly used to obtain high-spatial resolution data. The statistical regression downscaling method assumes that the scale of the relationship remains constant; the fitted relationship between O3 and various influencing factors does not change with the scale of remote sensing images (Zhan et al., 2010). Specifically, the fitted relationship between O3 and the considered factors obtained at a low resolution can be used to estimate the O3 concentration. Notably, deep learning-based downscaling methods are the latest techniques for downscaling lower-resolution images to match higher-resolution images. Compared with statistical regression downscaling methods, deep learning-based methods can approximate any relationship given two datasets, namely, they can effectively learn the relationships between high- and low-resolution pairs of images (Lanaras et al., 2018; Yang WM. et al., 2019a; Mukherjee and Liu, 2021). However, in some cases, it is difficult to obtain two datasets with different resolutions, and the statistical regression downscaling method becomes more practical.
Currently, downscaling methods based on statistical regression are widely applied to surface temperature (Yang C. et al., 2019b; Wu et al., 2019; Zang et al., 2020), precipitation (Gu et al., 2009; Tian et al., 2011), soil moisture (Sun et al., 2020), aerosol optical thickness (AOD) (Zhang et al., 2022), and other data. According to the different datasets used for regression modeling, downscaling methods can be divided into global and local models. Global models apply as many datasets as possible to build a global model for spatial downscaling analysis. For example, Fan et al. (2021) established a TRMM satellite precipitation downscaling model based on multiple linear regression (MLR) and obtained a high-resolution and high-precision satellite ground fusion precipitation product. Zhu JH. et al. (2021a) constructed a random forest downscaling model to achieve multilevel resolution surface temperature data. Wang et al. (2018) applied artificial neural networks to surface temperature downscaling and found that the results were more accurate than those derived from the traditional hierarchical linear regression downscaling method.
Researchers are increasingly reporting that the local characteristics of variables are critical to obtain more accurate relationships among spatial variables, and the spatial heterogeneity of the explanatory variables should be considered in downscaling analysis (Chen et al., 2014; Zhou et al., 2016). Notably, a local model based on part of the dataset can be utilized to describe the spatially varying relationships among the different variables. Duan and Li (2016) proposed a new downscaling algorithm based on geographically weighted regression that considers the geospatial variability among variables; the results showed that its performance was superior to that of the Ts HARP global model, significantly improving the spatial resolution of ground surface temperature data. Zhu XM. et al. (2021b) introduced multiscale geographically weighted regression to consider the scale differences among the covariate factors of the surface temperature mechanism; relatively accurate results were obtained.
Although local models that consider spatial heterogeneity are more effective than global models for downscaling spatial data, the occurrence of spatial dependency among spatial data suggests that incorporating spatial dependency into local models may further improve their downscaling accuracy. Actually, local models with integrated geostatistical methods based on spatial dependency (such as kriging) have exhibited outstanding performance in spatial modeling and prediction. For instance, Kumar et al. (2012) developed a geographically weighted regression kriging (GWRK) model to study the relationship between environmental variables and soil organic carbon stocks in Pennsylvania, United States, thus improving the accuracy of soil organic carbon stock estimation. However, existing research on downscaling has mainly focused on climatic and natural factors (surface temperature, precipitation, and biomass), whereas few studies have focused on the application of downscaling techniques to address air pollutant data. In addition, the ozone pollution state in small and medium urban areas is often neglected; larger urban areas with rapid economic development and more serious air pollution are more closely monitored.
Consequently, in this study, the Chang-Zhu-Tan urban agglomeration is selected as the study area, and a downscaling model for ozone remote sensing products is proposed based on the multiscale geographically weighted regression kriging (MGWRK) method. China High Air Pollutants (CHAP) ozone remote sensing data are selected as the data source, and ozone precursor emissions and their meteorological factors are used as covariates to achieve a downscaled ozone remote sensing product from 10 km × 10 km–1 km × 1 km based on the relational scale invariance.
The urban agglomeration of Changsha, Zhuzhou, and Xiangtan is the core area of economic development and urbanization in Hunan province (Figure 1), with a total area of approximately 28,087 km2. This area is a key region within the national air pollution prevention and control system, with a dense population, rapid industrialization and urbanization, and a wide range of pollution sources, with the air quality index ranking at the bottom of Hunan province (Wang et al., 2017).
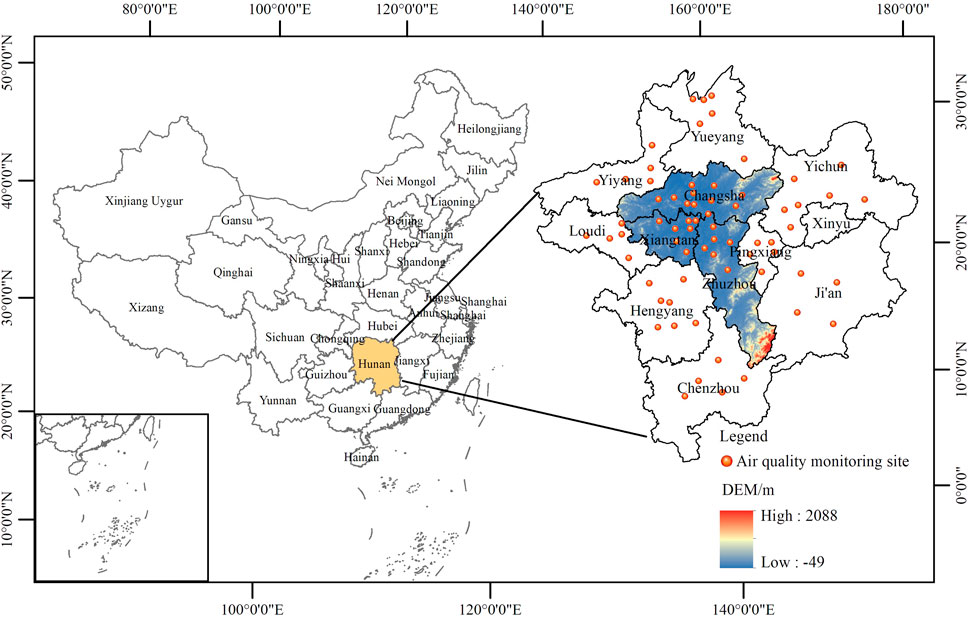
FIGURE 1. Location of the study area.
Remote sensing-derived O3 concentration data were acquired from the CHAP dataset with a spatial resolution of 10 km × 10 km (https://weijingrs.github.io/product.html). The data were generated from numerous ground-based observations, satellite remote sensing products of the NASA Aura/OMI satellite sensor, atmospheric reanalysis data, and model simulations. Data from 68 air quality monitoring stations in and around the Chang-Zhu-Tan urban agglomeration were obtained from the national real-time air quality release platform (http://106.37.208.233:20035/) of the China General Environmental Monitoring Station, and the annual and seasonal average concentrations were obtained from hourly concentration data. The average and standard deviation of the 2017 annual data are 84.13 and 7.47 μg/m3, respectively.
The factors used in this study include meteorological factors (annual mean temperature, annual precipitation, annual mean wind speed, and annual mean relative humidity), the normalized difference vegetation index (NDVI), pollutant emissions (NOx and VOCs), and AOD. Among them, meteorological and AOD data were obtained from the National Earth System Science Data Center (http://www.geodata.cn/myspace/userInfo/), which were extracted and collated by raster calculation to obtain an annual average dataset with a spatial resolution of 1 km × 1 km. Vegetation index data were obtained from the China Resources Science and Data Centre (https://www.resdc.cn/), with a spatial resolution of 1 km × 1 km. Pollutant emission data with a spatial resolution of 10 km × 10 km were retrieved from the Multiscale Emission Inventory of China (http://meicmodel.org/), covering five types of anthropogenic emission sources, such as power, industry, civil, transportation, and agriculture, which are widely used in pollution cause analysis, air quality forecasting, and early warning development. It is difficult to obtain complete datasets over multiple years. For example, the most recent publication year for the pollutant emission data is 2017; thus, to ensure data uniformity over time, 2017 was chosen as the downscaling year in this study. In addition, basic geographic information data were obtained from the National Geographic Information Resources Catalogue Service System (https://www.webmap.cn/). The spatial distribution of the raw data is shown in Figure 2.
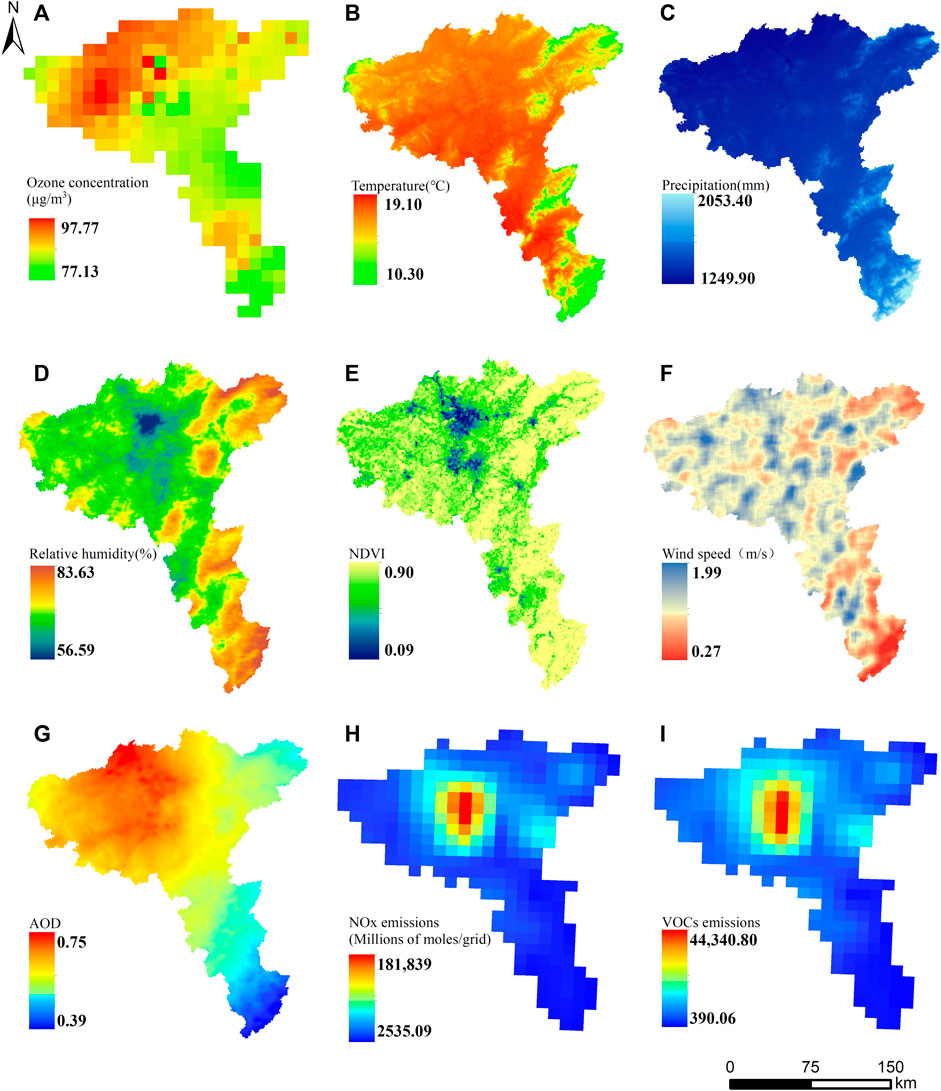
FIGURE 2. Spatial distribution map of the influencing factors: (A) ozone concentration, (B) temperature, (C) precipitation, (D) relative humidity, (E) NDVI, (F) wind speed, (G) AOD, (H) NOx emission, and (I) VOC emission.
Multiple linear regression kriging (MLRK) is a combination of MLR and kriging (Jin et al., 2016) that uses linear regression obtained by the ordinary least squares (OLS) method and can be optimized for kriging methods. A kriging estimation analysis is performed on the residuals generated from MLR prediction. y(
where
GWRK compensates for the significant limitations of global regression models or MLR, which cannot capture spatially non-smooth relationships between variables. These types of relationships are captured by embedding the spatial location information of multiple variables. This method allows the relationship between variables to vary with the geographic location by creating local regression equations at each point within the spatial range and can reflect neglected local characteristics (Yang et al., 2018a; Yang et al., 2023). However, in the GWR model, the determined optimal effective bandwidth is shared by all independent variables, while the model does not consider the variability in the spatial scales of the relationships between the different environmental covariates and dependent variables. In response to the limitations of the GWR model, Fotheringham et al. (2017) proposed a MGWR model that eliminates the single bandwidth assumption and indicates that multiple scales more closely match the spatial processes of the actual state; it can be expressed as follows:
where
Based on Eq. 1, the MGWRK model can be expressed as follows:
where the estimated value can be obtained by the combination of the MGWR model and MLRK method.
While the O3 remote sensing data products area is characterized by insufficient information at low spatial resolutions in the region, spatial downscaling methods can be used to convert large-scale, low-resolution data into small-scale, high-resolution data. In this study, spatial downscaling of the O3 product is based on the MGWRK model; the detailed downscaling procedure is described as follows:
(1) The downscaled factor remote sensing data of different spatial resolutions are unified in the coordinate system and interpolated to spatial resolutions of 10 km × 10 km and 1 km × 1 km by bilinear interpolation. The auxiliary data at a spatial resolution of 1 km × 1 km, such as NDVI and DEW, are converted to those at a spatial resolution of 10 km × 10 km by upscaling methods, such as average aggregation.
(2) With the use of the low-resolution O3 remote sensing data at the unified scale as the dependent variable and the downscaling factors as independent variables, the MGWR model is used to construct multiscale spatially non-stationary functional relationships between O3 and the downscaling factors at a 10-km resolution, and the constant terms and regression coefficients of all variables and residuals are obtained from the regression model.
where O3 (10 km × 10 km) denotes the O3 data estimated as a function at a 10-km resolution; f() denotes the scale-converted MLRK, GWRK, and MGWR functions; and NDVI (10 km × 10 km), AOD (10 km × 10 km), and pre (10 km × 10 km) denote the NDVI, aerosol optical thickness, and precipitation factors, respectively, uniformly sampled to a 10-km resolution.
(3) The above model results are rasterized using the kriging method, and the regression coefficients, constant terms, and residuals of all downscaling factors are resampled to a spatial resolution of 1 km × 1 km. Notably, the established relationships from the 10-km data are resampled via bilinear interpolation to generate corresponding relationships at a spatial resolution of 1 km × 1 km.
(4) Based on the above estimated relationships at a spatial resolution of 1 km × 1 km, each downscaled factor coefficient is multiplied by the explanatory variable corresponding to its resolution and added to the constant term (1 km × 1 km) to obtain predicted O3 values (1 km × 1 km).
(5) Finally, the high-resolution residuals ΔO3 (1 km × 1 km) are added to the predicted O3 values to obtain the final 1-km high-resolution O3 values.
The coefficient of determination (R2), mean absolute deviation (MAE), and relative root mean square error (RRMSE) indicators are introduced to verify the accuracy of the downscaling results. R2, MAE, and RRMSE capture the degree of goodness-of-fit and data deviation between the observational values and the downscaled values of the model. These metrics can be calculated as follows:
where
The CHAP dataset has been widely used to study the effects of air pollution on the environment, health, and economy, but these data are all targeted at large scales. To ensure the feasibility and accuracy of the ozone remote sensing dataset in the Chang-Zhu-Tan urban agglomeration and the reliability of the downscaled results, the applicability of the CHAP data was first analyzed. The ozone concentration at air quality monitoring stations in and around the Chang-Zhu-Tan urban agglomeration in 2017 was used as the dependent variable, and the corresponding annual-scale CHAP ozone data were used as the independent variable. Figure 3 shows that the linear regression coefficient is 0.96, the correlation coefficient at the 99% confidence level is higher than 0.93, and the RRMSE is 3%. These results indicate that the CHAP remote sensing product can provide high data quality in the Chang-Zhu-Tan urban agglomeration.
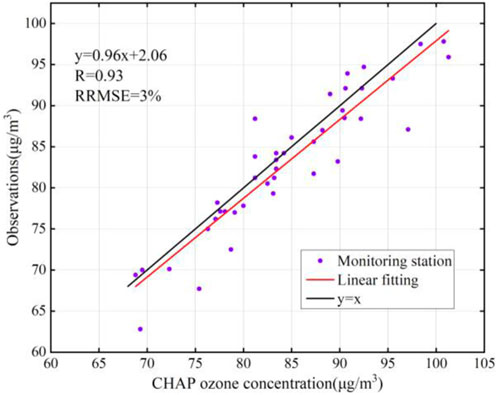
FIGURE 3. Scatter plot of the annual average measured ozone concentrations and CHAP values at the sites.
The multicollinearity of factors can affect the regression results. In this study, the variance inflation factor (VIF) combined with correlation analysis (Pearson) was used to explore the multicollinearity of the downscaling factors; the results are listed in Table 1. All VIF values of precipitation, wind speed, AOD, NDVI, NOx, VOCs, humidity, and temperature are less than 5, indicating the weakness of multicollinearity among the considered factors. The Pearson correlation results in Table 2 show that all eight factors are significantly correlated at the 0.05 level, with VOCs, NOx emissions, and temperature showing strong positive correlations with ozone, while wind speed shows a weak positive correlation with ozone. The increase in precursor emissions directly exacerbates photochemical reactions, leading to higher ozone concentrations; the increase in solar radiation intensity with an increase in temperature accelerates photochemical reactions, leading to higher O3 concentrations (Song et al., 2022). Wind imposes a certain dilution and transport effect on pollutants, with the average annual wind speed in the Chang-Zhu-Tan urban agglomeration ranging from 0.74 to 1.65 m/s. A low wind speed (2 m/s) has been shown to promote the mixing of pollutants (Xu et al., 2023), leading to the production of precursors such as NOx and VOCs and promoting photochemical reactions (Requia et al., 2019), resulting in higher O3 concentrations. The negative correlation between precipitation and ozone may be attributed to the scouring effect of precipitation on O3 and the lower solar radiation when precipitation is high, which, to some extent, positively affects temperature reduction (Huang et al., 2020).
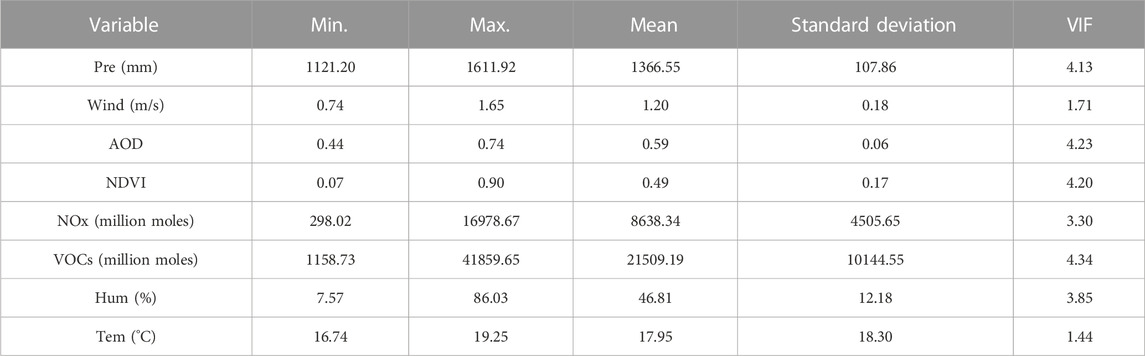
TABLE 1. Downscaling factors and collinearity statistics.
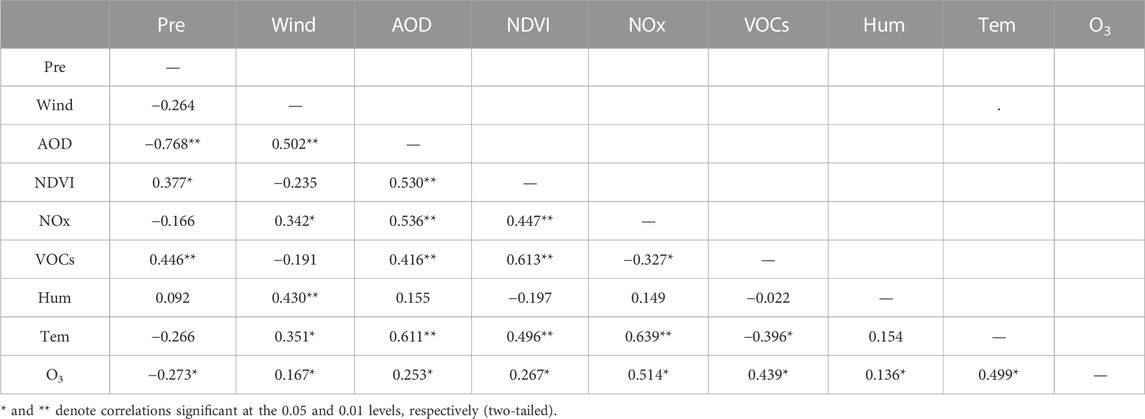
TABLE 2. Correlation coefficient matrix of the impact factors.
The downscaled CHAP ozone remote sensing data (1 km × 1 km) are shown in Figures 4B–D. After the application of the different downscaling models, the spatial resolution is greatly improved, and the spatial distribution of the ozone concentration is consistent with that of the original dataset overall as shown in Figure 4A. The spatiaFanl resolution is enhanced, and more detailed spatial information is obtained. Higher ozone concentrations in the Chang-Zhu-Tan urban agglomeration are concentrated in the central region. High values are distributed in the middle, and low values are distributed in the surrounding areas. Furthermore, the overall concentrations in Changsha and Xiangtan are higher than those in Zhuzhou, resulting in higher ozone concentrations.
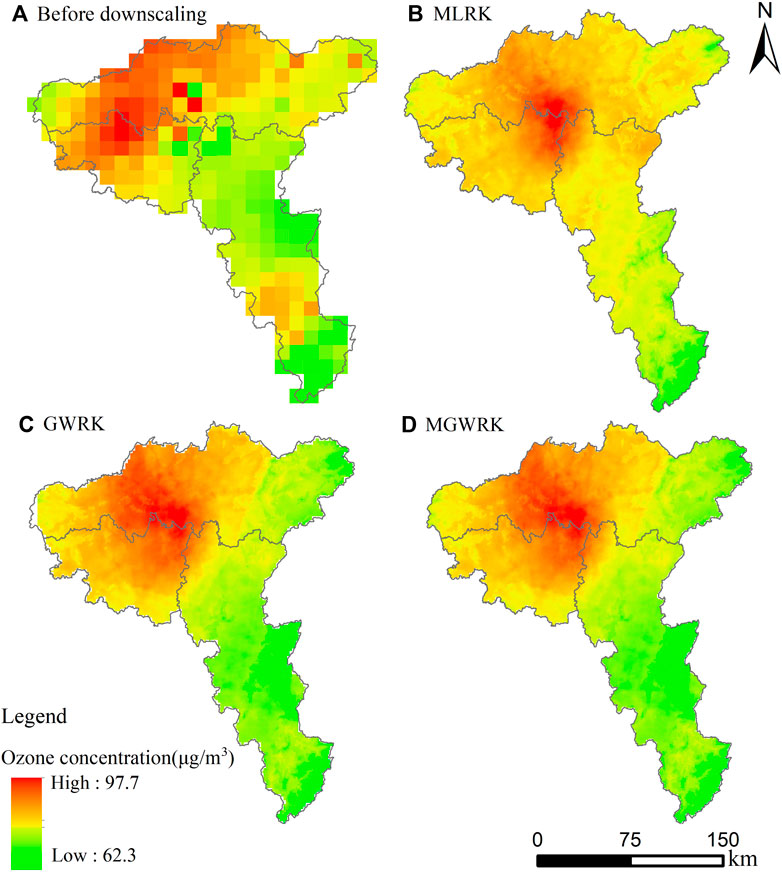
FIGURE 4. Comparison of the results of the three downscaling method. (A) before downscaling; (B) MLRK; (C) GWRK; (D) MGWRK.
Performance validation of each model was implemented at a spatial resolution of 1 km × 1 km by using the data from 68 stations. The scatter plots in Figure 5 show that the downscaling accuracy of each model can be expressed as MGWRK > GWRK > MLRK, the downscaling accuracy of the MGWRK and GWRK models is improved after considering the local spatial heterogeneity of the factors, and the MGWRK model performs better than the GWRK model, indicating that the scale difference between the different factors influences the downscaling results. The validation results showed that 93%, 81%, and 78% of the variance from the observations could be accounted for by the predictions from the MGWRK, GWRK, and MLRK models, respectively, indicating that the models provide a certain reliability and stability. The downscaling results of the MGWRK model were the best, with RRMSE and MAE values of only 3% and 1.86, respectively, and the downscaled O3 concentrations ranged from 64.1 to 95.6 μg/m3, with a mean value of 82.9 μg/m3 and a coefficient of variation of 9.55%. The coefficient of variation was 9.55%, which better conforms with the statistical characteristics of the original CHAP ozone remote sensing data and indicates that the accuracy of the original data is basically retained.
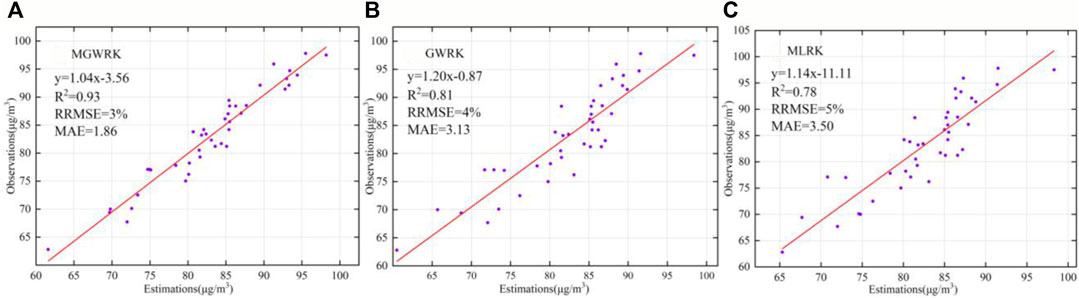
FIGURE 5. Scatter plot of the downscaling validation results. (A) MGWRK; (B) GWRK; (C) MLRK.
First, existing ozone remote sensing datasets are mostly annual-scale data or spatially interpolated data from ground-based air quality monitoring stations, and monthly and seasonal-scale datasets are lacking. Second, due to the inhomogeneous spatial distribution of air quality monitoring stations, spatially interpolated data often exhibit large errors. Therefore, based on CHAP ozone remote sensing products with a 10 km × 10 km spatial resolution at the seasonal scale, in this research, the MGWRK method was used to generate a seasonal-scale O3 dataset, and the remaining six downscaling factors (precipitation, temperature, wind speed, relative humidity, AOD, and NDVI) were used for downscaling due to the lack of monthly scale NOx and VOC data in the 2017 MEIC emission inventory.
Figures 6, 7 show the downscaling results and scatter plots, respectively, of the MGWRK-based ozone concentrations for all seasons compared to the station observations. The mean absolute error (<8 μg/m3) indicates that the downscaling accuracy of the MGWRK model is high in all seasons, especially in summer, where R2 is the highest (0.95). The MAE value is 4.84, indicating that the higher the ozone concentrations, the higher the downscaling accuracy and the better the downscaling effect. The spatial distribution of the ozone concentrations in spring and summer is higher than that of the ozone concentration in autumn and winter, with high values concentrated in the central parts of the Chang-Zhu-Tan urban agglomeration, especially in the districts of Yuelu, Tianxin, Yuhua, and Yuhu. The drier weather and higher solar radiation in spring and summer in Hunan province accelerate photochemical reactions and, thus, promote O3 accumulation, which is consistent with the work of Liu et al. (2022), showing that O3 exhibits notable seasonal characteristics (Lin and Guo, 2022); moreover, seasonal-scale O3 remote sensing data can provide reliable data to explore its spatial variability and pollution prevention and control.
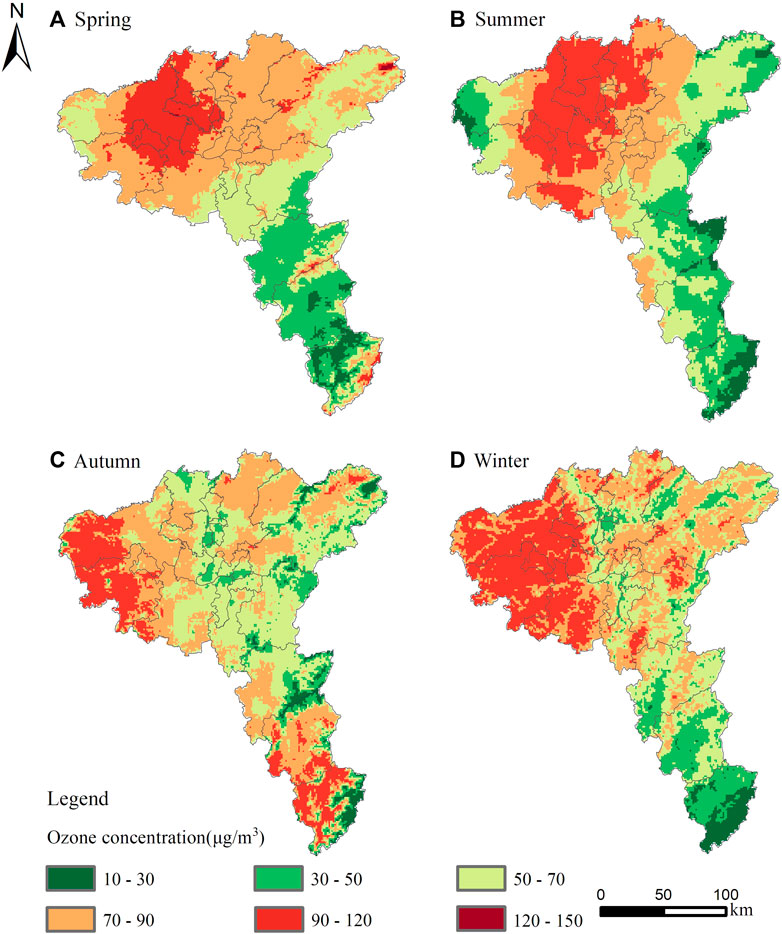
FIGURE 6. Results of MGWRK-based downscaling of the O3 concentrations during the four seasons. (A) Spring; (B) Summer; (C) Autumn; (D) Winter.
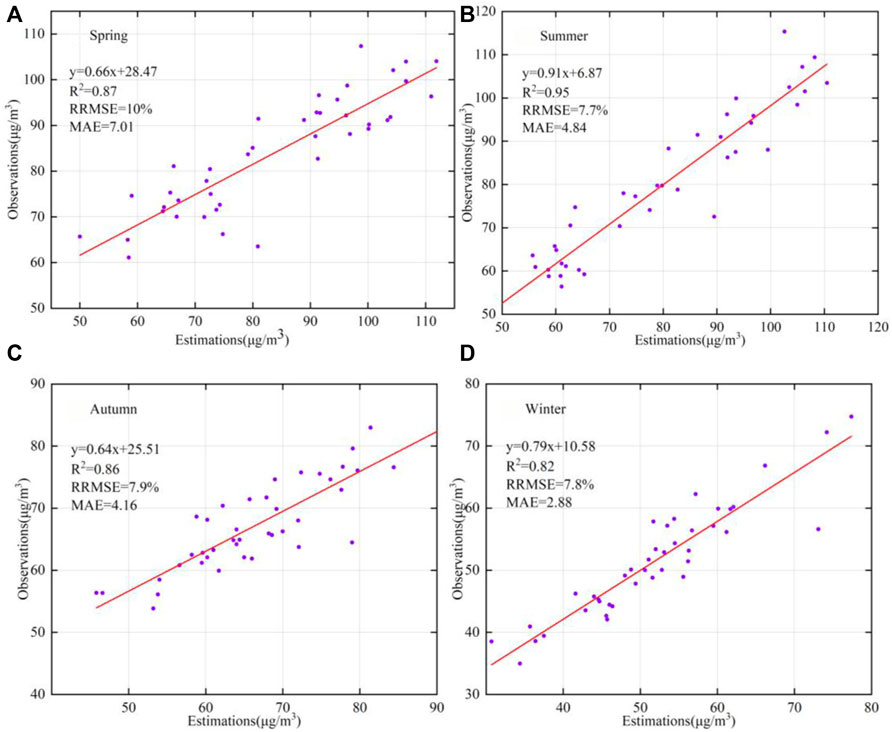
FIGURE 7. Scatter plots and accuracy of the downscaled seasonal ozone concentrations against the station observations. (A) Spring; (B) Summer; (C) Autumn; (D) Winter.
Currently, downscaling is increasingly applied in the field of air pollution analysis; examples include the downscaling of AOD products (Li et al., 2020; Liang et al., 2022), estimation of the PM2.5 concentration (Zhang and Pan, 2020), and generation of long-term hourly 0.25° global PM2.5 datasets (Valencia et al., 2022). Existing statistical downscaling methods are used in the downscaling of O3 remote sensing products. However, traditional statistical downscaling methods assume that the relationship between the dependent variable and the downscaling factor remains spatially constant (Zhan et al., 2018), ignoring the spatial heterogeneity in environmental variables and the variability of different environmental variables across different scales. Therefore, in this study, the MGWR method was proposed for the spatial downscaling of satellite-based ozone datasets by combining this method with kriging.
Compared with the MLRK model, the GWRK and MGWRK methods can capture the spatially varying relationships between the O3 concentration and its associated variables. Notably, if spatial heterogeneity exists among the different variables, the MLRK and GWRK methods can yield better fitted results than the MLRK model; conversely, they cannot provide accurate prediction results. Furthermore, compared with the GWRK model, the MGWRK method can reveal multiple scale effects of different independent variables on the O3 concentration. Moreover, if the scale effect does not exist, the prediction accuracy of the MGWR model may be similar to that of the GWRK model. The experimental results for the Chang-Zhu-Tan urban agglomeration, China, show that the downscaling accuracy of the MGWRK and GWRK models is higher than that of global regression (MLRK). This indicates that spatially varying relationships can be identified between the O3 concentration and its associated variables in the case study. The MGWRK method achieves the best fitting accuracy on both annual and seasonal scales, which demonstrates that the consideration of multiple scale effects can more effectively capture the complex relationships in downscaling O3 datasets.
Actually, both MGWR and the other two models assume linear relationships. This assumption determines their intrinsic inadequacy in characterizing complex non-linear relationships (Fotheringham et al., 2017). Notably, the MGWR model cannot effectively describe complex non-linear relationships among spatial variables. In this case, machine learning or deep learning is an alternative technique to address non-linear relationships. However, machine learning and deep learning usually require samples with independent and identical distributions, and they cannot manage spatial data with scale effects and spatial heterogeneity well (Yang et al., 2018b). Moreover, most machine learning models or deep learning models require many samples in the training process. Therefore, statistical regression downscaling methods, such as the MGWR model, cannot be replaced. The experimental results also prove that the statistical regression downscaling method can achieve a relatively satisfactory accuracy and is practical.
However, there are still certain uncertainties in the O3 dataset that may lead to errors. First, the resampling of environmental variables from a higher to a lower spatial resolution may lead to smoothing effects. In this study, a downscaling model is constructed based on their relationship at the 10-km scale. When the environmental variables are resampled, bilinear interpolation replaces the value of each environmental variable with the average value of the surrounding neighboring pixels, thus losing some characteristic information of the variables and producing a relative smoothing effect. Second, a total of 68 air quality monitoring stations were used to validate the downscaling results in this study, and the sparsely distributed validation data may have affected the accuracy of the estimates. Finally, other environmental variables are neglected. There are other environmental variables that may also affect the spatial distribution of O3, such as insolation, solar radiation, and DEM. In this study, only precipitation, humidity, temperature, wind speed, NDVI, AOD, and emission inventory data (NOX and VOCs) are considered, which may lead to uncertainty in the downscaling results.
In this research, the MGWRK model was proposed for the spatial downscaling of satellite-based ozone datasets. This method considers the spatial dependency of variables and can be used to account for the spatially varying relationships between the O3 concentration and its associated variables at different spatial scales. The method was assessed for scaling down the ozone remote sensing products in 2017 from a spatial resolution of 10 km × 10 km–1 km × 1 km in the Chang-Zhu-Tan urban agglomeration via comparisons with MGWR and MLRK. The MGWRK model achieved the most accurate predictions of ozone. Moreover, this study demonstrated that the MGWRK model, with the consideration of spatial effects, captured the complex relationships between the ozone concentration and its associated variables. This downscaling method can also be used for spatial downscaling of other spatial data products. Additionally, the derived 1-km spatial resolution annual and seasonal ozone remote sensing data products provide useful information for other relevant studies of the area, such as environmental and public health and air pollution prevention and control.
The original contributions presented in the study are included in the article/Supplementary Material; further inquiries can be directed to the corresponding author.
SC: Conceptualization, Formal Analysis, Supervision, Validation, Writing–original draft, Writing–review and editing, Resources. GZ: Data curation, Methodology, Software, Conceptualization, Validation, Writing–original draft. XY: Funding acquisition, Project administration, Supervision, Validation, Writing–review and editing, Writing–original draft. BL: Writing–review and editing.
The authors declare financial support was received for the research, authorship, and/or publication of this article. This research was supported by grants from the Natural Science Foundation of Hunan Province (2022JJ60015 and 2022JJ40585), the Scientific Research Project of the Education Department of Hunan Province (22B0015), and the Scientific Research Project of the Natural Resources Department of Hunan Province (2013-17, 2014-12, 2015-09, and 2017-15).
Author GZ is employed by Xinwangda Power Technology Co., Ltd.
The remaining authors declare that the research was conducted in the absence of any commercial or financial relationships that could be construed as a potential conflict of interest.
All claims expressed in this article are solely those of the authors and do not necessarily represent those of their affiliated organizations, or those of the publisher, the editors, and the reviewers. Any product that may be evaluated in this article, or claim that may be made by its manufacturer, is not guaranteed or endorsed by the publisher.
Chan, C. C., Chuang, K. J., Chien, L. C., Chen, W. J., and Chang, W. T. (2006). Urban air pollution and emergency admissions for cerebrovascular diseases in Taipei, Taiwan. Eur. heart J. 27 (10), 1238–1244. doi:10.1093/eurheartj/ehi835
Chen, X., Li, W., Chen, J., Zhan, W., and Rao, Y. (2014). A simple error estimation method for linear-regression-based thermal sharpening techniques with the consideration of scale difference. Geo-spatial Inf. Sci. 17 (1), 54–59. doi:10.1080/10095020.2014.889546
Chen, Y. L., Li, H. C., Karimian, H., Li, M., Fan, Q., and Xu, Z. (2022). Spatio-temporal variation of ozone pollution risk and its influencing factors in China based on Geodetector and Geospatial models. Chemosphere 302, 134843. doi:10.1016/j.chemosphere.2022.134843
Duan, S. B., and Li, Z. L. (2016). Spatial downscaling of MODIS land surface temperatures using geographically weighted regression: case study in northern China. IEEE Trans. Geoscience Remote Sens. 54 (11), 6458–6469. doi:10.1109/tgrs.2016.2585198
Fan, T. Y., Zhang, X., Huang, B., et al. (2021). Downscaling of TRMM satellite precipitation products and its application in hydrological simulation of Xiangjiang River Basin. Trans. Chin. Soc. Agric. Eng. Trans. CSAE) 37 (15), 179–188. doi:10.11975/j.issn.1002-6819.2021.15.022
Fotheringham, A. S., Yang, W., and Kang, W. (2017). Multiscale geographically weighted regression (MGWR). Ann. Am. Assoc. Geogr. 107 (6), 1247–1265. doi:10.1080/24694452.2017.1352480
Gu, W. Z., Chen, L. J., Zhang, P. Q., et al. (2009). Downscaling precipitation prediction in China based on optimization information extracted from monthly dynamic extended range forecast. Acta Meteorol. Sin. 67 (2), 280–287. doi:10.11676/qxxb2009.028
Huang, X. G., Shao, T. J., Zhao, J. B., Cao, J. J., and Lü, X. H. (2020). Analysis of influencing factors of O3 concentration in Xi'an city based on GAM model. Environ. Sci. 41 (4), 1535–1543. doi:10.13227/j.hjkx.201906067
Jin, Q. T., Zhang, J. T., Shi, M., and Huang, J. (2016). Estimating loess plateau average annual precipitation with multiple linear regression kriging and geographically weighted regression kriging. Water 8 (6), 266. doi:10.3390/w8060266
Kumar, S., Lal, R., and Liu, D. (2012). A geographically weighted regression kriging approach for mapping soil organic carbon stock. Geoderma 189, 627–634. doi:10.1016/j.geoderma.2012.05.022
Lanaras, C., Bioucas-Dias, J., Galliani, S., Baltsavias, E., and Schindler, K. (2018). Super-resolution of Sentinel-2 images: learning a globally applicable deep neural network. ISPRS J. Photogrammetry Remote Sens. 146, 305–319. doi:10.1016/j.isprsjprs.2018.09.018
Li, L., Franklin, M., Girguis, M., Lurmann, F., Wu, J., Pavlovic, N., et al. (2020). Spatiotemporal imputation of MAIAC AOD using deep learning with downscaling. Remote Sens. Environ. 237, 111584. doi:10.1016/j.rse.2019.111584
Li, M., Dong, H., Wang, B., Zhao, W., Zare Sakhvidi, M. J., Li, L., et al. (2021). Association between ambient ozone pollution and mortality from a spectrum of causes in Guangzhou, China. Sci. Total Environ. 754, 142110. doi:10.1016/j.scitotenv.2020.142110
Liang, Y., Zhou, B., Feng, H. H., and Liu, N. (2022). Seasonal deviation correction enhanced BGIM downscaling algorithm for remote sensing AOD products. J. Remote Sens. 26 (8), 1602–1613. doi:10.11834/jrs.20219351
Lin, W. P., and Guo, X. T. (2022). Analysis of temporal and spatial distribution characteristics of Ozone in Chinese urban agglomerations. Chin. Environ. Sci. 42 (6), 2481–2494. doi:10.19674/j.cnki.issn1000-6923.20220207.002
Liu, C., Zhang, L., Wen, Y., and Shi, K. (2021). Sensitivity analysis of O3 formation to its precursors-Multifractal approach. Atmos. Environ. 251 (21), 118275. doi:10.1016/j.atmosenv.2021.118275
Liu, Y. Y., Yang, L. F., Xie, D. P., Ze-Ren, Y. Z., Huang, Z. J., Yang, J., et al. (2022). Analysis of basic characteristics of ozone pollution in Hunan Province and identification of main controlling factors for long-term trend changes. Environ. Sci. 43 (3), 1246–1255. doi:10.13227/j.hjkx.202104017
Mukherjee, R., and Liu, D. S. (2021). Downscaling MODIS spectral bands using deep learning. GIScience Remote Sens. 58 (8), 1300–1315. doi:10.1080/15481603.2021.1984129
Requia, W. J., Jhun, I., Coull, B. A., and Koutrakis, P. (2019). Climate impact on ambient PM2.5 elemental concentration in the United States: a trend analysis over the last 30 years. Environ. Int. 131, 104888. doi:10.1016/j.envint.2019.05.082
Song, M. D., Feng, M., Li, X., et al. (2022). Causes and source analysis of heavy ozone pollution in Chengdu. Chin. Environ. Sci. 42 (3), 1057–1065. doi:10.19674/j.cnki.issn1000-6923.20210923.004
Sun, H., Zhou, B., Zhang, C., Liu, H., and Yang, B. (2020). DSCALE_mod16: a model for disaggregating microwave satellite soil moisture with land surface evapotranspiration products and gridded meteorological data. Remote Sens. 12 (6), 980. doi:10.3390/rs12060980
Tian, P., Tian, K., and Li, J. (2011). Downscaling analysis of future temperature and precipitation in the upper reaches of the Ganjiang River. J. Basic Sci. Eng. S1, 57–67. doi:10.3969/j.issn.1005-0930.2011.s1.007
United Nations, (2015). Transforming our world: the 2030 agenda for sustainable development. https://sustainabledevelopment.un.org/post2015/transformingourworld/publication.
Valencia, V. H., Levin, G., and Ketzel, M. (2022). Downscaling global anthropogenic emissions for high-resolution urban air quality studies. Atmos. Pollut. Res. 13 (10), 101516. doi:10.1016/j.apr.2022.101516
Wang, T., Xue, L., Brimblecombe, P., Lam, Y. F., Li, L., and Zhang, L. (2017). Ozone pollution in China: a review of concentrations, meteorological influences, chemical precursors, and effects. Sci. Total Environ. 575, 1582–1596. doi:10.1016/j.scitotenv.2016.10.081
Wang, Z. H., Qin, Q. M., Sun, Y. H., et al. (2018). Spatial downscaling method of surface temperature based on BP neural network. Remote Sens. Technol. Appl. 33 (5), 793–802. doi:10.11873/j.issn.1004-0323.2018.5.0793
Wu, J., Zhong, B., Tian, S., and Yang, A. (2019). Downscaling of urban land surface temperature based on multi-factor geographically weighted regression. IEEE J. Sel. Top. Appl. Earth Observations Remote Sens. 12 (8), 2897–2911. doi:10.1109/jstars.2019.2919936
Xu, T., Zhang, C., Liu, C., and Hu, Q. (2023). Variability of PM2.5 and O3 concentrations and their driving forces over Chinese megacities during 2018-2020. J. Environ. Sci. 124, 1–10. doi:10.1016/j.jes.2021.10.014
Yang, C., Zhan, Q., Lv, Y., and Liu, H. (2019b). Downscaling land surface temperature using multiscale geographically weighted regression over heterogeneous landscapes in Wuhan, China. IEEE J. Sel. Top. Appl. Earth Observations Remote Sens. 12 (12), 5213–5222. doi:10.1109/jstars.2019.2955551
Yang, W. M., Zhang, X. C., Tian, Y. P., Wang, W., Xue, J. H., and Liao, Q. (2019a). Deep learning for single image super resolution: a brief review. IEEE Trans. Multimedia 21 (12), 3106–3121. doi:10.1109/tmm.2019.2919431
Yang, W. T., Deng, M., Tang, J. B., and Luo, L. (2023). Geographically weighted regression with the integration of machine learning for spatial prediction. J. Geogr. Syst. 25 (2), 213–236. doi:10.1007/s10109-022-00387-5
Yang, W. T., Deng, M., Wang, H., et al. (2018a). Prediction of hourly PM2.5 using a space-time support vector regression model. Atmos. Environ. 181, 12–19. doi:10.1016/j.atmosenv.2018.03.015
Yang, W. T., Deng, M., Xu, F., and Wang, H. (2018b). Prediction of hourly PM2.5 using a space-time support vector regression model. Atmos. Environ. 181, 12–19. doi:10.1016/j.atmosenv.2018.03.015
Yang, X., Zhang, M., and Zhang, B. (2021). A generic model to estimate ozone concentration from landsat 8 satellite data based on ma-chine learning technique. IEEE J. Sel. Top. Appl. Earth Observations Remote Sens. 14, 7938–7947. doi:10.1109/jstars.2021.3101206
Zang, J. L., Guo, Q. Z., Wu, H. H., et al. (2020). Surface temperature downscaling optimization study. Remote Sens. Inf. 35 (4), 78–88. doi:10.3969/j.issn.1000-3177.2020.04.012
Zhan, C., Han, J., Hu, S., Liu, L., and Dong, Y. (2018). Spatial downscaling of GPM annual and monthly precipitation using regression-based algorithms in a mountainous area. Adv. Meteorology 2018, 1–13. doi:10.1155/2018/1506017
Zhan, W., Chen, Y., Zhou, J., Li, J., and Liu, W. (2010). Sharpening thermal imageries: a generalized theoretical framework from an assimilation perspective. IEEE Trans. Geoscience Remote Sens. 49 (2), 773–789. doi:10.1109/tgrs.2010.2060342
Zhang, H. Y., Zou, B., Liu, N., et al. (2022). Downscaling model of satellite AOD products with synergistic improvement of spatial resolution and accuracy. Chin. Environ. Sci. 42 (9), 4033–4042. doi:10.19674/j.cnki.issn1000-6923.20220530.005
Zhang, L., and Pan, J. (2020). Estimation of PM2.5 mass concentrations in Beijing–Tianjin–Hebei region based on geographically weighted regression and spatial downscaling method. J. Indian Soc. Remote Sens. 48, 1691–1703. doi:10.1007/s12524-020-01193-6
Zhou, J., Liu, S., Li, M., Zhan, W., Xu, Z., and Xu, T. (2016). Quantification of the scale effect in downscaling remotely sensed land surface temperature. Remote Sens. 8 (12), 975. doi:10.3390/rs8120975
Zhu, J. H., Zhu, S. Y., Yu, F. C., Zhang, G., and Xu, Y. (2021a). A downscaling method for ERA5 reanalysis land surface temperature over urban and mountain areas. J. Remote Sens. 25 (8), 1778–1791. doi:10.11834/jrs.20211257
Keywords: multiscale geographically weighted regression kriging, spatial downscaling, O3, Chang-Zhu-Tan urban agglomeration, remote sensing
Citation: Cheng S, Zhang G, Yang X and Lei B (2024) A multiscale geographically weighted regression kriging method for spatial downscaling of satellite-based ozone datasets. Front. Environ. Sci. 11:1267752. doi: 10.3389/fenvs.2023.1267752
Received: 27 July 2023; Accepted: 04 December 2023;
Published: 11 January 2024.
Edited by:
Guangxing Wang, Southern Illinois University, United StatesReviewed by:
Shaohua Zhao, Ministry of Ecology and Environment Center for Satellite Application on Ecology and Environment, ChinaCopyright © 2024 Cheng, Zhang, Yang and Lei. This is an open-access article distributed under the terms of the Creative Commons Attribution License (CC BY). The use, distribution or reproduction in other forums is permitted, provided the original author(s) and the copyright owner(s) are credited and that the original publication in this journal is cited, in accordance with accepted academic practice. No use, distribution or reproduction is permitted which does not comply with these terms.
*Correspondence: Xuexi Yang, eWFuZ3h1ZXhpQGNzdS5lZHUuY24=
Disclaimer: All claims expressed in this article are solely those of the authors and do not necessarily represent those of their affiliated organizations, or those of the publisher, the editors and the reviewers. Any product that may be evaluated in this article or claim that may be made by its manufacturer is not guaranteed or endorsed by the publisher.
Research integrity at Frontiers
Learn more about the work of our research integrity team to safeguard the quality of each article we publish.