 Bo Liu1
 Haodong Chang
 Yipeng Zhao
94% of researchers rate our articles as excellent or good
Learn more about the work of our research integrity team to safeguard the quality of each article we publish.
Find out more
ORIGINAL RESEARCH article
Front. Environ. Sci., 10 October 2023
Sec. Environmental Economics and Management
Volume 11 - 2023 | https://doi.org/10.3389/fenvs.2023.1257855
This article is part of the Research TopicLow-Carbon Transformation for Sustainable DevelopmentView all 14 articles
Introduction: Industrial green and low-carbon transformation is the key to improve economic development and necessary process to achieve the goal of the carbon peaking and carbon neutrality. Few studies have been done on the decomposition of carbon emission factors in industries and sub-industries and the impact of green and low-carbon transformation about carbon emission in each industry quantitatively. However, the study of industries and sub-industries can comprehensively analyze the development path of green and low-carbon transformation from a more detailed perspective, and provide scientific reasons for the optimization of industrial structure and energy structure.
Methods: The extended Kaya identity for industrial carbon emission is constructed to obtain four factors influencing industrial carbon emission: economic output effect, industrial structure effect, energy intensity effect, carbon consumption intensity in this paper. Then, the LMDI decomposition method is combined with the above identity to innovatively obtain the contribution value of carbon emissions from the perspective of overall, industrial sector and tertiary industry. Then, based on the results of factor decomposition, a multi-index scenario prediction model is constructed. On this basis, the extreme learning machine model optimized by particle swarm optimization (PSO-ELM) was used to predict the influence of the changes in the driving factors on the reduction of industrial carbon emissions. By setting the baseline and industrial green and low-carbon transformation scenarios, it is predicted that industrial carbon emission in Sichuan Province.
Results and discussion: (1) Economic output effect always promotes the growth of industrial carbon emissions, and with the adjustment of industrial structure and energy structure, the other three factors begin to restrain the growth of carbon emissions. (2) Scenario prediction shows that without considering the economic costs of transformation, improving carbon emission reduction efficiency can be obtained through accelerating the rate of change of industrial structure of the secondary and tertiary industries, increasing the proportion of energy intensity reduction, and strengthening the proportion of non-fossil energy use.
Green and low-carbon development is an important proposition to promote the harmonious coexistence between man and nature, and it is also the only way to achieve a balance between economic development and environmental quality (Gu, 2016). In recent years, extreme meteorological disasters have intensified significantly. Facing the pressure of climate crisis, it is in the common interest of all countries in the world to realize economic recovery and cope with climate change through green and low-carbon development (Renhou et al., 2023). The European Union has reached the peak of carbon emissions in 1990. On 15 March 2021, the European Commission published the “Horizon Europe” Strategic Plan 2021–2024, in which the first phase of strategic investment priorities includes climate, energy, industry, transport and other areas, as well as the realization of carbon neutral emerging technologies. In 2020 and 2021, the United Kingdom has released the 10-point Plan for Green Industrial Revolution, the Green Hydrogen Energy Strategy and the Net Zero Strategy. In 2021, France issued the “France 2030 Plan” to promote the development of small nuclear reactors, green hydrogen energy, industrial decarbonization, green cars, low-carbon aircraft and other related technologies and industries in the next 5 years. Since 2021, the United States has actively implemented the Green New Deal, increased investment in clean technology research and development.
At present, China’s energy-intensive industry and carbon-intensive energy are still the main reasons for the increase in carbon emissions (Research Group of National Institute of Development Strategy at Wuhan University, 2022). With the proposal of the “double carbon” goal, the industry needs to carry out green and low-carbon transformation development to reduce industrial carbon emissions. The “14th Five-Year Plan” period is an opportunity for China’s industrial green and low-carbon transformation. In recent years, clean energy and green industries in Sichuan Province have been developing rapidly, which make Sichuan Province play an increasingly significant role in the national industrial landscape. Simultaneously, the industrial and economic development of Sichuan province is similar to that of most inland provinces in China. Though the industrial structure is gradually changing to the “3-2-1” transformation, the balance issues of the industrial structure, energy structure, economic and ecological development have not been resolved. Among them, “1”, “2”, and “3” represent the primary industry, the secondary industry and the tertiary industry respectively (Research Group of National Institute of Development Strategy at Wuhan University, 2022).
In order to achieve the “double carbon” goal as soon as possible, Sichuan issued the “Sichuan Province Carbon Peak Implementation Plan,” “Sichuan Province “14th Five-Year” Comprehensive Work Plan for energy conservation and emission reduction” and other policies. In 2021, Sichuan province released the vision of enabling green and low-carbon industries to achieve the goal of “double carbon,” which pointed out that because industries with large resource consumption, strong environmental pollution, energy-intensive, and less added value have stricter resource and environmental constraints under the carbon neutral vision, the deep transformation of energy-intensive industries will face significant challenges. Therefore, how to achieve green and low-carbon industrial development is an urgent problem for China to solve under the background of “double carbon”.
In essence, the transformation of industrial green and low-carbon is the transformation of industrial structure, energy structure and consumption structure. At the same time, industrial development cannot do without energy supply, and green and sustainable development depends on a clean and sustainable energy structure (Yu et al., 2022). Industrial transformation is the key support to achieve green and low-carbon economic development. Therefore, for clarifying the development mode of industrial green and low-carbon transformation, we must determine the important factors affecting industrial carbon emissions firstly.
Given that there are few analyses on industrial carbon emissions and green and low-carbon development from the perspective of the whole industry, taking Sichuan Province as an example, this study explores the influencing factors of industrial green and low-carbon transformation under the “double carbon” background. This paper innovatively studies the influencing factors of industrial carbon emissions from the carbon emissions of perspective of overall, industrial sectors and three industries. The LMDI decomposition method is used to study the influencing factors of industrial carbon emissions from 2005 to 2019 at different stages and clarify the development paths of green and low-carbon transformation of different industries and industrial sectors. Meanwhile, based on the results of factor decomposition and combined with policy documents, a multi-indicator scenario prediction model is built. The PSO-ELM model combined the scenario prediction indexes is constructed to forecast industrial carbon emissions in Sichuan from 2020 to 2025, verifying whether adjusting the above-mentioned influencing factors can effectively reduce industrial emissions. From the perspective of theoretical value, this study comprehensively analyzes the influencing factor of industry carbon emissions from the perspective of overall, industrial sector and tertiary industry. In addition, this paper expands the application range of PSO-ELM prediction model and provides a new choice for carbon emission prediction model. In terms of practical value, positioning the role of Sichuan Province in realizing the “double carbon” goal in China can not only promote the green and low-carbon transformation of Sichuan Province, but also provide an important reference for the industrial transformation and clean energy utilization of cities in China and international community.
With the Copenhagen Climate Conference was held in 2009, low-carbon concept has gradually become the subject of the development of various industries and fields, and there has been a shift from the traditional carbon-intensive economy to low-carbon economy. Various industries have also begun to explore their transformation paths and development modes. Low-carbon transformation refers to changing the existing economic growth mode based on fossil energy through mechanism innovation, institutional arrangement and technological innovation, and realizing a sustainable economic development form supported by low carbon or zero carbon energy. Aiming at carbon emission reduction, low-carbon transformation takes the optimization of industrial structure, the change of industrial organization, and the transformation of economic development mode and system as an important content. Therefore, the purpose of industrial green low-carbon transformation is to reduce carbon emissions by adjusting industrial structure and energy structure. As a result, it is very important to analyze the influencing factors of industrial green and low-carbon transformation.
Foreign scholars mainly studied the formulation and realization of carbon emission targets, carbon locking issues, etc., and explored low-carbon transition from the perspective of industry. For example, Rietbergen et al. (2015) participated in the goal-setting process of the carbon performance ladder in the Netherlands. They concluded that the current goal-setting process of the carbon performance ladder did not set the optimal carbon emission reduction target. The goal-setting was necessary to consider the minimum performance level of the low-carbon transformation of the industry to maintain the carbon performance ladder as an effective tool for green public procurement. In addition to relevant studies on carbon targets, the issue of carbon locking has also begun to attract attention. Janipour et al. (2020) explored the potential carbon locking in the Dutch chemical industry through semi-structured interviews with 11 key industries. The results showed that low-carbon options have high operating costs, low risk of capital providers and shareholders to accept, and some barriers will inhibit the process of carbon emission reduction. Different from foreign studies, domestic studies focus on exploring the influencing factors of carbon emission change (Yan and Fang, 2015). On this basis, many scholars have studied the historical track and characteristics of carbon emission of China’s manufacturing industry, and explored the low-carbon transformation potential of carbon emission of China’s manufacturing industry based on scenario analysis. In addition, some scholars have explored the impact of industrial structure changes on China’s carbon emissions in recent years from different dimensions. Meanwhile, they have analyzed the carbon emission reduction potential of each industry, some possible hidden carbon emission pathways and their industry share (Dan et al., 2016).
At present, some research mainly use quantitative methods to study the linear or nonlinear impact of green and low-carbon transformation development on economy and green innovation in specific industries such as petrochemical industry, agriculture, financial industry and construction industry (Yuan, 2014; Yue et al., 2022; Haitao et al., 2023; Luo et al., 2023). Others mainly make qualitative analysis on the green development path of an industry under the background of “double carbon” goal (Jiang et al., 2022; Xueting and Junbiao, 2022). Meanwhile, the impact of different industrial development on carbon emissions by decomposition method has gradually become an important research (Hu and Gui, 2017).
Few studies have been done on the decomposition of carbon emission factors in industries and sub-industries and the impact of green and low-carbon transformation about carbon emission in each industry quantitatively, while researches on carbon emissions mainly focuses on a specific industry (Song, 2012; Abul et al., 2015; Mikko et al., 2016; Long and Han, 2020; Yuan et al., 2020) and the measures of energy saving and emission reduction (Liu et al., 2015; Hu J. B. et al., 2021; Song et al., 2022). In reality, the change of a target variable is caused by a variety of factors, but there are big differences between the influences of these factors. Thus, it is necessary to find out the main influencing factors that cause the change of the target variable from the numerous influencing factors, and then analyze the main factors to make the target variable develop in a good direction, so as to put forward targeted policy suggestions. Therefore, it is important to find and decompose the main influencing factors. Factor decomposition models are commonly used in studies of greenhouse gases (Hu and Gui, 2017; Yue, 2021). The LMDI method decomposes several influencing factors that cause changes in a target variable and forms a combination, discerning the magnitude of the influence of each driver on the changes in the target variable. Thus, the LMDI method has become the mainstream method adopted in analyzing energy consumption, GHG emissions, etc. (Ediger and Huvaz, 2006; Hatzigeorgiou et al., 2008; Hu and Gui, 2017). LMDI decomposition method can clarify the role of other factors on the carbon emissions of energy sources such as electricity, coal, and oil (Hwang et al., 2020; Reema, 2022), which can provide a scientific path to improve the energy structure and environmental quality. In addition, in order to optimize the industrial structure and clarify the influencing factors of industrial carbon emissions, LMDI decomposition method is also commonly used to study the influencing factors of carbon emissions in industrial sectors such as industry, tourism, and transportation (Hu and Gui, 2017; Sun et al., 2017; Liu and Ding, 2020; Chen et al., 2022). Meanwhile, the carbon emissions of a country or region are affected by various factors such as economic effects, energy intensity, industrial structure, energy mix, and population changes. Therefore, in order to analyze and quantify the effect of the influencing factors of carbon emissions on a certain country and region, and provide a reference basis for national or regional emission reduction policies, LMDI decomposition method is also widely applied in this field (Dalia and Tomas, 2016; Fu et al., 2019; Dong et al., 2020). Some scholars have also combined LMDI decomposition method with scenario prediction methods to predict the impact of a province or regional driver on carbon emissions, which can provide different development paths for regions to achieve peak carbon neutrality (Yue, 2021; Liu et al., 2022; Wang et al., 2022).
Through analyzing the above literature, although many scholars have made more researches in carbon emission factor decomposition and extended the application of LMDI decomposition method and Kaya identity, there are still some unexplored directions. At present, most studies mainly focus on the decomposition of a certain industry, an industry or a factor that affects carbon emissions, but t few studies are involved in the decomposition of carbon emission factors for the whole industry and sub-industries, and the quantitative analysis of the impact of green and low-carbon transformation on carbon emissions in each industry. Meanwhile, most of the literatures on carbon emission forecasting based on LMDI method focus on the changes of carbon emission during the whole sample period, without considering the degree of influence of each driver on carbon emission changes in different stages. In addition, most scholars construct scenario analysis indicators only, lacking comprehensive analysis of policies and China’s development status.
Therefore, in this paper taking Sichuan for an example, the LMDI method and the extended Kaya identity are used to classify the drivers of carbon emissions into various effects from the overall, sub-industry and three major industry perspectives, and the impact of each industry development on carbon emissions is quantified by conducting empirical analysis at different stages. At the same time, combined with the scenario analysis method, the impact of changes in industrial carbon emission factors on carbon emissions in Sichuan Province is predicted analyzed under different scenarios. Further research was carried out about the impact of industrial green and low-carbon transformation under the background of double carbon, which provides reference value the transformation and development of green and low-carbon industries in cities similar to Sichuan’s energy structure and industrial structure.
Based on Kaya identity, the extended Kaya identity of carbon emissions is constructed, which is shown as Formula 1.
Where, C indicates the total industrial carbon emissions. Ci indicates carbon emissions of the ith industry. GDP indicates total industrial output. GDPi indicates the output of the ith industry. Ei indicates the energy consumption of the ith sector.
The Kaya identity was proposed by Japanese scholar Yoichi Kaya in 1989 (Kaya, 1989). Although the Kaya identity can only explain the change of carbon emission flow, and the driving factors are mostly superficial factors, the Kaya identity is still widely used in carbon emission. This is because the Kaya identity has the advantages of simple mathematical form, no residual decomposition, and strong explanatory power for driving factors of carbon emission change.
In order to make Eq. 1 has a clearer way to represent the impact of each factor on the industry’s carbon emissions, Formula 1 is expressed as Formula 2.
Where, Q = GDP indicates total outputs, i.e., total output of the industrial sector. Ii = GDPi/GDP indicates the industrial structure of ith sector, i.e., the proportion of the output of each sector to total output. Si = Ei/GDPi indicates the energy intensity of the ith sector, i.e., energy consumption by the sector as a proportion of output by the industry. Mi = Ci/Ei indicates carbon consumption intensity, i.e., share of each carbon emission in energy consumption.
The specific meaning of Formula 2 is that carbon emissions (C) are influenced by changes in economic output effect (Q), industrial structure effect (I), energy intensity effect (S), and carbon consumption intensity effect (M).
On the basis of Formula 2, the result of factor decomposition was obtained by using logarithmic mean divisia index (LMDI) decomposition method, as shown in Formula 3. About the LMDI decomposition method it is proposed by Ang and Liu, (2007), which can not only decompose various factors affecting carbon emissions, but also solve the problem of zero residual (Dong et al., 2020).
Where, ΔC is defined as the total effect of the change in industry carbon emissions from the base year to the tth year.
Correspondingly, the contribution values of each influence factor are obtained by decomposition, which are Formula 4, 5, 6, 7.
Where, ΔCQ indicates the impact of economic output on carbon emissions. ΔCI indicates the impact of industrial structure on carbon emissions. ΔCS indicates the impact of energy intensity on carbon emissions. ΔCM indicates the impact of carbon consumption intensity on carbon emissions.
PSO-ELM prediction model means the extreme learning machine (ELM) model optimized by particle swarm optimization (PSO). The ELM model has a faster learning speed and better generalization performance compared with traditional neural networks, and the weights and thresholds of the ELM model are optimized by a particle swarm optimization algorithm, which can further improve the prediction accuracy and convergence speed of the network (Chen, 2021).
ELM is a fast-learning algorithm for single hidden layer neural networks that can randomly initialize the input weights and biases and obtain the corresponding output weights (Cao et al., 2010). Let the single hidden layer feed-forward neural network have m neurons, N hidden layer nodes and 1 output neuron. Then the output of the ELM is Eq. 3:
Where: x= [x1, x2, … , xm]T is the m inputs; aj = {a1j,a2j, … amj} is the connection weights of all input layers to the jth neuron, aij is the connection weight of the ith neuron to the jth hidden layer node; bj represents the bias value of the jth hidden layer node; g( ) is the hidden layer excitation function; Bj is the connection weight of the jth hidden layer to the output layer (Huang et al., 2006).
The traditional neural networks are more complex to solve for aj, bj, and Bj in practice. While the ELM model is based on a single hidden layer feed-forward neural network, which directly assigns values to aj and bj, and only needs to learn Bj. At the same time, compared with the traditional feed-forward neural network, it adds an undertaking layer. The ELM model not only has excellent generalization and approximation capabilities, but also has the advantages of fast operation and low complexity (Chen, 2021).
Particle Swarm Optimization (PSO) is a classical heuristic algorithm whose basic idea is to use the sharing of information by individuals in a population to produce an evolutionary process from disorder to order in the solution space to obtain the optimal solution to the problem. As the prediction accuracy of the ELM model is affected by the weights and thresholds, the use of PSO to optimize the weights and thresholds can improve the prediction accuracy of the ELM model (Liu et al., 2023).
The data include China’s total GDP, each industry and sub-industries sector’s GDP, energy consumption and carbon emissions. All data concerning GDP and energy consumption were obtained from energy and national economic accounts of Sichuan Statistical Yearbook (2005–2020). In order to ensure the accuracy of industrial carbon emission data calculation and the accuracy of research results, the data of carbon emissions of each sector in Sichuan Province are taken from the Provincial Emissions Inventory (2005–2019) of the CEADs (China Carbon Accounting Database). The database’s carbon emissions data is currently only updated until 2019. By the relevant literatures (Hu and Gui, 2017; Dong et al., 2020; Yue, 2021; Wang et al., 2022) and the classification criteria of each industrial sector in the Sichuan Provincial Statistical Yearbook, the data caliber is unified between different types of industrial sectors. Finally, the industries in Sichuan Province are divided into three main categories, among which agriculture, forestry, animal husbandry and fishery are the primary industries, industry and construction are the secondary industries, and transportation, warehousing, postal service, wholesale, retail, accommodation, catering industry and others are the tertiary industry.
In this paper, according to the data on carbon emissions of each industry, the trends of total industrial carbon emissions are analyzed in Sichuan province from 2005 to 2019. As can be seen from Figure 1, from 2005 to 2013, carbon emissions continued to rise, and from 2015 to 2019, they declined and remained stable. From 2005 to 2019, total carbon emissions of final energy consumption by various industries increased by 13.257 million tons, with an average annual growth rate of 4.48%. The secondary industry was the main output sector of the total carbon emissions in Sichuan Province, and it played a dominant role in the composition of carbon emissions. In terms of growth rates, the average annual growth rates of carbon emissions from the primary, secondary and tertiary industries were 2.22%, 4.03%, and 7.91%, respectively. Among the three industries, the tertiary industry had the highest average annual growth rate, but the total carbon emissions of the tertiary industry were still less than that of the secondary industry, and there was a big gap. In terms of carbon emission intensity, although the total carbon emission increased continuously from 2010 to 2013 and reached the peak, the carbon emission intensity showed a downward trend, which indicated that the amount of carbon dioxide emitted by per unit of output in Sichuan province was declining while its economy was growing. Especially since 2013, carbon emission intensity has continued to decrease, meaning that industries have gradually entered a low-carbon development mode in Sichuan Province. This indicates that if the industrial economic level remains unchanged, industrial carbon emissions continue to decrease, and the trend of green and low-carbon development continues to emerge.
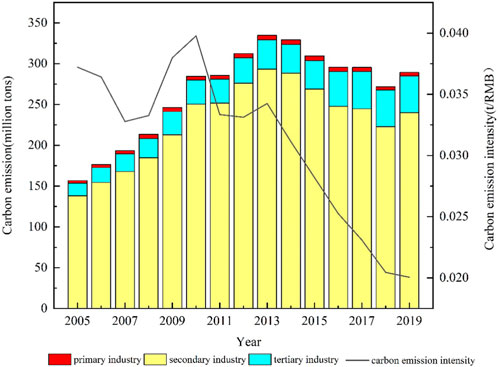
FIGURE 1. Changes in total industrial carbon emissions and carbon emission intensity in Sichuan from 2005 to 2019.
Firstly, from the overall perspective, the change of the contribution value of the four main factors mentioned above to industrial carbon emissions at different stages (2005–2010, 2010–2015, and 2015–2019) in Sichuan Province was analyzed to determine the impact of these factors on carbon emissions. As can be seen from Figure 2, the decomposition of industrial carbon emissions in the three stages reveals that economic output effect was the main driving factor of carbon emissions growth, with the most prominent effect from 2005 to 2010. However, on the whole, the promoting impact of economic output effect on carbon emissions was gradually decreasing. In addition, the energy intensity effect restrains the growth of carbon emissions consistently. Furthermore, both the industrial structure effect and the carbon consumption intensity effect promoted the increase of carbon emissions from 2005 to 2010, and inhibit the increase of carbon emissions in the following two stages, but the energy intensity effect was more significant. In the three stages, the change of carbon emissions always showed a downward trend. Based on the decomposition results of specific industrial carbon emissions in Table 1, the conclusions are as follows.
(1) In the whole time periods, the economic output effect was always positive values and showed a decreasing trend, which indicated that although the impact of economic growth on carbon emissions in Sichuan Province had decreased, the rapid economic growth was still the dominant factor leading to the increase of carbon emission.
(2) The industrial structure effect promoted the increase of carbon emissions from 2005 to 2010, but turned negative after entering 2010, indicating that the industrial structure effect began to restrain the growth of emissions. The cumulative contribution value of industrial structure effect from 2005 to 2019 was −13.31 million tons, which reflected that the industrial structure adjustment has played a positive role in Sichuan province. At the same time, it is still necessary to further optimize and upgrade the industrial structure and carry out green and low-carbon transformation according to the current deployment.
(3) Energy intensity refers to the level of energy consumption per unit of GDP, which reflects the efficiency of energy in economic development (Dong et al., 2020). In the whole three stages, the influence of energy intensity effect on carbon emissions in Sichuan Province had always been negative, and its cumulative contribution value was −286.917 million tons. Therefore, the reduction of energy intensity can effectively restrain the increase of carbon emissions, which will bring a new upgrading path for the industrial green and low-carbon development of Sichuan Province in the future.
(4) The carbon consumption intensity effect represents the level of CO2 output per unit energy consumption. The carbon consumption intensity effect promoted carbon emissions from 2005 to 2010 and inhibited them after 2010, which was the same as the industrial structure effect on carbon emissions. However, in the whole three stages, the cumulative contribution value of carbon consumption intensity effect was 31.637 million tons, which indicated that the energy efficiency and quality of the industry were not high in Sichuan Province. In the future, it is still necessary to optimize the energy structure by increasing the proportion of clean energy.
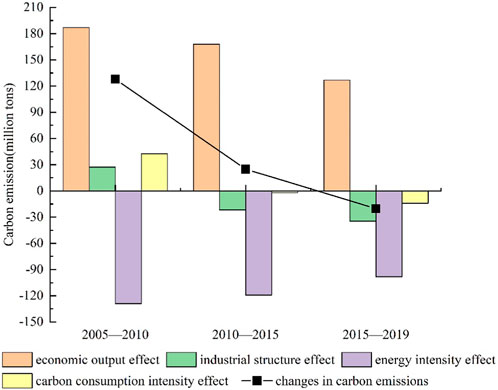
FIGURE 2. Results of phased decomposition of industrial carbon emissions changes in Sichuan.
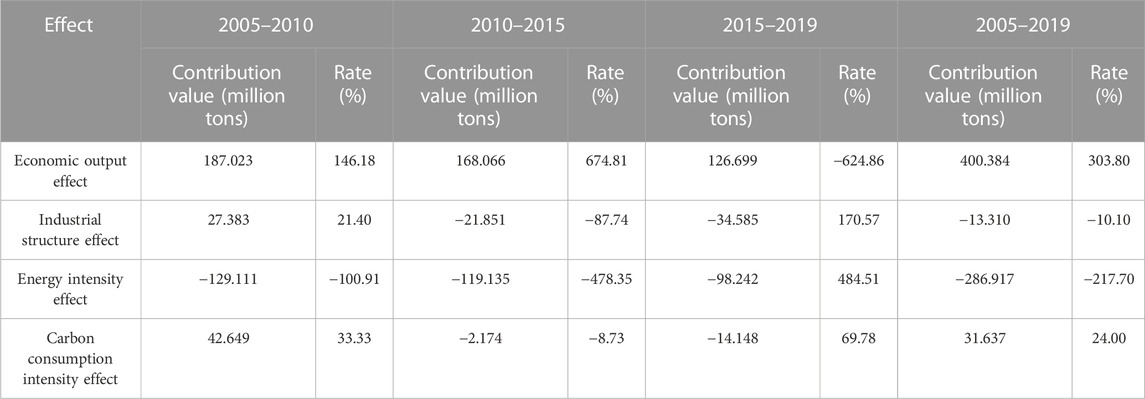
TABLE 1. The results of the factor decomposition of industrial carbon emissions.
Further, the cumulative contribution of each driving factor is studied from the overall perspective, and the dynamic impact of each driving factor on carbon emissions in Sichuan province is analyzed. With 2005 as the base period, the cumulative contribution of the driving factors of industrial carbon emissions was obtained, as shown in Figure 3. As can be seen from Figure 3, from 2005 to 2013, the variation of carbon emissions in Sichuan Province increased year by year, reaching the maximum in 2013. From 2013 to 2019, the variation of carbon emissions showed a trend of fluctuating growth. From the analysis of the four driving factors, it can be seen that economic output effect, carbon consumption intensity effect and industrial structure all promoted the growth of carbon emissions, among which economic output effect was the main driving factor, and showed an upward trend on the whole. The energy intensity effect restrained the growth of carbon emissions effectively, which was an important driving factor for achieving the “double carbon” goal. Moreover, the influence of energy intensity effect on carbon emissions continued to strengthen, so it is necessary to focus on the low-carbon development effect of the secondary industry in the future.
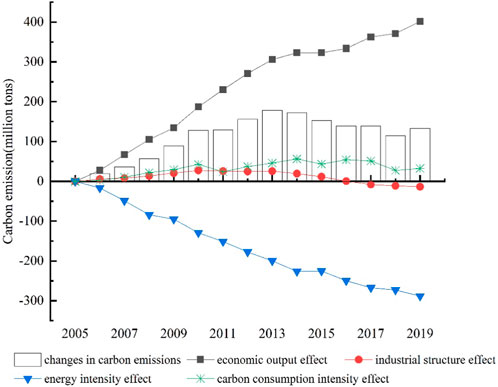
FIGURE 3. The cumulative contribution of the driving factor of industrial carbon emissions in Sichuan.
In this paper, based on the classification of industrial sectors in China Statistical Yearbook and Sichuan Provincial Statistical Yearbook, Sichuan’s industrial sectors are divided into six types, as shown in Table 2. Here, other industries include information transmission, software and information technology service industry, financial industry, real estate industry, leasing and business service industry, scientific research and technology service industry, etc. Different industrial sectors produce different products, resulting in different energy demand, labor productivity, technology level and output. The detailed analyses are shown in Table 2.
(1) According to the ΔCQ in Table 2, it can be seen that the contribution value of the economic output effect to carbon emissions was positive contribution value for six types of industrial sectors during the three stages. Meanwhile, except for individual sectors, the contribution value of economic output effect in the majority of industrial sectors decreased gradually in the whole three stages, mainly including agriculture, forestry, animal husbandry, fishery, industry, construction, transportation, storage and postal industry, which indicates that these four industrial sectors are also keeping CO2 emissions under control during the process of economic growth. In the whole three stages, the industrial sector with the largest reduction in carbon emissions on account of economic output effect was industry. The main reason for this phenomenon is that the industrial low-carbon development, the construction of industrial Internet, and the industrial digital transformation are promoted effectively in Sichuan Province, so that the green and low-energy industrial production keeps increasing. Therefore, the impact of the industrial sector on carbon emissions shows a downward trend.
(2) According to the ΔCI in Table 2, it can be seen that the contribution value of the industrial sector to the increase of carbon emissions changed from positive to negative, and the contribution value of the agriculture, forestry, animal husbandry and fishery sectors to the increase of carbon emissions was always negative, which indicated that the industrial structure of Sichuan Province began to optimize gradually, and to some extent inhibited the rapid growth of carbon emissions. Meanwhile, with the acceleration of urbanization and the improvement of the living standard, the contribution value of transportation, storage and postal services, wholesale, retail and accommodation, catering and other industries to carbon emissions shows an increasing trend, which indicates that the scale of the tertiary industry is expanding in Sichuan province, and the rapid development of the tertiary industry will inevitably promote the increase of carbon emissions.
(3) According to the ΔCS in Table 2, it can be seen that the energy intensity effect was negative for all industrial sectors in the whole three stages, except for transportation, storage and postal industry, which had a positive energy intensity effect from 2005 to 2010. Among them, the energy intensity effect of agriculture, forestry, animal husbandry, fishery and industry has a gradually decreasing influence on controlling the growth of carbon emissions. As a whole, the energy intensity effects of all industrial sectors restrain the increase of carbon emissions effectively. Therefore, the decrease of energy intensity is a key factor to restrain the increase of carbon emissions, which poses a challenge to the development of green and low-carbon economy in Sichuan Province.
(4) According to the ΔCM in Table 2, it can be seen that the carbon consumption intensity effects of some industrial sectors are positive value and some are negative value among the six industrial sectors in the three stages. From the perspective of contribution value, agriculture, forestry, animal husbandry, fishery, industry and other industry sectors play a significant role in restraining the increase of carbon emissions, among which the industrial sector has the strongest inhibitory effect. With the change of carbon consumption intensity effect during the whole three stages, the number of sectors with negative contribution values gradually increases, indicating that the share of non-fossil energy in each industrial sector has increased. At the same time, the change of carbon consumption intensity effect will also promote the industrial energy conservation and emission reduction to zero carbon (Wang et al., 2022), resulting in significant carbon emission reduction effect.
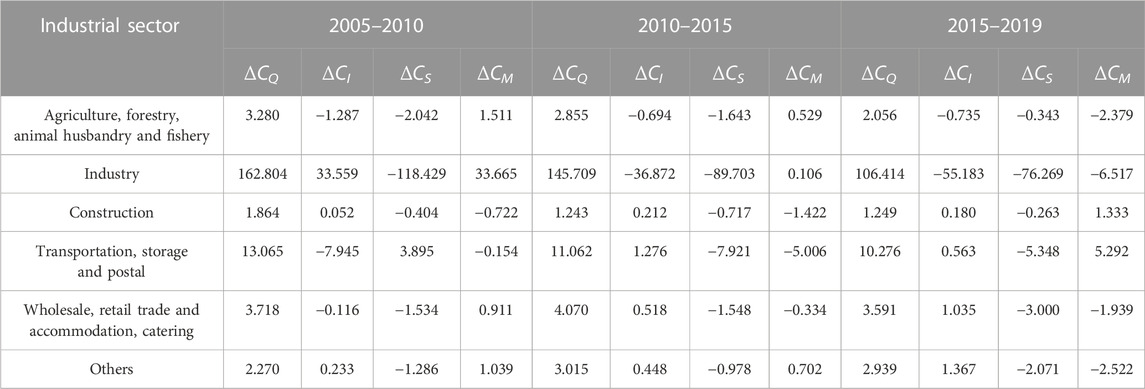
TABLE 2. Decomposition of carbon emission influencing factors in 6 types of industrial sectors in Sichuan.
In order to grasp the direction of green and low-carbon industrial development in Sichuan province, the impact of each driving factor above on carbon emissions is analyzed from the perspective of three industries. The detailed decomposition results were shown in Table 3.
(1) For the economic output effect, the contribution values of the three industries were positive during the three stages. From 2005 to 2010, carbon emissions from the secondary industry increased by 328.03 million tons due to the economic output effect, accounting for 88.05% of the increase in industrial carbon emissions caused by economic output effect. Therefore, in terms of economic output effect, the secondary industry has the strongest promoting effect on carbon emissions.
(2) For the industrial structure effect, the contribution values of the primary and tertiary industries were negative, while the secondary industries were positive contribution values in the first stage (2005–2010). The reason is that the proportion of the primary and tertiary industries in the three industries is not high, while the secondary industry dominates. From 2010 to 2015 and 2015 to 2019, the contribution values of the primary and tertiary industries were negative, and the tertiary industry was positive. This is because the tertiary industry developed rapidly as the income of the residents had improved and the demand of services had increased. At the same time, with the continuous adjustment of the three industrial structures, the proportion of secondary and primary industries decreased and the proportion of tertiary industries significantly increased. Therefore, the industrial structure effect of the secondary industry showed a negative influence on the growth of carbon emissions.
(3) For the energy intensity effect, the contribution values of the three industries were negative during the three stages, which showed that the energy intensity effect led to the reduction of industrial carbon emissions, and the industry with the largest reduction was the secondary industry. In a comprehensive view, the energy intensity effect on carbon emission reduction was the secondary industry, the tertiary industry, and the primary industry in descending order. The main reason for this is that the secondary industry consumed more energy. When controlling the energy intensity of the secondary industry can effectively promote the reduction of carbon emissions and help the development of the low-carbon economy.
(4) For the carbon consumption intensity effect, the contribution values of the three industries were similar to the industrial structure. From 2005 to 2010, the contribution values of carbon consumption intensity effect on the three industries were all positive values, indicating that the three industries used fossil energy extensively and energy inefficiently. From 2010 to 2015 and 2015 to 2019, the contribution values of the carbon consumption intensity effect on the secondary industry were negative, while the primary industry and tertiary industry had positive and negative contribution values. The reason for these is that the secondary industry focused on the adjustment of energy structure and gradually developed the use of clean energy during the period, but the utility for the reduction of carbon emissions was low, and that the industry in Sichuan province was still very dependent on coal and other fossil energy, and the technology of developing clean energy was still relatively backward.
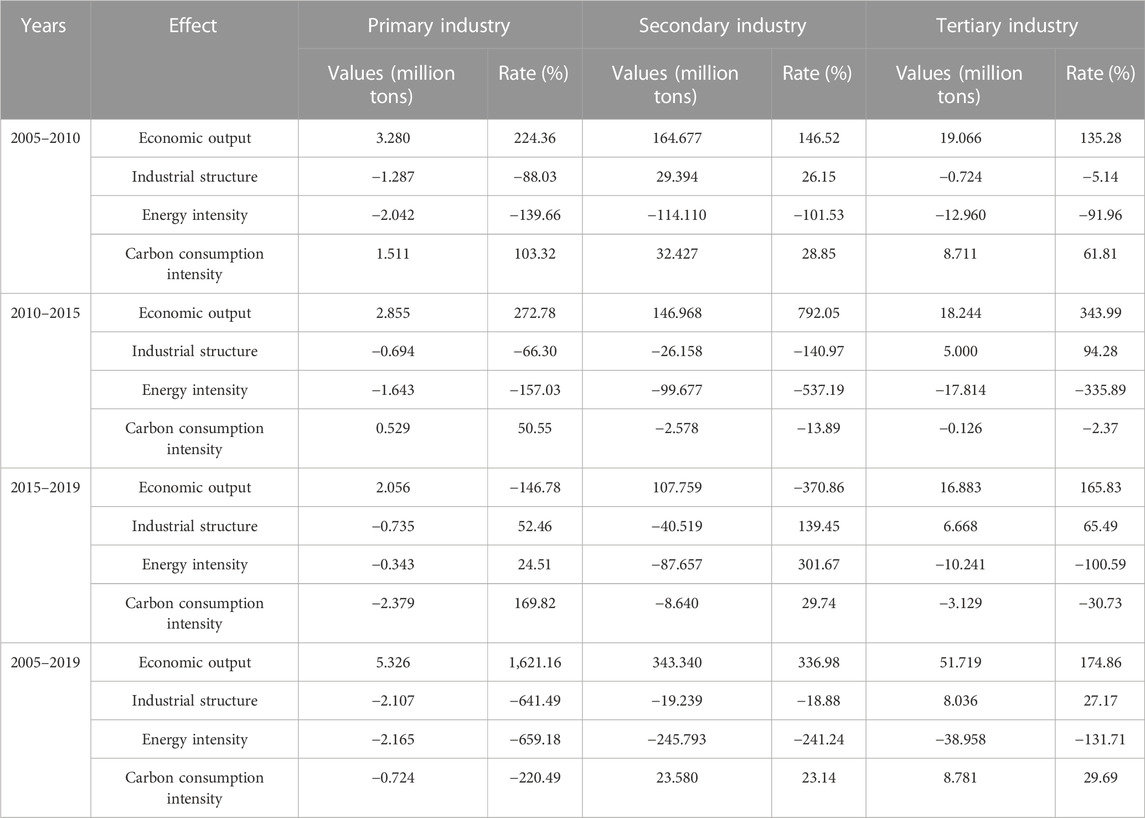
TABLE 3. The factor decomposition of carbon emissions of three industries.
According to the emission reduction situation of Sichuan Province during the “13th Five-Year” Plan period, combined with the relevant policies and measures of the 14th Five-Year Plan period, related parameter values and the change rate of the driving effect factors of carbon emission are set under the two scenarios respectively, namely, baseline and green and low-carbon transformation. Accordingly, the impact of industrial green and low-carbon transformation on the realization of the “double carbon” goal is analyzed in Sichuan Province. The parameters of each scenario were shown in Table 4.
(1) Economic output effect. The economic output effect is mainly affected by the gross industrial product. Meanwhile, according to the indicators of “the 14th Five-Year Plan for Sichuan’s National Economic and Social Development and the Outline of the Long-term Goals for 2035,” combined with the fact that the COVID-19 epidemic will slow down the overall economic growth rate, the average annual growth rate of industrial GDP at 6% was set under the two scenarios set above in this paper.
(2) Industrial structure effect. The industrial structure effect refers to the proportion of the output values of the three industries in the total output values. Therefore, the effect of the industrial structure effect was converted into the effect of the industrial structure of each industry on carbon emissions in this paper. In the scenario of baseline, it is assumed that the changes of three industrial structure maintain the annual average change rate in the past 5 years, that is, in the primary, secondary, and tertiary industries it is −3.72%, −3.91% and 4.28% respectively. Under the green and low-carbon transformation scenario, it is set in this paper that the average annual change rate of the industrial structure of the primary industry remains unchanged, the secondary industry decreases by 0.2%, and the tertiary industry increases by 0.2%, namely, the average annual growth rate of the three industries is −3.72%, −4.11%, and 4.48% respectively, based on the literatures (Fu et al., 2019; Yue, 2021) and the following reasons. On the one hand, the adjustment of industrial structure will affect the green and low-carbon transformation of industry. On the other hand, from the LDMI decomposition results above, it can be concluded that the proportion of the industrial structure, which declines in the secondary industry and increases in the primary and tertiary industries, will help to restrain the increase of carbon emissions. In addition, compared with the secondary and tertiary industries, the industrial structure effect of the primary industry has less impact on carbon emissions. Therefore, the change rate of the industrial structure of the primary industry is set to remain unchanged.
(3) Energy intensity effect. According to the “14th Five-Year Plan for Energy Development in Sichuan Province,” the energy intensity was set to decrease by 13.5% in the baseline scenario compared with 2019, with an average annual change rate of −2.86%. Energy intensity is an effective factor to restrain the increase of carbon emissions. Therefore, the energy intensity was set to decrease by 15% compared with 2019, with an average annual change rate of −3.20% in the green and low-carbon transformation scenario.
(4) Carbon consumption intensity effect. The carbon consumption intensity is influenced by the energy consumption structure. At the same time, the increase of the use of clean energy such as non-fossil energy will effectively reduce industrial carbon emissions, especially in the secondary industry. Carbon consumption intensity scenarios are based on the average annual change rate of the share of non-fossil energy (Wang et al., 2022). In 2022, According to the “14th Five-Year Plan” for Energy Conservation and Emission Reduction in Sichuan Province,” the share of non-fossil energy consumption will reach about 41.5% by 2025. Therefore, under the baseline scenario, the proportion of non-fossil energy is set at 41.5% in 2025, with an average annual growth rate of 12.76% in this paper. After the low-carbon transformation of the industry, energy efficiency and the proportion of non-fossil energy will be further improved. Meanwhile, combined with related literatures about the setting of carbon emission intensity scenarios (Wang et al., 2022), the proportion of non-fossil energy is set at 41.5% in 2025 under the scenario of green and low-carbon transformation, with an average annual growth rate of 14.29%.
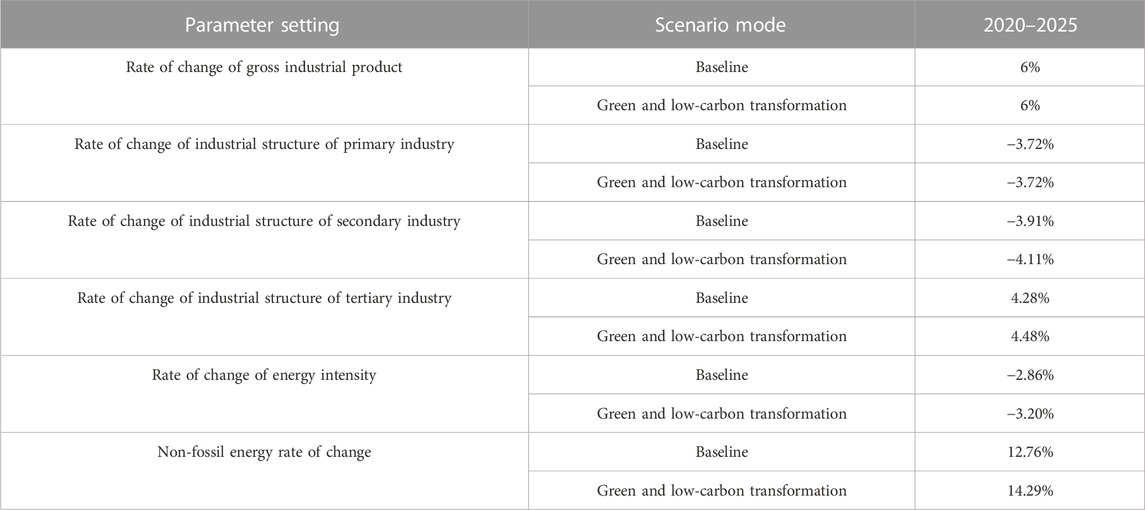
TABLE 4. Scenario indicators for each driver factor in Sichuan.
Under the baseline and green and low-carbon transformation scenarios, we forecasted and analyzed the change of industrial carbon emissions in Sichuan from 2020 to 2025, and determined the impact of industrial green and low-carbon transformation on the trend of carbon emissions change, which based on the extreme learning machine model optimized by particle swarm optimization (PSO-ELM) prediction model in this paper.
The data from 2005 to 2015 were used as the training set and the data from 2016 to 2019 were used as the test set to build the PSO-ELM prediction model. The prediction values and simulation errors of the model are shown in Table 5. As can be seen from Table 5, compared with the simulation results of data, the simulation of PSO-ELM has higher prediction accuracy, and its mean relative error is 0.968%. The MSE, RMSE and MAE reflect the degree of deviation between the predictive values and the true values, and the smaller the value, the higher the prediction accuracy (Yue, 2021). In this paper, the MSE, RMSE and MAE are 9.599, 3.098, and 2.769, respectively, and the three values are small. Therefore, PSO-ELM combined prediction model has better prediction accuracy. When the indicators of the two scenarios were input into the PSO-ELM model respectively, the corresponding scenario predictive values of Sichuan Province from 2020 to 2025 were obtained. The trend of industrial carbon emission in Sichuan Province is obtained accordingly, as shown in Figure 4.
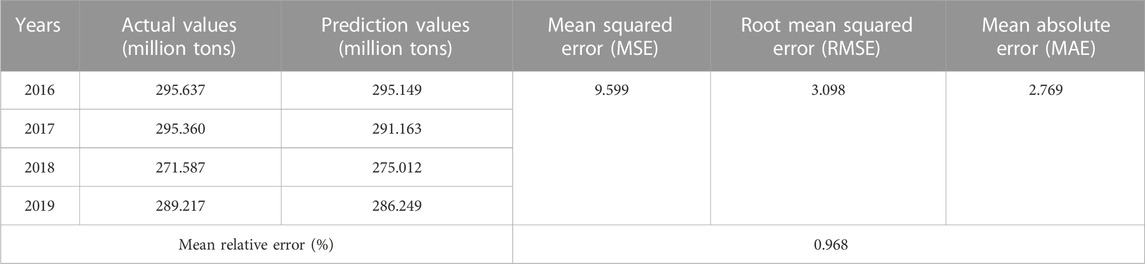
TABLE 5. The prediction values and simulation errors of the PSO-ELM prediction model.
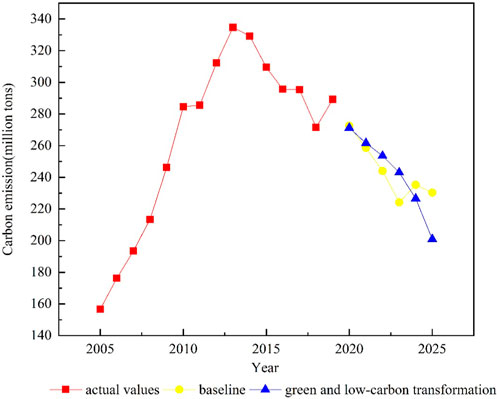
FIGURE 4. Industrial carbon emissions trends in Sichuan, 2005–2025.
As can be seen from Figure 4, the Scenario predictive values of industrial carbon emissions in Sichuan province decreased under the baseline and green and low-carbon transformation scenarios. Under the baseline scenario, industrial carbon emissions will be reduced by 5.885 million tons compared with 2019, with an average annual decline rate of 3.2%. Under the green and low-carbon transformation scenario, industrial carbon emissions in 2025 will be reduced by 8.830 million tons compared with 2019, with an average annual decline rate of 5.07%. Therefore, the total industrial carbon emissions can be reduced effectively under the two scenarios. But the emission reduction efficiency is stronger under the scenario of industrial green and low-carbon transformation. The results showed that the keys to promoting the reduction of industrial carbon emissions are optimizing the industrial structure, especially the secondary industry and tertiary industry, reducing the proportion of energy per unit of GDP, and strengthening the proportion of non-fossil energy under the economy keep a steady rise. Therefore, the green and low-carbon transformation of the industry can effectively restrain the increase of carbon emissions and help Sichuan achieve the “double carbon” goal as soon as possible.
In terms of the results above, for Sichuan Province the control effect of industrial carbon emissions is obvious in recent years. In this paper, the change trend of industrial carbon emissions predicted under two scenarios is similar to the results of Liao’s research (Liao et al., 2022), which predicted that under baseline, low-carbon and the economic slowdown scenarios, carbon emissions in Sichuan province will show a downward trend from 2020 to 2025 gradually. Compared with Liao’s research which only selected three factors affecting carbon emissions in Sichuan Province, more scenario indicators based on the results of factor decomposition are set up to improve the practicability of the results in this paper. At the same time, the adjustment of industrial structure is one of the important means to promote the reduction of carbon emissions, so we incorporate changes in industrial structure and carbon consumption intensity into the forecast of industrial carbon emissions specially. The scenario prediction results show that an effective reduction of carbon emissions can be achieved by a 0.2% decrease in the rate of structural change of secondary and tertiary industries in Sichuan Province in this paper, While Qiaochu et al. (2022) also believes that the improvement of low-carbon efficiency in Sichuan Province is largely due to the optimization of industrial structure. In addition, the energy intensity effect and carbon consumption intensity effect can inhibit the increase of industrial carbon emissions, and the main factors influencing these two effects are the proportion of non-fossil energy and the efficiency of fossil energy use. Therefore, the carbon consumption intensity and energy intensity are added to make the existing studies more comprehensive.
The situation that the carbon emissions show a decreasing trend, but the overall decrease is small in Sichuan, is consistent with that of the whole country obtained in Liu and Ding (2020) ’s research. From the perspective of economic policy and industrial policy, the results of the study, as shown in Figure 1, confirm that the secondary industry is the main source of carbon emissions in Sichuan province, and the economic output effect consistently promotes the rise of carbon emissions in the overall, industrial sector and three industry perspectives, which indicate that the economic growth mode at the expense of the environment and the irrational industrial structure lead to the increase of industrial carbon emissions in Sichuan Province. The conclusion accords with the current situation of industrial development in China and is consistent with the existing research (Hu and Gui, 2017; Fu et al., 2019; Ma et al., 2019; Dong et al., 2020). Therefore, all industries should strengthen the efficient use of fossil energy, reduce unnecessary energy consumption, control the growth rate of energy consumption in the secondary industry, take the advantage of new energy technologies, and reduce the total industrial carbon emissions.
In terms of method, the LMDI decomposition method has been widely used in the research of carbon emissions. At present, most studies of industrial carbon emissions mainly focus on the individual industries, not the whole industry (Ma et al., 2019; Sun and Yang, 2020). And there is a lack of further analysis of how changes in these factors will affect carbon emissions, after obtaining the influencing factors of industrial carbon emissions. Although some scholars have studied the factors influencing industrial carbon emissions from a holistic perspective, such as Hu and Gui (2017), who decomposed the factors of industrial carbon emissions from three perspectives. However, they used a small amount of data and did not consider the role of non-fossil energy use on industrial carbon emissions. Therefore, more factors is added to the Kaya identity and these factors combined with the LMDI method are analyzed by the PSO-ELM prediction model to quantify the effect of factor changes on industrial carbon emissions in this paper. At the same time, the application of LMDI method combined with scenario prediction expands the existing methods further.
In terms of the reliability, the carbon emission data of provincial industries calculated is used directly in this paper, according to the IPCC method in the CEADs database. On the one hand, the IPCC method considers almost all GHG emission sources comprehensively, and provides specific emission principles and detailed calculation methods. At the same time, this method is also the most authoritative and reliable method recognized internationally (Zhang et al., 2022). In this paper, data from CEADs database is directly used, while other studies (Hu and Gui, 2017; Hu X. W. et al., 2021; Wang et al., 2022) made some estimates using online data or literature data. This is because that although the data of CEADs database is accurate, the update speed is slow. Therefore, using other data would reduce the accuracy of the results. On the other hand, the scenario forecast indicators used in this paper are all derived from the policy documents related to the green and low-carbon transformation of industries. Therefore, the results analyzed and predicted can be used as a reference for government departments.
According to the research results, the following conclusions are obtained.
(1) From the viewpoint of the economic output effect, the economic output effect always contributes to the increase of carbon emissions under the overall, industrial sector and three industries’ perspectives. From the overall perspective and the three industrial perspectives, the contribution of economic output effect to industrial carbon emissions is decreasing, indicating that the effectiveness of green economic development in the three major industries is beginning to be significant. From the perspective of industrial sectors, the economic output effect of the industrial sector has the strongest contribution to carbon emissions, followed by transportation, storage, and postal industry. The rest of the industrial sectors have a smaller impact. This indicates that industry is still the pillar industry of economic development.
(2) From the industrial structure effect, the change in industrial structure begins to inhibit the growth of carbon emissions. The inhibiting effect of the secondary industry is the most obvious. From the perspective of industrial sectors, the inhibiting effect of industrial structure in the industrial sector is increasing, while the effect of industrial structure in the tertiary industries, such as transportation, storage, postal service, and wholesale, is gradually promoting the increase of carbon emissions. This indicates that the industrial structure is changing to “3-2-1,” which is in line with the trend of industrial structure change in China at this stage.
(3) From the energy intensity effect, the energy intensity effect consistently restrains the growth of carbon emissions under the three perspectives, and the inhibitory of energy intensity effect shows that the energy consumption of various industries is decreasing, the quality of economic development is increasing, and the dependence of economic development on energy is also weakening.
(4) In terms of the carbon consumption intensity effect, the carbon consumption intensity effect shifts from positive to negative values in the overall perspective and begins to suppress the increase of carbon emissions in industries. Except for the carbon intensity effect of construction, transportation, storage, and postal industries, which began to promote the increase of carbon emissions, the carbon intensity effect of agriculture, industry, wholesale and retail industries all gradually suppressed the increase of carbon emissions. The rapid development of urbanization in recent years, which has led to the rapid development of construction, transportation, logistics, and other industries, resulting in an increase in demand for energy use and thus the increase in carbon emissions is the main reason for this phenomenon.
(5) Through the quantitative analysis of the impact of the industrial green and low-carbon transformation in Sichuan province, combined with the indicator settings of the scenario analysis, it is concluded that without considering the economic cost of transformation, accelerating the rate of change of industrial structure of secondary and tertiary industries, increasing the proportion of decrease in energy intensity, strengthening the proportion of non-fossil energy use, and optimizing the industrial structure and energy intensity can effectively improve the efficiency of carbon emission reduction and help Sichuan province achieve the goal of “double carbon” as soon as possible.
Based on the above research results, this paper provides the following suggestions for the green and low-carbon industrial transformation development of Sichuan Province and other regions at home and abroad.
Firstly, promoting the development of clean energy and take the path of green and low-carbon development. Sichuan Province and other regions should give full play to its huge potential in the development and use of clean energy, and increase the proportion of clean energy consumption.
Secondly, speeding up the transformation of energy-intensive industries and take the path of energy conservation and carbon reduction. Sichuan Province should focus on the transformation of energy-consuming industries. Meanwhile, other regions should actively promote the transformation and upgrading of energy-consuming industries and energy technology innovation.
Thirdly, strengthening policy support and control, and take the path of ecological development first. Sichuan Province and other regions should introduce precise policy support for resources, environment, technology research and development, finance and other aspects at the provincial level to encourage social capital to enter green and low-carbon industries.
In the paper, firstly, the extended Kaya identity was constructed, and then, combined with LMDI method, the four factors affecting industrial carbon emissions and their contribution values were decomposed. Secondly, from the perspectives of the overall, industrial sector and tertiary industry, the PSO-ELM method is used to predict industrial carbon emissions and the influence trend of adjustment of the above influencing factors on industrial carbon emissions in Sichuan Province by setting scenario prediction indicators. It provides a reference to realize the development path of industrial green and low-carbon transformation. However, there are still some shortcomings in this paper. First of all, the influencing factors of industrial green and low-carbon transformation are complex and diverse. In order to improve the research, more influencing factors should be added in the future, such as industrial transformation cost, industrial innovation level and other factors. Secondly, industrial sectors are divided into six categories in this paper, and it is impossible to analyze the influence of a specific industry in more detail, such as manufacturing, financial industry, etc., so industrial sectors should be divided in more detail in the future.
The original contributions presented in the study are included in the article/supplementary material, further inquiries can be directed to the corresponding author.
BL: Conceptualization, Data curation, Funding acquisition, Methodology, Project administration, Supervision, Validation, Writing–review and editing. HC: Conceptualization, Data curation, Formal Analysis, Methodology, Writing–original draft, Writing–review and editing. YL: Conceptualization, Data curation, Funding acquisition, Methodology, Project administration, Supervision, Validation, Visualization, Writing–review and editing. YZ: Conceptualization, Data curation, Formal Analysis, Methodology, Software, Writing–review and editing.
The author(s) declare financial support was received for the research, authorship, and/or publication of this article. We are grateful for the funding from the Sichuan Province Key Research Bases of Philosophy and Social Sciences-Regional Information Technology Public Management Research Institute (QGXH22-03) and the Chengdu Philosophy and Social Science Research Base-Chengdu Park City Demonstration Zone Construction Research Institute (GYCS2022-ZD002 and GYCS2022-YB006).
The authors declare that the research was conducted in the absence of any commercial or financial relationships that could be construed as a potential conflict of interest.
All claims expressed in this article are solely those of the authors and do not necessarily represent those of their affiliated organizations, or those of the publisher, the editors and the reviewers. Any product that may be evaluated in this article, or claim that may be made by its manufacturer, is not guaranteed or endorsed by the publisher.
Abul, Q. A.-A., Rajah, R., and Santha, C. (2015). Prioritizing climate change mitigation: an assessment using Malaysia to reduce carbon emissions in future. Environ. Sci. Policy 50, 24–33. doi:10.1016/j.envsci.2015.02.002
Ang, B. W., and Liu, N. (2007). Handling zero values in the logarithmic mean divisia index decomposition approach. Energy Policy 35, 238–246. doi:10.1016/j.enpol.2005.11.001
Cao, J., Lin, Z., and Huang, G. B. (2010). Composite function wavelet neural networks with extreme learning machine. Neurocomputing 73, 1405–1416. doi:10.1016/j.neucom.2009.12.007
Chen, L. C., Guo, J. N., Wan, J. H., and Guo, S. Q. (2022). Decomposition analysis of carbon emission influencing factors of civil aviation transportation in china. China Collect. Econ. 19, 84–86.
Chen, Z. B. (2021). Combined prediction model of dynamic online kernel extreme learning machine with time weight. Statistics Decis. 37, 37–41.
Dalia, Š., and Tomas, B. (2016). Kaya identity for analysis of the main drivers of GHG emissions and feasibility to implement EU “20–20–20” targets in the Baltic States. Renew. Sustain. Energy Rev. 58, 1108–1113. doi:10.1016/j.rser.2015.12.311
Dan, H., Tao, H., and Youxue, J. (2016). Selection and development strategy of leading industries for low-carbon transformation of industrial structure. Macroeconomics 11, 131–141+175.
Dong, Y., Xu, B. R., and Hua, Z. (2020). Factor decomposition of carbon emission in Gansu Province based on LMDI. J. Lanzhou Univ. Nat. Sci. 56, 606–614.
Ediger, V. Ş., and Huvaz, O. (2006). Examining the sectoral energy use in Turkish economy (1980–2000) with the help of decomposition analysis. Energy Convers. Manag. 47, 732–745. doi:10.1016/j.enconman.2005.05.022
Fu, Y. P., Ma, S. C., and Sun, Q. (2019). Study on the affecting factors of China’s carbon emissions based on LMDI formula. Math. Pract. Theory 49, 7–17.
Gu, S. Z. (2016). Green transformation is an important way to achieve a balance between economic and social development and environmental quality. Macroecon. Manag. 04, 6+8.
Haitao, Z., Jingrong, D., Wenqing, Z., and Jiahui, L. (2023). Public environmental supervision, environmental non-governmental organizations, and industrial green and low-carbon transformation. Front. Environ. Sci. 10. doi:10.3389/fenvs.2022.1074267
Hatzigeorgiou, E., Polatidis, H., and Haralambopoulos, D. (2008). CO2 emissions in Greece for 1990–2002: A decomposition analysis and comparison of results using the Arithmetic Mean Divisia Index and Logarithmic Mean Divisia Index techniques. Energy 33, 492–499. doi:10.1016/j.energy.2007.09.014
Hu, J. B., and Gui, S. S. (2017). Study on the Influencing Factors of Implied Carbon Emissions in the Industrial Sector of Ethnic Regions: Guizhou Province as an Example. World Surv. Res. 09, 54–58.
Hu, J. B., Zhao, K., and Yang, Y. H. (2021a). Study on the Prediction of Industrial Carbon Emissions Peaking in China and the Controlling Factors: An empirical analysis based on BP-LSTM neural network model. Guizhou Soc. Sci. 09, 135–146.
Hu, X. W., Bao, J. S., and An, S. (2021b). Urban transportation emission reduction governance strategies under peak carbon dioxide emissions. J. Transp. Syst. Eng. Inf. Technol. 21, 244–256.
Huang, G. B., Zhu, Q. Y., and Siew, C. K. (2006). Extreme learning machine: Theory and applications. Neurocomputing 70, 489–501. doi:10.1016/j.neucom.2005.12.126
Hwang, Y., Um, J.-S., Hwang, J., and Schlüter, S. (2020). Evaluating the Causal Relations between the Kaya Identity Index and ODIAC-Based Fossil Fuel CO2 Flu. Energies 13, 6009. doi:10.3390/en13226009
Janipour, Z., de Nooij, R., Scholten, P., Huijbregts, M. A., and de Coninck, H. (2020). What are sources of carbon lock-in in energy-intensive industry? A case study into Dutch chemicals production. Energy Res. Soc. Sci. 60, 101320. doi:10.1016/j.erss.2019.101320
Jiang, H., Li, Y. P., and Gao, J. (2022). The road of green and low-carbon transformation of coal-based industry under carbon peak and carbon neutrality background. J. Environ. Eng. Technol. 5, 1580.
Kaya, Y. (1989). Impact of carbon dioxide emission on GNP growth: Interpretation of proposed scenarios. Response Strategies Working Group, IPCC.
Liao, Z. J., Zhang, J. Y., and Chen, S. W. (2022). Research on carbon emission influencing factors and carbon peak reaching pathways-evidence form Sichuan province. Soft Science. Avaialable at: http://kns.cnki.net/kcms/detail/51.1268.G3.20221109.1110.004.html.
Liu, B., Chang, H., Li, Y., and Zhao, Y. (2023). Carbon emissions predicting and decoupling analysis based on the PSO-ELM combined prediction model: evidence from Chongqing Municipality, China. Environ. Sci. Pollut. Res. 30, 78849–78864. doi:10.1007/s11356-023-28022-w
Liu, J., and Ding, X. (2020). Research on LMDI factor decomposition model of carbon emission intensity in China. J. Shandong Technol. Bus. Univ. 34, 37–47.
Liu, M. H., Deng, X. W., Liu, S. N., Li, J., and Sun, M. (2022). Carbon emission analysis of Tianjin city based on LMDI method and Tapio decoupling model. Environ. Pollut. Control 44, 1497–1401.
Liu, Z., Guan, D., Moore, S., Lee, H., Su, J., and Zhang, Q. (2015). Climate policy: Steps to China's carbon peak. Nature 522, 279–281. doi:10.1038/522279a
Long, Y., and Han, C. L. (2020). Transaction processing and value evaluation of carbon emission rights based on wavelet transform image and deep learning. J. Intelligent Fuzzy Syst. 39, 10641246.
Luo, J., Huang, M., and Bai, Y. (2023). Promoting green development of agriculture based on low-carbon policies and green preferences: an evolutionary game analysis. Environ. Dev. Sustain. 2023, 1–28. doi:10.1007/s10668-023-02970-2
Ma, X. J., Chen, R. M., and Dong, B. Y. (2019). Factor decomposition and decoupling effect of China's industrial carbon emissions. China Environ. Sci. 39, 3549–3557.
Mikko, S., Niko, K., Jarkko, T., Kupiainen, K., Sippula, O., and Jokiniemi, J. (2016). Black carbon and fine particle emissions in Finnish residential wood combustion: Emission projections reduction measures and the impact of combustion practices. Atmos. Environ. 140, 495–505. doi:10.1016/j.atmosenv.2016.06.023
Qiaochu, L., Junhua, C., and Jing, H. (2022). Prediction of medium and long-term change trend of regional carbon emission based on the system dynamics-Visual Studio integrated model : a case study of Sichuan Province. Environ. pollut. control 12, 1669–1675. doi:10.15985/j.cnki.1001-3865.2022.12.021
Reema, G. A. (2022). Carbon emissions and electricity generation modeling in Saudi Arabia. Environ. Sci. Pollut. Res. 29, 23169–23179. doi:10.1007/s11356-021-17354-0
Renhou, L., Minglei, D., and Shuhua, W. (2023). Thinking on the scientific and technological guidance of China’s carbon dioxide peak and carbon neutrality by European and American countries. Stud. Sci. Sci. 41, 51–112.
Research Group of National Institute of Development Strategy at Wuhan University (2022). Path choice for China to implement green low-carbon transformation and achieve carbon neutrality. China Soft Sci. 10, 1–12.
Rietbergen, M. G., Van Rheede, A., and Blok, K. (2015). The target-setting process in the CO2 Performance Ladder: does it lead to ambitious goals for carbon dioxide emission reduction? J. Clean. Prod. 103, 549–561. doi:10.1016/j.jclepro.2014.09.046
Song, J. K. (2012). China’s carbon emissions prediction model based on support vector regression. J. China Univ. Petroleum Ed. Nat. Sci. 36, 182–187.
Song, P., Zhang, H. M., and Mao, X. Q. (2022). Research on Chongqing’s carbon emission reduction path towards the goal of carbon peak. China Environ. Sci. 42, 1446–1455.
Sun, W., Wang, C., and Zhang, C. (2017). Factor analysis and forecasting of CO2 emissions in Hebei, using extreme learning machine based on particle swarm optimization. J. Clean. Prod. 162, 1095–1101. doi:10.1016/j.jclepro.2017.06.016
Sun, Y. H., and Yang, G. C. (2020). Factor decomposition and decoupling effect of Chinese tourism-derived carbon emissions. China Environ. Sci. 40, 5531–5539.
Wang, S. J., Mo, H. B., and Fang, C. L. (2022). Carbon emissions dynamic simulation and its peak of cities in the Pearl River Delta Urban Agglomeration. Chin. Sci. Bull. 67, 670–684. doi:10.1360/tb-2021-0681
Xueting, W., and Junbiao, Z. (2022). Basic path and system construction of agricultural green and low-carbon development with respect to the strategic target of carbon peak and carbon neutrality. Chin. J. Eco-Agriculture 4, 516.
Yan, X., and Fang, Y. P. (2015). CO2 emissions and mitigation potential of the Chinese manufacturing industry. J. Clean. Prod. 103, 759–773. doi:10.1016/j.jclepro.2015.01.051
Yu, G. R., Hao, T. X., and Zhu, J. X. (2022). Discussion on Action Strategies of China’s Carbon Peak and Carbon Neutrality. Bull. Chin. Acad. Sci. 37, 423–434.
Yuan, Q., Jinming, F., and Zhongwei, Y. (2020). HCPD-CA: high-resolution climate projection dataset in central Asia. Earth Syst. Sci. Data 14, 2195–2208.
Yuan, Q. T. (2014). Green Low Carbon Leads the Sustainable Development of China’s Petrochemical Industry. Petrochem. Technol. 43, 741–747.
Yue, S. J. (2021). Factor decomposition and scenario prediction of carbon peaking in the Yangtze River Delta urban agglomeration. Guizhou Soc. Sci. 09, 115–124.
Yue, Z., Juntao, Z., and Caiquan, D. (2022). How does green finance affect the low-carbon economy? Capital allocation, green technology innovation and industry structure perspectives. Ekon. Istraživanja 36, 1–23. doi:10.1080/1331677X.2022.2110138
Keywords: double carbon, green and low-carbon transformation of industry, the extend Kaya identity, LMDI decomposition method, scenario prediction method, PSO-ELM model
Citation: Liu B, Chang H, Li Y and Zhao Y (2023) Analysis of influencing factors of industrial green and low-carbon transformation under the background of “double carbon”: evidence from Sichuan province, China. Front. Environ. Sci. 11:1257855. doi: 10.3389/fenvs.2023.1257855
Received: 13 July 2023; Accepted: 29 September 2023;
Published: 10 October 2023.
Edited by:
Otilia Manta, Romanian Academy, RomaniaReviewed by:
Lindong Ma, Zhejiang Normal University, ChinaCopyright © 2023 Liu, Chang, Li and Zhao. This is an open-access article distributed under the terms of the Creative Commons Attribution License (CC BY). The use, distribution or reproduction in other forums is permitted, provided the original author(s) and the copyright owner(s) are credited and that the original publication in this journal is cited, in accordance with accepted academic practice. No use, distribution or reproduction is permitted which does not comply with these terms.
*Correspondence: Yan Li, MzIzOTk5OTFAcXEuY29t
Disclaimer: All claims expressed in this article are solely those of the authors and do not necessarily represent those of their affiliated organizations, or those of the publisher, the editors and the reviewers. Any product that may be evaluated in this article or claim that may be made by its manufacturer is not guaranteed or endorsed by the publisher.
Research integrity at Frontiers
Learn more about the work of our research integrity team to safeguard the quality of each article we publish.