 Thi Thanh Thuy Phan
 Van Viet Nguyen
 Chun-Hung Lee
94% of researchers rate our articles as excellent or good
Learn more about the work of our research integrity team to safeguard the quality of each article we publish.
Find out more
ORIGINAL RESEARCH article
Front. Environ. Sci., 12 October 2023
Sec. Environmental Policy and Governance
Volume 11 - 2023 | https://doi.org/10.3389/fenvs.2023.1243084
This study aims to conduct an importance-performance evaluation framework under the theoretical aspects of adaptive capacity for community-based plastic waste management (CBPWM). Additionally, we identified the matrix of the importance-performance levels of CBPWM, and estimated the community’s adaptive behavior towards CBPWM. The results indicate that residents have a high perception of the importance of all adaptation indicators in CBPWM, but perceive the indicators’ implementation is plagued by poor performance. The respondents emphasize the significance of several adaptation indicators that can enhance the adaptive capacity for CBPWM, namely, “developing waste collection systems”, “building connections between resident associations”, “collaborating among stakeholder’s groups”, “adopting a zero-waste lifestyle”, and “empowering independent waste collectors”. The study also reveals that socioeconomic, perceptual, and behavioral factors related to adaptation indicators impact residents’ willingness to participate in CBPWM strategies. This study is valuable as a starting point for building community adaptive capacity for plastic waste management. It is relevant to addressing both current and future plastic pollution problems in Vietnam, as it is based on actual assessments of the community. Determining the importance and performance of adaptive indicators provides valuable insights for policymakers in developing mechanisms and promoting opportunities for CBPWM.
Plastics have become the predominant commodity globally, and are now found in almost all types of commercial products, with their usage continuing to increase at unprecedented rates around the world (Geyer, 2020). Plastic waste (PW) has been identified as the second-largest waste stream, following food waste (Bukkarapu et al., 2018). As of now, the global production of COVID-19 pandemic-related PW has exceeded eight million tonnes, of which around 25,000 tonnes have been deposited in the world’s oceans (Peng et al., 2021). The convenience of plastic has led to a global crisis in plastic waste management (PWM), as its high durability means it takes hundreds of years to decompose, thus posing a threat to the planet and its ecosystems, both marine and freshwater, across all regions of the world (da Costa et al., 2020; Geyer, 2020). Given these worrying trends, some actions have been implemented to combat PW pollution on a global scale (da Costa et al., 2020). However, the current PWM system appears to be inadequate for keeping up with the relentlessly growing amount of PW being generated.
Like many developing countries, Vietnam faces significant challenges in adopting sustainable PWM practices. Vietnam is among the countries most affected by PW globally, with an annual discharge of approximately 1.8 million tonnes (Jambeck et al., 2015). One of the most significant obstacles to effective PW reduction and management is the lack of community cooperation (Liu et al., 2021). To effectively reduce PW, communities must change and adapt existing practices and behaviors (Liu et al., 2021). However, each community may have different perspectives and require unique PWM strategies. Therefore, a critical concern for policymakers is how to respond to changing circumstances and encourage adaptability to reduce PW.
The ineffective management and disposal of PW have resulted in severe environmental pollution, especially in developing countries with inadequate waste management infrastructure (Rai et al., 2019b; Phan et al., 2022). While various technological solutions have been proposed to mitigate this problem, there is increasing recognition that building the adaptive capacity of local people and communities is essential for long-term success (Armitage, 2005; Jones, 2020). Gallopín (2006) argues that encouraging adaptive capacity is crucial in developing and strengthening waste management strategies that can respond to varying situations. Cinner et al. (2018) indicate that in order to adapt to climate change, we need to focus on five aspects including assets, flexibility, social organizations, learning, and agency. According to Jones (2020), adaptive management is a viable option for waste management. However, to date, no research has examined the factors that contribute to building adaptive capacity and identified strategies that can be implemented to enhance the adaptive capacity of local communities in managing PW.
The Importance-Performance Analysis (IPA) is a valuable evaluation technique that can identify areas requiring immediate attention and improvement, as well as areas of strength (Martilla and James, 1977). This method offers insights into the aspects of a service that significantly influence customer satisfaction and loyalty, as well as the service factors that need improvement to rectify an unsatisfactory situation (Boley et al., 2017). In general waste management, IPA is a tool that can be used to prioritize actions that need to be taken by identifying the importance of different factors and how actions perform against those factors (Bui et al., 2020; Phan et al., 2022). The application of IPA in waste management can assist in identifying the most pressing areas that need to be addressed, and provides a basis for community-led solutions. However, there has been no research conducted to build a conceptual framework of adaptive capacity for PWM using the IPA method, nor has any study compared the significance and effectiveness of adaptation indicators for PWM among urban and rural residents. This study uses the IPA model developed by Martilla and James (1977) to systematically examine how communities perceive adaptive capacity indicators in PWM in Danang. The study’s primary objectives are to i) develop a set of indicators of adaptive capacity to communities in PWM (hereafter referred to as adaptation indicators) through literature review and focus group discussions; ii) assess the community’s perceptions of indicators of adaptive capacity for PWM by rating their importance-performance (I-P) levels; iii) analyze which factors impact community participation using logistic regression models; and iv) build an assessment framework for adaptive capacity indicators in PWM. By adopting an importance-performance analysis and a community-based approach, the results from this study will provide insights into building the adaptive capacity of local people and communities, which can contribute to the development of effective and sustainable solutions to PW pollution.
Danang, situated on Vietnam’s central coastline and considered a primary city of the Central Key Economic Zone, consists of six districts in urban areas and two districts in rural areas (Figure 1), with a population estimated at 1,188,374, as of 2022 (GSO, 2022). Of this population, males account for approximately 576,000, while females make up over 558,000. The city’s population growth and economic expansion have led to a rise in waste production, creating strain on the city’s waste management capabilities, which are currently grappling with 1,100 tonnes of solid waste and 150 tonnes of PW per day (Sara and James, 2020). Currently, Danang lacks a formal system for collecting plastic for recycling, as existing machines and equipment fail to separate dry recyclables from other waste fractions. As a result, potentially recyclable materials become contaminated, making recycling extraction more difficult (Sara and James, 2020; Phan et al., 2022). The city largely operates in a linear manner, disposing of waste without recovering inherent material value. The informal recycling sector (i.e., waste pickers), which numbers between 1,000 and 1,800 people, is responsible for most of the PW recycled in Danang (Sara and James, 2020). While the informal sector contributes significantly to waste management in the city, this impact is limited. Therefore, assessing the adaptive capacity of the community, its importance and performance perceptions toward PWM is of great significance for policymakers and managers.
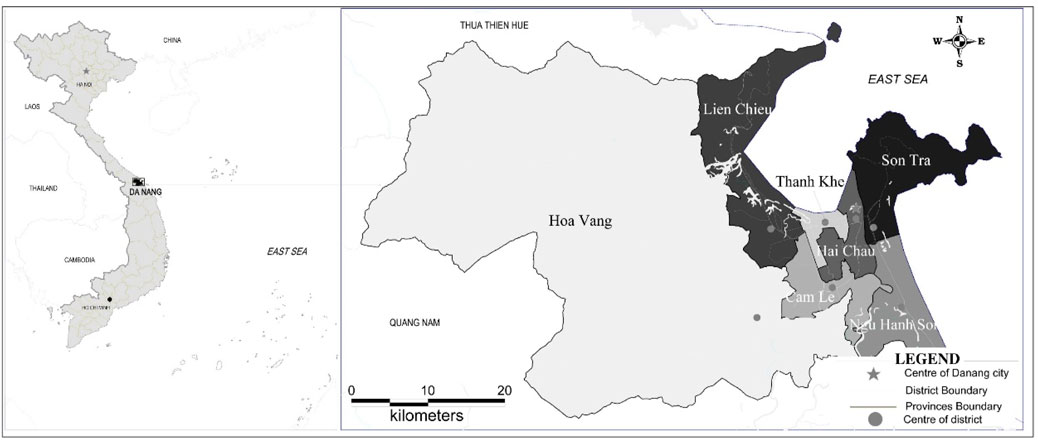
FIGURE 1. Map displaying the study locations [adapted from Phan et al. (2023)].
Adaptation refers to changes in the actions and characteristics of a system that enhance its ability to deal with external stressors (Folke et al., 2003; Cinner et al., 2018). Societies with high adaptability can quickly and efficiently respond to change. Armitage (2005) posits that a society’s ability to adapt depends on its collective capacity to act and resolve conflicts among members, which is a factor heavily influenced by governance. The adaptive capacity of social systems refers to the capability of human actors and communities to adjust to changes while maintaining human wellbeing over time (Smit and Wandel, 2006). Several dimensions have been identified by researchers to evaluate the adaptive capacity of communities, such as managing risks and uncertainties, planning, developing skills in learning and reorganization, having financial and emotional flexibility, and demonstrating a willingness to adapt (Marshall et al., 2012). For environmental management, the adaptive capacity of communities has been evaluated in various sectors, such as water management (Chaffin et al., 2016), natural disasters (Seara et al., 2016), and climate change (Cinner et al., 2018), but no studies have examined the adaptive capacity of residents for PWM. Jones (2020) indicates that the adaptive capacity of residents has been associated with gender, awareness, infrastructure of the area, and social capital for waste management. Based on the five aspects of adaptive capacity outlined by Cinner et al. (2018), combined with documented review and stakeholder interviews, this present study builds a set of ten adaptation indicators to assess the socio-economic conditions, awareness, and adaptive capacity of residents in managing PW (Table 1). The five dimensions of adaptive capacity for PWM are described below.
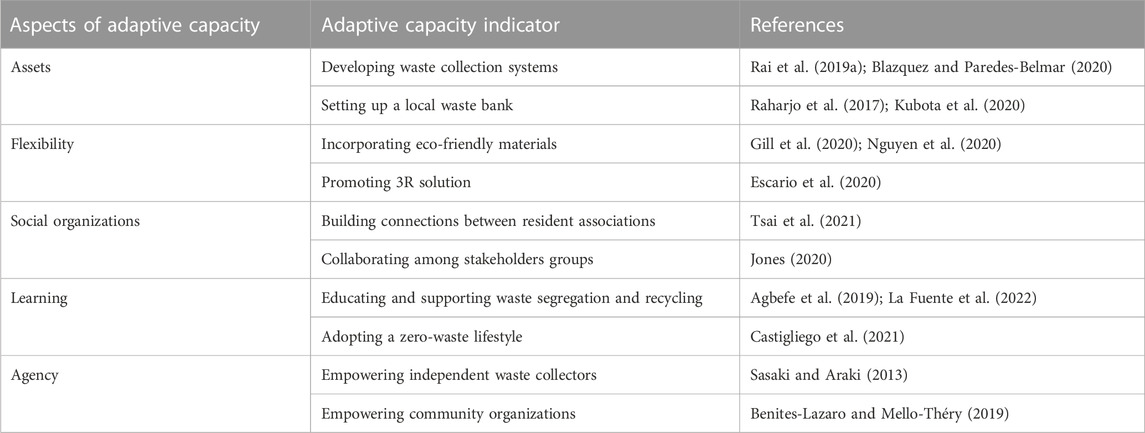
TABLE 1. Adaptive indicators for PWM.
Firstly, assets, which are important resources in waste management, increase the adaptability of individuals and communities to changes in PWM. Assets include developing waste collection systems (Rai et al., 2019a; Blazquez and Paredes-Belmar, 2020) and setting up a local waste bank (Raharjo et al., 2017; Kubota et al., 2020). Secondly, the flexibility of adaptive capacity represents the variety and flexibility of strategies, including policy changes, to mitigate, control, and address any future increases in PW. The flexibility to adapt to PWM refers to incorporating eco-friendly materials (Gill et al., 2020; A. T. Nguyen et al., 2020) and promoting 3R solutions (Wichai-Utcha and Chavalparit, 2019; Escario et al., 2020). Thirdly, social organizations are the domain of adaptive capacity that refers to the cooperation, collective action, and knowledge-sharing for waste management (Jones, 2020). Variables that may be relevant to social organizations in waste management include building connections between resident associations (Tsai et al., 2021) and collaborating among stakeholders groups (Jones, 2020). Fourthly, learning is the capacity of humans to identify changes, attribute them to causal factors, and evaluate potential response strategies based on feedback obtained from evidence (La Fuente et al., 2022). Learning to respond to PW mitigation refers to waste segregation and recycling, and adopting a zero-waste lifestyle (Castigliego et al., 2021). Lastly, according to Jones (2020), adaptive capacity in waste management refers to agency, which is the foundation to create alternative future scenarios when large-scale changes are necessary. Benites-Lazaro and Mello-Théry (2019) and Li et al. (2020) suggest that governments, development agencies, and civil organizations can build social capital by facilitating long-term connections between groups by empowering independent waste collectors and community organizations. This is because waste management is most effective when communities are empowered, have the capacity to mobilize resources, and use participatory planning (Benites-Lazaro and Mello-Théry (2019).
The scores of adaptive indicators show how important (or unimportant) and how well (or poorly) a given household performs regarding adaptive capacity for PWM. These scores can also help to compare which variables are related to the adaptive range of a household, community, or society. Therefore, an adaptive set of indicators may offer a potential approach to improving PWM systems. Based on IPA analysis, we developed a conceptual framework for adaptive capacity in PWM. The framework envisages that adaptability to most effectively reduce and manage waste and exploit opportunities depends on the capacity to adapt. Figure 2 provides a visual representation of the conceptual framework, highlighting the different components addressed in this study.
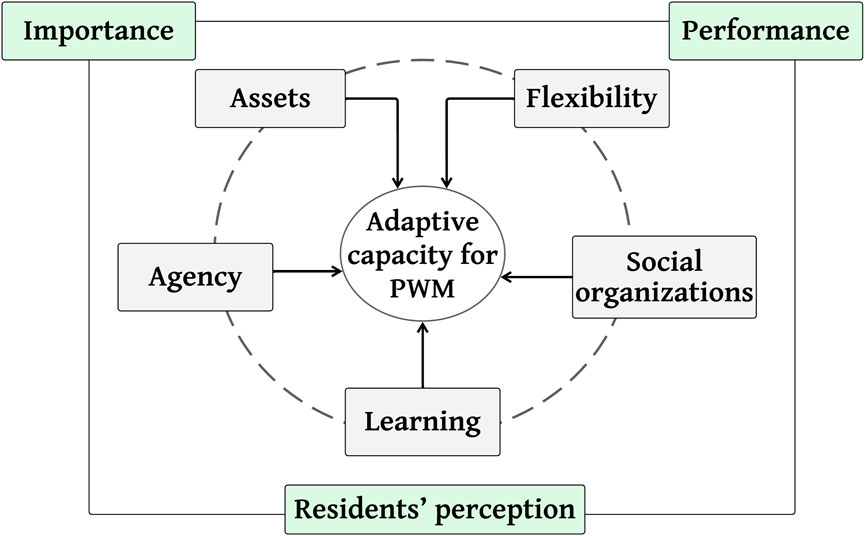
FIGURE 2. Conceptual framework for evaluating the adaptive capacity for PWM.
A questionnaire was developed based on a literature review, focus group interviews with stakeholders, and preliminary findings from a pilot survey with 70 participants on adaptive capacity for PWM. The pilot survey aimed to test the clarity and validity of the questions in the questionnaire. Feedback from the participants was collected to make necessary modifications and improve the usability of the questionnaire. The formal questionnaire consists of three parts, written in Vietnamese language. The first part is a warm-up section that includes basic questions about the residents’ awareness, attitudes, and behaviors towards adaptive capacity for PWM. This part aims to offer an overview of the present state of PW in Danang. The second part includes ten indicators that measure the I-P levels of adaptive capacity for PWM in five dimensions including assets, flexibility, social organizations, learning, and agency (Table 1). A five-point Likert scale is used to evaluate the I-P levels of the adaptive capacity indicators, with scores ranging from 1 (the least important/extremely dissatisfied) to 5 (the most important/strongly agree for performance) (V. V. Nguyen et al., 2021). The final section gathers information about respondents’ socioeconomic characteristics, including gender, marital status, age, education, income, occupation, and place of residence.
The data for this research were obtained via face-to-face interviews that utilized a systematic random sampling method, which is widely regarded as the most dependable technique in IPA studies. Conducting face-to-face interviews has the advantage of allowing the interviewers to clearly explain the adaptive capacity indicators and their I-P to the respondents, which helps them decide whether to participate in answering the questionnaire or not. Ethical considerations were taken into account to ensure the protection of respondents’ dignity, welfare, privacy, and confidentiality. The interviewers visited households in the study area and invited residents to participate in the survey. If they agreed, the interviewer explained the study’s objectives, potential benefits, and questionnaire before starting the survey. A team of enumerators who had received extensive training in ethical criteria conducted the interviews. Sampling was conducted from February to April 2022, and a total of 520 local respondents were selected using simple random sampling techniques for the survey. Vaske (2008) highlighted that a sample size of 400 is generally accepted for achieving population generalization with a confidence level of 95% and a margin of error of ±5% in human dimension studies. A total of 508 completed questionnaires were gathered from those submitted by 520 participants, resulting in a response rate of 97.69%. Only 2.31% of responses were excluded due to incomplete or implausible responses. The study participants were all at least 20 years old and were requested to answer an on-site questionnaire that covered the community’s perceptions of the I-P of adaptive capacity indicators for PWM and the residents’ characteristics.
Upon cleaning the data, they were entered and analyzed with the Statistical Packages for Social Sciences (version 26; SPSS Statistics Inc., Chicago, IL, USA). The data analysis involved three main steps. Initially, a pairwise t-test was executed to conduct a gap analysis with the purpose of identifying the degree of alignment between performance and importance perceptions (Chen et al., 2021; V. V. Nguyen et al., 2021). This is measured as performance minus the importance of indicators. A positive gap indicates that the perceived performance of the indicator was equal to or greater than its perceived importance. Conversely, a negative gap indicates that the indicator’s perceived performance was lower than its perceived importance. Afterward, IPA was carried out using I-P grids to display indicators, as outlined by Martilla and James (1977). The IPA model, illustrated in Figure 3, consists of four quadrants that signify four distinct strategies, with performance depicted on the x-axis and importance on the y-axis. Quadrant A, referred to as “keep indicators well-maintained”, contains indicators with a high level of performance and a high level of importance. The recommended strategy is to maintain the current system. Quadrant B, known as “improvement indicators”, includes indicators with a performance level below the average (low). Focus should be placed on the improvement of the indicators in this quadrant. The low priority C quadrant consists of indicators that residents consider unimportant, and their performance is likewise perceived as low, leading them to be identified as “low-priority indicators”. Improvements in the C quadrant are not given much priority. Quadrant D, known as “possible overkill indicators”, contains indicators with a high-performance rating, however residents do not consider these attributes important enough. Therefore, instead of focusing on this attribute, it is recommended that resources be diverted to other indicators that require them more. An alternative way of categorizing attributes is to use an upward diagonal line at a 45-degree angle, known as an ‘iso-rating’ or ‘iso-priority’ line, to designate management priorities. Items that fall directly on the line suggest that their level of performance matches their level of importance. However, items positioned above the line suggest that their performance is inadequate in relation to their level of importance and require improvement (Bacon, 2003; Boley et al., 2017; Ahmed, 2021).

FIGURE 3. The importance–performance analysis matrix (Adapted from Ahmed, 2021; Martilla and James, 1977).
Finally, the study assessed the influence of socioeconomic factors (i.e., income), the connection among social organizations, assets (i.e., infrastructure), flexibility (i.e., 3R, eco-friendly solutions), community empowerment, perceived I-P of adaptation indicators affected residents’ willingness to participate (WTP) in adaptation strategies for PWM. Respondent’s income levels were classified into two groups: those with monthly income less than 7,000,000 VND (approximately 296 USD) and those with income equal to or exceeding 7,000,000 VND. The study constructed two models to assess the community’s behavior regarding adaptation indicators for PWM. The first model had “WTP in adaptation strategies for PWM” as the dependent variable and included independent variables such as income, awareness, and attitudes towards PW, as well as the overall mean of the perceived importance of adaptive capacity indicators for PWM. The second model included all variables from the first model, but with the overall mean of adaptive capacity indicator performance in PWM replacing the overall mean of perceived importance. The overall mean of perceived importance and performance of adaptive capacity indicators were included as quantitative variables in both models, while the remaining variables were nominal.
The socio-demographic characteristics of the respondents’ identities are summarized in Table 2. Among the 508 interviewees, males made up 53.5% of the sample, while females accounted for 46.5%. The sample only included people over the age of 20, with more than half (53.1%) aged between 20 and 39, while 32.3% were aged between 40 and 59, and only 14.6% were over 60 years old. In terms of education, more than half (54.7%) of the total respondents had a university degree or above, while 26.2% had vocational education, and only 19.1% had upper secondary education or below. The average income question in this study revealed that 69.5% of households earned less than 7 million per month, while the remaining 30.5% earned more than 7 million per month. Regarding awareness of adaptive capacity for PWM, only 23.6% of respondents indicated that PWM solutions were flexible, and 38.4% indicated that the PWM infrastructure met their requirements. The majority of respondents (66.7%) agreed with empowering community organizations to participate in PWM, and 80.9% expressed WTP in adaptive capacity indicators to manage PW.
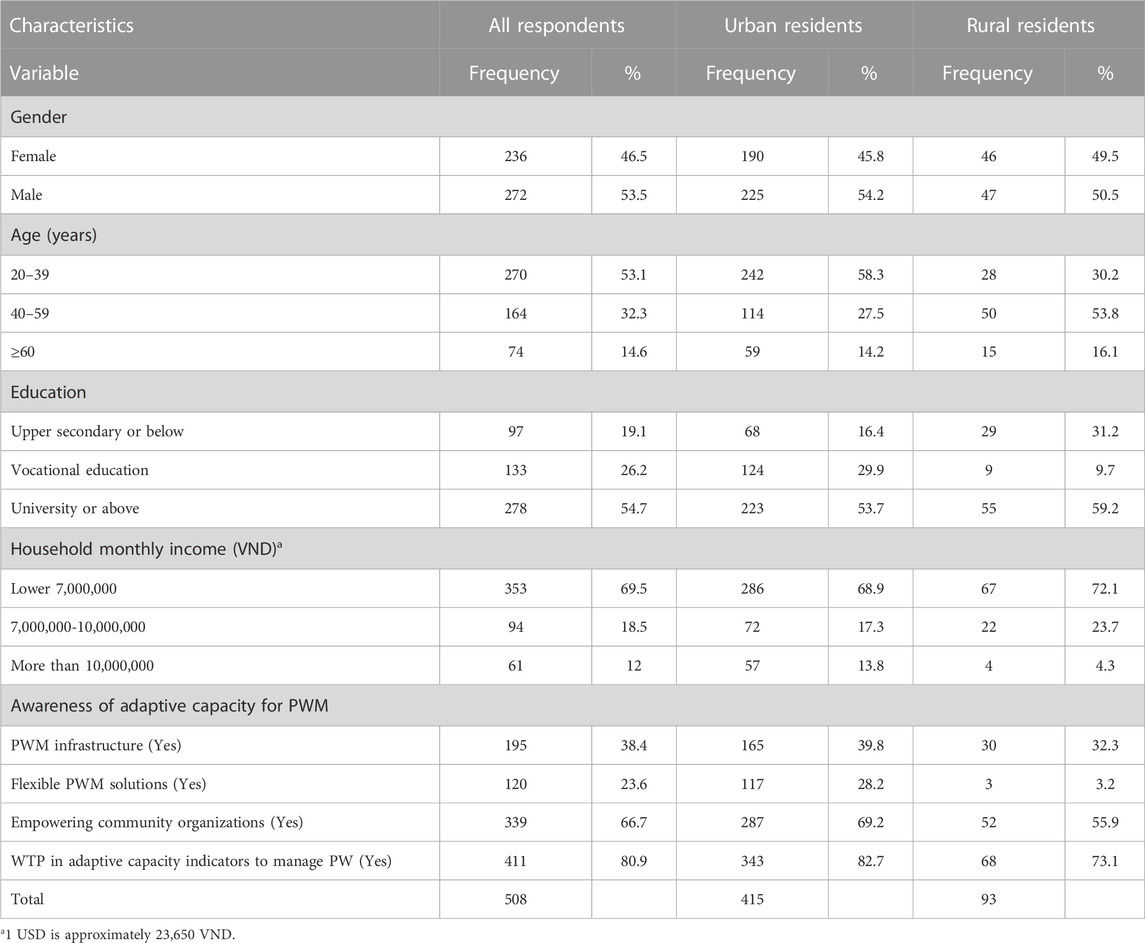
TABLE 2. Respondents’ demographic profile.
Figure 4 illustrates that the overall mean scores for the importance of adaptation indicators in PWM ranged from a high of 4.45 to a low of 3.86. Notably, all respondents indicated a high level of importance for all adaptation indicators in PWM. Nevertheless, they claimed that these indicators are performing poorly.
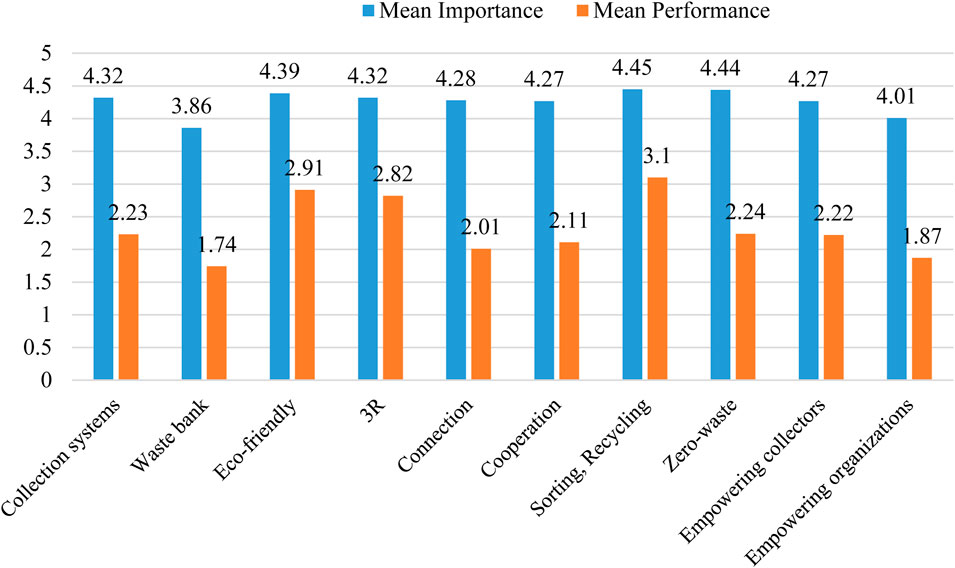
FIGURE 4. Overall differences in importance and performance of adaptive capacity for PWM.
The result in Table 3 displays the average I-P scores for the ten studied items and the paired-sample t-tests for the mean differences between I-P. Based on the table, both urban and rural residents attributed significant importance to all adaptation indicators related to PWM, with an overall mean of 4.27 and 4.20, respectively. However, they noted that these indicators were not performing well, with an overall mean of 2.34 and 2.28 for urban and rural residents, respectively. Among the indicators, the “building connections between resident associations” indicator had the highest mean I-P gap for urban and rural residents at 2.26 and 2.31, respectively, while the “educating and supporting waste segregation and recycling” indicator had the lowest mean I-P gap at 1.34 and 1.37 for urban and rural residents, respectively.

TABLE 3. Results of IPA between urban and rural residents.
The urban residents rated “educating and supporting waste segregation and recycling” and “adopting a zero-waste lifestyle” as highly important (M = 4.46), while the “setting up a local waste bank” was rated as the least important (M = 3.88). Similarly, urban residents rated “educating and supporting waste segregation and recycling” as highly performing (M = 3.12), while the “setting up a local waste bank” was rated as the lowest performing (M = 1.75). On the other hand, with the same set of items, rural residents rated “incorporating eco-friendly materials” as highly important (M = 4.43), and “educating and supporting waste segregation and recycling” as highly performing (M = 3.02). Conversely, rural residents rated “setting up a local waste bank” as the least important (M = 3.76) and lowest performing (M = 1.69).
Table 3 also shows that the paired-sample t-tests indicate significant differences between the importance and performance levels of all adaptation indicators in PWM. This means that there are significant gaps between the I-P scores of all adaptation indicators, indicating the need to improve their performance. The results of the ANOVA analysis (see Supplementary Appendix SA1) also demonstrate that the main factors affecting the performance of adaptation indicators are the connections between stakeholders and the empowerment of community organizations.
As stated in the methodology section, the positioning of the crosshairs on the I-P grid did not rely on the midpoint or average values of the raw scores. Instead, we utilized the mean discrepancies between the raw scores for importance or performance and their corresponding means (which were set at 0) to determine the placement of the crosshairs. All respondents indicated that five items might be perceived to perform well, as they fell below the iso-rating line (i.e., incorporating eco-friendly materials, promoting 3R solutions, educating and supporting waste segregation and recycling, setting up a local waste bank, and empowering community organizations), while the five items located above the line require further attention and improvement (i.e., developing waste collection systems, building connections between resident associations, collaborating among stakeholders groups, adopting a zero-waste lifestyle, and empowering independent waste collectors) (see Figure 5).
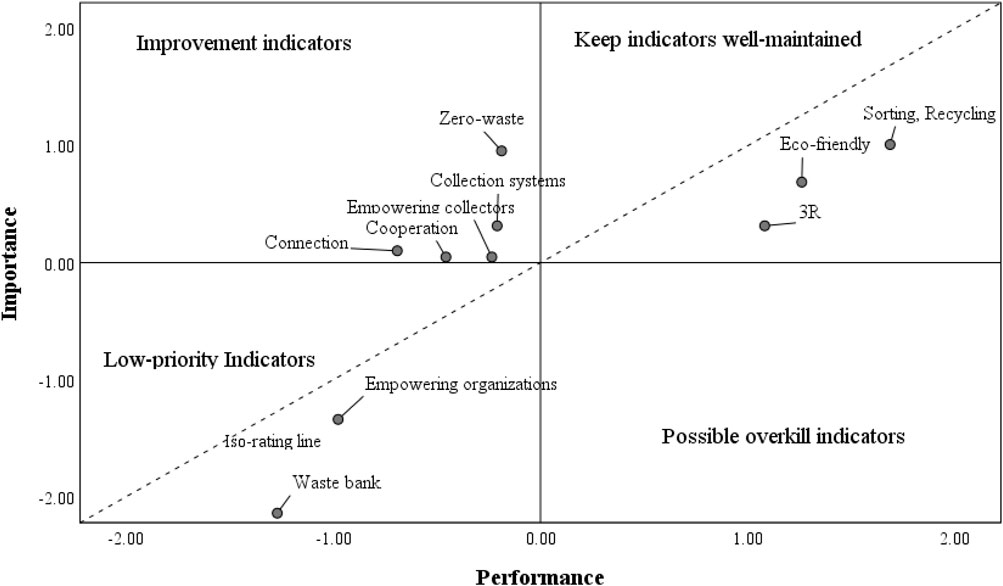
FIGURE 5. The I-P plot of the 10 adaptive indicators for PWM.
Moreover, based on the four quadrants, all respondents indicated that three items (i.e., incorporating eco-friendly materials, promoting 3R solutions, and educating and supporting waste segregation and recycling) were in the quadrant representing “keep indicators well-maintained”, while the items “developing waste collection systems”, “building connections between resident associations”, “collaborating among stakeholders groups”, “adopting a zero-waste lifestyle”, and “empowering independent waste collectors” were located in the quadrant representing “improvement indicators”. Finally, two items, “setting up a local waste bank” and “empowering community organizations” were located in the “low-priority indicators” grid (Figure 5).
The results in Figure 6 show that rural respondents rated all six items as performing well below the iso-rating line, while urban residents rated five of six items as performing well. Conversely, rural residents have four items and urban residents have five items positioned above the iso-rating line, indicating that the performance of these attributes is inadequate relative to their level of importance. Therefore, improvement of these indicators is necessary.
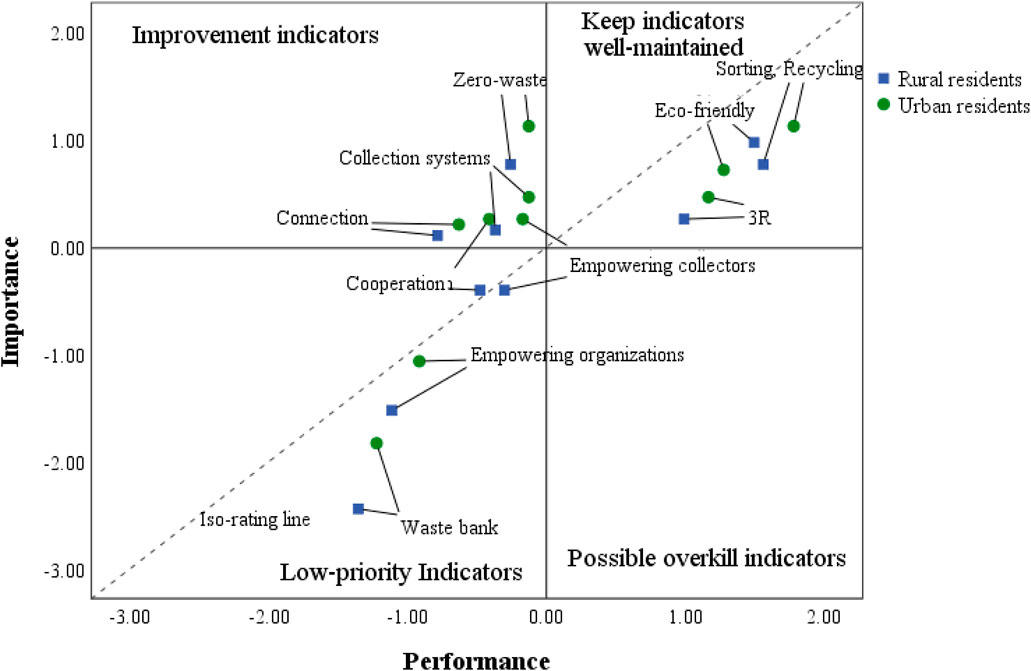
FIGURE 6. I-P plot of adaptive capacity for PWM between urban and rural residents.
Additionally, a visual examination of the rating grid plots representing the adaptive capacity indicators for PWM is displayed in Figure 6. Three items, namely, “incorporating eco-friendly materials”, “promoting 3R solutions”, and “educating and supporting waste segregation and recycling” were positioned in Quadrant A (keep indicators well-maintained), indicating that both urban and rural groups have similar perceptions of these indicators. This suggests that maintaining their current level of performance is critical to achieving sustainable PWM in Vietnam. Three items were rated as falling within Quadrant B (improvement indicators) by both urban and rural residents: “developing waste collection systems”, “building connections between resident associations”, and “adopting a zero-waste lifestyle”. Meanwhile, the items “setting up a local waste bank” and “empowering community organizations” were in Quadrant C (low-priority indicators) for both urban and rural residents. It is noteworthy that the urban and rural residents rated the items “collaborating among stakeholder’s groups” and “empowering independent waste collectors” differently. Urban residents perceived these indicators to be in the “improvement indicators” quadrant, while rural residents rated them as falling into the “low-priority indicators” quadrant.
The attitudes and actions of residents towards adaptive capacity indicators for PWM may contribute to improving waste management practices in Vietnam. To determine how residents are likely to respond to adaptation strategies, this study used their WTP in adaptation strategies for PWM as the dependent variable, while their socio-economic characteristics and the overall I-P means of PWM adaptation indicators were used as independent variables. Two logistic regression models were developed based on these variables, and the results are shown in Table 4.
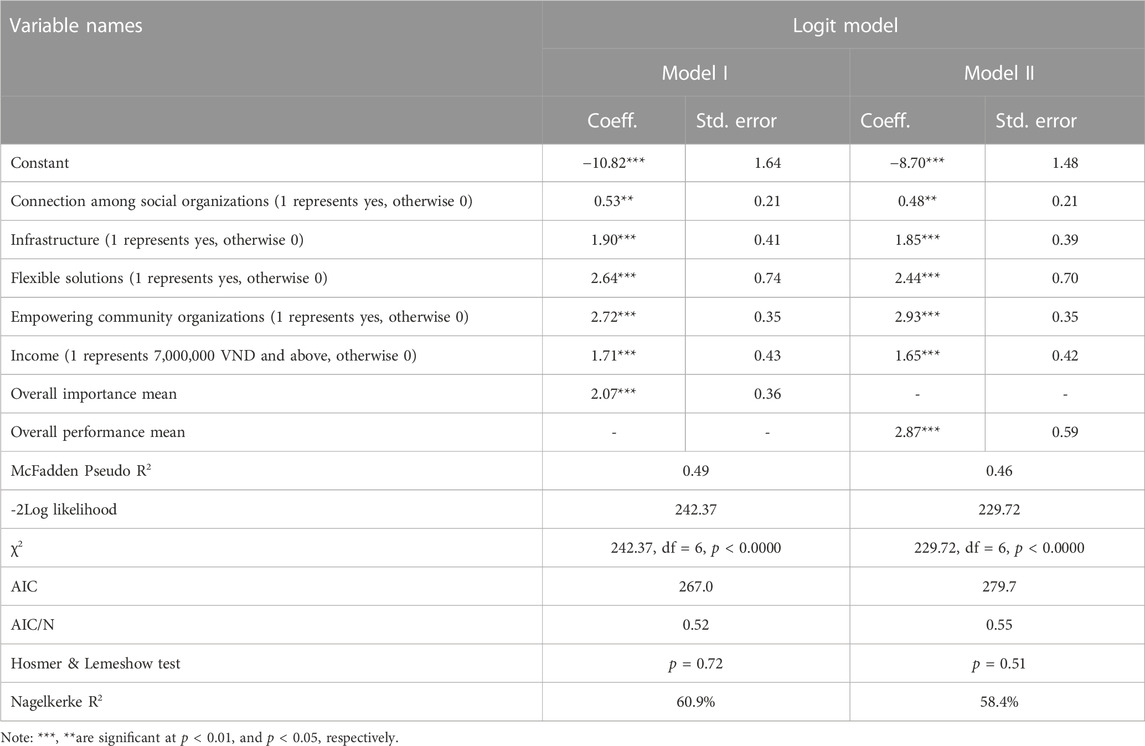
TABLE 4. Residents’ perception of adaptation behavior for PWM.
Both models revealed that six variables positively correlate with participation behavior (see Table 4). This means that these factors have a significant impact on the residents’ WTP in adaptation strategies for PWM. Considering the coefficients of the variables in both models, we found that the factor of empowering community organizations had the greatest impact on residents’ WTP for adaptation strategies in PWM, followed by flexible solutions, the overall mean I-P, infrastructure, income, and the connection among social organizations. Table 4 shows that Chi-square value is highly significant in the two models, with values of 242.37 and 229.72, df = 6, p < 0.0000, respectively, indicating both models produced reliable results within the model specifications for residents’ participation behavior in PWM adaptation indicators. The Akaike information criterion (AIC) of the two models demonstrated favorable and acceptable results. With regard to the Nagelkerke R2, the values for two models equal 0.609 and 0.584, respectively, suggesting that the two models explain 60.9% and 58.4% of the variation in results, respectively. Moving on to the Hosmer and Lemeshow test of goodness of fit, this indicates that both models are a good fit for the data with p-values of 0.72 and 0.51, respectively, which are much greater than the significance level of 0.05.
This study utilized the IPA approach to develop a conceptual framework for community-based PWM adaptive capacity. The results identify three main issues to be discussed regarding respondents’ differing perspectives on adaptive capacity in PWM.
The first main finding is that all respondents acknowledged the importance of adaptation indicators for PWM, but they perceived that the performance of these indicators did not meet their standards of importance. In fact, Table 3 indicates the presence of P-I gaps for all adaptation indicators, indicating that improvements are needed, as the performance of these crucial indicators was lower than their perceived importance. Addressing these concerns should be prioritized to enhance adaptive capacity for PWM. Rural residents deemed these indicators less important than their urban counterparts, but they reported higher satisfaction with their performance, as evidenced by their perceptions of PWM adaptation indicators shown in Table 3.
Secondly, the results of the IPA analysis indicate that five out of the ten adaptation indicators fall below the iso-rating line, suggesting that their performance may be perceived as good (Figures 5, 6). Three indicators in the “keep indicators well-maintained” quadrant were identified by urban and rural residents, as well as by all respondents, as being very important to the community and stakeholders. These indicators are currently being satisfactorily addressed by current efforts and are already being performed well by the community and managers. They need to be maintained or enhanced to continue the reduction of PW. By being responsive to communities’ needs and expectations, the responsible organizations can continue to build trust and credibility, ensuring that PWM efforts remain effective over the long term. This finding aligns with previous studies that have identified “incorporating eco-friendly materials”, “promoting 3R solution”, and “educating and supporting waste segregation and recycling” as good adaptation indicators to reduce the negative impact of plastic on the environment (Gill et al., 2020; Nguyen et al., 2020; La Fuente et al., 2022). Simultaneously, to adapt to changes in PWM, the implementation of these indicators requires a concerted effort from individuals, businesses, and governments (Wichai-Utcha and Chavalparit, 2019; Escario et al., 2020). Meanwhile, the “improvement indicators” quadrant includes three indicators: “adopting a zero-waste lifestyle”, “developing waste collection systems”, and “building connections between resident associations”. This quadrant suggests that the organizations responsible for PWM should focus on these areas of high importance to stakeholders, but are currently underperforming. By doing so, an organization can address community and stakeholder needs and expectations, which can enhance its reputation, build trust, and increase support for adaptive capacity in PWM (Rai et al., 2019a; Jones, 2020; Tsai et al., 2021). Lastly, the “low-priority indicators” quadrant includes the indicators “setting up a local waste bank” and “empowering community organizations”. These indicators are rated low in importance by the community and also perform poorly in terms of meeting their needs or expectations. This indicates areas where resources can be re-allocated to more pressing concerns or where improvement efforts may not be necessary. However, it is important to note that even “low-priority indicators” of PWM should not be entirely neglected, as these aspects may still be important to some stakeholders or have an impact on the overall success of the management efforts, as suggested by Deng and Pierskalla (2018) and Phan et al. (2022).
Noticeably, two indicators are rated as quadrant B (improvement indicators) by urban residents, while those rated by rural residents are located in quadrant C (low-priority indicators) (Figure 6). This indicates that urban residents perceive two indicators, namely, “collaborating among stakeholder groups” and “empowering independent waste collectors”, as important but underperforming, whereas rural residents consider these indicators to be of lesser importance and also performing poorly. Based on these findings, it is recommended that local authorities in urban regions prioritize and allocate additional resources toward improving these indicators. In fact, “collaborating among stakeholder groups” is limited in Vietnam (Phan et al., 2022). Therefore, by collaborating among these stakeholder groups, a more comprehensive and coordinated approach to PWM can be developed (Tsai et al., 2021). This can lead to the implementation of more effective policies, the adoption of more sustainable practices, and the creation of innovative solutions for reducing PW. Collaborating among stakeholder groups can help build greater awareness and understanding of the issue(s) and encourage more widespread participation and action toward addressing the problem of PW (Jones, 2020; Kubota et al., 2020). In addition, independent waste collectors do not have a say in society, but they play a crucial role in waste management in Vietnam (Sara and James, 2020). Thus, “empowering independent waste collectors” is important to ensure that they are provided with safe working conditions, tools, resources, and the knowledge they need to improve their livelihoods while also promoting sustainable waste management practices. Finally, it is remarkable that in this study, none of the indicators fell into the D quadrant (possible overkill indicators). This indicates that, in our study, there were no adaptation indicators that residents considered to be less important yet performing well.
Lastly, the results of the logit model revealed that residents who had higher income, were interested in empowering community organizations, attached a higher rating to the importance or performance of adaptation indicators, preferred flexible solutions, expected infrastructure improvement, and were concerned about the connection among social organizations were significantly more likely than other respondents to participate in adaptation strategies for PWM. This finding supports previous research by Huynh et al. (2022), who stated that residents with higher incomes are more likely to engage in waste reduction campaigns. Furthermore, our results also confirm the importance of living conditions, income, and infrastructure as incentives for people to mitigate PW, as discussed in previous studies by Rai et al. (2019a) and Jones (2020). According to Jones (2020), connections among social organizations can raise awareness, mobilize communities, and advocate for policies and practices that promote sustainable PWM. Trust and social cohesion within communities can also play an important role in helping people support each other in managing PW (Tsai et al., 2021; Huynh et al., 2022). Connections across communities can act as a source of social capital that can support adaptation in the context of waste management. Environmental managers and policymakers can use this information to design a platform that encourages residents’ engagement based on the adaptive capacity indicators of the I-P, as well as residents’ socioeconomic backgrounds. Therefore, residents with a higher level of awareness are expected to be more likely to adapt to PWM. Overall, identifying indicators in the IPA quadrants can help Danang develop accurate strategic plans, thereby facilitating effective improvements to their adaptive capacity for PWM.
The key contribution of this study is to evaluate the adaptive capacity of a community in terms of PWM, to compare urban and rural residents’ perceptions, and to understand the determinants of residents’ perceptions and their adaptive behavior towards PWM. Through a literature review, we identified ten essential indicators of adaptive capacity for managing PW. Subsequently, we formulated a structured questionnaire and collected responses from 508 residents of Danang, Vietnam. Using IPA and logistic regression modeling, we determined the adaptation indicators that were both highly regarded and effective in PWM. The results of the IPA grids show that adaptive capacity for PWM entails a dual challenge. To develop efficient and practical solutions, it is necessary to address the weaknesses and underperforming attributes of adaptation indicators, while taking into consideration the perspectives of different respondents. These indicators included “developing waste collection systems”, “building connections between resident associations”, “collaborating among stakeholder’s groups”, “adopting a zero-waste lifestyle”, and “empowering independent waste collectors”. Furthermore, this study examines the factors that influence residents’ WTP in adaptive capacity for PWM, taking into account their social backgrounds, perceptions, and behaviors regarding adaptation indicators. The findings suggest that residents would benefit from receiving guidelines and action plans to assist them in making well-informed choices and evaluating the sustainability of PWM activities. In addition, responsible authorities should engage with community residents to enhance management quality, promote adaptation, foster social connections, and increase transparency and accountability in this domain.
Nevertheless, this study has its limitations. Firstly, the adaptation indicators are based on interviews and expert consensus. Therefore, it is advisable to include additional technical validity assessments in future research to mitigate potential biases that could affect the final results. Secondly, to contribute more to the scholarly literature, future research should conduct comprehensive investigations across various cities or countries. This approach would allow for comparisons between academic findings and practical outcomes, considering that the current study is limited to Da Nang City, Vietnam.
The raw data supporting the conclusion of this article will be made available by the authors, without undue reservation.
TT contributed to the conception and design, theoretical framework formulation, data collection, data analysis, and writing of the manuscript. C-HL was responsible for the conceptualization, methodology, software, writing–review and editing. VN contributed to the data analysis and edited the manuscript. All authors contributed to the article and approved the submitted version.
This work was supported by the Ministry of Science and Technology, Taiwan (grant number 109-2628-M-259 -001-MY3; 108-2410-H-259-042).
The first author thanks the Ministry of Science and Technology, Taiwan, for providing the funding for this study. The author would like to specially thank all members of the interview team who helped us to collect data during the survey. We also thank the experts, managers and researchers who took their time to respond to the interviews and questionnaires.
The authors declare that the research was conducted in the absence of any commercial or financial relationships that could be construed as a potential conflict of interest.
All claims expressed in this article are solely those of the authors and do not necessarily represent those of their affiliated organizations, or those of the publisher, the editors and the reviewers. Any product that may be evaluated in this article, or claim that may be made by its manufacturer, is not guaranteed or endorsed by the publisher.
The Supplementary Material for this article can be found online at: https://www.frontiersin.org/articles/10.3389/fenvs.2023.1243084/full#supplementary-material
Agbefe, L. E., Lawson, E. T., and Yirenya-Tawiah, D. (2019). Awareness on waste segregation at source and willingness to pay for collection service in selected markets in Ga West Municipality, Accra, Ghana. J. Material Cycles Waste Manag. 21 (4), 905–914. doi:10.1007/s10163-019-00849-x
Ahmed, H. O. K. (2021). How to use importance-performance analysis (IPA)-based SWOT analysis as a new quantitative methodology for developing actual strategic plans in universities. SN Soc. Sci. 1 (1), 32. doi:10.1007/s43545-020-00039-9
Armitage, D. (2005). Adaptive capacity and community-based natural resource management. Environ. Manag. 35 (6), 703–715. doi:10.1007/s00267-004-0076-z
Bacon, D. R. (2003). A comparison of approaches to importance-performance analysis. Int. J. Mark. Res. 45 (1), 1–15. doi:10.1177/147078530304500101
Benites-Lazaro, L., and Mello-Théry, N. (2019). Empowering communities? Local stakeholders’ participation in the clean development mechanism in Latin America. World Dev. 114, 254–266. doi:10.1016/j.worlddev.2018.10.005
Blazquez, C., and Paredes-Belmar, G. (2020). Network design of a household waste collection system: a case study of the commune of Renca in Santiago, Chile. Waste Manag. 116, 179–189. doi:10.1016/j.wasman.2020.07.027
Boley, B. B., McGehee, N. G., and Hammett, A. T. (2017). Importance-performance analysis (IPA) of sustainable tourism initiatives: the resident perspective. Tour. Manag. 58, 66–77. doi:10.1016/j.tourman.2016.10.002
Bui, T.-D., Tsai, F. M., Tseng, M.-L., Wu, K.-J., and Chiu, A. S. F. (2020). Effective municipal solid waste management capability under uncertainty in Vietnam: utilizing economic efficiency and technology to foster social mobilization and environmental integrity. J. Clean. Prod. 259, 120981. doi:10.1016/j.jclepro.2020.120981
Bukkarapu, K. R., Gangadhar, D. S., Jyothi, Y., and Kanasani, P. (2018). Management, conversion, and utilization of waste plastic as a source of sustainable energy to run automotive: a review. Energy Sources, Part A Recovery, Util. Environ. Eff. 40 (14), 1681–1692. doi:10.1080/15567036.2018.1486898
Castigliego, J. R., Pollack, A., Cleveland, C. J., and Walsh, M. J. (2021). Evaluating emissions reductions from zero waste strategies under dynamic conditions: a case study from Boston. Waste Manag. 126, 170–179. doi:10.1016/j.wasman.2021.02.026
Chaffin, B. C., Shuster, W. D., Garmestani, A. S., Furio, B., Albro, S. L., Gardiner, M., et al. (2016). A tale of two rain gardens: barriers and bridges to adaptive management of urban stormwater in Cleveland, Ohio. J. Environ. Manag. 183, 431–441. doi:10.1016/j.jenvman.2016.06.025
Chen, H.-C., Tseng, T.-P., Cheng, K., Sriarkarin, S., Xu, W., Ferdin, A. E., et al. (2021). Conducting an evaluation framework of importance-performance analysis for sustainable forest management in a rural area. Forests 12 (10), 1357. doi:10.3390/f12101357
Cinner, J. E., Adger, W. N., Allison, E. H., Barnes, M. L., Brown, K., Cohen, P. J., et al. (2018). Building adaptive capacity to climate change in tropical coastal communities. Nat. Clim. Change 8 (2), 117–123. doi:10.1038/s41558-017-0065-x
da Costa, J. P., Mouneyrac, C., Costa, M., Duarte, A. C., and Rocha-Santos, T. (2020). The role of legislation, regulatory initiatives and guidelines on the control of plastic pollution. Front. Environ. Sci. 8, 104. doi:10.3389/fenvs.2020.00104
Deng, J., and Pierskalla, C. D. (2018). Linking importance–performance analysis, satisfaction, and loyalty: a study of Savannah, GA. Sustainability 10 (3), 704. doi:10.3390/su10030704
Escario, J.-J., Rodriguez-Sanchez, C., and Casaló, L. V. (2020). The influence of environmental attitudes and perceived effectiveness on recycling, reducing, and reusing packaging materials in Spain. Waste Manag. 113, 251–260. doi:10.1016/j.wasman.2020.05.043
Folke, C., Colding, J., and Berkes, F. (2003). Synthesis: building resilience and adaptive capacity in social-ecological systems. Navigating social-ecological Syst: Build. Resil. Complex. change 9 (1), 352–387.
Gallopín, G. C. (2006). Linkages between vulnerability, resilience, and adaptive capacity. Glob. Environ. change 16 (3), 293–303. doi:10.1016/j.gloenvcha.2006.02.004
Geyer, R. (2020). “Production, use, and fate of synthetic polymers,” in Plastic waste and recycling (Elsevier), 13–32.
Gill, M. B., Jensen, K. L., Lambert, D. M., Upendram, S., English, B. C., Labbé, N., et al. (2020). Consumer preferences for eco-friendly attributes in disposable dinnerware. Resour. Conservation Recycl. 161, 104965. doi:10.1016/j.resconrec.2020.104965
GSO (2022). Statistical yearbook of Danang. Retrieved from Statistical publishing house https://hcma3.hcma.vn/content/tintuc/Lists/News/Attachments/49921/NIEN%20GIAM%20THONG%20KE%20TP%20DA%20NANG%202020.pdf.
Huynh, X. T. D., Khong, T. D., Loch, A., and Khai, H. V. (2022). Solid waste management program in developing countries: contingent valuation methodology versus choice experiment. Environ. Dev. Sustain., 1–23. doi:10.1007/s10668-022-02572-4
Jambeck, J. R., Geyer, R., Wilcox, C., Siegler, T. R., Perryman, M., Andrady, A., et al. (2015). Plastic waste inputs from land into the ocean. Science 347 (6223), 768–771. doi:10.1126/science.1260352
Jones, S. (2020). Waste management in Australia is an environmental crisis: what needs to change so adaptive governance can help? Sustainability 12 (21), 9212. doi:10.3390/su12219212
Kubota, R., Horita, M., and Tasaki, T. (2020). Integration of community-based waste bank programs with the municipal solid-waste-management policy in Makassar, Indonesia. J. Material Cycles Waste Manag. 22 (3), 928–937. doi:10.1007/s10163-020-00969-9
La Fuente, C. I., Tribst, A. A., and Augusto, P. E. (2022). Knowledge and perception of different plastic bags and packages: a case study in Brazil. J. Environ. Manag. 301, 113881. doi:10.1016/j.jenvman.2021.113881
Li, G., Kou, C., Wang, Y., and Yang, H. (2020). System dynamics modelling for improving urban resilience in Beijing, China. Resour. Conserv. Recycl. 161, 104954. doi:10.1016/j.resconrec.2020.104954
Liu, C., Nguyen, T. T., and Ishimura, Y. (2021). Current situation and key challenges on the use of single-use plastic in Hanoi. Waste Manag. 121, 422–431. doi:10.1016/j.wasman.2020.12.033
Martilla, J. A., and James, J. C. (1977). Importance-performance analysis. J. Mark. 41 (1), 77–79. doi:10.1177/002224297704100112
Marshall, N. A., Park, S. E., Adger, W. N., Brown, K., and Howden, S. M. (2012). Transformational capacity and the influence of place and identity. Environ. Res. Lett. 7 (3), 034022
Nguyen, A. T., Parker, L., Brennan, L., and Lockrey, S. (2020). A consumer definition of eco-friendly packaging. J. Clean. Prod. 252, 119792. doi:10.1016/j.jclepro.2019.119792
Nguyen, V. V., Phan, T. T. T., Ferdin, A. E., and Lee, C.-H. (2021). Conducting importance–performance analysis for human–elephant conflict management surrounding a national park in Vietnam. Forests 12 (11), 1458. doi:10.3390/f12111458
Peng, Y., Wu, P., Schartup, A. T., and Zhang, Y. (2021). Plastic waste release caused by COVID-19 and its fate in the global ocean. Proc. Natl. Acad. Sci. 118 (47), e2111530118. doi:10.1073/pnas.2111530118
Phan, T. T. T., Nguyen, V. V., Nguyen, H. T. T., Chen, Y.-J., and Lee, C.-H. (2023). Evaluating citizens’ willingness to participate in hypothetical scenarios towards sustainable plastic waste management. Environ. Sci. Policy 148, 103543
Phan, T. T. T., Nguyen, V. V., Nguyen, H. T. T., and Lee, C.-H. (2022). Integrating citizens’ importance-performance aspects into sustainable plastic waste management in Danang, Vietnam. Sustainability 14 (16), 10324. doi:10.3390/su141610324
Raharjo, S., Matsumoto, T., Ihsan, T., Rachman, I., and Gustin, L. (2017). Community-based solid waste bank program for municipal solid waste management improvement in Indonesia: a case study of Padang city. J. Material Cycles Waste Manag. 19 (1), 201–212. doi:10.1007/s10163-015-0401-z
Rai, R. K., Bhattarai, D., and Neupane, S. (2019a). Designing solid waste collection strategy in small municipalities of developing countries using choice experiment. J. Urban Manag. 8 (3), 386–395. doi:10.1016/j.jum.2018.12.008
Rai, R. K., Nepal, M., Khadayat, M. S., and Bhardwaj, B. (2019b). Improving municipal solid waste collection services in developing countries: a case of Bharatpur metropolitan city, Nepal. Sustainability 11 (11), 3010. doi:10.3390/su11113010
Sara, M., and James, L. W. (2020). Behavior change in local systems to mitigate ocean plastic pollution. Accessed https://urban-links.org/wp-content/uploads/5-15-2020_MWRP-case-study.pdf.
Sasaki, S., and Araki, T. (2013). Employer–employee and buyer–seller relationships among waste pickers at final disposal site in informal recycling: the case of Bantar Gebang in Indonesia. Habitat Int. 40, 51–57. doi:10.1016/j.habitatint.2013.02.003
Seara, T., Clay, P. M., and Colburn, L. L. (2016). Perceived adaptive capacity and natural disasters: a fisheries case study. Glob. Environ. change 38, 49–57. doi:10.1016/j.gloenvcha.2016.01.006
Smit, B., and Wandel, J. (2006). Adaptation, adaptive capacity and vulnerability. Glob. Environ. change 16 (3), 282–292.
Tsai, F.-M., Bui, T. D., Tseng, M.-L., Lim, M. K., Wu, K.-J., and Mashud, A. H. M. (2021). Assessing a hierarchical sustainable solid waste management structure with qualitative information: policy and regulations drive social impacts and stakeholder participation. Resour. Conserv. Recycl. 168, 105285. doi:10.1016/j.resconrec.2020.105285
Vaske, J. J. (2008). Survey research and analysis: applications in parks, recreation and human dimensions. Stage College, PA, USA: Venture Publishing, Inc. ISBN 9781892132796.
Keywords: adaptive capacity, community participation, community engagement, empowering community organizations, importance-performance analysis
Citation: Thuy Phan TT, Nguyen VV and Lee C-H (2023) Establishing an importance-performance evaluating framework under integrating adaptive capacity for community-based plastic waste management. Front. Environ. Sci. 11:1243084. doi: 10.3389/fenvs.2023.1243084
Received: 20 June 2023; Accepted: 29 September 2023;
Published: 12 October 2023.
Edited by:
Shashi Arya, Imperial College London, United KingdomReviewed by:
Sunil Kumar, Academy of Scientific and Innovative Research (AcSIR), IndiaCopyright © 2023 Thuy Phan, Nguyen and Lee. This is an open-access article distributed under the terms of the Creative Commons Attribution License (CC BY). The use, distribution or reproduction in other forums is permitted, provided the original author(s) and the copyright owner(s) are credited and that the original publication in this journal is cited, in accordance with accepted academic practice. No use, distribution or reproduction is permitted which does not comply with these terms.
*Correspondence: Chun-Hung Lee, Y2hsZWVAZ21zLm5kaHUuZWR1LnR3
Disclaimer: All claims expressed in this article are solely those of the authors and do not necessarily represent those of their affiliated organizations, or those of the publisher, the editors and the reviewers. Any product that may be evaluated in this article or claim that may be made by its manufacturer is not guaranteed or endorsed by the publisher.
Research integrity at Frontiers
Learn more about the work of our research integrity team to safeguard the quality of each article we publish.