 Xiaoyu Wu
 Qingfeng Bao
- School of Economics and Management, Inner Mongolia Agricultural University, Hohhot, China
Balancing the relationship between forest resources and economic growth is crucial for achieving sustainable development in China. Inner Mongolia, with its unique geographical environment and relatively underdeveloped economy, exhibits distinctive patterns in its forest resources development and changes. This study investigates the impact of economic growth on forest resources in Inner Mongolia using time-series data from 1980 to 2018 and the cubic curve regression model based on the Environmental Kuznets Curve (EKC) hypothesis. The results reveal an inverted N-shaped EKC relationship, with the forest coverage rate undergoing a “decline-up-decline” evolution process, characterized by turning points 1984 and 2015, and the forest stock volume exhibiting a “decline-up” evolution process with a minimum turning point around 1999. Remarkably, the forest stock volume continues to increase at present and over a foreseeable future. Furthermore, the study finds that population density has a negligible effect on the reduction of forest coverage rate in Inner Mongolia. Lastly, the paper offers policy suggestions to promote the sustainable development of forest resources in the region.
1 Introduction
Inner Mongolia, situated on the northern border of China, as depicted in Figure 1, encompasses an expansive area of 118.3 × 10⁴ km2, stretching 2,400 km long from east to west and 1,700 km wide from north to south. This vast region covers nearly 1/8 of China’s total land area (Wu et al., 2023). The complex and diverse natural geographic conditions in Inner Mongolia have given rise to a wide array of forest resources, characterized by different types and structures. Moving from east to west, the region boasts various areas, including the pristine Daxingan virgin forests, 11 secondary forest regions like Daxingan southern mountains, and areas with artificial afforestation resulting from long-term development efforts. In 2018, the forest area in Inner Mongolia reached an impressive 26,148.5×103 hm2, ranking first in the nation, and its forest stock volume amounted to 1662719.8 × 103 m3, ranking fifth (Zhen et al., 2006; Su et al., 2020).
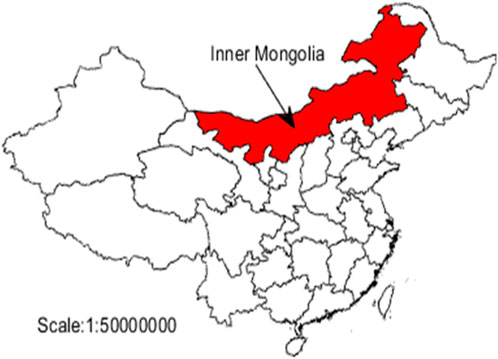
FIGURE 1. Location of inner Mongolia in China.
The strategic location and distinctive natural conditions of Inner Mongolia make it a vital ecological barrier in the north, playing a pivotal role in preserving and safeguarding the ecological environment for northern China (Guan et al., 2020).
However, Inner Mongolia remains a relatively underdeveloped region in terms of industry and technology. Over the past few decades, its economy has heavily relied on the direct output of resources. For instance, Yufu Zhang (2006) conducted a study on the impact of socio-economic factors on changes in forest area in China, and the findings indicated that income from forests remained a significant component of Inner Mongolia’s economy. In 2001, the primary industry’s contribution to GDP was 23.2%, markedly higher than the average level of 14.5% for Mainland China. Consequently, economic development has exerted pressure on forests, and Inner Mongolia still finds itself in the early stages of the U-shaped forest resource curve. Additionally, the population growth and the continuous pursuit of improved living standards have resulted in substantial consumption of natural resources, particularly forest resources.
With the occurrence of weather fluctuations and the degradation of ecological environment, particularly the frequent onslaught wind-borne dust, China’s awareness of forest resource protection and sustainable development has steadily grown in recent years. To achieve this, a series of polices have been implemented across the country. Among these, the Six Key Forestry Projects initiated in 1998, have had a notably effective and widespread impact in Inner Mongolia. These projects encompass initiatives such as the Natural Forest Protection Project, Returning Farmland into Forest Project, and Wildlife Conservation and Nature Reserve Construction Project. Inner Mongolia stands as the sole province where all these projects have been fully implemented, leading to remarkable achievements in enhancing forest resources and improving the ecological environment. Notably, the eighth Forest Resources Inventory Report in 2018 revealed an increase in forest coverage rate from 21.03% to 22.03%, accompanied by a reduction of 416.88×10³ hm2 in desertification land and 343.51 × 10³ hm2 in sandy land compared to 2015.
Given the unique socio-economic environment of Inner Mongolia, various factors such as economic growth, policies, and more may have a distinct and substantial impact on changes in its forest resources (Tasseda et al., 2023). While previous studies have examined changes in China’s forest resources and their relationship with socio-economic factors, such as the economy, population, and industrial structure (Hao et al., 2019; Zhang and Ke, 2020), these analyses primarily operated at the cross-country or regional level using panel data. A long-term study at the provincial level based on time-series data is still lacking, and the conclusions or policy recommendations may carry bias when applied to a specific province like Inner Mongolia, with its abundant natural resources and unique socio-economic conditions.
To address this knowledge gap, this article utilizes comprehensive long-term macro-level data, spanning from 1980 to 2018, specifically focusing on Inner Mongolia. The main objective is to analyze the impact of economic growth on forest resources while considering other factors as control variables, including population and policies. This study aims to achieve three primary contributions: firstly, to scrutinize changes and trends in forest resources at the provincial level, leading to more precise and targeted policy recommendations; secondly, to investigate the influence of several socio-economic indicators, including population, industrial structure, and policies, on forest resources; and finally, to identify relevant stages and trends of forest resource changes in Inner Mongolia based on the Environmental Kuznets Curve (EKC) hypothesis.
2 Literature review
Forest resources are among the most valuable natural assets on earth, serving not only as essential materials for economic development but also playing a crucial role in preserving local ecosystems (Beytollah et al., 2023). Scholars have conducted numerous studies on the dynamic changes and factors influencing forest resources, revealing that over the past century, extensive deforestation has occurred worldwide to meet the rising demand for wood products driven by urbanization and economic growth in various countries. Consequently, there has been a continuous decline in global forest resources (Meyfroidt et al., 2010; Keenan et al., 2015; Savari et al., 2019; Talebmorad et al., 2020; Hernandez et al., 2021; Zane et al., 2023). For instance, according to the 2020 Global Forest Resources Assessment Report published by the Food and Agriculture Organization of the United Nations (FAO), the global forest area has reduced by 178 million hectares since 1990.
The academic community widely acknowledges that the growth and decline of forest resources are primarily influenced by both natural conditions and socio-economic factors. However, while natural conditions act as objective factors with a relatively fixed impact on forest resources in a specific region, socio-economic factors, including economic growth, population, urbanization rate, and policies, are variable and controllable, thus carrying special significance in driving changes in forest resources (Silva et al., 2016; Wang et al., 2018).
Of all the socio-economic factors, economic growth is commonly emphasized as having the most substantial impact on forest resources. For instance, Naidoo (2004) analyzed data from 70 countries and discovered that countries experiencing more rapid declines in forest resources had faster economic growth than those with higher rates of forest protection. Consequently, numerous studies have focused on investigating the relationship between economic growth and forest resources (Wang, 2007; Hao et al., 2019; Caravaggio, 2020).
In earlier research, the relationship between deforestation and economics was often modeled using simple linear regression with cross-sectional data (Allen and Bames, 1985; Kahn and McDonald, 1995; List, 1998). However, later studies commonly employed panel data regression models to overcome the limitations of cross-sectional data (Bhattarai and Hamming, 2004; Hou and Yao, 2019).
Among the various methods used to study the relationship between forest resources and economic growth, the Environmental Kuznets Curve (EKC) model is more widely accepted by most scholars. The EKC was first proposed by Grossman and Krueger (1991) when analyzing empirical evidence of atmospheric quality data. It demonstrated an inverted U-shaped relationship between environmental quality and per capita income, and the name “EKC” was inspired by the original Kuznets Curve discovered by Kuznets (1955). When studying the dynamic changes of forest resources, many scholars have applied the EKC theory to explore whether there is a connection between changes in forest resources and economic growth.
The EKC theory posits that there exists an inverted U-shaped relationship between forest resources and economic benefits. In other words, as per capita income increases, forest resources will initially decrease along with economic growth until a certain income threshold is reached (i.e., there is a turning point). After this turning point, forest resources will start to increase despite continued economic growth.
Indeed, when applying the EKC theory to study the relationship between forest resources and economic growth, various indicators are commonly used to describe forest resources. These indicators include deforestation, forest area, forest coverage rate, timber output, or forest stock volume. On the other hand, per capita GDP is typically employed as the indicator for economic growth (Caravaggio, 2020).
In recent years, the researchers have established the extended EKC models by adding some other impacting factors, such as social economics, geographical features and policy factors, etc., (Richard, 2007; Hao et al., 2019).
In more recent years, researchers have expanded upon the traditional EKC models by incorporating additional impacting factors. These factors encompass various aspects, such as social economics, geographical features, and policy factors (Richard, 2007; Hao et al., 2019). The inclusion of these additional variables aims to provide a more comprehensive understanding of the complex interactions between economic growth and forest resources, allowing for a more nuanced analysis of the relationship between the two. By considering a broader range of factors, these extended EKC models offer valuable insights into the drivers and implications of changes in forest resources amid changing socio-economic and policy environments.
The existing body of literature on forest resources in China has indeed provided evidence for the presence of the Environmental Kuznets Curve (EKC) relationship (e.g., Kang et al., 2016; Li et al., 2016; Wu et al., 2018; Hou et al., 2019), but different studies have yielded varying forms and turning points of the EKC for China’s forest resources. For instance, Li et al. (2000) focused on the southern collective forest area and found a positive association between forest resource endowment and poverty levels. On the other hand, some scholars conducting empirical analyses on specific provinces observed a phenomenon of “rich resources endowment resulting in poverty” (Ding et al., 2006). Conversely, Liu et al. (2015) utilized national data from 1985 to 2012 and concluded that there was a positive correlation between China’s forest resources and economic development, refuting the resource curse theory in the context of China’s forestry development.
Furthermore, Hao et al. (2019) conducted an extensive examination of the relationship between forest resources and economic growth using panel data from 30 provinces in China, divided into three regions (eastern, central, and western). Their results indicated that the EKC relationship between forest resources and economic development followed an inverted U-shape at both the national and regional levels in China. Specifically, China was situated at a stage where the amount of timber output and afforestation area decreased with economic growth, representing the right part of the inverted U-shaped EKC.
However, despite the progress in understanding the relationship between forest resources and economic growth, several gaps in the existing research persist. Firstly, most studies have been focused on national panel data or cross-sectional data of specific regions, lacking investigations into the historical changes and future trends at the local level, such as the provincial level using time series data. Secondly, the quadratic EKC model has been predominantly used, leading to U-shaped or inverted U-shaped curves with finite increases or decreases after the turning point. Thirdly, many studies have primarily considered the relationship between forest resources and economic growth, but insufficient attention has been given to other social factors that may affect forest resources, such as population size, industrial structure, and policy guidance.
To address these research gaps, this paper utilizes provincial statistical data from Inner Mongolia for the period of 1980–2018 to investigate the relationship between forest resources and economic growth based on the EKC hypothesis. The forest coverage rate and forest stock volume are considered as dependent variables, constant-price GDP per capita as the explanatory variable, and various socioeconomic factors as control variables. Based on the findings, the paper proposes policy recommendations to enhance the sustainable development of forest resources in the region.
3 Materials and methods
3.1 Data and variables
Properly selecting indicators that can accurately reflect the changes in forest resource status is crucial when studying the relationship between forest resources and economic growth (Angelsen and Kaimowitz, 1999). In this paper, the research objective and data availability led to the choice of two dependent variables to measure forest resources: forest coverage rate and forest stock volume.
The forest coverage rate serves as a significant indicator to assess the abundance of forest resources and the status of ecological balance. It reflects the proportion of land covered by forests, providing insight into the extent of forest resources in a given area. On the other hand, forest stock volume is a fundamental variable that indicates the overall scale and level of forest resources in a region or country. This measurement is vital for evaluating forest resource abundance and the quality of the forest ecological environment (Chen and Wang, 2011).
Data on these two variables were collected from the Forest Resources Inventory Report of China for the period of 1980–2018. Since the inventory was conducted every 5 years, some defaulted data points between inventory periods were supplemented using interpolation methods. This approach assumes that the changes in forest resources between two inventory times were uniform, enabling the measurement of continuous variations in forest resources over the entire period of study.
In this study, per capita GDP was employed as the explanatory variable to represent economic growth. The data for per capita GDP were obtained from the Inner Mongolia Statistical Yearbook, and all GDP values were adjusted to real GDP per capita at constant 1980 prices.
The study also recognizes that various socioeconomic factors can influence changes in forest resources. Therefore, the following factors are included as control variables.
3.2 Population density
Population density is defined as the total population at the end of each year divided by the area of Inner Mongolia, measured in persons per square kilometer (persons/km2). As regional population increases and economic development progresses, human activities expand into ecological environments, consuming resources and potentially damaging forestland areas and forest resources. Population density is included in the study to examine the effect of population expansion on the ecological environment quality of forests. Data on population density for each year was obtained from the Inner Mongolia Statistical Yearbook.
3.3 Industrial structure
The proportion of tertiary industry to the national economy in China has gradually surpassed that of the secondary industry, becoming a pillar of national economic development (Yang, 2016). However, the resource consumption, environmental pollution, and ecological issues are still mainly attributed to the secondary industry. The industrialization and urbanization processes in China have imposed considerable pressure on forest resources (Shen et al., 2005). Therefore, the industrial structure is represented by the proportion of value added by the secondary industry to the GDP. It is included in this study to describe the influence of changes in industrial structure on forest resources. Data on the industrial structure for each year was sourced from the Inner Mongolia Statistical Yearbook.
3.4 Government support
To account for the impact of policies on forest resource changes, a dummy variable called “government support” was introduced. Specifically, considering that the Six Key Forestry Projects, which had a significant impact on Inner Mongolia, were implemented in 1998, a 2-year lag in generating the effect was assumed. As a result, the year 2000 is taken as the dividing line for the dummy variable. It takes the value “0” for the years 1980–1999 and “1” for the years 2000–2018 in this paper, representing the presence or absence of government support during those periods.
As a summary, Table 1 provides an illustration of all the variables used in this study, while Table 2 presents the descriptive statistics for these variables. Notably, for the subsequent modeling, natural logarithms were applied to the variables Y1, Y2 and X, as shown in Table 2.
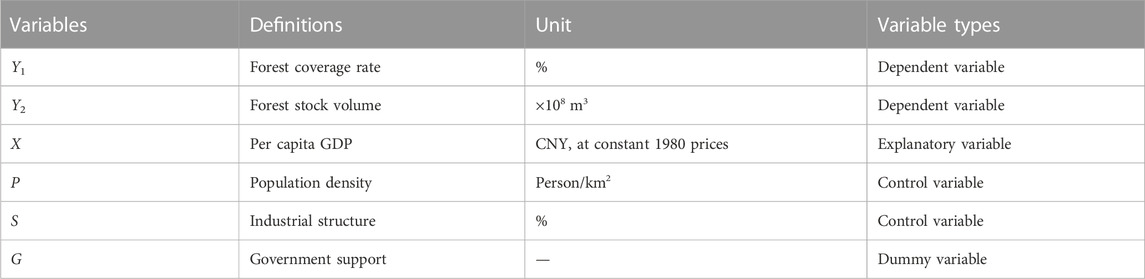
TABLE 1. Illustration of the variables used in this study.
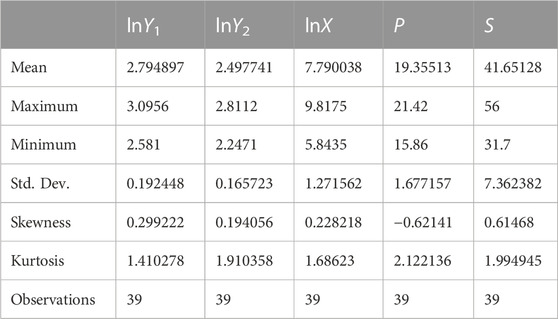
TABLE 2. Descriptive statistics of the variables used in this study.
3.5 Econometric approach
3.5.1 Model setting
Before conducting the empirical analysis and modeling, a correlation analysis was performed between the indicators of forest resources and economic growth in Inner Mongolia. The correlation coefficients are presented in Table 3. From the results of the correlation analysis, it is evident that both forest resource indicators (forest coverage rate and forest stock volume) show a positive correlation with per capita GDP. This information will be utilized in the subsequent modeling process, illustrating the existence of a positive relationship between forest resources and economic growth in the region.

TABLE 3. Correlation coefficient between forest resources and economic growth.
The Environmental Kuznets Curve (EKC) is an empirical curve that describes the nonlinear relationship between environmental quality and per capita income (Culas, 2007; Choumert et al., 2013). In previous studies, a quadratic curve has been commonly used for model setting, resulting in an inverted U-shaped curve (Cropper and Griffiths, 1994; Waluyo and Terawaki, 2016). However, the cubic-curve regression model, which tends to form an inverted N-shaped curve, offers greater flexibility. It is worth noting that the quadratic curve is merely a special form of the cubic curve, where the coefficient of the cubic term is 0, effectively reducing it to a quadratic curve regression.
In this study, the cubic curve regression model is selected to examine whether the variables pass the unit root test and whether a cointegration relationship exists between the variables. This approach is utilized to determine the specific model form and explore the intricate relationship between forest resources and economic growth in Inner Mongolia. By adopting the cubic curve regression model, the study aims to obtain a more comprehensive and nuanced understanding of the relationship between these variables.
Based on the EKC method, the regression models in this study are set as follows:
Let:
Then the above equation can be written as:
Accordingly, the formulation transforms the original equation into a standard multiple-linear regression problem. Subscript t denotes the time index, and F denotes the forest coverage rate (Y1) or forest stock volume (Y2), respectively. X denotes the real per capita GDP at the 1980 constant price, and to mitigate heteroscedasticity in the data and reduce data fluctuations, the natural logarithm processing is applied to process the per capita GDP variable.
Additionally, variables P, S and G, are included as control variables, representing the popularity density, industrial structure, and government support, respectively. The intercept effect is denoted by
In summary, the regression equation seeks to model the relationship between forest resources (forest coverage rate or forest stock volume) and economic growth (real per capita GDP) while accounting for the influence of control variables (population density, industrial structure, and government support) and other random factors.
The coefficients to be estimated, namely, β1, β2 and β3, have different values, which will result in variations in the shape of the curve (Li and Long, 2013). Table 4 illustrates these differences.
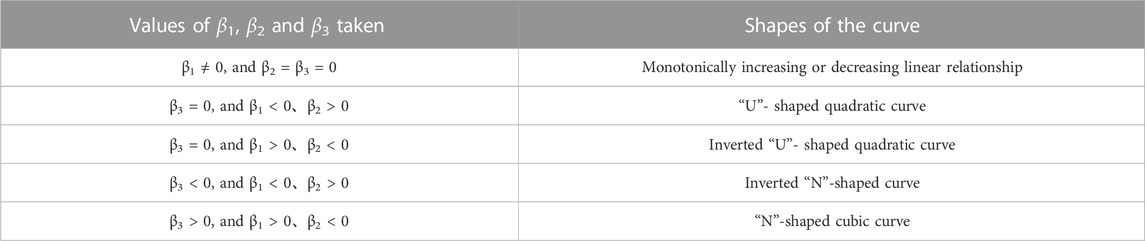
TABLE 4. Shapes of the curve with different values of β1, β2 and β3.
3.5.2 Stationary test of the variables
3.5.2.1 Root unit test
To ensure the validity of the empirical analysis and modeling, it is crucial to test the stationarity of each variable, especially since they belong to time series data. The ADF (Augmented Dickey-Fuller) unit root test is a commonly used method for this purpose, and it has been selected for conducting the stationarity tests in this study. The tests were performed using the software EViews, and the results are presented in Table 5.
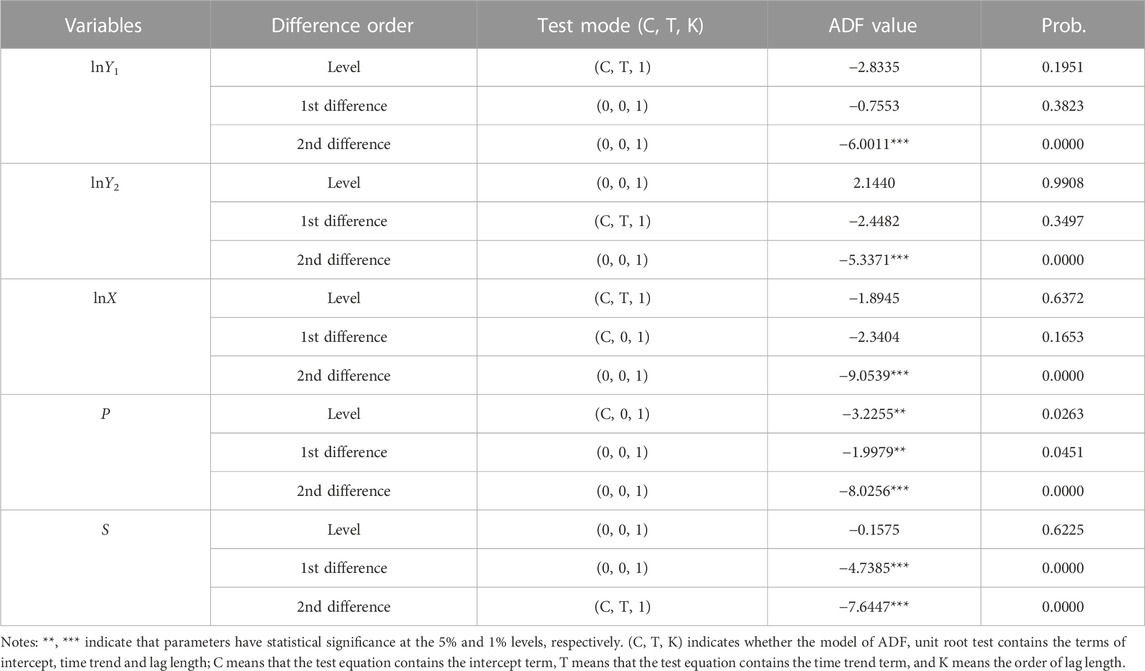
TABLE 5. Results of the root unit test.
From the results presented in Table 5, it can be observed that the variables “lnY1, lnY2 and lnX” fail to reject the null hypothesis at the level for first-order difference. However, these variables pass the ADF test at the 1% significance level for second-order difference.
On the other hand, the variable “P” passed the test at the 5% significance level for both the level and the first-order difference, and also passed the test at the 1% significance level for second-order difference.
Similarly, the variable “S” passed the test at the 1% significance level for both the first-order difference and second-order difference.
In summary, all the indicators and variables can be transformed into integrated second-order variables after undergoing the appropriate processing. As a result, the subsequent cointegration analysis can be conducted with these transformed variables, ensuring reliable and meaningful results for the study.
3.5.2.2 Cointegration test
After completing the unit root test on each variable, it is crucial to conduct a cointegration test. Identifying a cointegration relationship is essential because although the variables have been integrated, failing to establish cointegration can lead to spurious regression. In this study, the Johansen method is employed for the cointegration test to investigate the potential cointegration relationship between the indicators of forest resources (lnY1 and lnY2) and the variables lnX, P, and S. The Johansen cointegration test results are shown in Table 6.
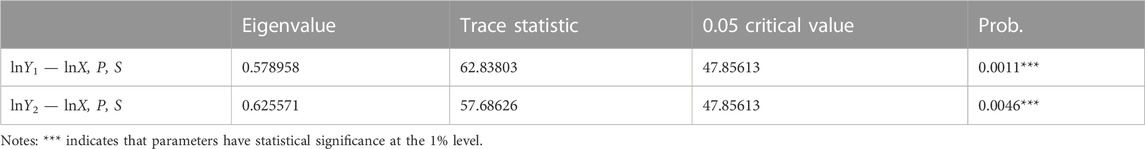
TABLE 6. Results of the Johansen cointegration test.
The results of the cointegration test indicate that there is a cointegration relationship between each indicator of forest resources (lnY1 and lnY2) and the independent variables (lnX, P, and S) determined in this paper. This cointegration relationship implies a long-run equilibrium association between the variables, confirming their interconnectedness and mutual influence over time. As a result, a regression analysis can be directly conducted using the cointegrated variables.
4 Results and discussion
The relationship between each indicator of forest resources (lnY1 and lnY2) and independent variables (lnX, P, and S) was estimated according to the selected econometric regression analysis model (1) in EViews, and are presented in Table 7 for lnY1 and in Table 8 for lnY2.
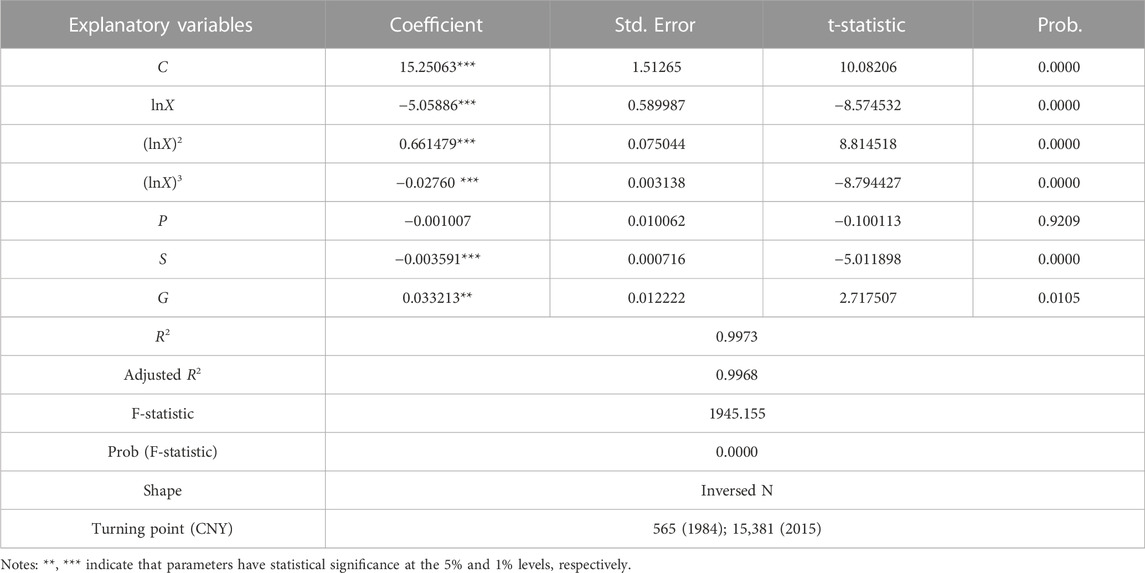
TABLE 7. Estimation results with the lnY1 as the dependent variable.
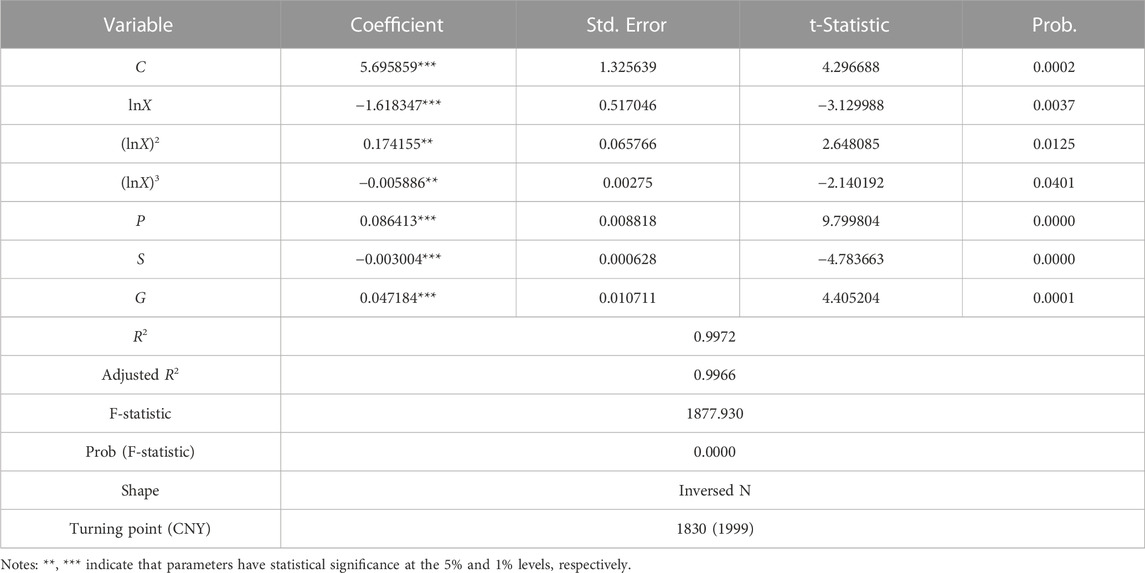
TABLE 8. Estimation results with the lnY2 as the dependent variable.
The results presented in Tables 7, 8 demonstrate that the forest coverage rate and forest stock volume, used as indicators to measure forest resources, have been analyzed separately using the regression model (1). The overall fitting effect of the regression model is considered good, indicating that the EKC cubic-regression model is appropriate for the analysis. The t-tests for all the first-order, quadratic, and cubic terms of the explanatory variable lnX have passed the 1% significance level, and their estimated coefficients are significantly “negative, positive, negative.” This signifies that the EKC curve exhibits an inverted “N” shape, as indicated in Table 4. In other words, forest resources first decline, then rise, and again decline with per capita GDP.
Figure 2 visually illustrates the fitted EKC curve between forest coverage rate and GDP per capita. The curve exhibits two turning points, corresponding to specific GDP per capita values: Q1 (565 CNY) and Q2 (15,381 CNY). These turning points are associated with the years around 1984 and 2015, respectively.
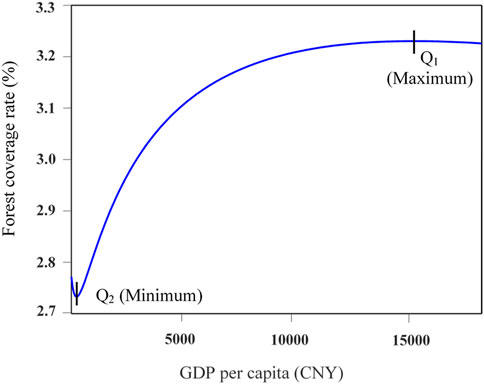
FIGURE 2. Fitted curve of forest coverage rate.
Figure 3 illustrates the fitted EKC curve between forest stock volume and GDP per capita. Within the range of the sampling data, a minimum point, denoted by Q1 = 565 CNY, is evident, corresponding to the year 1999 approximately. This minimum point represents a critical stage in the relationship between forest stock volume and GDP per capita, where the forest stock volume reaches its lowest value in response to the given GDP per capita level.
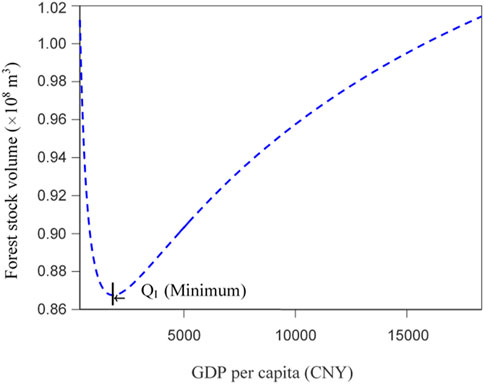
FIGURE 3. Fitted curve of forest stock volume.
Regarding the forest coverage rate, it serves as a significant indicator reflecting the actual level of forest resources and forest land occupation. From Figure 2, it can be observed that after entering the 1980s, the forest coverage rate of Inner Mongolia started to increase continuously with economic growth, representing the ascending part of the inverted “N” shaped EKC. After approximately 2014, when per capita GDP surpassed Q2, the forest coverage rate began to decline slowly with economic growth, indicating that it had reached the maximum turning point of the EKC. This finding aligns with the expectation that the forest coverage rate cannot perpetually increase due to the influence of factors such as land use area, urban expansion, and population growth.
In Figure 3, it is evident that when per capita GDP was below Q1, approximately corresponding to the years 1980–1999 within the range of the sampling data, the forest stock volume decreased with the increase of per capita GDP, representing the first descending part of the inverted “N" shaped EKC. The year 1999 served as the turning point for the minimum value of the EKC. Subsequently, after 1999, the forest stock volume increased with the increase of per capita GDP, entering the part of the EKC inverted “N” type. This phenomenon can be attributed to the implementation of China’s reform and opening policy during the period 1980–1999, which led to rapid economic development, increased urbanization rate, and greater consumption of timber resources in industrial production and construction. However, alternative resources were not adequately utilized during this period. Additionally, the stock of forests per unit area in the young forest stage during the forest-growth process was small, particularly due to the cold and drought weather in Inner Mongolia, leading to a longer growth period before reflecting in the forest stock volume. As a result, the growth rhythm of the forest stock volume lagged behind the forest coverage rate for nearly 15 years, contributing to the increase in forest coverage rate while the forest stock volume decreased during this stage. The model predicts that there is no maximum turning point of the EKC within the data scope studied in this paper, suggesting that the forest stock volume of Inner Mongolia is expected to continue increasing with the growth of per capita GDP for the foreseeable future.
The estimated coefficients of each control variable are as follows:
4.1 Population density (P)
In Table 7, the estimated coefficient of population density is −0.001, which fails the test at the 10% significance level, indicating that the negative correlation between forest coverage rate and population density is not significant. This means that when population density increases, the decrease in forest coverage rate in Inner Mongolia is not significant. However, in Table 8, the estimated coefficient of population density is 0.086413, which passes the test at the 1% significance level, showing that the positive correlation between the forest stock volume and population density is significant. This finding is inconsistent with some studies for the whole country, such as the studies by Gu (2007) and Hou and Yao (2019), which found that normally the forest stock volume would decrease with the rise of population density due to the expansion of human activity spaces and urban expansion limiting room for forest resource growth. However, when examining the circumstances of population in Inner Mongolia as shown in Figure 4, it becomes evident that during the period from 1980 to 1999 when the population density increased at a higher rate, the corresponding forest stock volume decreased.
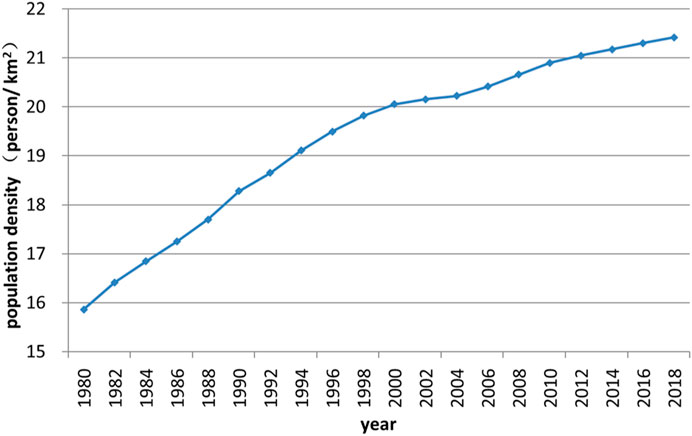
FIGURE 4. Variations of population density in Inner Mongolia of China.
After a turning point appeared in the growth rate of population density around 1999, during the period of 2000–2004, the population density changed very little and almost remained unchanged. Correspondingly, the forest stock volume reached its minimum in 1999 and then rapidly increased. From 2004 onward, the population density increased again, but at a slower rate than before, and the growth rate of the forest stock volume exceeded that of the population density, resulting in a continuous increase in the standing tree stock.
4.2 Industrial structure (S)
The results in both Tables 7, 8 show that the estimated coefficients of the industrial structure are negative and pass the test at the 1% significance level. This indicates that an increase in the proportion of the secondary industry leads to a decrease in forest resources. A possible reason for this discovery is that the industrial development in China, along with the increase in urbanization and construction of infrastructure, factories, and public land, may raise the demand for wood, as has been observed in other provinces in China (Hou et al., 2019).
4.3 Government support (G)
In both Tables 7, 8, the estimated coefficients of government support as represented by the dummy variable are positive, and they pass the tests at the 5% and 1% significance levels, respectively. This indicates that government support is positively correlated with forest resources, suggesting that the government’s policy in Inner Mongolia and the implementation of a series of key forestry projects have achieved remarkable results, leading to the leapfrog development of forestry.
5 Conclusion
The findings of this study indicate a significant relationship between forest resources and economic growth in Inner Mongolia, China. The analysis was based on the Environmental Kuznets Curve (EKC) hypothesis, and the data from 1980 to 2018 was used to investigate the impact of economic growth on changes in forest resources. The results of the cubic curve regression model show that the relationship between forest resources (measured by forest coverage rate and forest stock volume) and economic development is essentially an inverted N-shaped curve in Inner Mongolia.
The forest coverage rate in Inner Mongolia exhibited a “decline-rise-decline” evolution process with economic growth, and two turning points were identified, corresponding to the years 1984 and 2015, respectively. After 1984 (almost immediately after entering the 1980s), the forest coverage rate continued to increase in tandem with economic growth, representing the second part of the inverted N-shaped EKC (i.e., the rising part). However, after reaching 2015, the forest coverage rate in Inner Mongolia ceased to increase with economic growth, and it even experienced a slow decline, indicating that it has already surpassed the maximum turning point in the EKC curve for the forest coverage rate.
During the time period studied in this research, the forest stock volume in Inner Mongolia exhibited a “decline-up” evolution process with economic growth, representing both the first and second parts of the inverted N-shaped EKC (i.e., the descending and rising parts). Specifically, a minimum turning point was identified, corresponding to the year 1999. Prior to 1999, as per capita GDP increased, the forest stock volume in Inner Mongolia decreased. However, after 1999, the trend reversed, and the forest stock volume started to increase in response to economic growth. Presently, and for an extended period, the forest stock volume in Inner Mongolia is continuing to increase, indicating that it has not yet reached its maximum point.
The impact of different control variables on forest resources varies. Concerning the forest coverage rate, the estimated coefficient of population density is negative, but statistically insignificant. This suggests that the increase in population density has only a minor effect on the reduction of the forest coverage rate in Inner Mongolia. However, a significant positive correlation is observed between the forest stock volume and population density. This means that as the population size increases, the forest stock volume in Inner Mongolia has not decreased, but instead, it has increased. This finding contrasts with the situation in other regions of China, where an increase in population density typically leads to a decrease in forest resources. The unique socio-economic and ecological conditions of Inner Mongolia may be contributing to this difference in the relationship between population density and forest resources.
The increase in the proportion of the secondary industry has resulted in a decrease in both the forest coverage rate and forest stock volume in Inner Mongolia. This finding aligns with expectations and previous relevant studies, as industrial development, urbanization, and infrastructure construction often increase the demand for wood and lead to a reduction in forest resources.
Inner Mongolia stands out as the only province where forest resource protection policies were implemented earlier and a series of key forestry projects were fully covered. The remarkable effects of these policies are evident in the estimated coefficient of government support, which shows a significantly positive correlation with forest resources. This result confirms that the government’s policy measures and key forestry projects have been successful in promoting the sustainable development and conservation of forest resources in Inner Mongolia.
Based on the results of this study, there are some important policy implications that can be drawn. Firstly, considering that Inner Mongolia is characterized by arid and rainless conditions with relatively barren land, it is essential to acknowledge the slow growth rate of forests in the region. The research findings also reveal that the forest stock volume has a longer lag time compared to the forest coverage rate, and it is still increasing as the economy grows. To ensure the sustainable growth of forests, the government should prioritize increasing investments in funds and technology, implementing measures to promote the growth of young and middle-aged forests, and ensuring the overall health and vitality of the forest ecosystem.
Secondly, the estimation results highlight the significance of accelerating industrial structural upgrades. The positive relationship between the development of the secondary industry and the consumption of forest resources emphasizes the need for strategic adjustments. To strike a balance between economic growth and forest conservation, it is important to reduce the proportion of the secondary industry while promoting the development of the tertiary industry. Encouraging other industries such as forest tourism and the under-forest economy can also contribute to the sustainable management of forest resources.
Data availability statement
The original contributions presented in the study are included in the article/supplementary material, further inquiries can be directed to the corresponding author.
Author contributions
XW wrote the first draft of the manuscript. GL conducted the statistical data analyses. QB contributed to conception and design of the study and gave final approval of the version to be published. All authors contributed to the article and approved the submitted version.
Funding
This study was supported by the Inner Mongolia Natural Science Foundation of China (Grant No. 2023M07004) and the Ethnic Research Project of the National Ethnic Affairs Commission (Grant No. GMB-038, 2018).
Conflict of interest
The authors declare that the research was conducted in the absence of any commercial or financial relationships that could be construed as a potential conflict of interest.
Publisher’s note
All claims expressed in this article are solely those of the authors and do not necessarily represent those of their affiliated organizations, or those of the publisher, the editors and the reviewers. Any product that may be evaluated in this article, or claim that may be made by its manufacturer, is not guaranteed or endorsed by the publisher.
References
Allen, J. C., and Barnes, D. F. (1985). The causes of deforestation in developing countries. Ann. Assoc. Am. Geogr. 75 (02), 163–184. doi:10.1111/j.1467-8306.1985.tb00079.x
Angelsen, A., and Kaimowitz, D. (1999). Rethinking the causes of deforestation: Lessons from economic models. World Bank. Res. Obs. 14 (01), 73–98. doi:10.1093/wbro/14.1.73
Beytollah, M., Eric, N., Davood, M. G., and Fatemeh, E. (2023). Forest dwellers’ dependence on forest resources in semi-arid environments. Sustainability 15, 2689. doi:10.3390/su15032689
Bhattarai, M., and Hammig, M. (2004). Governance, economic policy, and the environmental Kuznets curve for natural tropical forests. Environ. Dev. Econ. 9 (03), 367–382. doi:10.1017/S1355770X03001293
Caravaggio, N. (2020). Economic growth and the forest development path: A theoretical reassessment of the environmental Kuznets curve for deforestation. Policy Econ 118, 102259–102311. doi:10.1016/j.forpol.2020.102259
Chen, C., and Wang, L. Q. (2011). Empirical analysis of the relationship between forest resources and economic growth in Beijing. For. Econ. 6, 78–93. doi:10.13843/j.cnki.lyjj.2011.06.020
Choumert, J., Motel, P. C., and Dakpo, H. K. (2013). Is the environmental Kuznets curve for deforestation a threatened theory? A meta-analysis of the literature. Ecol. Econ. 90, 19–28. doi:10.1016/j.ecolecon.2013.02.016
Cropper, M., and Griffiths, C. (1994). The interaction of population growth and environmental quality. Am. Econ. Rev. 84 (02), 250–254.
Ding, W., Chen, F., and Nan, Z. (2006). A quantitative research on the forestry endowment and poverty in Gansu province. J. Arid Land Resour. Environ. 20, 152–155.
Grossman, G. M., and Krueger, A. B. (1991). Environmental impacts of a north American free trade agreement. Cambridge, Massachusetts: National Bureau of Economic Research. doi:10.3386/w3914
Gu, Z. B. (2007). Study on the relationship between amount change of forest resources and economic growth in China. [dissertation]. Beijing: Beijing Forestry University.
Guan, R. F., Zhu, X. L., Su, Z. C., and Duan, H. (2020). Status and evaluation of forest resources in Inner Mongolia. Inn. Mong. For. Investigation Des. 43 (03), 17–20.
Hao, Y., Xu, Y. L., Zhang, J. J., Hu, X. L., Huang, J. B., Chang, C. P., et al. (2019). Relationship between forest resources and economic growth: Empirical evidence from China. J. Clean. Prod. 214, 848–859. doi:10.1016/j.jclepro.2018.12.314
Hernández-Aguilar, J. A., Durán, E., Jong, W., Velázquez, A., and Pérez-Verdín, G. (2021). Understanding drivers of local forest transition in community forests in Mixteca Alta, Oaxaca, Mexico. For. Policy. Econ. 214, 102542. doi:10.1016/j.forpol.2021.102542
Hou, M. Y., and Yao, S. B. (2019). Testing of the EKC relationship between amount of forest resources and economic growth: An empirical study based on provincial panel data. For. Sci. 55 (12), 113–122. doi:10.11707/j.1001-7488.20191212
Kahn, J. R., and Mcdonald, J. A. (1995). Third-world debt and tropical deforestation. Ecol. Econ. 12 (02), 107–123. doi:10.1016/0921-8009(94)00024-p
Kang, Y. Q., Zhao, T., and Yang, Y. Y. (2016). Environmental Kuznets curve for CO2 emissions in China: A spatial panel data approach. Ecol. Indic. 63, 231–239. doi:10.1016/j.ecolind.2015.12.011
Kuznets, S. (2019). Economic growth and income inequality. Am. Econ. Rev. 45 (01), 25–37. doi:10.4324/9780429311208-4
Li, H. J., and Long, R. Y. (2013). Environmental Kuznets curve of resource-based cities in China—an empirical research based on panel data. J. Nat. Resour. 28 (01), 19–27. doi:10.11849/zrzyxb.2013.01.003
Li, T., Wang, Y., and Zhao, D. (2016). Environmental Kuznets curve in China: New evidence from dynamic panel analysis. Energy Policy 91, 138–147. doi:10.1016/j.enpol.2016.01.002
Li, Z., Wang, H., and Zheng, Y. (2000). Inputs from intrinsic primary afferent neurons to nitric oxide synthase-immunoreactive neurons in the myenteric plexus of Guinea pig ileum. For. Econ. 22, 1–8. doi:10.1007/s004419900125
List, T. (1998). Sources of deforestation in tropical developing countries. Environ. Manage. 22 (01), 19–33. doi:10.1007/s002679900081
Liu, Z., Yao, S., and Liu, Y. (2015). Research on forest resource curse based on spatial panel model. Resour. Sci. 37, 379–390.
Meyfroidt, P., Rudel, T. K., and Lambin, E. F. (2010). Forest transitions trade and the global displacement of land use. Proc. Natl. Acad. Sci. U. S. A. 107 (49), 20917–20922. doi:10.1073/pnas.1014773107
Naidoo, R. (2004). Economic growth and liquidation of natural capital: The case of forest clearance. Land. Econ. 80 (02), 194–208. doi:10.2307/3654738
Richard, J. C. (2007). Deforestation and the environmental Kuznets curve: An institutional perspective. Ecol. Econ. 61 (2/3), 429–437. doi:10.1016/j.ecolecon.2006.03.014
Rodney, J., Keenan, A., Gregory, A., Reams, b., Frédéric Achard, C., Joberto, V., et al. (2015). Dynamics of global forest area: Results from the FAO global forest resources assessment. For. Ecol. Manag. 352, 9–20. doi:10.1016/j.foreco.2015.06.014
Savari, M., and Damaneh, H. E. (2019). Analysis of effective factors in sustainable management of forest Resources among local communities of Kerman province. Desert 24 (02), 277–292. doi:10.22059/JDESERT.2019.76385
Shen, L., Cheng, S., Gunson, A. J., and Wan, H. (2005). Urbanization, sustainability and the utilization of energy and mineral resources in China. Cities 22 (04), 287–302. doi:10.1016/j.cities.2005.05.007
Silva, R., Batistella, M., and Moran, E. F. (2016). Drivers of land change: Human-environment interactions and the Atlantic forest transition in the Paraíba Valley, Brazil. Land Use Policy 43 (02), 133–144. doi:10.1016/j.landusepol.2016.07.021
Su, Z., Zhu, X., Wang, Y., and Duan, H. (2020). Analysis on variation of forest resources in Inner Mongolia. Inn. Mong. For. Investigation Des. 43 (02), 13–15.
Talebmorad, H., Abedi-Koupai, J., Eslamian, S., Mousavi, S. F., and Singh, V. P. (2020). Evaluation of the impact of climate change on reference crop evapotranspiration in Hamedan-Bahar plain. Int. J. Hydrology Sci. Technol. 10 (05), 123–130. doi:10.1504/IJHST.2021.10036899
Tasseda, B., Tasseda, B., Angel, R., and Angel, R. (2023). Embracing sustainability in public-owned forest resources management: Lessons learned and perspectives. Front. Sustain. 3, 1–11. doi:10.3389/frsus.2022.1096356
Waluyo, E. A., and Terawaki, T. (2016). Environmental Kuznets curve for deforestation in Indonesia: An ARDL bounds testing approach. J. Econ. Coop. Dev. 37 (03), 87–108.
Wang, H., Yan, J. Z., and Li, H. L. (2018). Forest transition and its explanation in contiguous destitute areas of China. Acta Geogr. Sin. 37 (07), 1253–1267. doi:10.11821/dlxb201807006
Wang, S., Liu, C., and Wilson, B. (2007). Is China in a later stage of a U– shaped forest resource curve? a re-examination of empirical evidence. For. Policy Econ. 10, 1–6. doi:10.1016/j.forpol.2006.12.003
Wu, J., Zheng, H., Zhe, F., Xie, W., and Song, J. (2018). Study on the relationship between urbanization and fine particulate matter (PM2.5) concentration and its implication in China. J. Clean. Prod. 182, 872–882. doi:10.1016/j.jclepro.2018.02.060
Wu, X. Y., Liu, G. Y., and Bao, Q. F. (2023). Pathway and driving forces to complete forest transition in Inner Mongolia of China. Environ. Dev. 45 (100784), 100784–100810. doi:10.1016/j.envdev.2022.100784
Yang, Y., and Ge, L. H. (2016). An analysis of the relationship between the development of the tertiary industry and employment in China. Mod. Econ. Inf. 11, 383–384. doi:10.3760/cma.j.issn.1002-0098.2016.06.013
Zane, L., āris, J., Dainis, R., and Jānis, D. (2023). Forest resources and sustainable management. For. Microbiol., 3–31. doi:10.1016/B978-0-443-18694-3.00007-9
Zhang, X. X., and Ke, S. F. (2020). Linkage analysis of the resources, population, and economy in China’s key state-owned forest areas. Sustainability 3855 (12), 3855–3917. doi:10.3390/su12093855
Zhang, Y., Tachibana, S., and Nagata, S. (2006). Impact of socio-economic factors on the changes in forest areas in China. For. Policy Econ. 9, 63–76. doi:10.1016/j.forpol.2005.02.005
Keywords: economic growth, environmental Kuznets curve (KEC), forest resources, Inner Mongolia, China
Citation: Wu X, Liu G and Bao Q (2023) Impact of economic growth on the changes in forest resources in Inner Mongolia of China. Front. Environ. Sci. 11:1241703. doi: 10.3389/fenvs.2023.1241703
Received: 17 June 2023; Accepted: 24 July 2023;
Published: 02 August 2023.
Edited by:
Maria Alzira Pimenta Dinis, Fernando Pessoa University, PortugalReviewed by:
Adnan Waseem, National University of Sciences and Technology, PakistanMaham Furqan, Oregon State University, United States
Copyright © 2023 Wu, Liu and Bao. This is an open-access article distributed under the terms of the Creative Commons Attribution License (CC BY). The use, distribution or reproduction in other forums is permitted, provided the original author(s) and the copyright owner(s) are credited and that the original publication in this journal is cited, in accordance with accepted academic practice. No use, distribution or reproduction is permitted which does not comply with these terms.
*Correspondence: Qingfeng Bao, YmFvcWluZ2ZlbmdJTUFVQDE2My5jb20=