
94% of researchers rate our articles as excellent or good
Learn more about the work of our research integrity team to safeguard the quality of each article we publish.
Find out more
ORIGINAL RESEARCH article
Front. Environ. Sci., 05 September 2023
Sec. Environmental Economics and Management
Volume 11 - 2023 | https://doi.org/10.3389/fenvs.2023.1240816
This article is part of the Research TopicAir Pollution as a Risk Factor Affecting Human Health and Economic CostsView all 18 articles
 Loris Colombo1*†
 Alessandro Marongiu1
 Giulia Malvestiti1Giuseppe Fossati1Elisabetta Angelino1Matteo Lazzarini2Gian Luca Gurrieri2Silvia Pillon3Guido Giuseppe Lanzani1
This study is focused on a pivotal objective: enhancing air quality and attaining pollutant concentrations in accordance with WHO guidelines. The study extensively evaluates the feasibility of reducing emissions, specifically targeting an 80% decrease in SOX, NOX, PM, NH3, and NMVOC emissions within a limited timeframe. Despite notable emission curtailments of 50% and 80%, the research reveals that recommended pollutant levels are unlikely to be met across most areas of the Po Valley region. Even when implementing the finest available technologies across various sectors, particularly within the Lombardia region, this goal remains unattainable without simultaneous reductions in activity levels. This involves diminishing factors like vehicle miles traveled, energy consumption for heating, and industrial, agricultural, and livestock production. Overall, achieving improved conforming to the new AQG limits is a multifaceted endeavor involving numerous stakeholders and diverse strategies. Successful adherence to Air Quality limits mandates the implementation of Source-Specific emissions standards at the EU level, alignment of the National Emission Reduction Directive with limits specified in the Air Quality Directive, and the formulation of comprehensive Air Quality Plans at national, regional, and local tiers.
Air pollution is a significant public health issue affecting millions of people worldwide. Over the past 3 decades in Europe, visible improvements in air quality have been achieved, thanks to strong common efforts driven by the European Union (EU), national, regional and local authorities in the Member States (Bourdrela et al., 2018; Lim et al., 2019). However, exposure to high concentration of fine particulate matter (PM2.5) has been linked to various adverse health outcomes, including respiratory diseases (i.e., asthma, chronic pulmonary disease) and cardiovascular disease. It is estimated that air pollution causes millions of premature deaths each year (EEA, 2021; Khomenko et al., 2021; WHO, 2021). Moreover, air pollution has also been associated with neurological diseases such as dementia and has a disproportionate impact on vulnerable populations such as children and the elderly.
Recognizing the growing body of evidence on the health impacts of different air pollutants, the World Health Organization (WHO, 2021) has introduced Air Quality Guidelines (AQG) with stricter values for several pollutants, including PM10, PM2.5, and NO2, aiming to protect public health. As a result, many countries need to revise their regulations to meet these guidelines. In Europe, the European Commission (EC) concluded that the Directives (EU, 2004; EU, 2008) have been partially effective in improving air quality and achieving air quality standards. As part of the European Green Deal (European Commission, 2021), the EC is committed to improve air quality and aligning EU air quality standards with the recommendations of WHO. Consequently, the EC has proposed a new revision of the air quality Directive, which includes a progressive alignment of the standards with a vision for 2050 to reduce air pollution to levels that are no longer considered harmful to health and natural ecosystems. Furthermore, interim targets have been formulated for several pollutants, including PM2.5, PM10, O3, NO2, SO2, and CO. Despite the ambitious objective of achieving a non-toxic environment by 2050 (referred to as AQG levels), meeting these guidelines remains a significant challenge, particularly in reducing emissions of PM2.5 (Cohen et al., 2017). The reduction of PM2.5 concentrations continues to be a challenging goal, that requires also to act on the emissions of ammonia (NH3) and other precursors (NOx, COV) (Thunis et al., 2021; Wang et al., 2021; ApSimon et al., 2023).
In the European Union, many Member States have exceeded environmental objectives for one or more of the main pollutants, and the Po Valley stands out as one of the most critical hotspots for pollution in Europe. The Po Valley can be considered as a distributed megacity in Europe, with a population of over 20 million and a significant concentration of Italian livestock, industry and agricultural production take place (Finardi et al., 2014; Clappier et al., 2021; Thunis et al., 2021; Khomenko et al., 2023). The high density of pollutant sources in Po Valley is one of the main reasons why the thresholds limits for pollutants such as NO2, PM10, O3 are not being met. Additionally, the orographic feature of the Po Plain, surrounded by the Alps to the north and the Apennines to the South, contribute to the air quality challenges due to the stagnation of air and the limited exchange of pollutants. Although the emissions of air pollutants have been significantly reduced in all sectors, thanks to regional plans developed for the Po Valley, the concentrations of pollutants still remain significantly above the WHO AQG (D’Elia et al., 2018; De Angelis et al., 2021).
Several studies have demonstrated the positive effects of emission reduction measures on air quality and the health impacts in Europe (Crippa et al., 2015; Turnock et al., 2016; Carnell et al., 2019; Velders et al., 2020). Recently, there has been a significant effort to estimate the spatial and sector-specific contributions of emissions to ambient air pollution in European cities (Khomenko et al., 2023). This assessment aims to evaluate the effects of source-specific reductions in pollutants on mortality rates, with the goal of supporting targeted actions to address air pollution and enhance population health. By understanding the sources responsible for pollution and their impact on public health, authorities can implement more effective and tailored strategies to mitigate air pollution and improve the wellbeing of residents in urban areas. However, it is crucial to consider the most realistic scenarios to determine what represents the maximum technically feasible options and the consequences of implementing more stringent requirements.
Chemical transport models (CTMs) are powerful tools that can be used to understand the transport and transformation of air pollutants, including photochemical smog and secondary aerosols, in the atmosphere. By simulating the dispersion of pollutants, CTMs can help quantify the impacts of emissions reductions strategies. In recent years, CTMs have become increasingly important for air quality management and policymaking (Chemel et al., 2014; Baklanov and Zhang, 2020), particularly in regions with high levels of air pollution like the Po Valley (Squizzato et al., 2013; Vander Hoorn et al., 2022).
In this paper, we started from the results of NINFA-ER CTM, a model systems runned in the LIFE IP-PREPAIR (Po Regions Engaged to Policies of AIR) project and used to investigate the effects of hypothetical emission reduction scenarios on pollutant concentrations in the Po Valley within the project (https://www.lifeprepair.eu/index.php/sdm_downloads/evaluation_scenarios-2022_who/).
During the project, it has been evaluated the effects on concentrations of a strong emission reductions of all anthropogenic sectors reducing SOX, NOX, PM, NH3, NMVOC by 50% and 80% based on 2017 emissions. It has been evaluated the impacts of these scenarios on PM2.5, NO2, and PM10 annual limit concentrations, and assessed their potential to meet the WHO AQG. Additionally, we have considered the feasibility of implementing a “technical” emissions scenario, considering factors such as cost and technical feasibility. At the national level, ENEA, as part of the National Control Programme of Air Pollution, recently developed emission and air quality scenarios to assess compliance with the limits set by the Directive 2016/2284 (NEC) (Piersanti et al., 2021), too.
Based on an inventory simulation reduction, we identified the most feasible emission reduction scenario. Previous studies have indicated that reducing PM2.5 emissions can lead to improvements in air quality and a reduction in health impacts in the Po Valley (Klimont, 2011; Klimont et al., 2017). However, implementing effective emissions reduction strategies can pose challenges, and the most feasible approach depends on various factors, including local conditions, air quality plan and available technical resources. By providing insight into the impacts and feasibility of different emissions reduction strategies, our study aims to inform decision-making processes and support efforts to enhance air quality in the Po Valley. It demonstrates that achieving compliance with the WHO AQG is technically difficult in the Po Valley, which is affected by air pollution, without considering significant reduction in various sectors.
Simulations, presented in briefly herein, were performed within LIFE IP-PREPAIR (https://www.lifeprepair.eu/index.php/sdm_downloads/evaluation_scenarios-2022_who/). In this work, we reported the main set-up of the CTM model and main results already obtained. Further details and a more comprehensive description of the methodology employed, are described in the references mentioned, including (Marongiu et al., 2022a) for emission inventory data and (Veratti et al., 2023) for a detailed description of the CHIMERE set-up and domain application.
The NINFA-ER CTM (Northern Italy Network to Forecast Aerosol Pollution) is an operational air quality (AQ) model used by the Environmental Agency of the Emilia-Romagna Region (Arpae). It incorporates a Chemical Transport Model (CTM), a meteorological model and a pre-processing emissions tool. The CHIMERE model serves as the chemical transport model, facilitating simulations of air pollutant and aerosol transport, dispersion, chemical transformations, and deposition (both dry and wet). The study considers natural emissions (biogenic, sea-salt, and dust), as well as emissions from various anthropogenic sources in the region and neighboring areas. The emissions data for the model come from specific proxy variables associated with each emission activity (e.g., SNAP3 network for traffic emissions, population and urban fabric data for domestic heating, etc.). This model serves as a valuable tool for understanding air quality and pollution dynamics in the study area. The meteorological hourly input for the study is obtained from COSMO, the National numerical weather prediction model utilized by the Italian National Civil Protection Department. COSMO is a hydrostatic, limited-area atmospheric prediction model that employs primitive thermo-hydrodynamical equations to describe compressible flow in a moist atmosphere. It incorporates a range of physical processes through dry and moist parameterization schemes. The initial and boundary conditions (IC/BC) for the Chemical Transport Model (CTM) simulations are sourced from the PrevAir European Scale Air Quality Service project (http://www.prevair.org). The CTM simulations have a horizontal resolution of 0.09 × 0.07°, which corresponds to approximately 5 km, covering the entire northern Italy region.
Furthermore, a data fusion post-processing step is applied to adjust the output of the CHIMERE model using available measured concentrations. This process involves a Kriging with External Drift algorithm, considering the model itself and the elevation above sea level as spatial explanatory variables (Bertino et al., 2003). The validation of the CTM output has been presented in (Supplementary Figure S1 presents the scatter plot of simulated vs. observed values and Supplementary Table S1 shows-statistical scores bias and root mean square error).
Measured PM10, NO2, and PM2.5 concentrations used in the study were derived from the dataset (data flows E1a stand for ambient air measurement validated) reported annually to the European Environmental Agency (EEA, 2021). Only background stations were included in the model adjustment, and annual average concentrations were considered for all examined pollutants (PM10, NO2, PM2.5).
One of the objectives of the LIFE-IP PREPAIR was to implement short- and long-term measures to reduce pollution emissions and improve air quality in the Po Valley region. To achieve this, a task was assigned to harmonize and collect anthropogenic emission data from eight Italian regions of the Po Valley and Slovenia (Marongiu et al., 2022b). This task resulted in the creation of a comprehensive air pollutant emission dataset for the entire domain, covering the years: 2013, 2017, and 2019.
The Italian Regions and autonomous provinces have varied functions in the monitoring and management of air quality, according to European and national legislation and must create and update an emission inventory on their own territory every two or 3 years. The EEA-EMEP Guidebook is the key technical reference in updating emission inventories (www.eea.europa.eu) at both national and local levels, and it plays an important role in estimating comparability (EMEP/EEA, 2016, 2019).
Local emission inventories in Italy are usually compiled at a municipal level and use the SNAP classification. This high spatial resolution can help to better depict the emission pressure on the domain, but it can also make it more difficult to provide consistent time series due to variations in local information availability. In Po Valley, the great part of the Regions developed jointly these local inventories, calling the database “INEMAR system” resulting in a significant level of harmonization in the realization of atmospheric emission estimates (www.inemar.eu). INEMAR is a database that may provide findings for pollutants of interest for air quality, greenhouse gases, PAHs, carbonaceous portion of particle, and heavy metals from a combination of more than 250 activities and 35 fuels.
The process of compiling a local emission inventory in the INEMAR system begins with the collection of a massive amount of information such as activity indicators (e.g., fuel consumption, traffic flows, industrial production), emission factors, and statistical data for the spatial and time-based distribution of emissions.
As reported by the EEA-EMEP Guidebook, with the term tier is described the level of methodological sophistication: tier 1 is the simplest (most basic) technique, tier 2 is the intermediate, and tier 3 is the most demanding in terms of complexity and data needs. The top tier algorithms are integrated into database modules as part of the INEMAR system.
The emission inventories obtained with INEMAR system can be summarized by the following:
Where Ei represents the annual emission for pollutant i (e.g.,: PM10, NH3, NOx, ecc), m represents the municipality of the domain, s represents the source type according to SNAP classification and f is the fuel type (e.g.,: wood, gasoline, natural gas, … ); Is,f,m represents the activity indicator for source s, fuel type f and municipality m and EFs,f,i is the emission factor for pollutant i, source s and fuel f.
Total emissions are obtained by multiplying the activity indicators by the corresponding emission factors and aggregating the values of all municipalities, all sources and all fuel types during a full year. In higher tiers approaches the emission factors and activity indicators are calculated from more complex algorithms.
The NINFA-ER CTM simulation as mentioned in (Veratti et al., 2023), utilized the 2017 emission dataset of LIFE-IP PREPAIR based on the collection of all the data of the INEMAR system and of the data available for the areas not covered by this database relatively to Slovenia and other areas not covered by the system. However, it is not worth noting that a more recent emission inventory referring to 2019 has been managed for Lombardy Region. This updated inventory has been used for the evaluations of the Maximum Reduction Rate (MRR) described in the following sections.
In this study, we reported the results obtained by simulations already done with NINFA-ER CTM (https://www.lifeprepair.eu/index.php/sdm_downloads/evaluation_scenarios-2022_who/).
The four simulations specifically for NO2, PM2.5, and PM10 were performed, including a reference scenario based on the work by Marongiu et al. (2022a). Emissions of SOX, NOX, PM, NH3, and NMVOC were progressively reduced from 10% to 80% across the entire investigation domain. For a more detailed description of these scenarios, you can refer to Table 1.
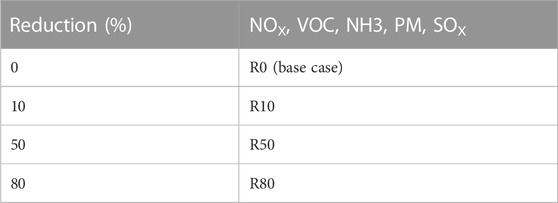
TABLE 1. Definition of the hypothetical emission scenarios.
In addition to the NINFA-ER CTM simulations, two additional scenarios were developed to assess the maximum achievable emission reductions. These scenarios involved implementing the best available technologies and combining them with activity level variation. Section 2.4 and Section 2.5 of the study provide further explanations regarding these scenarios.
This section aims to present the maximum achievable emission reduction through the implementation of the best possible technologies. The emission calculations are based on an annual and regional basis using the Lombardy regional emission inventory updated to 2019, obtained through the INEMAR system (Lgs, 2010; Lombardia, 2017; Lombardia, 2017).
The analysis includes key sectors such as road traffic, wood burning in domestic heating, livestock management and agriculture fertilization. Assuming like the base scenario (E0) the regional emission inventory of Lombardy updated to 2019, the MRR is calculated under the following assumptions.
1. Replacement of all vehicles, except heavy commercial vehicles, with electric vehicles
2. Replacement of heavy goods vehicles with Euro VI vehicles
3. Replacement of all wood-burning appliances with 5 s appliances (dell’Interno, 2017)
4. Conversion of all farms to use the most efficient technologies for NH3 emission reduction in all phases of manure management.
5. Implementation of fertilizers that reduce ammonia volatilization into the atmosphere.
6. Maintenance of all other indicators such as the number of vehicles, distances traveled, electricity production, farms sizes, and areas to be fertilized, at their current levels.
The application of the best available technologies involves replacing all heavy-duty vehicles with Euro VI vehicles and converting cars, light duty vehicles, city buses, coaches, mopeds, and motorcycles to electric powered vehicles. For the latter categories, the conversion of internal combustion engines to electric motors will result in emissions only from brake, tire and road wear assuming a constant mileage of the vehicles. Table 2 summarizes the number of vehicles, annual mileage, and average wear emission factor of PM10 obtained from Lombardy emission inventory of 2019. These emission factors also depend on the vehicle weight and usage mode (for example, the average emission factor of mopeds is slightly higher than that of motorcycles due to their predominant use in urban areas).
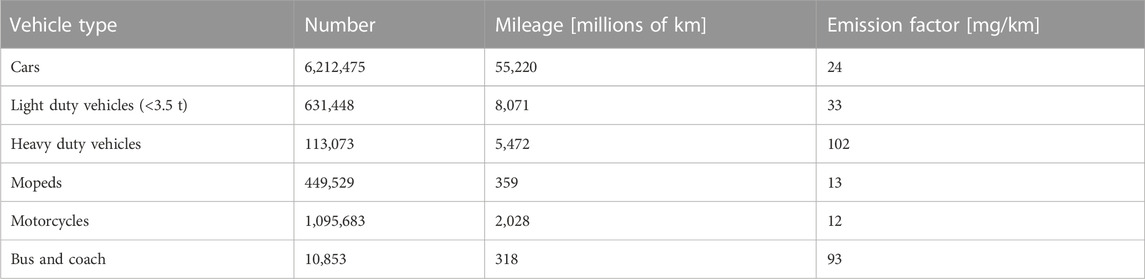
TABLE 2. Number of vehicles circulating in Lombardy in 2019, mileage and PM10 emission factors form tires, braeks and roads.
The almost complete electrification of the circulating fleet will result in an increased demand for electricity. However, the effects on the electricity production system have not been evaluated. It is assumed that the higher consumption will be met through imports or non-emissions causing systems within Lombardy.
Italian National legislation has introduced an emissive classification for domestic biomass burners, with five stars (5-s) indicating the lowest emission appliances. In the scenario of maximum reduction, we assume the complete conversion of all existing single user appliances into 5-s pellet appliances and all the existing boilers into 5-s boilers. The total consumption of woody biomass remains unchanged at approximately 19 PJ (Peta joule). It is estimated that the complete conversion of biomass-fired devices would involve replacing over 600,000 appliances. The emission factors 5-s devices have been estimated on the specified limits provided by (dell’Interno, 2017), taking into account the condensable fraction of emissions. The assumed emission factors are 47 g/GJ for PM in single-user pellet stoves and 9 g/GJ for PM in pellet boilers (Marongiu et al., 2022a).
We consider the complete conversion of effluent management techniques currently implemented in farms to the best performing technologies in terms of ammonia emissions. The maximum emission reduction is calculated while maintaining the same number of livestock units in farms that use these technologies, allowing for the greatest possible reductions in ammonia emissions during housing, field application and complete coverage of all storages. The conversion of farms has been hypothesized for the most representative animal categories in the region, including dairy cows, other cattle, pigs, sows, laying hens and broilers. The emission factor at the farm level that yields the lowest ammonia emissions was calculated using the farm-scale BAT-Tool Plus software implemented within the LIFE IP PREPAIR. The Table 3 presents the technologies for managing livestock manure (LIFE, 2021), categorized by phase and animal type, that correspond to the greatest reductions in ammonia emissions.
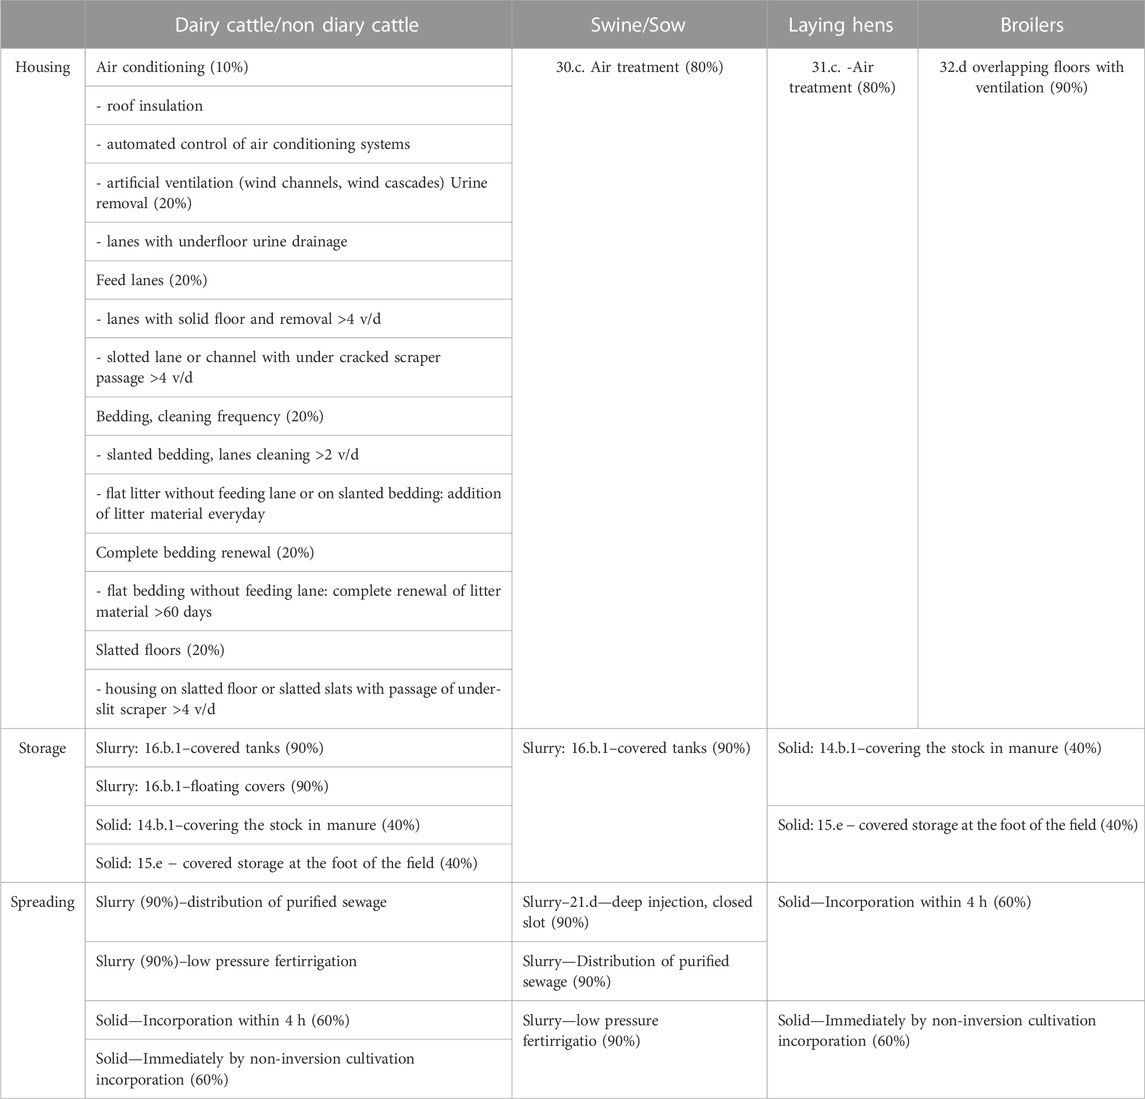
TABLE 3. Agriculture and livestock technique to comply the MRR.
The emission factors obtained result in the following reductions compared to the emission factors reported by ISPRA in the Informative Inventory Report 2021 (ISPRA, 2021). The expected reduction for livestock in terms of emission factors, representative of the national average, are as follows.
• 47% for dairy cows and 76% for other cattle.
• 68% for pigs and 82% for sows.
• 17% for laying hens and 31% for chickens.
The maximum reduction in ammonia emissions can also be obtained by considering the management and/or substitution of synthetic fertilizers in crops. An 80% reduction in NH3 emissions is assumed, considering the replacement of ammonia-releasing mineral fertilizers such as urea with non-ammonia releasing mineral fertilizers (e.g., ammonium nitrate) or by adopting practices such as burying or injecting urea (LIFE, 2021).
In addition to the MRR scenario, calculations were set up to evaluate an additional reduction by considering possible variations in activity indicators (e.g., reducing the number of cars or their mileage). These scenarios, referred to as the MRR + Indicators, are estimated using the following approach:
These scenarios involve the percentage reduction of two indicators.
a) rn, represents the percentage reduction in the number of vehicles on the road, wood-burning appliances or number of animals.
b) rind represents the percentage reduction in average mileage for road transport, energy consumption of wood-burning appliances or the effect of animal weight.
To ensure comprehensive coverage of activities in the emission inventory, the estimation also includes the possibility of assessing the effects of reducing entire macro-sectors or sectors using a single aggregate variable.
This section presents the main output obtained from CTM simulations in different scenarios to assess air quality compliance with the proposed limits by WHO and EU for each pollutant, including the R50 and R80 scenarios. Moreover, the Maximum Reduction Rate Technological Scenario is presented to demonstrate that achieving a reduction of, for instance, 80% is not possible solely through technical measures; it also requires a significant reduction in activities.
To enhance the realism of the pollutant model outputs and ensure a more quantitative representation of their spatial distribution, an adjustment factor obtained from the base scenario R0, is applied to the annual average concentration produced by R10, R50, R80 scenarios (see Figure 1). The model results have been analyzed by considering the most critical indicators in relation to the annual limit values established by the 2008/50/EC Directive (EU, 2008) and the new values proposed by WHO (Table 4).
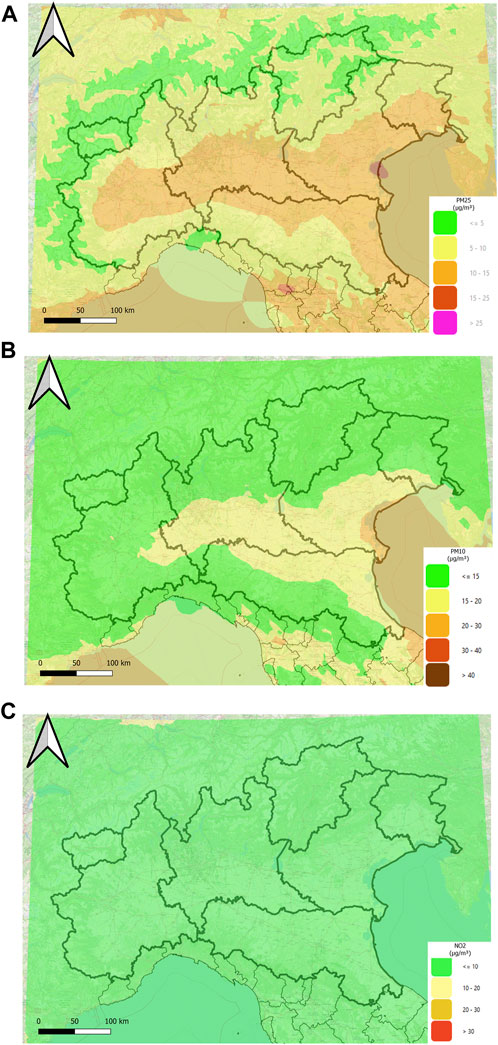
FIGURE 1. (A) Annual average PM2.5 concentration field (R80 scenario–80% reduction) (B) Annual average PM10 concentration field (R80 scenario–80% reduction) (C) Annual average NO2 concentration field (R80 scenario–80% reduction).
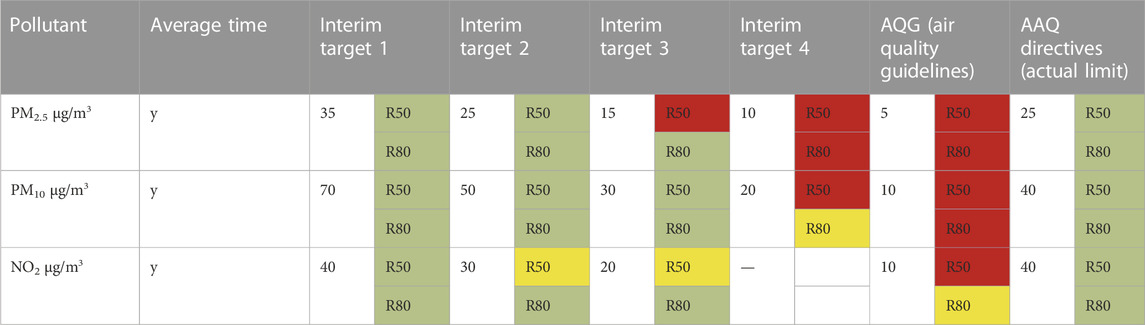
TABLE 4. WHO recommended AQG levels, interim target and EU 2008/50/EC Directive for R50 and R80 scenarios. The green/red colored cells indicate respectively achievement/non achievement of selected target, while yellow means achievement at most monitoring stations.
The figures below illustrate the spatial distribution of PM2.5, PM10, NO2 annual average concentrations for the more effective R80 emission scenario, based on the year 2018. It is important to note that the year 2018 serves at the reference for the meteorological driver COSMO and as based on the previous analysis, it exhibits an intermediate behavior between the year 2017 and 2019. Some validation indicators about the R0 are presented in Supplementary Material.
In the R80 emission scenario, where all primary pollutants and precursors (such as NOx, VOC, NH3, PPM, SOx) are reduced by 80% across most of the Po Valley, the annual mean concentration of PM2.5 (Figure 2) ranges between 5 and 15 μg/m³. Similarly, the PM10 concentration (Figure 2) falls between 15 and 20 μg/m³, while NO2 levels (Figure 2) remain below 10 μg/m³.
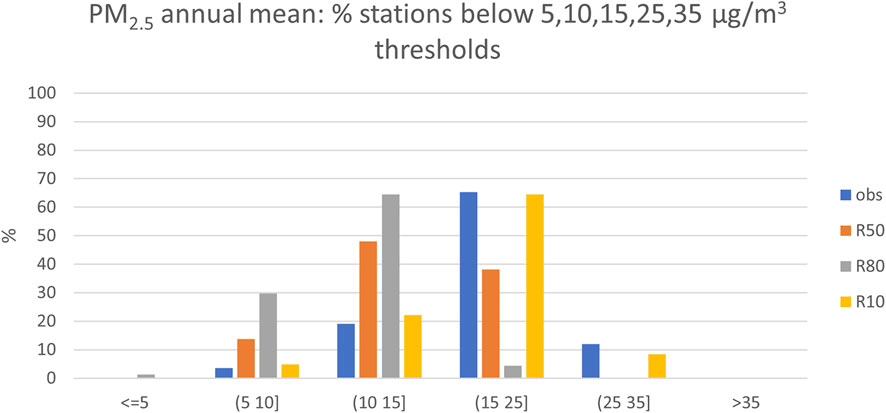
FIGURE 2. PM2.5 annual averages for 2017, 2018, 2019: percentage of all stations below the interim target and AQG level observed (obs) and predicted data in R10, R50, R80 emission scenarios.
Please refer to Figure 1 for a visual representation of the spatial distribution of these pollutant concentrations in the R80 emission scenario for the year 2018.
When considering all the stations in the Po Valley, it becomes evident that only 30% of them would meet the proposed PM2.5 annual limit if there is an 80% reduction in emissions of SOX, NOX, PM, NH3, and NMVOC. This suggests that achieving the desired air quality standards would be challenging, as the majority of stations would still exceed the PM2.5 limit even with a substantial reduction in emissions.
It's important to note that the specific distribution and concentration of pollutants can vary across different locations within the Po Valley, and these results are based on the given scenario and assumptions. Further analysis and evaluation may be necessary to explore alternative strategies or additional measures to attain the desired air quality targets in the region.
This section presents the results of the Maximum Emission Reduction (MRR) scenario, which represents the maximum achievable emission reduction through the application of all available technological measures. It also considers the MRR + scenario, which incorporates the effects of limiting activity levels in addition to the technological measures.
It is important to note that the MRR scenario does not take into account the techno-socio-economic feasibility of completely replacing biomass appliances, vehicle fleets, breeding and manure management technologies in the livestock sector. Therefore, these assessments represent a lower limit estimation of emissions in Lombardy without considering the feasibility and time profile of implementing such measures. Factors such as costs, socioeconomic factors and sustainability in meeting the increasing demand for energy vectors (e.g., electricity and biomass pellets) may make complete implementation challenging.
Table 5 provides a quantification of emissions for the base year (E0), which represents Lombardy region’s emission inventory for 2019, as well as the emissions for the MRR scenario based on the assumptions outlined in Section 2.4.
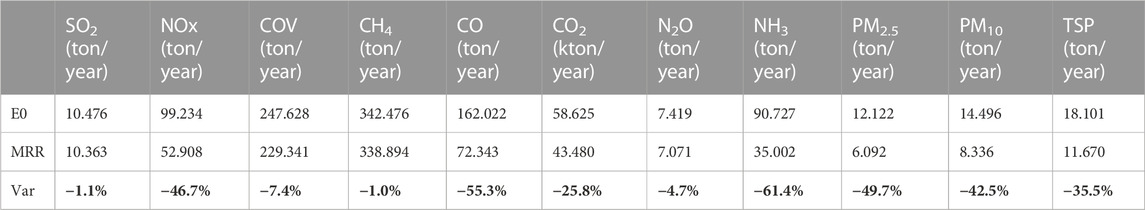
TABLE 5. Emissions for the base year (E0) and MRR emissions scenario in Lombardy. TSP is the total suspended particulate. The percentage is the variation of E0-MRR with respect MRR.
Please note that further analysis and evaluation are necessary to assess the feasibility, costs, and implications of implementing the proposed emission reduction measures in practice.
The comparison between MRR and MRR + Indicator scenario demonstrates the additional reduction in emissions that can be achieved by acting on one or more of activity indicators. In the case of road traffic, it is possible to influence both the number of vehicles and the annual mileage, while in the case of biomass heaters, the number of appliances and average annual consumption can be adjusted. As explained in Section 2.4 and represented by formulation (1), the emission reduction combines the potential reductions in the indicators and uses the overall result to adjust the emissions. For example, if there is a 25% reduction (rn) in the number of cars and a 25% reduction (rind) in their mileage, the correction factor for the remaining emission would be (1–0.25) × (1–0.25) = 0.56.
For each of the sources considered (road traffic, biomass heating and livestock sector), as well as for aggregated sources, it is possible to estimate the maximum additional contribution to the MRR scenario by assuming a 100% reduction in the indicator. The values presented in the table below represent the maximum achievable values for each sector, and the indicators are estimated as an additional change compared to the E0 scenario.
For instance, in the case of the total removal of cars in the MRR scenario, an additional reduction in TSP (total suspended particulate) emissions equal to 11% of the total emissions in the E0 scenario is achieved. It’s important to note that these values represent theoretical maximums and may not be feasible or practical to achieve in reality. They provide insights into the potential impact of further reductions in the activity indicators on emissions.
In Table 6 the indicators are calculated using the following formula:
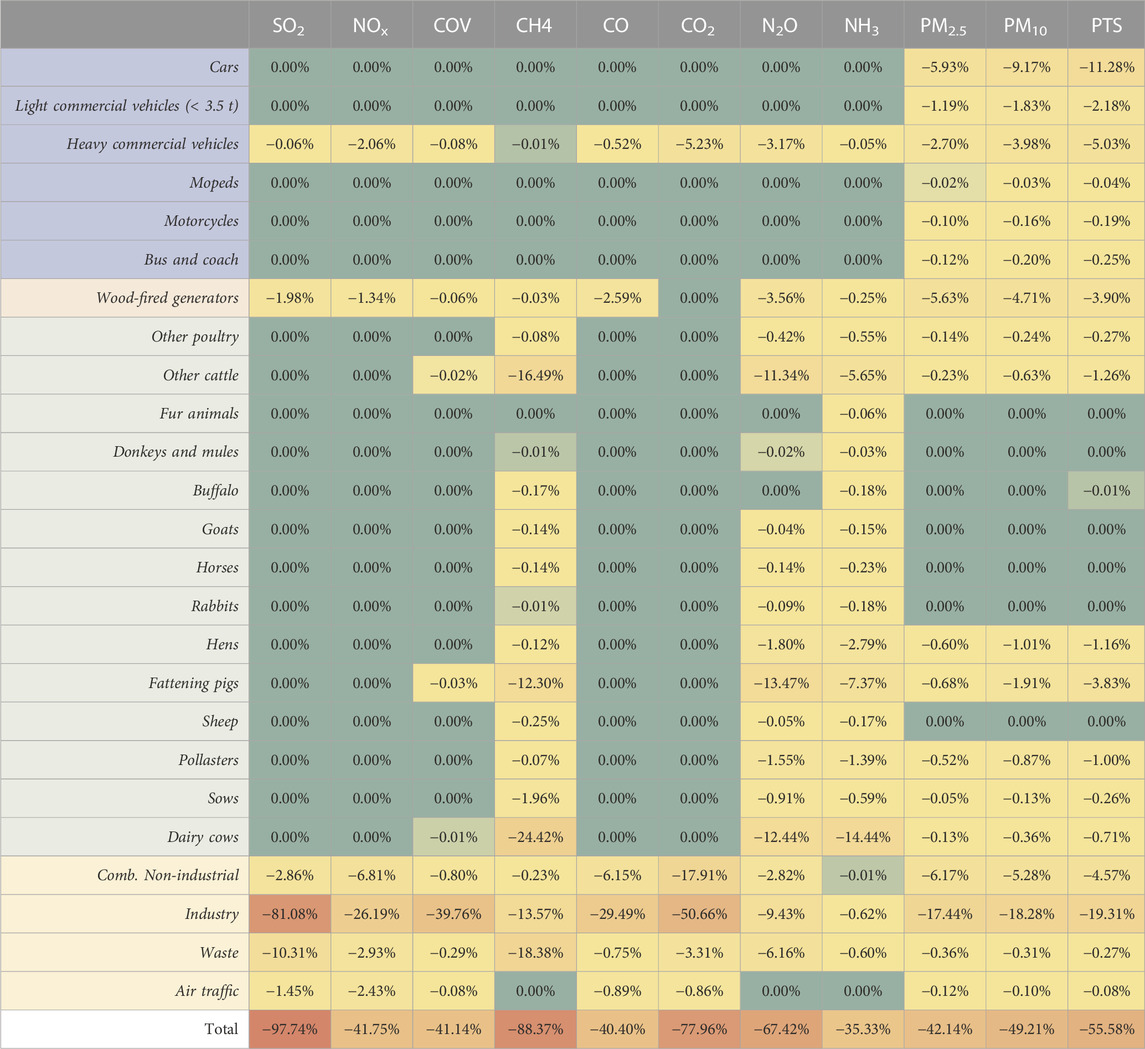
TABLE 6. Additional emission reduction after the application of MRR to each sector obtained by switching to zero all residual activity indicator.
The formula compares the emissions of the MRR_IND_SECT scenario to the base year emissions E0.
a) EMRR_IND_SECT, represents the emissions obtained by applying a zero-level indicator to a specific sector. The sectors are listed in Table 6.
b) EMRR represents the total emissions calculated in the MRR as reported in Table 5.
c) E0 represents the base year emissions as reported in Table 5.
To illustrate with an example, looking at Table 5, it shows that there is a reduction of −38.9% for PM10. By removing all cars (100% indicators, in Table 5) a further reduction of −9% can be achieved. The total reduction would be the sum of these two contributions, resulting in −48%.
Furthermore, if all the sectors listed in Table 5 are completely removed, in addition to the MRR reduction, the emissions would reach zero, effectively creating a zero-emissions situation.
Improving air quality and achieving the suggested pollutants concentrations provided by WHO guidelines is a crucial objective for European, national, and local institutions to safeguard public health. However, achieving near-zero emission limits within a limited timeframe poses significant challenges. This study aims to facilitate a comprehensive and nuanced discussion on the feasibility of emission reduction strategies and whether it is possible, within the given time frame, to attain interim and WHO AQG levels through an 80% reduction of SOX, NOX, PM, NH3, and NMVOC emissions.
The findings of this study demonstrate that despite substantial and ambitiously scaled emission reductions (−50% and −80%), the recommended level will not be met in most areas of the Po Valley at least for some pollutants. Table 4 provides a summary of compliance with the WHO and EU limits for each pollutant, comparing the R50 and R80 scenarios. Key observations are as follows.
1) PM2.5: the R50 scenario (50% reduction) results in compliance with interim target 2, while interim target 3 can only be achieved through the R80 scenario (80% reduction). A closer examination of the 2018 data reveals that only in the R80 scenario does one background station exhibit a concentration value below 5 μg/m³, while the remaining monitoring stations show concentrations between 5 and 15 μg/m³. Figure 2 illustrates that only 30% of stations have the potential to achieve the proposed PM2.5 annual limit.
2) PM10: concentrations in both R50 and R80 scenarios fall between interim target 3 and interim target 4. Further analysis of the 2018 data indicates that in the R80 scenario (80% reduction) nearly all background monitoring stations register concentrations below 20 μg/m³, with 50% of these stations recording values below 15 μg/m³. Only a small number of background stations show annual averages below 10 μg/m³ while concentrations below 15 μg/m³ are observed in just 15% of monitoring traffic stations.
3) NO2: concentrations in traffic stations appear to be significantly higher than those in background. Overall, the more ambitious AQG level can only be met in all background stations through an 80% reduction. Analyzing in more detail the R80 scenario for the year 2018, all background monitoring stations have concentrations below 10 μg/m³, while only a few traffic stations surpass this threshold in terms of annual averages.
The MRR (technological) scenario indicates that achieving an 80% reduction solely through technical measures may not be feasible (Table 4) by 2030 at least in Lombardy Region. This aligns with the findings of the IASA work (GAINS models) at the European Level, where the Maximum Technical Feasible Reduction (MTF) for all the pollutants by 2030 is less than 80%.
To achieve an 80% reduction in emissions within the Lombardy Region, in addition to MRR application, it would be necessary to implement drastic reduction in activities. For example, achieving an 80% reduction could involve, among other possible choices: a) removing 75% of vehicles and b) removing 75% of methane domestic heating systems and 100% of biomass domestic heating systems (already with the best technologies) c) reducing pigs and cattle populations by 60% and d) eliminating 75% of industrial activities. It is evident that achieving an 80% reduction, even after implementing the best technologies (i.e., available nowadays), would requires substantial effort to reduce activity level.
It is important to note that the emission reduction activities presented in this study are purely theoretical hypothesis aimed at quantifying the real effort required to comply with the AQG Limits and WHO Guidance Target that would be considered in the new Directive. We should emphasize that these scenarios are based on the currently available technical elements, and we cannot definitively assess their feasibility or prioritize them.
This study aims to address the crucial objective of improving air quality and achieving pollutant concentrations recommended by WHO guidelines. The feasibility of emission reduction strategies, particularly an 80% reduction of SOX, NOX, PM, NH3, and NMVOC emissions, is thoroughly examined within a limited timeframe. Despite substantial emission reductions (−50% and −80%), the study’s findings reveal that the recommended pollutant levels will not be met in most areas of the Po Valley. For PM2.5, only the R80 scenario achieves interim target 3, while PM10 concentrations in both R50 and R80 scenarios fall between interim target 3 and 4. The more ambitious AQG level for NO2 can only be met through an 80% reduction in all background stations.
Moreover, to reduce the emissions of all the principal pollutants of 80% is a strong task, not achievable also applying all the best available technologies at all the sectors at least in Lombardia region, but it is necessary also a reduction of the activities levels (such as kilometers done by vehicles, energy used for domestic heating, industrial, agricultural, and breeding production).
Achieving compliance with the new AQG limits is complex process involving multiple stakeholders and different tools. Meeting Air Quality limits requires the adoption of Source-Specific emissions standards at EU level, National Emission reduction Directive that align with the limits defined in Air Quality Directive, and the development of Air Quality Plans at the national, regional, and local level. Only through a strong integration of policies across different sectors and governance levels can compliance with these limits be achieved. Furthermore, the discussion surrounding activity reductions should also include an evaluation of the potential impact of these actions and policies (directives, regulations, and plans) also on different outcomes (GDP, unemployment and so on). Further research efforts, such as employing advanced modeling techniques with the 2019 inventory emissions and applying feasible technical scenarios to multiple models, could provide a deeper understanding of the feasibility and cost implications associated with achieving the desired emission reductions. Additionally, such studies could help identify the key stakeholders and actors involved in the process, which is crucial for effectively implementing the WHO Guidelines.
The original contributions presented in the study are included in the article/Supplementary Material, further inquiries can be directed to the corresponding author.
AM and GF organized the emissions database. LC wrote the first draft of the manuscript. LC and AM wrote sections of the manuscript. All authors contributed to the article and approved the submitted version.
This research was funded by the LIFE-IP PREPAIR (Po Regions Engaged to Policies of AIR) project, Grant Number LIFE15 IPE/IT/000013.
Acknowledgment are given to all the beneficiaries of the project LIFE-IP PREPAIR: Emilia-Romagna Region (Project Coordinator) Veneto Region, Lombardy Region, Piedmont Region, Friuli Venezia Giulia Region, Autonomous Province of Trento, Regional Agency for Environment of Emilia-Romagna (ARPAE), Regional Agency for Environment of Veneto, Regional Agency for Environment of Piedmont, Regional Agency for Environmental Protection of Lombardy, Environmental Protection Agency of Valle d’Aosta, Environmental Protection Agency of Friuli Venezia Giulia, Slovenian Environment Agency, Municipality of Bologna, Municipality of Milan, City of Turin, ART-ER, Lombardy Foundation for Environment. We want to thank also generative AI technology (ChatGPT) for editing spelling and minor check of the native language.
The authors declare that the research was conducted in the absence of any commercial or financial relationships that could be construed as a potential conflict of interest.
All claims expressed in this article are solely those of the authors and do not necessarily represent those of their affiliated organizations, or those of the publisher, the editors and the reviewers. Any product that may be evaluated in this article, or claim that may be made by its manufacturer, is not guaranteed or endorsed by the publisher.
The Supplementary Material for this article can be found online at: https://www.frontiersin.org/articles/10.3389/fenvs.2023.1240816/full#supplementary-material
ApSimon, H., Oxley, T., Woodward, H., Mehlig, D., Holland, M., and Reeves, S. (2023). Integrated assessment modelling of future air quality in the UK to 2050 and synergies with net-zero strategies. Atmos. (Basel) 14, 525. doi:10.3390/atmos14030525
Baklanov, A., and Zhang, Y. (2020). Advances in air quality modeling and forecasting. Glob. Transitions 2, 261–270. doi:10.1016/j.glt.2020.11.001
Bertino, L., Evensen, G., and Wackernagel, H. (2003). Sequential data assimilation techniques in oceanography. Int. Stat. Rev. 71, 223–241. doi:10.1111/j.1751-5823.2003.tb00194.x
Bourdrela, T., Bindb, M-A., Béjotc, Y., and Olivier Moreld, J.-F. A. (2018). Cardiovascular effects of air pollution HHS Public Access. Physiol. Behav. 176, 139–148. doi:10.1016/j.acvd.2017.05.003.Cardiovascular
Carnell, E., Vieno, M., Vardoulakis, S., Beck, R., Heaviside, C., Tomlinson, S., et al. (2019). Modelling public health improvements as a result of air pollution control policies in the UK over four decades - 1970 to 2010. Environ. Res. Lett. 14, 074001. doi:10.1088/1748-9326/ab1542
Chemel, C., Fisher, B. E. A., Kong, X., Francis, X. V., Sokhi, R. S., Good, N., et al. (2014). Application of chemical transport model CMAQ to policy decisions regarding PM2.5 in the UK. Atmos. Environ. 82, 410–417. doi:10.1016/j.atmosenv.2013.10.001
Clappier, A., Thunis, P., Beekmann, M., Putaud, J. P., and de Meij, A. (2021). Impact of SOx, NOx and NH3 emission reductions on PM2.5 concentrations across Europe: Hints for future measure development. Environ. Int. 156, 106699. doi:10.1016/j.envint.2021.106699
Cohen, A. J., Brauer, M., Burnett, R., Anderson, H. R., Frostad, J., Estep, K., et al. (2017). Estimates and 25-year trends of the global burden of disease attributable to ambient air pollution: An analysis of data from the global burden of diseases study 2015. Lancet 389, 1907–1918. doi:10.1016/S0140-6736(17)30505-6
Crippa, M., Janssens-Maenhout, G., Dentener, F., Guizzardi, D., Sindelarova, K., Muntean, M., et al. (2015). Forty years of improvements in European air quality: The role of EU policy–industry interplay. Atmos. Chem. Phys. Discuss. 15, 20245–20285. doi:10.5194/acpd-15-20245-2015
De Angelis, E., Carnevale, C., Tolari, V., Turrini, E., and Volta, M. (2021). “Assessing the impact of the Po valley air quality plan (Italy),” in Air pollution modeling and its application XXVII. Editors C. Mensink, and V. Matthias (Berlin, Heidelberg: Springer), 187–193.
D’Elia, I., Piersanti, A., Briganti, G., Cappelletti, A., Ciancarella, L., and Peschi, E. (2018). Evaluation of mitigation measures for air quality in Italy in 2020 and 2030. Atmos. Pollut. Res. 9, 977–988. doi:10.1016/j.apr.2018.03.002
EU (2004). Directive 2004/107/EC of the European Parliament and of the Council of 15 December 2004 relating to arsenic, cadmium, mercury, nickel and polycyclic aromatic hydrocarbons in ambient air.
EU (2008). Directive 2008/50/EC of the European parliament and of the council of 21 may 2008 on ambient air quality and cleaner air for Europe.
European Commission (2021). Fit for 55 package: Making europe’s climate and energy legislation fit for the green deal. Brussels: European Commission.
Finardi, S., Silibello, C., D’Allura, A., and Radice, P. (2014). Analysis of pollutants exchange between the Po Valley and the surrounding European region. Urban Clim. 10, 682–702. doi:10.1016/j.uclim.2014.02.002
Khomenko, S., Cirach, M., Pereira-Barboza, E., Mueller, N., Barrera-Gómez, J., Rojas-Rueda, D., et al. (2021). Premature mortality due to air pollution in European cities: A health impact assessment. Lancet Planet. heal. 5, e121–e134. doi:10.1016/S2542-5196(20)30272-2
Khomenko, S., Pisoni, E., Thunis, P., Bessagnet, B., Cirach, M., Iungman, T., et al. (2023). Spatial and sector-specific contributions of emissions to ambient air pollution and mortality in European cities: A health impact assessment. Lancet Public Heal 8, e546–e558. doi:10.1016/s2468-2667(23)00106-8
Klimont, Z. (2011). IR-11-027 integrated ammonia abatement – modelling of emission control potentials and costs in GAINS zbigniew Klimont wilfried winiwarter approved by markus amann. Integr. Vlsi J. 71.
Klimont, Z., Kupiainen, K., Heyes, C., Purohit, P., Cofala, J., Rafaj, P., et al. (2017). Global anthropogenic emissions of particulate matter including black carbon. Atmos. Chem. Phys. 17, 8681–8723. doi:10.5194/acp-17-8681-2017
Lgs, D. (2010). Attuazione della direttiva 2008/50/CE relativa alla qualità dell’aria ambiente e per un’aria più pulita in Europa (GU n.216 del 15-9-2010 - suppl, 155. Ordinario n. 217).
Lim, C. C., Hayes, R. B., Ahn, J., Shao, Y., Debra, T., Jones, R. R., et al. (2019). Pollution and diabetes mortality in the US. 330–336. doi:10.1016/j.envres.2018.04.011.Association
Lombardia, A. R. P. A. (2017). IN.EM.AR, inventario emissioni in atmosfera: Emissioni in regione Lombardia nell’anno 2017 - versione in revisione pubblica. ARPA Lombardia settore monitoraggi ambientali. Available at: http://www.inemar.eu/xwiki/bin/view/InemarDatiWeb/Inventario+delle+emissioni+in+atmosfera.
Marongiu, A., Angelino, E., and Lanzani, G. (2022a). TFEIP, task force on emission inventories and projections, A group established under the unece convention on long-range transboundary air PollutionTFEIP, task force on emission inventories and projections, A group established under the unece convention on. Available at: https://www.tfeip-secretariat.org/_files/ugd/e5a9c7_50bad2a5b1a24ae886ddd1d59197a8f4.pdf.
Marongiu, A., Angelino, E., Moretti, M., Malvestiti, G., and Fossati, G. (2022b). Atmospheric emission sources in the Po-basin from the LIFE-IP PREPAIR project. Open J. Air Pollut. 11, 70–83. doi:10.4236/ojap.2022.113006
Piersanti, A., D’Elia, I., Gualtieri, M., Briganti, G., Cappelletti, A., Zanini, G., et al. (2021). The Italian national air pollution control programme: Air quality, health impact and cost assessment. Atmos. (Basel) 12, 196. doi:10.3390/atmos12020196
Region, L. (2006). Regional Law n. 24/2006 Regulations for the prevention and reduction of air emissions to protect health and the environment.
Squizzato, S., Masiol, M., Brunelli, A., Pistollato, S., Tarabotti, E., Rampazzo, G., et al. (2013). Factors determining the formation of secondary inorganic aerosol: A case study in the Po valley (Italy). Atmos. Chem. Phys. 13, 1927–1939. doi:10.5194/acp-13-1927-2013
Thunis, P., Clappier, A., Beekmann, M., Putaud, J. P., Cuvelier, C., Madrazo, J., et al. (2021). Non-linear response of PM&lt;sub&gt;2.5&lt;/sub&gt; to changes in NO&lt;sub&gt;<i&gt;x&lt;/i&gt;</sub&gt; and NH&lt;sub&gt;3&lt;/sub&gt; emissions in the Po basin (Italy): Consequences for air quality plans. Atmos. Chem. Phys. 21, 9309–9327. doi:10.5194/acp-21-9309-2021
Turnock, S. T., Butt, E. W., Richardson, T. B., Mann, G. W., Reddington, C. L., Forster, P. M., et al. (2016). The impact of European legislative and technology measures to reduce air pollutants on air quality, human health and climate. Environ. Res. Lett. 11, 024010. doi:10.1088/1748-9326/11/2/024010
Vander Hoorn, S., Johnson, J. S., Murray, K., Smit, R., Heyworth, J., Lam, S., et al. (2022). Emulation of a chemical transport model to assess air quality under future emission scenarios for the southwest of western Australia. Atmos. (Basel) 13, 2009. doi:10.3390/atmos13122009
Velders, G. J. M., Maas, R. J. M., Geilenkirchen, G. P., de Leeuw, F. A. A. M., Ligterink, N. E., Ruyssenaars, P., et al. (2020). Effects of European emission reductions on air quality in The Netherlands and the associated health effects. Atmos. Environ. 221, 117109. doi:10.1016/j.atmosenv.2019.117109
Veratti, G., Stortini, M., Amorati, R., Bressan, L., Giovannini, G., Bande, S., et al. (2023). Impact of NOx and NH3 emission reduction on particulate matter across Po valley: A LIFE-IP-PREPAIR study. Atmos. (Basel) 14, 762. doi:10.3390/atmos14050762
Wang, H., Zhao, Z., Winiwarter, W., Bai, Z., Wang, X., Fan, X., et al. (2021). Strategies to reduce ammonia emissions from livestock and their cost-benefit analysis: A case study of sheyang county. Environ. Pollut. 290, 118045. doi:10.1016/j.envpol.2021.118045
WHO (2021). WHO global air quality guidelines: Particulate matter (PM2.5 and PM10), ozone, nitrogen dioxide, sulfur dioxide and carbon monoxide. Available at: https://apps.who.int/iris/handle/10665/345329.
Keywords: air pollution, Po Valley, air quality guidelines, CTM, emission reductions, feasibility
Citation: Colombo L, Marongiu A, Malvestiti G, Fossati G, Angelino E, Lazzarini M, Gurrieri GL, Pillon S and Lanzani GG (2023) Assessing the impacts and feasibility of emissions reduction scenarios in the Po Valley. Front. Environ. Sci. 11:1240816. doi: 10.3389/fenvs.2023.1240816
Received: 15 June 2023; Accepted: 22 August 2023;
Published: 05 September 2023.
Edited by:
Lara Aleluia Reis, European Institute of Economics and the Environment, ItalyReviewed by:
Dimitrios Melas, Aristotle University of Thessaloniki, GreeceCopyright © 2023 Colombo, Marongiu, Malvestiti, Fossati, Angelino, Lazzarini, Gurrieri, Pillon and Lanzani. This is an open-access article distributed under the terms of the Creative Commons Attribution License (CC BY). The use, distribution or reproduction in other forums is permitted, provided the original author(s) and the copyright owner(s) are credited and that the original publication in this journal is cited, in accordance with accepted academic practice. No use, distribution or reproduction is permitted which does not comply with these terms.
*Correspondence: Loris Colombo, bG8uY29sb21ib0BhcnBhbG9tYmFyZGlhLml0
†ORCID: Loris Colombo, orcid.org/0000-0001-6831-7555
Disclaimer: All claims expressed in this article are solely those of the authors and do not necessarily represent those of their affiliated organizations, or those of the publisher, the editors and the reviewers. Any product that may be evaluated in this article or claim that may be made by its manufacturer is not guaranteed or endorsed by the publisher.
Research integrity at Frontiers
Learn more about the work of our research integrity team to safeguard the quality of each article we publish.