- 1School of Health Science, Mae Fah Luang University, Chiang Rai, Thailand
- 2Department of Physics and Materials Science, Faculty of Science, Chiang Mai University, Chiang Mai, Thailand
The distribution and concentration of air pollutants from infectious waste incineration between 2019 and 2021 were examined in this study using an AERMOD model, including sulfur dioxide (SO2), nitrogen dioxide (NOx), and particulate matter (PM2.5). The MAIAC-AOD value at a 1 km resolution was used to develop a regression model with meteorological information for predicting PM2.5, which was then compared with the concentration from the AERMOD simulation. The following maximum 1-h, 24-h, and annual average concentrations of all pollutants were found to have occurred in 2019. The distribution of SO2 and NOx in 1 h was largest in 2020 at 1,000 m to the northwest, with concentrations of 37.68 and 93.99 μg/m3, respectively. The 24-h concentrations of SO2 and NOx were greatest in 2021 at 3.63 and 8.90 μg/m3, respectively, 720 m northeast of the stack. The annual concentrations of SO2 and NOx were highest in 2019 at 0.56 and 1.36 μg/m3, respectively. The highest annual PM2.5 concentration was 0.033 μg/m3, 730 m to the northeast in 2019. The predicted PM2.5 using MAIAC-AOD correlated with the simulated value from AERMOD, with R2 values of 0.7630, 0.7607, and 0.6504 for 2019, 2020, and 2021, respectively, which were higher closer to the stack than outside. As a result, investigations into the distribution of air pollution should benefit from the integration of air modeling and satellite information.
1 Introduction
The negative effects of air pollution on our lives have increased significantly. An important environmental risk factor for the development of lung cancer and cardiopulmonary disease is prolonged exposure to fine particle air pollution caused by combustion (Pope et al., 2002). Hospital admission for acute respiratory infections was associated with short-term ambient air pollution exposure, and the main air pollutants compromising respiratory health were PM10, PM2.5, and NO2 (Xia et al., 2017). According to the health impact assessment, chronic exposure to PM2.5 causes over 50,000 fatalities each year in Thailand. Based on the worth of a statistical life, the overall expense of this excess mortality in 2016 amounted to close to 15% of Thailand’s GDP (Mueller et al., 2021). It is primarily brought about by human actions or behaviors, such as population growth, fuel demand, and resource scarcity. Industry, transportation, agriculture, waste management, and transportation are some of the main sources of air pollution. Nonetheless, PM2.5 may influence weather conditions, such as the frequency and duration of precipitation, as PM2.5 may serve as sufficient cloud condensation nuclei for precipitation, resulting in lower precipitation on polluted days than on clean days (Zheng et al., 2020), with recent evidence suggesting that if PM2.5 was controlled, cloud condensation nuclei would be reduced (Wang et al., 2023).
The amount of infectious waste generated by hospitals under the Ministry of Public Health, hospitals under the Department of Academic Affairs within the Ministry of Public Health, sub-district hospitals for health promotion, hospitals associated with other ministries, private hospitals, private clinics, animal hospitals, and a dangerous infection laboratory was 47,962 tons in 2020, down 10% from 2019. Of this amount, 47,440 tons (98.91%) were appropriately managed (Pollution Control Department PCD, 2020). Sulfur dioxide, oxide of nitrogen, and particulate matter were the primary air pollutants produced by infectious waste incineration. These pollutants were tracked to ensure that the emissions requirement was met (Walker and Cooper, 1992).
The National Meteorological Society of the United States, the American Meteorological Society, and the Environmental Protection Agency developed the AERMOD model (American Meteorological Society and U.S. Environmental Protection Agency Regulatory Model) (U.S.EPA, 2021). It was employed to estimate how pollutants will disperse in the atmosphere near the surface. The most popular model for predicting the concentration of pollution spreading from its source over a radius of up to 50 km is AERMOD. There are three primary sections of the information required to prepare AERMOD air models for import: meteorological data obtained from the preparation; data on the area’s height from the preparation’s AERMET subprogram; and information on the AERMEP subprogram and air pollution source. In Thailand, AERMOD was used to model the level of air pollution arising from industrial sources (Jittra et al., 2015; Khamyingkert and Thepanondh, 2015). The level of air pollutants at surrounding receptors and the potential of pollutant reduction resulting from suggested clean technology solutions were evaluated using AERMOD [9 2]. AERMOD was used as part of the environmental impact assessment to investigate the NO2 emissions from a cement complex (Seangkiatiyuth1 et al., 2011) and assess the impact of SO2 emissions from the coal-fired power plant’s exhaust stack (Srirattana and Piaowan, 2020). AERMOD was used to determine the ground-level concentrations of air pollutants from the municipal solid-waste incinerators (Srivieng et al., 2021).
However, the ground-based monitoring site did not cover all the areas of air emission sources. The Multi-Angle Implementation of Atmospheric Correction (MAIAC-AOD) technique simultaneously retrieves aerosol optical depth (AOD) at a 1 km spatial resolution with a temporal series of MODIS measurements on a daily basis (Lyapustin and Wang, 2008). Using the retrieved 1-km AOD and Supplementary Data, such as meteorological and land cover, the regional distribution of PM2.5 was approximated more precisely than with the 3-km AOD (Hu et al., 2014; Chen et al., 2021). In Thailand, it was proposed that MAIAC-AOD would validate the predicted PM2.5 based on MODIS surface reflectance (Nakapan and Hongthong, 2022). MAIAC-AOD showed high accuracy in East Asia and significant heterogeneity among study sites, and it performed well in areas with high vegetation cover and flat terrain (Wang et al., 2022). Even on high terrain, it produced an excellent representation of ground-level fine particulate matter, which was beneficial for monitoring PM2.5 and comprehending variation in PM2.5 pollution. (He et al., 2021). Additionally, it was used to forecast the daily ground PM2.5 concentration to assess the impacted area for air pollution management mitigation (Xiao et al., 2017; Han et al., 2018).
With the readily available spatial and temporal data of the MAIAC-AOD and the advantage of the AERMOD mathematical model, this study aimed to examine the possibilities of using MAIAC-AOD to determine the concentration and distribution of particulate matter (PM2.5) from infectious waste incinerators using the linear regression model. However, the distribution of nitrogen oxides (NOx) and sulfur dioxide (SO2) was also analyzed using AERMOD as they were the primary pollutants from the incinerator. We obtained the daily MAIAC-AOD data incorporated with the meteorology data for the AERMOD simulation. Then, the validation of air pollutant concentrations between predicted PM2.5 by MAIAC-AOD and PM2.5 by AERMOD was performed to investigate the relationship and possibility of using MAIAC-AOD to investigate the environmental and health impact assessment of the sensitive area surrounding an infectious waste incinerator, as normally, air quality monitoring of infectious waste stacks was carried out twice a year in accordance with regulations, which could be too late to detect the risk of air pollution from a waste incinerator. As a result, preliminary PM2.5 estimation using MAIAC-AOD, which has a high temporal (daily) and spatial distribution (1 km), should be particularly beneficial for assessing the environmental and health impacts of stationary emission sources.
2 Materials and methods
2.1 Study domain
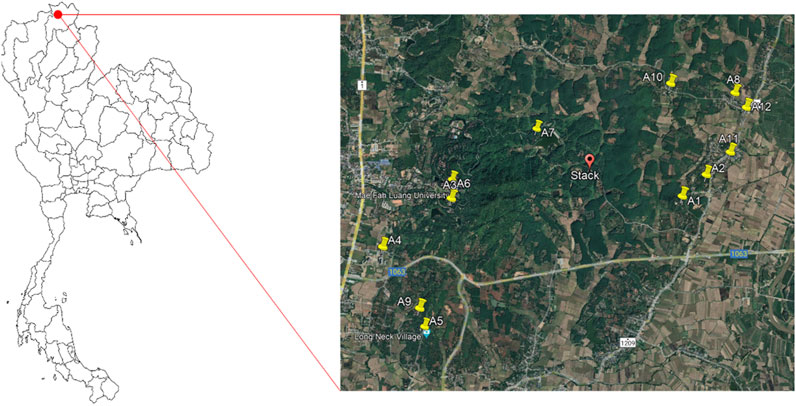
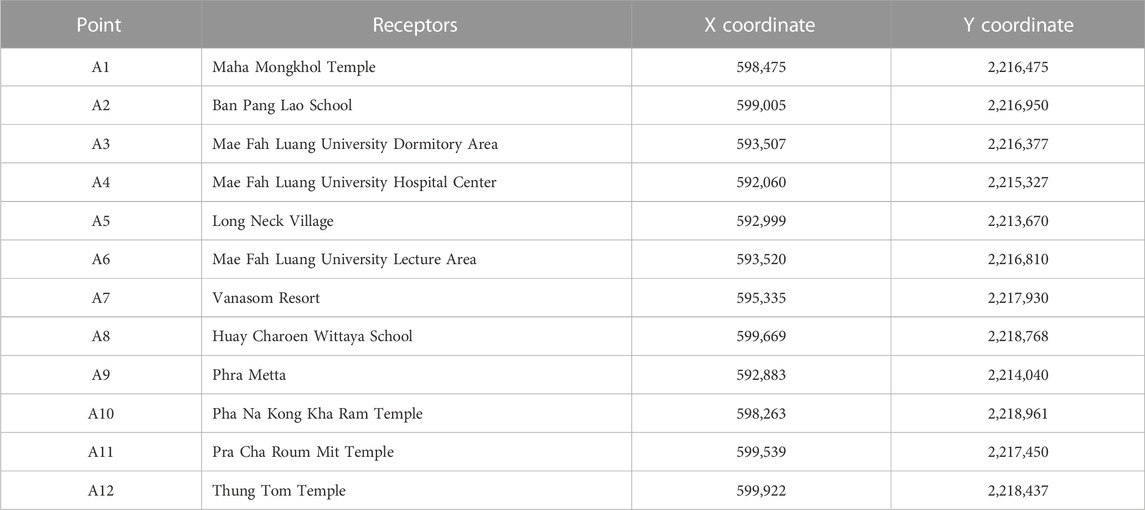
The infectious waste incinerator of Mae Fah Luang University is located at coordinates 59°65′30″N and 22°17′16″E in Chiang Rai province, northern Thailand. The incinerator consisted of two controlled air chambers and used LPG as a fuel. The capacity of the incinerator was 2 tons/day, and the working time was approximately 60–70 h/month. It produced 8%–10% of bottom ash from the incineration process and released approximately 10% of fly ash from the air pollution control process. The air pollution control devices were a Muti Cyclones Separator for fly ash and a backhouse filter for dioxin. The incinerator has been operated since 2019 by receiving infectious waste from healthcare facilities, such as hospitals and district health promotion hospitals, inside the province. It is surrounded by a forest and communities, and there are twelve sensitive places within a 10 km2 radius, including public areas, temples, and schools, as indicated in Figure 1 and Table 1.
2.2 Data collection
Surface meteorological information in the SCRAM format, including wind speed, wind direction, ceiling height, dry bulb temperature, total cloud cover, and opaque cloud cover, was collected from the Wyoming University website and the Chiang Rai Meteorological Station in Thailand. Albedo, Bowen ratio, and surface roughness length included the upper air meteorological variables acquired from https://ruc.noaa.gov/raobs/. The information on air pollutants released from the infectious incinerators including nitrogen dioxide (NOx), sulfur dioxide (SO2), and particle matter (PM2.5) was gathered from the annual monitoring report of the infectious waste incinerator of Mae Fah Luang University. The information on the infectious waste stack and emissions, which was used in the AERMOD model calculation, is displayed in Supplementary Table S1. Terrain data in the format of STRM DEM (Shuttle Radar Topography Mission) with a height of 90 m resolution were obtained from https://earthexplorer.usgs.gov. The daily MAIAC-AOD at a 1 km resolution with 550 nm in HDF4 format (DAAC) was collected from https://search.earthdata.nasa.gov/.
2.3 Data analysis
The following surface meteorological variables were input into AERMET and subsequently translated to the SPC and PFL formats for further AERMOD simulation: wind speed, wind direction, ceiling height, dry bulb temperature, total cloud cover, opaque cloud cover, albedo, and surface roughness length (US EPA, 2004; US EPA, 2009). AERMOD received information about the concentrations of SO2, NOx, and PM2.5 from the stack. Finally, AERMOD performed simulations of all three types of data to estimate SO2, NOx, and PM2.5 dispersions within a 10 km2 area surrounding the infectious waste stack, as shown in Supplementary Figure S1. The annual average MAIAC-AOD and wind speed data were used to develop a linear regression model for predicting PM2.5 concentration because temperature and humidity were equal in the 10 km2 area; therefore, data were not included in the linear regression model development. The PM2.5 predicted by MAIAC-AOD was then compared with the PM2.5 predicted by AERMOD. The annual average estimated PM2.5 by MAIAC of the 1-km grid cell within the 10 km2 area surrounding the stack was overlaid on the AERMOD simulated pollution distribution map.
3 Results
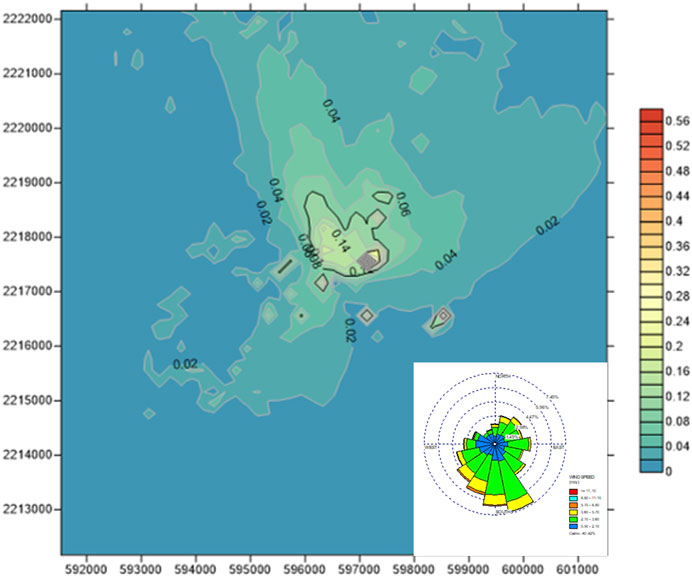
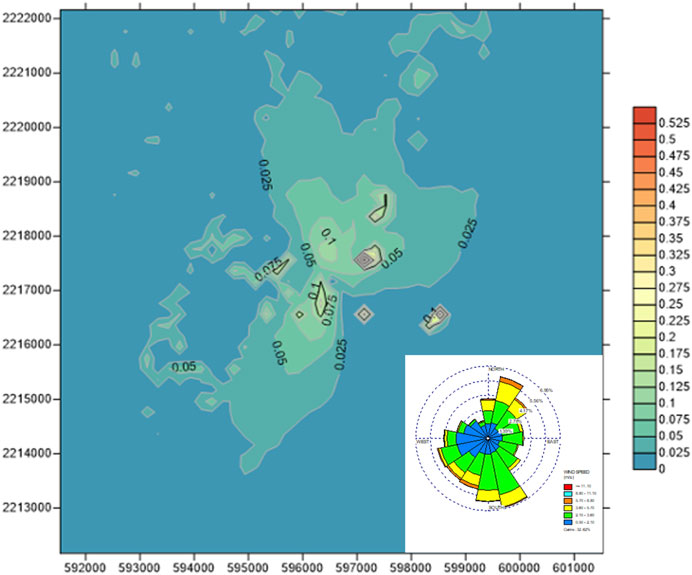
The distribution of air pollutants included SO2, NOx, and PM2.5, which were emitted from the infectious waste incinerator, and were simulated by the AERMOD model for the three average time periods, including at 1 h, 24 h, and annually. The simulated concentration was compared with National Ambient Air Quality Standards (NAAQS); the maximum simulated concentration of air pollutants complied with these standards for 1, 24 h, and the entire year, as shown in Table 2. The result from our study was similar to the health risk assessment for the municipal solid-waste incinerators in the five provinces of Thailand, Lamphun, Khon Kaen, Rayong, Phra Nakhon Si Ayutthaya, and Surat Thani, where the levels of SO2 and NOx complied with the National Ambient Air Quality Standards (Srivieng et al., 2021). The AERMOD simulation also identified the location and distance of the highest pollutant concentration from the stack. The highest SO2 and NOx concentrations in 1 h occurred in 2020 at 1,000 m in the northwest, with values of 37.68 and 93.33 μg/m3, respectively. The 24-h concentrations of SO2 and NOx were highest in 2021, with values of 3.63 and 8.90 μg/m3, respectively, 720 m northeast of the stack. Figures 2, 3 show the annual SO2 and NOx concentrations, which were highest in 2019, with respective values of 0.56 and 1.36 μg/m3, 720 m and 730 m to the northeast, respectively. However, the other investigation found that the greatest radii of SO2 and NOx distributions from the stack were within 500 m (Koomsang et al., 2015; Afzali et al., 2016), which might have been caused by the wind speed in the area. The maximum PM2.5 concentration of 0.033 μg/m3 was discovered in 2019, 730 m to the northeast. The distribution of SO2 over 24 h was much more diffused than the annual one, as shown in Supplementary Figure S2. By contrast, as shown in Supplementary Figure S3, the annual NOx dispersion and concentration between 2019 and 2021 were distinct from the 24-h and annual NOx dispersion because the annual NOx was dispersed to the north, whereas the 24-h NOx was not.
According to AERMOD simulation results, the wind direction had the largest effect on PM2.5 dispersion, which gradually decreased with increasing distance downwind (Eibedingil et al., 2022). As illustrated in Figures 4–6, the annual average of the MAIAC-AOD value within a 10 km2 radius in 2019 was higher than in 2020 and 2021, with values ranging between 0.59 and 0.88, 0.48–0.65, and 0.49–0.66, respectively. However, the distribution pattern of AOD indicated that the PM2.5 concentration was correlated with the value of AOD and was higher in the vicinity of the stack than in the outside area. When the predicted PM2.5 by MAIAC-AOD was overlaid on the AERMOD findings, it was revealed that it had a greater concentration of PM2.5 than the area closest to it. The findings of numerous studies support the hypothesis that the MAIAC-AOD was related to the PM2.5 concentration as it demonstrated good agreement between the predicted and measured PM2.5 concentrations (Arvani et al., 2016). In addition, the value of MAIAC-AOD was high in several sensitive locations, such as in 2019, when AOD at A1 was 0.88 with a predicted PM2.5 by AOD of 0.014 μg/m3, in 2020, when AOD at A10 was 0.62 with a predicted PM2.5 by AOD of 0.013 μg/m3, and in 2021, when AOD at A1 was 0.66 with a predicted PM2.5 by AOD of 0.013 μg/m3; these areas contained temples and therefore the high AODs were influenced by cremations. Over a 24-h period, the SO2 and NOx concentrations produced by AERMOD’s simulation of cremation were 3.29 and 17.54 μg/m3, respectively (Couper et al., 2012), which was slightly greater than the study’s finding that cremation was a potential additional source of PM2.5 in the two areas (A1 and A10). However, most sensitive areas were not impacted by the infectious waste incinerator pollution, but some of the areas still have high levels of MAIAC-AOD, thus it is crucial to investigate the other sources of PM2.5 emission in the future. Additionally, as the World Health Organization has suggested an annual mean background concentration of PM2.5 of 10 μg/m3 (Voogt et al., 2009), when the simulated PM2.5 was combined with the background concentration, it did not exceed the standard air quality of 15 μg/m3. Supplementary Table S2 shows the average annual predicted PM2.5 by MAIAC-AOD for each 1 km grid cell for each designated sensitive area within the 10 km2 area of waste incineration, with the average annual PM2.5 concentrations that were simulated by the AERMOD. Furthermore, between 2019, 2020, and 2021, the correlation between the predicted PM2.5 by MAIAC-AOD and the simulated PM2.5 concentrations by AERMOD was 0.7630, 0.7607, and 0.6504, respectively.
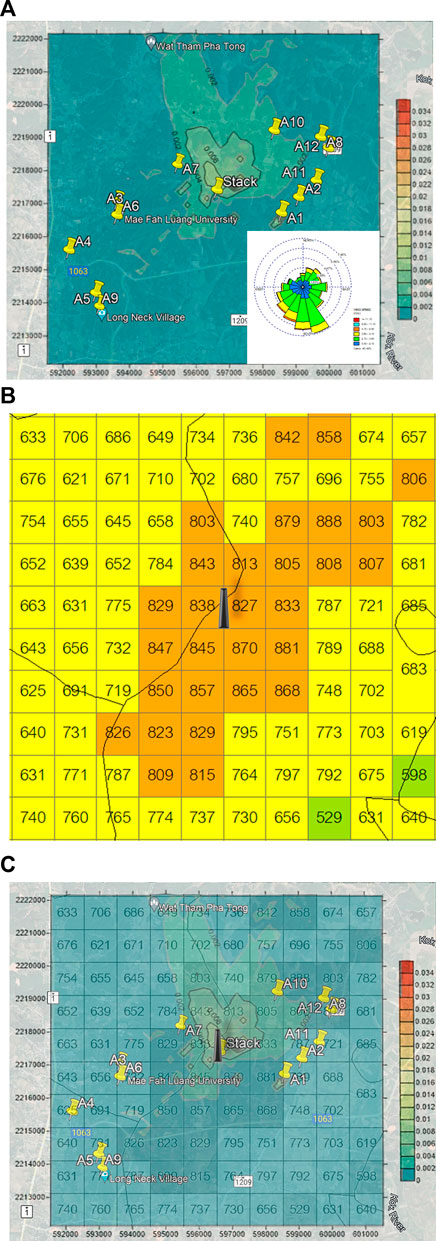
FIGURE 4. Dispersions of simulated PM2.5 concentrations (µg/m3) from the infectious waste incineration and MAIAC-AOD. (A) Annual average PM2.5 concentration by AERMOD. (B) MAIAC-AOD 1 km resolution. (C) MAIAC-AOD overlaid on the average PM2.5 concentration in 2019.
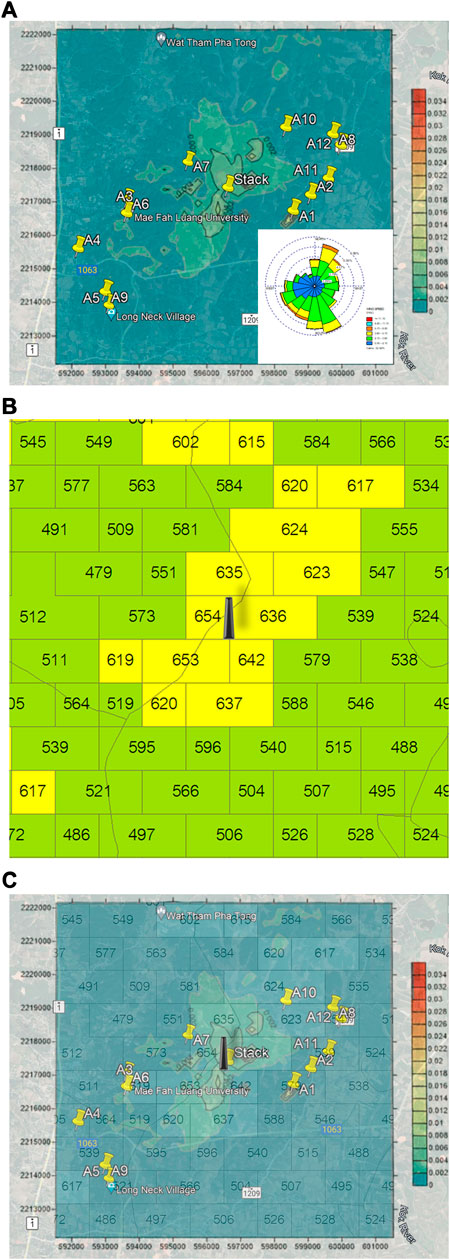
FIGURE 5. Dispersions of simulated PM2.5 concentrations (µg/m3) from the infectious waste incineration and MAIAC-AOD. (A) Annual average PM2.5 concentration by AERMOD. (B) MAIAC-AOD 1 km resolution. (C) MAIAC-AOD overlaid on the average PM2.5 concentration in 2020.
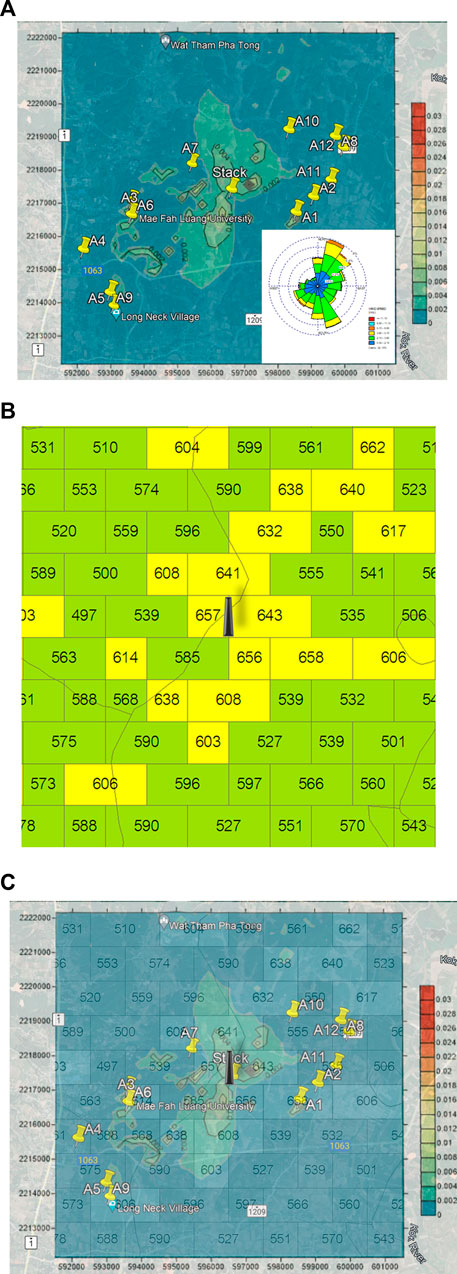
FIGURE 6. Dispersions of simulated PM2.5 concentrations (µg/m3) from the infectious waste incineration and MAIAC-AOD. (A) Annual average PM2.5 concentration by AERMOD. (B) MAIAC-AOD 1 km resolution. (C) MAIAC-AOD overlaid on the average PM2.5 concentration in 2021.
4 Discussion
The prediction of the air pollution dispersion from the infectious waste incinerator was performed using the AERMOD model. Although SO2 and NOx were spread up to 1 km from the stack, the concentration did not exceed the national permissible limits. The predicted PM2.5 by MAIAC-AOD was compared with the PM2.5 simulated by AERMOD. The correlation between them was 0.7630, 0.7607, and 0.6504 for 2019, 2020, and 2021, respectively. According to the results, some areas have high AOD values, which indicates that sources other than infectious waste incinerators may also be causing the presence of PM2.5. In Jiangsu Province, China, occurrence frequencies of MAIAC-AOD were found to be between 0.3 and 0.5, indicating the possibility of an atmosphere that was turbid as a result of human activities that increased emissions (Wang et al., 2021). Our study indicates that the MAIAC values in the 10 km2 area around the infectious waste incinerator ranged from 0.51 to 0.88, which is significantly higher than the values found in previous studies, showing that this area was closer to the emission source. It was found that there was a consistent distribution trend between them, and this trend showed great potential for a thorough human exposure assessment at the community level [30. According to this study, the daily MAIAC-AOD can be employed as a preliminary monitoring tool to determine the risk area of exposure and the level of particulate matter. The MAIAC-AOD was daily and continuously both spatial and temporal, which was contrary to the normal monitoring period for stack emission monitoring of infectious waste that takes place at least twice a year. Therefore, it would be interesting to incorporate the AERMOD model or other air modeling with the daily MAIAC-AOD in the future to validate or cross-check the distribution of air pollution from other stationary emission sources or even the effect of transboundary air pollution.
Data availability statement
The original contributions presented in the study are included in the article/Supplementary Material, further inquiries can be directed to the corresponding author.
Author contributions
SN contributed to the conception and design of the study, organized the database, and performed the statistical analysis. AH wrote the first draft of the manuscript and all sections of the manuscript. All authors contributed to the article and approved the submitted version.
Funding
This work was partially supported by Chiang Mai University. The annual monitoring report of the infectious waste incinerator was provided by Mae Fah Luang University. The Bowen ratio, surface roughness length, and upper air meteorological variables were acquired from https://ruc.noaa.gov/raobs/. The terrain data were collected from https://earthexplorer.usgs.gov. The MOD09 data were collected from the Level-1 and Atmosphere Archive & Distribution System (LAADS), the MAIAC-AOD was gathered from The Level-1 and Atmosphere Archive & Distribution System (LAADS) Distributed Active Archive Center (DAAC).
Acknowledgments
We thank the investigators and their staff for establishing and maintaining the important data used in this investigation.
Conflict of interest
The authors declare that the research was conducted in the absence of any commercial or financial relationships that could be construed as a potential conflict of interest.
Publisher’s note
All claims expressed in this article are solely those of the authors and do not necessarily represent those of their affiliated organizations, or those of the publisher, the editors and the reviewers. Any product that may be evaluated in this article, or claim that may be made by its manufacturer, is not guaranteed or endorsed by the publisher.
Supplementary material
The Supplementary Material for this article can be found online at: https://www.frontiersin.org/articles/10.3389/fenvs.2023.1240705/full#supplementary-material
References
Afzali, A., Rashid, M., Noorhafizah, K., and Ammar, M. R. (2016). Evaluating human exposure to emission from incineration plant using AERMOD dispersion modelling. Iran. J. Public Health 43, 25–33.
Arvani, B., Pierce, R. B., Lyapustin, A. I., Wang, Y., Ghermandi, G., and Teggi, S. (2016). Seasonal monitoring and estimation of regional aerosol distribution over Po valley, northern Italy, using a high-resolution MAIAC product. Atmos. Environ. 141, 106–121. doi:10.1016/j.atmosenv.2016.06.037
Chen, N., Yang, M., Du, W., and Huang, M. (2021). PM2.5 estimation and spatial-temporal pattern analysis based on the modified support vector regression model and the 1 km resolution MAIAC AOD in Hubei, China. ISPRS Int. J. Geo-Inf 10, 31. doi:10.3390/ijgi10010031
Couper, T., Ferraro, V., and Foster, J. (2012). Air Quality study funeral home/crematorium Orleans. Ottawa: Canada Inc.
Eibedingil, I. G., Gill, T. E., Van Pelt, R. S., Tatarko, J., and Li, J. (2022). Applying wind erosion and air dispersion models to characterize dust hazard to highway safety at lordsburg playa, New Mexico, USA, Atmosphere, 13, 1646. doi:10.3390/atmos13101646
Han, W., Tong, L., Chen, Y., Li, R., Yan, B., and Liu, X. (2018). Estimation of high-resolution daily ground-level PM2.5 concentration in Beijing 2013–2017 using 1 km MAIAC AOT data. Appl. Sci. 8, 2624. doi:10.3390/app8122624
He, Q., Wang, M., and Yim, S. H. L. (2021). The spatiotemporal relationship between PM2.5 and aerosol optical depth in China: influencing factors and implications for satellite PM2.5 estimations using MAIAC aerosol optical depth. Atmos. Chem. Phys. 21, 18375–18391. doi:10.5194/acp-21-18375-2021
Hu, X., Waller, L. A., Lyapustin, A., Wang, Y., Al-Hamdan, M. Z., Crosson, W. L., et al. (2014). Estimating ground-level PM2.5 concentrations in the Southeastern United States using MAIAC AOD retrievals and a two-stage model. Remote Sens. Environ. 140, 220–232. doi:10.1016/j.rse.2013.08.032
Jittra, N., Pinthong, N., and Thepanondh, S. (2015). Performance evaluation of AERMOD and CALPUFF air dispersion models in industrial complex area. Air, Soil Water Res. 8, ASWR.S32781–95. doi:10.4137/aswr.s32781
Karuchit, S. (2018). Application of AERMOD model with clean technology principles for industrial air pollution reduction. Third International Conference on Engineering Science and Innovative Technology (ESIT).19-22 April 2018, China, IEEE.
Khamyingkert, L., and Thepanondh, S. (2015). Source contribution analysis of ambient NO2 concentration in Maptaphut industrial complex area, Thailand, International Conference on Environmental Research and Technology, 4 September 2021, USA. ICERT.
Koomsang, T., Chuchue, S., and Kanabkaew, T. (2015). Applications of atmospheric dispersion model for air quality assessment of NOx and SO2 from waste incinerator. Environ. Nat. Resour. J. 13, 21–27.
Li, R., Ma, T., Xu, Q., and Song, X. (2018). Using MAIAC AOD to verify the PM2.5 spatial patterns of a land use regression model. Environ. Pollut. 243, 501–509. doi:10.1016/j.envpol.2018.09.026
Lyapustin, A., and Wang, Y. (2008). MAIAC:Multi-Angle implementation of atmospheric correctio for MODIS. Algorithm Theor. Basis Document. (Ver. 1.0). Goddard Earth Sci. Technol. Cent. UMBE, NASA GSFC.
Mueller, W., Vardoulakis, S., Steinle, S., Loh, M., Johnston, H. J., Precha, N., et al. (2021). A health impact assessment of long-term exposure to particulate air pollution in Thailand. Environ. Res. Lett. 16, 055018. doi:10.1088/1748-9326/abe3ba
Nakapan, S., and Hongthong, A. (2022). Applying surface reflectance to investigate the spatial and temporal distribution of PM2.5 in Northern Thailand. ScienceAsia 48, 75–81. doi:10.2306/scienceasia1513-1874.2022.001
Pollution Control Department (Pcd), (2020). Thailand statement of pollution report 2020. Bangkok, Thailand: Wongsawang Publishing and Printing.
Pope, C. A., Burnett, R. T., Thun, M. J., Calle, E. E., Krewski, D., Ito, K., et al. (2002). Lung cancer, cardiopulmonary mortality, and long-term exposure to fine particulate air pollution. JAMA 287, 1132–1141. doi:10.1001/jama.287.9.1132
Seangkiatiyuth1, K., Surapipith, V., Tantrakarnapa, K., and Lothongkum, A. W. (2011). Application of the AERMOD modeling system for environmental impact assessment of NO2 emissions from a cement complex. J. Environ. Sci. 23 (6), 931–940. doi:10.1016/s1001-0742(10)60499-8
Srirattana, S., and Piaowan, K. (2020). SO2 dispersion modeling emitted from Hongsa coal-fired. Int. J. Environ. Sci. Dev. January. Geogr. Tech. 15 (1), 102–111. doi:10.21163/gt_2020.151.09
Srivieng, P., Suadee, W., and Watchalayan, P. (2021). Health risk assessment of air pollutants emitted from municipal solid-waste incinerators in Thailand. EnvironmentAsia 14 (2), 51–63. doi:10.14456/ea.2021.16
U.S.EPA (2021). User's guide for the AMS/EPA regulatory model (AERMOD). USA: U.S. Environmental Protection Agency. Office of Air Quality Planning and Standards.
Voogt, M. H., Keuken, M. P., Weijers, E. P., and Kraai, A. (2009). Spatial variability of urban background PM10 and PM2.5 concentrations. Netherlands, Netherlands Environmental Assessment Agency: 1875–2314.
Walker, B. L., and Cooper, C. D. (1992). Air pollution emission factors for medical waste incinerators. J. Air Waste Manag. Assoc. 42 (6), 784–791. doi:10.1080/10473289.1992.10467030
Wang, P., Tang, Q., Zhu, Y., Zheng, K., Liang, T., Yu, Q., et al. (2022). Validation and analysis of MAIAC AOD aerosol products in East Asia from 2011 to 2020. Remote Sens. 14, 5735. doi:10.3390/rs14225735
Wang, Y., Ali, M. A., Bilal, M., Qiu, Z., Ke, S., Almazroui, M., et al. (2021). Identification of aerosol pollution hotspots in Jiangsu province of China. Remote Sens. 13, 2842. doi:10.3390/rs13142842
Wang, Y., Song, X., Shang, Y., Zhou, Y., Huang, X., et al. (2023). The impact of particulate pollution control on aerosol hygroscopicity and CCN activity in North China. Environ. Res. Lett. 18, 074028. doi:10.1088/1748-9326/acde91
Xia, X., Zhang, A., Liang, S., Qi, Q., Jiang, L., and Ye, Y. (2017). The association between air pollution and population health risk for respiratory infection: a case study of shenzhen, China. Int. J. Environ. Res. Public Health 14 (9), 950. doi:10.3390/ijerph14090950
Xiao, Q., Wang, Y., Chang, H. H., Meng, X., Geng, G., Lyapustin, A., et al. (2017). Full-coverage high-resolution daily PM2.5 estimation using MAIAC AOD in the Yangtze River Delta of China. Remote Sens. Environ. 199, 437–446. doi:10.1016/j.rse.2017.07.023
Keywords: AERMOD, MAIAC-AOD, PM2.5, waste incinerator, regression model, SO2, NOx
Citation: Hongthong A and Nakapan S (2023) Assessing the impact of a waste incinerator on the environment using the MAIAC-AOD and AERMOD models. Front. Environ. Sci. 11:1240705. doi: 10.3389/fenvs.2023.1240705
Received: 15 June 2023; Accepted: 18 October 2023;
Published: 07 November 2023.
Edited by:
Sirapong Sooktawee, Ministry of Natural Resources and Environment, ThailandReviewed by:
Simone Lolli, National Research Council (CNR), ItalyTu Binh Minh, VNU University of Science, Vietnam
Copyright © 2023 Hongthong and Nakapan. This is an open-access article distributed under the terms of the Creative Commons Attribution License (CC BY). The use, distribution or reproduction in other forums is permitted, provided the original author(s) and the copyright owner(s) are credited and that the original publication in this journal is cited, in accordance with accepted academic practice. No use, distribution or reproduction is permitted which does not comply with these terms.
*Correspondence: Supachai Nakapan, c25ha2FwYW5AZ21haWwuY29t
 Anuttara Hongthong
 Supachai Nakapan