
94% of researchers rate our articles as excellent or good
Learn more about the work of our research integrity team to safeguard the quality of each article we publish.
Find out more
ORIGINAL RESEARCH article
Front. Environ. Sci. , 29 August 2023
Sec. Biogeochemical Dynamics
Volume 11 - 2023 | https://doi.org/10.3389/fenvs.2023.1239785
 Nebiyou Legesse1
 Wu Sheng1Wang Yao1Gan Manqin1Liu Peishi1Huang Yu1Xu Hongjun2Hu HongXiang1*Ma Youhua1*
Introduction: Fertilizer application above plant nitrogen (N) requirements, leading to N use inefficiency, has become the primary source of N surplus, posing nonpoint pollution threats. Chao Lake has received N loadings, primarily from the agroecosystem that surrounds it. Based on 10 years of field monitoring and experiment, this study used optimum fertilizer rates (30% N reduction) to evaluate nitrogen use efficiency (NUE) and N export in the Chao Lake watershed of paddy rice-wheat rotational farming.
Methods: Five treatments were tested, namely, the Blank Treatment (CK), Conventional Fertilization Treatment (CFT), High Fertilization Treatment (HFT), Reduced Fertilization Treatment (CFT), Reduced Fertilization Treatment plus Straw addition (RFTS). The parameters employed to measure NUE were 1) by calculating NUE indicators; Agronomic efficiency (kg kg-1), recovery efficiency (%), and partial factor productivity (kg kg-1) 2) using the European Union NUE framework as a comparison tool. N export was measured using N export parameters, namely, nitrogen loading (kg ha-1yr-1), nitrogen runoff loss ratio (%), and net nitrogen runoff loss ratio (%).
Results and discussion: Results revealed that optimum N fertilizer input levels maintained high crop and biomass yields. The empirical model of y = y0 + a * exp (−0.5 * (x-x0)/b2) explains the relationships between input N fertilizer and corresponding yield returns. Low yield responses to increased N input beyond certain limits were observed, which may lead to N accumulations. N export was much lower from the reduced fertilization treatments than other treatments. N export increased in 10 years for both paddy rice and wheat seasons. Runoff volume influenced N export more than any other environmental factor studied.
Conclusion: Overall, optimal fertilizer levels produced high NUE, maintained high economic yield, and produced lesser N exports; NUE was in the order of reduced > high > conventional fertilization treatments, while it decreased in 10 years (2008–2018) across all treatments. Such strategies that further reduce fertilizer levels by accounting for excess supplies are vital for consolidating effective N control measures.
The rise in N fertilizer input has been ascribed to a nine-fold increase in global crop yield growth over the last six decades (Ju et al., 2009; Lassaletta et al., 2014; Meng et al., 2016), but this same increase has also resulted in a severe decline in nitrogen use efficiency (NUE) from 68% to 47%. In China, fertilizer input in agriculture grew by 271% between 1997 and 2005 (Meng et al., 2016), accounting for about 30% of global fertilizer consumption today. However, NUE fell below the global average (28% compared to 47%) in the process (Lassaletta et al., 2014). As a result, inorganic N storage has significantly increased (Nie et al., 2017). The main culprit is assumed to be consumption involving applications that exceed recommended limits (Fan et al., 2011; Meng et al., 2016; Yang et al., 2017; Hansen et al., 2018). Applications of 30%–60% above recommended rates were observed in China (Ju et al., 2009). Hence, the excessive application, in turn reducing NUE, leads to increased loss of reactive N (Carpenter et al., 1998; Mellander et al., 2012; Chen et al., 2013), solubility and mobility of which (Swaney and Howarth, 2019) pose substantial environmental consequences. The surplus use of N fertilizer reveals the poor understanding of its transformation mechanisms, mobility, and cascading impacts across farming communities. Furthermore, it is unknown mainly that with increasing fertilizer input, yield return can begin to drop beyond a certain fertilizer amount (Meisinger et al., 2008a; Jin et al., 2012; Lassaletta et al., 2014), which could be attributed to ion toxicities such as aluminum (Al) (Schroder et al., 2011). Hence, it is critical to comprehend how fertilizer modifies biogeochemical cycles. The interplay of excess N with the underlining N cycle mechanisms has emerged as a primary environmental concern in China (Fan et al., 2011); acidification, toxification (Barak et al., 1997), diffuse pollution, and GHG emissions (Hauck, 1981) may result from this interaction.
Optimizing crop N input by reducing the input levels but maintaining the yields (Luce, 2013) provides a comprehensive solution in agroecosystems. According to Ju et al. (2009), without losing yield, N loss from farmlands can be halved through optimal adjustment by applying only 50% of what is usually applied locally, which is frequently studied to be very high. N optimization has also increased crop yield through integrated soil-plant system management (Fan et al., 2011; Meng et al., 2016). However, two issues arise 1) optimum rates vary substantially within and between spatial and temporal gradients 2) except for controlled environments, yield uncertainties dominate in conventional agroecosystems. Hence, long-term, continuous, reliable estimates of soil N supplies, budget trends, and soil/plant/microorganism systems can address some issues. Unfortunately, most studies rely on less comprehensive and short-term field monitoring results.
Chao Lake, one of China’s five largest freshwater lakes (Chen et al., 2013; Ni et al., 2018), contributes to the environment by providing water, transportation, and other amenities. It also contributes to biodiversity conservation and climate regulation, yet, the lake is frequently reported to be highly eutrophic (Peng et al., 2019). Rice–wheat rotational cropping is the dominant cropping system (Wang et al., 2015) and is regarded as the primary contributor to the N and P exports (Zhou and Gao, 2011; Wang et al., 2015). Considering the realities above, we sought to investigate how optimized N fertilization-reduced rates might improve NUE and reduce N loss while maintaining the crop grain and biomass yields over time. We employed an experimental method to study different fertilization treatments on the traditional wheat–rice rotational cropping system. On the one hand, we evaluated the relationships between yield, NUE, and runoff loading, and on the other, we compared conventional, high, and reduced fertilizer levels.
The experiment was carried out in the Chao watershed, 17 m above sea level, at 117°47ˊ35" N and 31°38ˊ45" E, close to Chao Lake (2 km away). The experiment was set up in 2007. It has a moderate, mild characteristic climate and abundant light. Its annual average precipitation is 900 ± 244 mm, and its average temperature is 16°C (Lin et al., 2021). May through October is the rainy season.
Chao Lake is located between Yangtze and Huaihe Rivers in southeast China, at the periphery of Hefei City, the capital of Anhui province. Thirty-three rivers and tributaries discharge into the lake body.
Five treatments were tested in the paddy rice-wheat rotational tillage system. The treatments were laid out in a completely randomized design with three replications. The treatments are Blank Treatment (CK), Conventional Fertilization Treatment (CFT), High Fertilization Treatment (HFT), Reduced Fertilization Treatment (RFT), and Reduced Fertilization Treatment plus Straw addition (RFTS); both RFT and RFTS are reduced (optimal) treatments. Detailed information on treatment application rates is summarized in Table 1 below. Urea (46% N), calcium superphosphate (12% P), and potassium chloride (60% K) were used. Wheat Ningmai 13 variety and Wandao 153 hybrid rice were tested crops. Wheat was sown in November every year and harvested at the end of May; the method of sowing is broadcasting. The rice transplanting time was June, and harvested in October every year. Straw nitrogen contents were 0.54% and 0.81% in wheat and rice straw, respectively. The area of the experimental plot was 30 m2 (4 m * 7.5 m); concrete ridges surrounded it. A concrete runoff harvester with a storage volume of 2.4 m3 (2 mL * 1 mW * 1.2 mH) was built to quantify runoff volume following rainfall events (Figure 1 below).
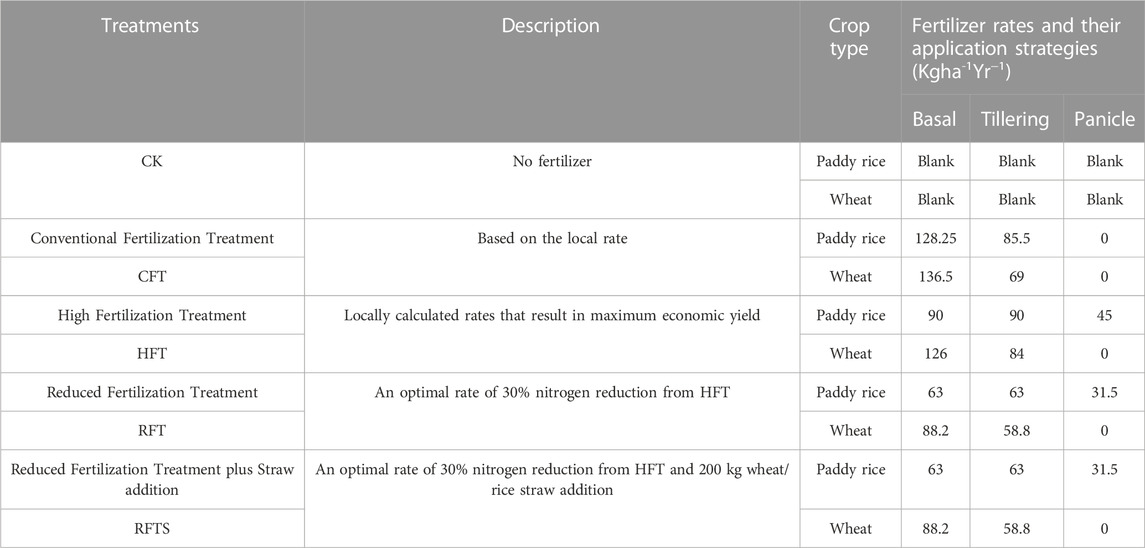
TABLE 1. Treatment fertilizer application rates in a paddy rice-wheat rotational tillage system of Chao Lake watershed (2008–2018).
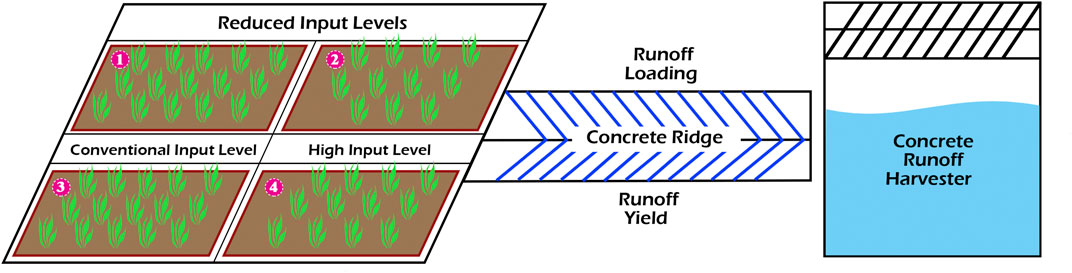
FIGURE 1. Experimental design.
The treatment plots were irrigated twice. The water level was allowed to fluctuate between 5 and 10 cm (300—600 m3 ha-1) throughout the rice-growing season.
The temporal arrangement was such that, extending for 6 months, January to June, represents a wheat growing season, while the rice growing season lasted the rest of the year, from June to December.
(1) Runoff volume was estimated for all rainfall events that generated runoff by recording the surface height of storage. In addition, runoff volume generated from plots during irrigation was measured for rice season. The plots were irrigated only during the rice season (June to August).
Runoff volume was taken when the pool reached 80% of its capacity. Pools were continuously stirred with clean bamboo rods before taking samples from different sides and depths. After carefully stirring runoff, samples were taken with 500 mL bottles and transported for immediate lab analysis. The samples were subjected to total nitrogen, NO3, and NH4 determination. When we could not analyze the samples on the same sampling day, we stored and preserved them in a refrigerator at −4 0c. After sampling, the runoff water was discharged and cleaned to harvest runoff from subsequent rainfall events.
(2) Before threshing in the mature stages of the wheat and rice growing seasons, samples of biomass and grain yields were collected from 15 plots at five points of an “X" shaped scheme for Lab analysis. Plants were harvested simultaneously, and grain and biomass yields were manually recorded in the field. The plant samples were separated in the lab as grain and biomass yields, oven-dried at 105 oc, weighted, and subjected to total nitrogen (TN) determinations. The straw returning for the RFTS treatment was manually spread where wheat straw was crushed and pressed to return to the fields in the rice season, and rice straw was returned to the fields in the wheat season.
(3) Following the wheat and rice harvest, five composite soil samples were collected with a soil auger from the upper 0–20 cm layer using the “X" shaped scheme approach employed for plant sampling. In the laboratory, samples were air-dried, ground, and sieved using 0.25 and 2 mesh sizes in the laboratory. Soil samples were subjected to pH, moisture content, organic matter, TN, NO3, and NH4 determinations.
A glass electrode was used to determine pH on a 1:2 (soil to water solution) ratio. Without filtration, the alkaline persulfate oxidation digestion technique determined TN. NH4+ and NO3− were determined using a continuous flow injection method and an Analytical AA3 HR Nutrient Autoanalyzer (SEAL Analysis Instrument Co., Germany). Plant samples were first digested with H2O2-H2SO4 before the filtrate was subjected to total nitrogen determination by AA3 continuous flow injection. Soil organic matter was determined by the potassium dichromate oxidation-external heating method.
Information on fertilizer application, mineralization, irrigation nitrogen, seed, and straw addition was considered to analyze nitrogen input on the field. Field information on crop nutrient uptake, runoff, volatilization, and denitrification was used for nitrogen output. Soil residual nitrogen was continuously determined using Formula 1 to determine nitrogen balance. Where, RN is the soil residual nitrogen:
Soil weight was estimated based on Eq. 2.
Where: W is soil weight, m is the mass, BD is the bulk density, d is the soil depth (20 cm) and A is area of the plot (30 m2).
To estimate nitrogen mineralization (ha-1), we used Eq. 3 (Buckman and Brady, 1922)
Where Av represents available amount, W is weight SOM is the soil organic matter per ha, and Ex is estimated N amount to be mineralized. We assumed 5% N content in organic matter (Buckman and Brady, 1922) and 1% of N estimated to be mineralized from the organic matter (Meisinger et al., 2008b; Sullivan et al., 2020). Organic matter N mineralization is low under fields where straw is removed; roots are the main sources (Geisseler et al., 2019). Volatilization was taken from a published paper conducted on the same site, also funded by the same project (national monitoring project) (Xiaohong et al., 2012). For nitrogen usage efficiency, we took three indicators, namely: Agronomic Efficiency (AE, kg kg-1), Recovery Efficiency (RE, %), and Partial Factor Productivity (PFP, kg kg-1) (Veneklaas et al., 2012).
Where: Yn is the yield of a given fertilized treatment; Yck is the yield of the blank treatment; Yun is the plant nitrogen uptake of a given fertilized treatment; Yuck is the plant nitrogen uptake of the blank treatment; FN is the nitrogen input fertilizer amount.
Nitrogen loss was calculated using three different indicators:
Where: NLi stands for nitrogen loading at a given time, while NLi stands for the sample taken after NLi. NLn stands for nitrogen loading of a given fertilized treatment, NLck stands for nitrogen loading of the blank treatment and RfV is the runoff volume. In addition, redundancy analysis (RDA) was used to assess the relationship between environmental factors and the loading of nitrogen forms.
The European Union experts’ panel developed a framework to evaluate nitrogen use efficiency (Brentrup et al., 2015); we used the framework to compare our output. The framework (Figure 5) depicts three zones: Low NUE, Desired NUE and high NUE. The lower and higher NUE zones are undesired due to their cascading consequences. The three zones are as follows 1) the area between the two broken lines (between 50% and 90% diagonal lines) represent a desired NUE zone 2) The area above the 90% broken line represents a high NUE and hence a risk of N mining 3) The area under 50% broken line represents low NUE zone, therefore the risk of inefficient N use.
Statistical analyses were performed using R and SPSS software, with critical α values of 0.05 and below. Shapiro-Wilk was used to check the normal distribution and Kruskal–Wallis rank sum was used for significant tests, and Tukey HSD and Dunn were used for post hoc tests to compare means. The sphericity of RDA was tested using Kaiser -Meyer - Olkin (KMO) and Bartlett’s test.
The physicochemical properties of the top 20 cm layer in 2007 were: pH of 6.99; organic matter of 34.07 g kg-1; total nitrogen of 1.58 g kg-1; and alkali hydrolyzed nitrogen of 168.54 mg kg-1 (Ma et al., 2022). As compared to 2007, the soil moisture content (MC) increased by 16%–50% (averaged at 31%) over 10 years (2008–2018). The rice growing season MC was higher than the wheat growing season (20%–46%, average 29%). pH varied (median 7.3) between 4.87 and 10.32 and 6.55 and 8.23 for rice and wheat growing seasons, respectively. Similarly, soil organic matter (SOM) was 25.3 ± 6 g kg-1 and 26.4 ± 5.5 g kg-1 for rice and wheat growing seasons, respectively.
Mean monthly rainfall peaks between June and August (Figure 2); when plots were submerged. The rainfall regime influenced runoff volume significantly (r = 0.72), affecting N loss (also discussed in the N loading section below). The rainfall depth and subsequent runoff volume affect nutrient loss in agroecosystems due to fertilizer applications (Hahn et al., 2012; Wang et al., 2013). A total of 97 runoff events were recorded in 10 years. The combined runoff yield from the six treatments was 562.47 ± 5.71 mm plot-1 yr-1. RFTS treatment provided a slightly lower runoff yield (45.5 ± 0.5 mm plot-1 yr-1) than the remaining average (46.8 ± 0.5 mm plot-1 yr-1). A significantly higher runoff yield was observed during the rice growing season owing to higher rainfall, irrigation and water logging through out the rice growing season.
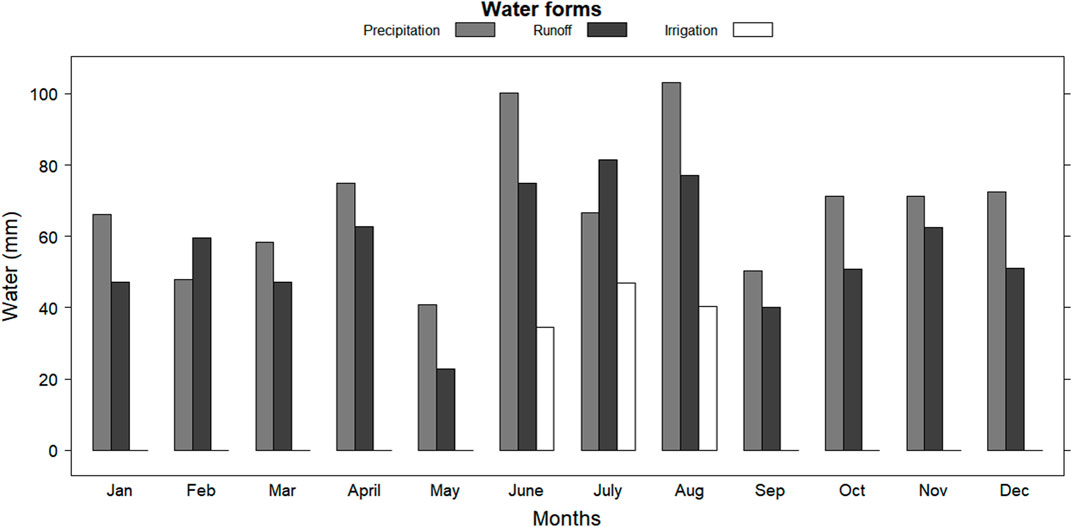
FIGURE 2. Mean monthly precipitation, runoff, and irrigation measurements in the Chao Lake watershed (2008–2018).
Runoff yield increases as a result of one or more of the following soil attributes, a) low permeability and early saturation (Wang et al., 2015), b) high clay content (Follett, 2008), c) high water tables due to the shallow aquifer (Follett, 2008). Although there was no statistical difference in runoff yield across treatments, straw addition reduced runoff by up to 3% in this study; in contrast, straw addition reduced 21% runoff yield in another study in China (Wang et al., 2015). Among the attributes mentioned above (a-c), decreased permeability leading to early saturation and, in turn, flooding, may have triggered the runoff yield in the study area, the reasons being 1) having a less permeable plow pan (Ji et al., 2011; Wang et al., 2015) and; 2) saturation of its water table (Wang et al., 2015).
The nitrogen export indicators, namely, nitrogen loading, nitrogen runoff loss ratio, and net nitrogen runoff loss ratio, were calculated using the arithmetic functions provided above (Formulas 7–9). Results indicated no significant difference for combinations of those indicators and the fertilization treatments. Although not statistically significant, CFT and HFT produced relatively higher N exports. The RFT treatment had the least N exporting amount. The summary of N export results is presented in Tables 2, 3.
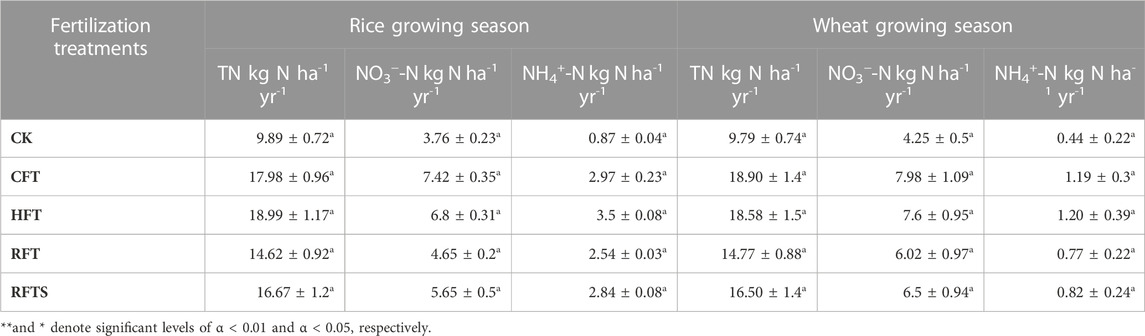
TABLE 2. Mean nitrogen runoff loss in wheat and rice seasons for 10 years in each treatment (2008—2018).
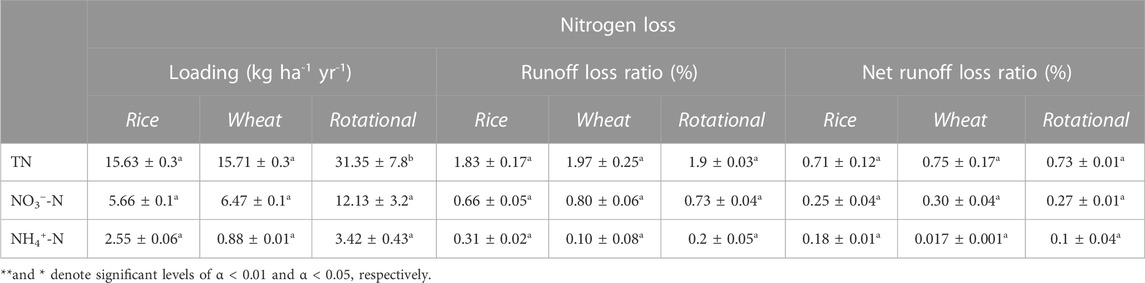
TABLE 3. Mean nitrogen runoff loss in wheat and rice seasons for 10 years (2008—2018).
Average runoff loadings were 31.35 ± 7.8 kg ha-1 yr-1, 12.13 ± 3.2 kg ha-1 yr-1 and 3.42 ± 0.43 kg ha-1 yr-1 for TN, NO3−-N and NH4+-N, respectively. The TN load estimated in this study was at least 18.9 N ha-1 yr-1, higher than the previously reported amount by the Anhui province environmental protection department (2011) (unpublished).
The ordination plots shown in Figure 3 were used to evaluate relationships among the fertilization treatments and N loadings. The distance and proximity patterns in the plots revealed that N loading decreased in RFT and RFTS treatments while increasing in HFT and CFT; this furthers the findings above: N exports from RFT and RFTS declined due to the reduction of fertilization amount. Environmental factors such as soil residual nitrogen content (RN, kg ha-1 yr-1), soil organic matter (SOM, kg ha-1 yr-1), and runoff volume (RfV, L ha-1) were considered, among which runoff volume significantly influenced nitrogen export from the treatment plots. Soil residual nitrogen and input fertilizers were correlated to the reduced fertilization treatments (RFT and RFTS), indicating that the two fertilization treatments had higher nitrogen retention and less nitrogen export.
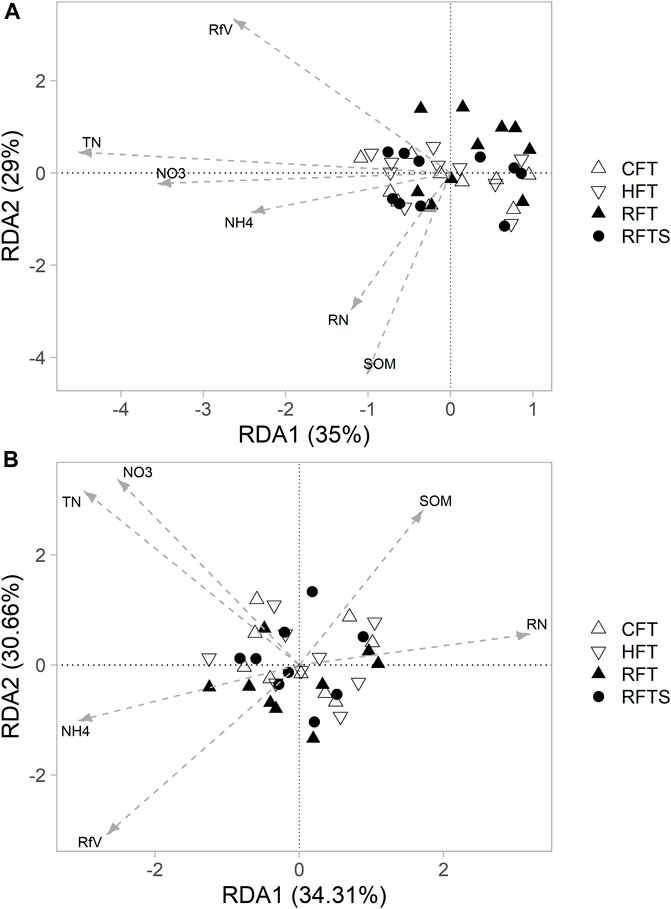
FIGURE 3. RDA plots depicting influencing factors of fertilizer input, runoff volume, soil moisture content, and residual soil nitrogen content in runoff loading of TN, NO3, and NH4; (A) paddy rice growing season, (B) wheat growing season. Where, RN is soil residual nitrogen content in kg ha-1yr-1, SOM is soil organic matter in kg ha-1yr-1, and RfV is runoff volume L ha-1.
NO3−-N loading was significantly higher in contrast to NH4+-N, which could be attributed to a microbial buildup of nitrate from ammonia (nitrification) (Zhang and Wang, 2005) and ammonium ion structure to be sorbed to negatively charged colloidal particles (Zhou et al., 2016). According to Jia et al. (2018), mobility characteristics for NH4+ and NO3− indicate that while NH4+ more likely tends to remain in the top layer, NO3− goes further distances. Temporally, loadings of all N forms (TN, NO3−-N, and NH4+-N) increased significantly over 10 years (2008–2018), indicating enhanced N storage from long-term excessive fertilizer applications. In agreement with this, the bi-variate Pearson correlation in Table 4 also shows a robust correlation (r) between input fertilizer and residual soil nitrogen and runoff TN and NO3−_N concentrations. These are also consistent with the results in the argument discussed below (NUE decline in 10 years, Figures 6A, B).
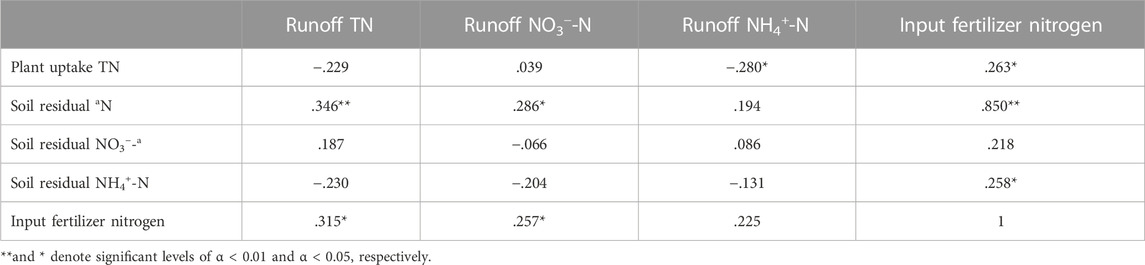
TABLE 4. Pearson correlation results among different nitrogen forms (2008—2018).
Despite having more rainfall depth during the rice growing season, the nitrogen loss in the wheat growing season was higher, except for NH4+-N. Other studies reported similar results (Ju et al., 2009; Wang et al., 2019), which may be attributed to the concrete ridges buffering effect contributing to reducing N loss and water logging and its tendency to have high hydraulic retention enhancing reductions of nitrogen export (Ju et al., 2009). Furthermore, denitrification (Patrick and Mahapatra, 1968) and leaching (Gao et al., 2002) dominate nitrogen loss mechanisms in anaerobic environments. Moreover, according to Ji et al. (2011), plow pan break in alternating rice-wheat crop rotations, combined with high moisture, leads to nitrate leaching than its lateral transport during the rice growing season.
Trajectories of input nitrogen versus their corresponding yield returns are shown in Figure 4. The plots indicated that the 30% N reduction treatments yielded high-yield returns. In general, an exponential relationship was observed for input nitrogen versus yield trajectories, which was also suggested by similar agronomic publications. Hence, the function y = y0 + a * exp (−0.5 * (x-x0)/b2) was best fit. As shown in the plots, all (except wheat grain yield) the yield trajectories, namely, wheat biomass, rice grain, and rice biomass, showed a fixed optimum amount of “X" input nitrogen that has a corresponding fixed maximum yield designated as Ymax, beyond which, further input nitrogen yields less crop/biomass yield. For wheat grain yield, Ymax remained stable with variable “X”.
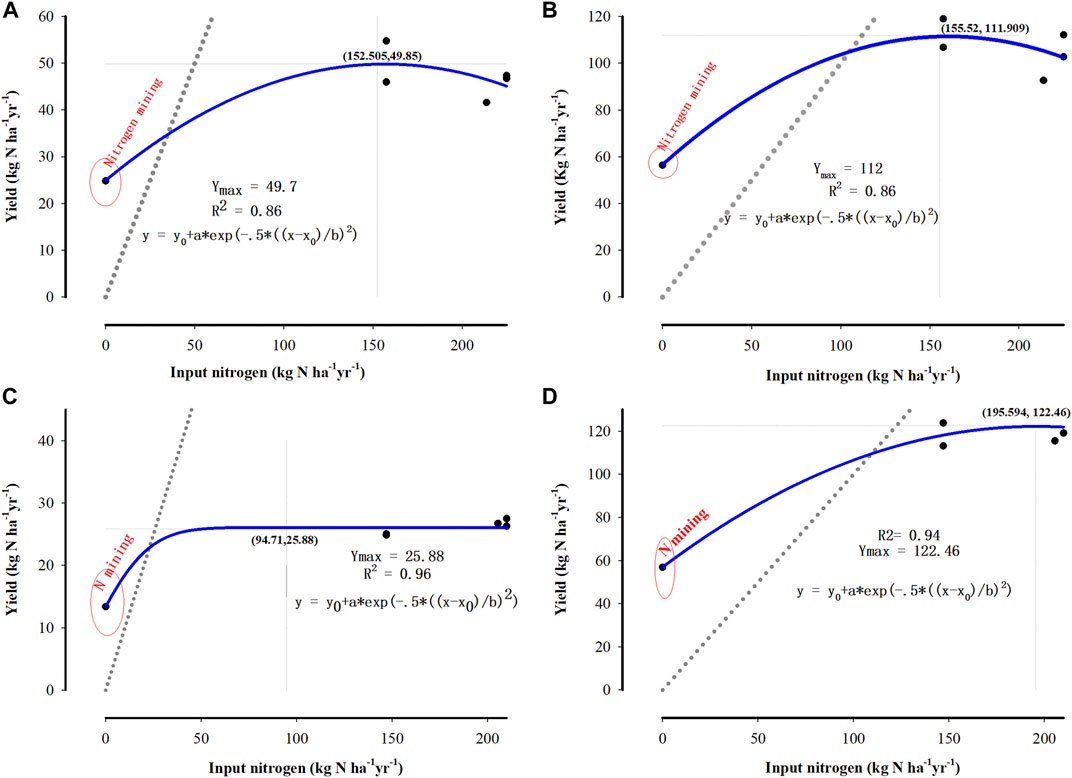
FIGURE 4. Trajectories comparing nitrogen input and crop yield in Chao Lake watershed (2008—2018) (A) For paddy rice grain, (B) For paddy rice biomass, (C) For wheat grain, (D) For wheat biomass.
The highest yield was achieved at an input fertilizer amount near the RFT treatment level in the paddy rice growing season. As shown in the plot (Figures 4A, B), Ymax was reached at input levels of 152.5 kg ha-1 yr-1 and 155.5 kg ha-1 yr-1, for grain and biomass yields, respectively, approximate amounts to the RFT treatment level (157 kg ha-1 yr-1). In the Taihu region, where they used a polynomial model at Ymax ∼150 kg ha-1, the optimum rice yield agrees with our finding (their input amount was 200 kg N ha-1) (Ju et al., 2009). For wheat grain yield, Ymax reached a fertilizer input level of 94.71 kg ha-1 yr-1, lower than the RFT treatment (147 kg ha-1 yr-1). For wheat biomass, the highest yield was achieved at 195.9 kg ha-1 yr-1 input nitrogen, which was relatively high compared to the reduced fertilization input amount, but lower compared to another study conducted in Huang-huai plain (Duan et al., 2019), where biomass yield began to decline at 240 kg ha-1.
RFTS treatment fell within a similar zone to RFT but the remaining two fertilization treatments (CFT, HFT) were placed toward the diminishing return side of the trajectories opposite to one another (Figure 4). Blank treatment fell within the mining range (similar result was also observed in Figure 5).
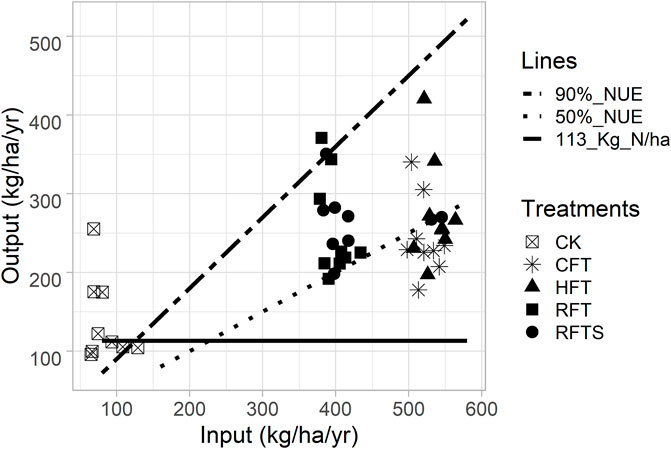
FIGURE 5. Nitrogen use efficiency framework (2008–2018); demonstrating output-to-input ratio, based on the European Union experts’ panel NUE framework. Five treatments marked by points of different shapes, with NUE provisional reference values of 90% NUE, 50% NUE, and 113 kg N ha-1yr-1 nitrogen output, are shown in the graph.
Fertilizer applications should be carefully timed and split into plant growth stages to match the physiological requirements and facilitate gradual plant nutrient uptake (Meisinger et al., 2008a; Fan et al., 2011; Srivastava et al., 2018). As explained above, we split the fertilized treatments (except CFT) into basal, tillering, and panicle stages, which may explain the decreased crop yield in CFT.
In general, rice grain yields peaked in 2014 and 2015, while wheat yields peaked in 2010—a minor yield decline over time could be in response to the trend of decreasing pH attributed to long-term nitrogen buildup. Acidity can reduce yield by increasing Al ions availability while lowering essential cations availability (Guo et al., 2010). Fertilized treatments produced 60% and 46.87% (an average grain yield) more than the control treatment in rice and wheat growing seasons (Table 5); the log-transformed distribution also showed significant differences between control and fertilized treatments. Despite crop yield decrease in CFT and HFT, there was no statistical difference among fertilized treatments.
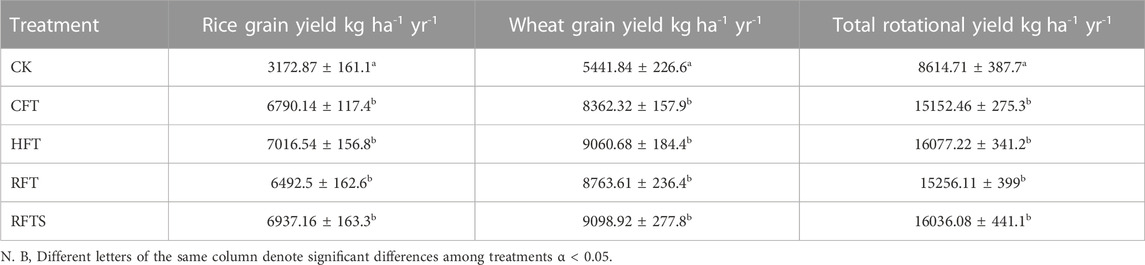
TABLE 5. Mean rice grain and wheat grain yields for the fertilized treatments (2008—2018).
AE and PFP decreased significantly throughout 10 years (2008—2018) (Figures 6A, B). AE and PFP for the rice growing season were 16 kg kg-1 and 42.9 kg kg-1, respectively, whereas AE and PFP for the wheat growing season were 19.5 kg kg-1 and 35 kg kg-1, respectively. RFTS and RFT demonstrated higher efficiency than CFT and HFT (Figures 7A, B); this agrees with the National Bureau of Statistics of China (2010, Unpublished). The report also emphasized the significant reduction of AE and PFP over 30 years. Despite having significantly lower PFP than both RFT and RFTS, HFT exhibited a lower but not significant value in AE during the rice growing season. Wheat growing season trends were similar, with HFT and CFT showing lower AE and PFP than RFT and RFTS; however, except for CFT having significantly lower PFP than RFT and RFTS, there was no statistical difference.
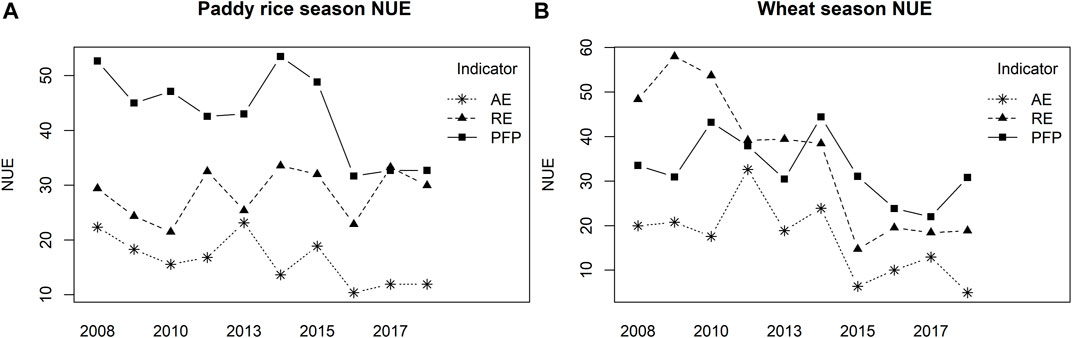
FIGURE 6. Trends of the NUE indicators throughout the study period (2008—2018) (A) In the paddy rice growing season, (B) In the wheat growing season. Where, NUE is the nitrogen use efficiency, AE is the Agronomic efficiency (kg kg-1), RE is recovery efficiency (%), and PFP is the partial factor productivity (kg kg-1).
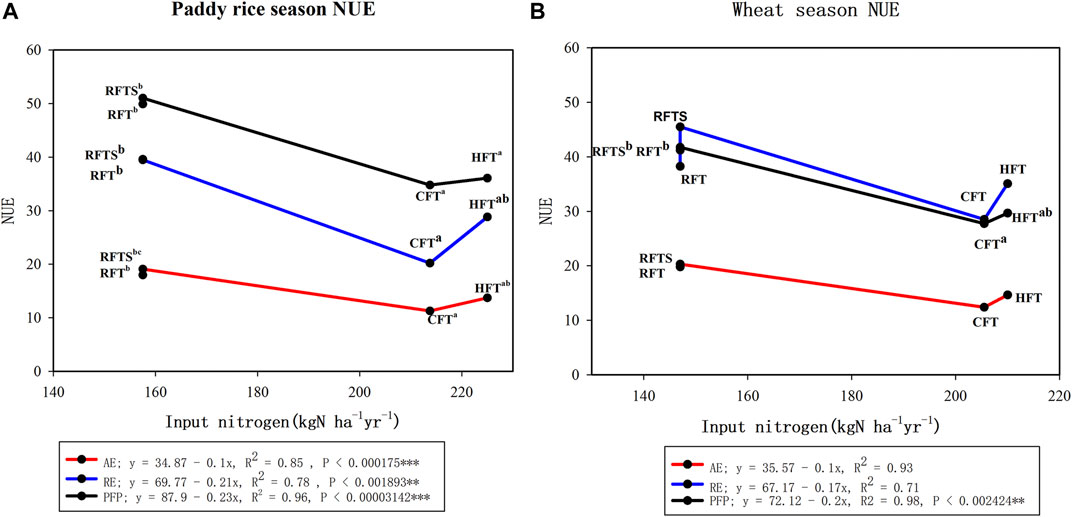
FIGURE 7. Comparisons of fertilization treatments using the NUE indicators (2008—2018), (A) in paddy rice growing season and (B) in wheat growing season.
For 10 years, RE remained steady, with only a few cases displaying significant variations. RE attained its lowest (14.37%) and highest (48%) edges during the rice growing season in 2013 and 2015, respectively; CFT (30.2% overall efficiency) was significantly lower than RFT and RFTS. For the wheat growing season, the lowest RE was in 2015 (14.7%), with an overall average of 36.8%.
The result of this study corresponds with previous studies (Meisinger et al., 2008b; Srivastava et al., 2018) in that beyond the optimum level, NUE decreases with the increase in fertilization rate. Except for controlled experiments, RE has been reported to decline steadily throughout the years in China. For example, Veneklaas et al. (2012) reported 28.3% and 28.2% RE reductions for rice and wheat, respectively. In a controlled field experiment, on the other hand, Cassman et al. (2002) found 50%–80% RE. In the input nitrogen versus RE linear model (Ju et al., 2009), RE began to decrease from 50 kgha-1 upwards for wheat grain in the Taihu region (input amount was 153 kg N ha-1). Despite more nitrogen application, higher NUE and yield in RFT treatment compared to CFT may be related to the split application that led to the availability of N in later relatively critical stages; Fan et al. (2009) reported similar results with high PFP and AE in split applications.
Based on the TN input-output balance shown in Figure 5, three groups were identified in the NUE framework: 1) the control treatment dominantly felling above the 90% NUE margin. This area is also called “the mining range”; 2) RFTS and RFT treatments both fall entirely in the area between the 50%–90% NUE lines called “the desirable range.” Some points of CFT and HFT treatments were observed in this range; 3) CFT and HFT dominate below the 50% margin; this area is referred to as the “risk of inefficient N use range.” We drew a horizontal line of Y = 113 kg N ha-1yr-1 as a reference line based on the optimum rates reported in this study. As a result, the bulk of CK points dropped below the reference line; few were above the line, indicating the availability of residual nitrogen in the Soil. Li et al. (2016) reported abundant TN storage in long-term fertilized agroecosystems, consistent with our result.
We sought to assess if we could maintain crop yield while minimizing nutrient loading. Our findings demonstrated that source control of nutrient management through reduced fertilization enhanced nitrogen use efficiency, increased nutrient retention, decreased nutrient export, and maintained high crop yield. Optimal treatments of reduction fertilization treatments RFT and RFTS met these desired targets. RFT and RFTS treatments are far more effective than CT and HFT treatments when crop and biomass yield, NUE, and N export are all considered.
The findings of this study can be summarized as the following.
1. Grain and biomass yield on fertilized treatments was significantly higher than the control treatment. Yield responses to fertilizer application were in order of HFT > RFTS > CFT > RFT > CK for paddy rice and RFTS > HFT > RFT > CFT > CK for wheat. Although there was some year-to-year variation, it was not statistically significant.
2. The increase in nitrogen fertilizer amounts resulted in two distinct yield response mechanisms; crop and biomass yields grew until a certain threshold above which they started to decline. In turn, the excess nitrogen that is not assimilated or immobilized contributes to the nitrogen buildup in the soil.
3. Reduced fertilizer levels (RFT and RFTS) fell within the NUE desired range. All three NUE indicators, AE, RE, and PFP, demonstrated a similar RFT > RFTS > HFT > CFT usage efficiency trend.
4. Nutrient export was much lower from the reduced fertilization treatments than other treatments. The analysis of RDA plots and load indicators revealed that a 30% reduction of N fertilizer effectively decreased N export. Straw addition reduced N transport in RFTS by lengthening the time-lapse and slowing runoff velocity. Wheat season loading was generally higher than rice season loading except for NH4+-N.
With and without straw, 30% nitrogen reduction fertilization can be used; whereas more long-term nutrient management practices should be evaluated, and more temporal and spatial features be covered. Moreover, we recommend integrating the experimental methods with site-specific models.
The original contributions presented in the study are included in the article/Supplementary material, further inquiries can be directed to the corresponding author.
NL and MY conceived and planned the experiments. The experiments were conducted by NL, WS, WY, GM, LP, and HY. NL, WS, WY, GM, LP, HY, and XH contributed to sample collection and preparation. NL and MY contributed to the interpretation of the results. NL took the lead in writing the manuscript. All authors contributed to the article and approved the submitted version.
The authors declare that the research was conducted in the absence of any commercial or financial relationships that could be construed as a potential conflict of interest.
All claims expressed in this article are solely those of the authors and do not necessarily represent those of their affiliated organizations, or those of the publisher, the editors and the reviewers. Any product that may be evaluated in this article, or claim that may be made by its manufacturer, is not guaranteed or endorsed by the publisher.
Barak, P., Jobe, B. O., Krueger, A. R., Peterson, L. A., and Laird, D. A. (1997). Effects of long-term soil acidification due to nitrogen fertilizer inputs in Wisconsin. Plant Soil 197 (1), 61–69. doi:10.1023/a:1004297607070
Brentrup, F., Lammel, J., Bascou, P., and Billen, G., (2015). Nitrogen use efficiency (NUE) - an indicator for the utilization of nitrogen in agriculture and food systems prepared by the EU nitrogen expert panel. Windsor, United Kingdom: EU Nitrogen Expert Panel.
Buckman, H. O., and Brady, N. C. (1922). The nature and properties of soils. Hoboken, NJ, USA: Macmillan.
Carpenter, S. R., Bolgrien, D., Lathrop, R. C., Stow, C. A., Reed, T., and Wilson, M. A. (1998). Ecological and economic analysis of lake eutrophication by nonpoint pollution. Aust. J. Ecol. 23 (1), 68–79. doi:10.1111/j.1442-9993.1998.tb00706.x
Cassman, K. G., Dobermann, A., and Walters, D. T. (2002). Agroecosystems, nitrogen-use efficiency, and nitrogen management. AMBIO A J. Hum. Environ. 31 (2), 132–140. doi:10.1579/0044-7447-31.2.132
Chen, X., Yang, X., Dong, X., and Liu, E. (2013). Environmental changes in Chaohu Lake (southeast, China) since the mid-20th century: The interactive impacts of nutrients, hydrology, and climate. Limnologica 43 (1), 10–17. doi:10.1016/j.limno.2012.03.002
Duan, J., Shao, Y., He, L., Li, X., Hou, G., Li, S., et al. (2019). Optimizing nitrogen management to achieve high yield, high nitrogen efficiency and low nitrogen emission in winter wheat. Sci. Total Environ. 697, 134088. doi:10.1016/j.scitotenv.2019.134088
Fan, M., Lu, S., Jiang, R., Liu, X., and Zhang, F. (2009). Triangular transplanting pattern and split nitrogen fertilizer application increase rice yield and nitrogen fertilizer recovery. Agron. J. 101 (6), 1421–1425. doi:10.2134/agronj2009.0009
Fan, M., Shen, J., Yuan, L., Jiang, R., Chen, X., Davies, W. J., et al. (2011). Improving crop productivity and resource use efficiency to ensure food security and environmental quality in China. J. Exp. Bot. 63 (1), 13–24. doi:10.1093/jxb/err248
Follett, R. F. (2008). Chapter 2 transformation and transport processes of nitrogen in agricultural systems. Lincoln, NE, United States: USDA Agricultural Research Service.
Gao, S., Tanji, K. K., Scardaci, S. C., and Chow, A. T. (2002). Comparison of redox indicators in a paddy soil during rice-growing season. Soil Sci. Soc. Am. J. 66 (3), 805–817. doi:10.2136/sssaj2002.8050
Geisseler, D., Miller, K. S., Aegerter, B. J., Clark, N. E., and Miyao, E. M. (2019). Estimation of annual soil nitrogen mineralization rates using an organic-nitrogen budget approach. Soil Sci. Soc. Am. J. 83 (4), 1227–1235. doi:10.2136/sssaj2018.12.0473
Guo, J. H., Liu, X. J., Zhang, Y., Shen, J. L., Han, W. X., Zhang, W. F., et al. (2010). Significant acidification in major Chinese croplands. Science 327, 1008–1010. doi:10.1126/science.1182570
Hahn, C., Prasuhn, V., Stamm, C., and Schulin, R. (2012). Phosphorus losses in runoff from manured grassland of different soil P status at two rainfall intensities. Agric. Ecosyst. Environ. 153, 65–74. doi:10.1016/j.agee.2012.03.009
Hansen, A. T., Dolph, C. L., Foufoula-Georgiou, E., and Finlay, J. C. (2018). Contribution of wetlands to nitrate removal at the watershed scale. Nat. Geosci. 11 (2), 127–132. doi:10.1038/s41561-017-0056-6
Hauck, R. D. (1981). Nitrogen fertilizer effects on nitrogen cycle processes. Ecol. Bull. 33, 551–562.
Ji, X.-H., Zheng, S.-X., Shi, L.-H., and Liu, Z.-B. (2011). Systematic studies of nitrogen loss from paddy soils through leaching in the dongting lake area of China. Pedosphere 21 (6), 753–762. doi:10.1016/s1002-0160(11)60179-3
Jia, X., Zhu, Y., Huang, L., Wei, X., Fang, Y., Wu, L., et al. (2018). Mineral N stock and nitrate accumulation in the 50 to 200m profile on the Loess Plateau. Sci. Total Environ. 633, 999–1006. doi:10.1016/j.scitotenv.2018.03.249
Jin, L., Cui, H., Li, B., Zhang, J., Dong, S., and Liu, P. (2012). Effects of integrated agronomic management practices on yield and nitrogen efficiency of summer maize in North China. Field Crops Res. 134, 30–35. doi:10.1016/j.fcr.2012.04.008
Ju, X.-T., Xing, G.-X., Chen, X.-P., Zhang, S.-L., Zhang, L.-J., Liu, X.-J., et al. (2009). Reducing environmental risk by improving N management in intensive Chinese agricultural systems. Proc. Natl. Acad. Sci. 106 (9), 3041–3046. doi:10.1073/pnas.0813417106
Lassaletta, L., Billen, G., Grizzetti, B., Anglade, J., and Garnier, J. (2014). 50 year trends in nitrogen use efficiency of world cropping systems: The relationship between yield and nitrogen input to cropland. Environ. Res. Lett. 9 (10), 105011. doi:10.1088/1748-9326/9/10/105011
Li, Q., Luo, Y., Wang, C., Li, B., Zhang, X., Yuan, D., et al. (2016). Spatiotemporal variations and factors affecting soil nitrogen in the purple hilly area of Southwest China during the 1980s and the 2010s. Sci. Total Environ. 547, 173–181. doi:10.1016/j.scitotenv.2015.12.094
Lin, C., Xiong, J., Ma, R., and Zhu, C. (2021). Identifying the critical watershed regions creating lake nutrient enrichment (SLRs) based on a watershed-lake integrated perspective – a case study of Chaohu Lake Basin, China. Ecol. Indic. 121, 107037. doi:10.1016/j.ecolind.2020.107037
Luce, M. S. (2013). “Labile organic nitrogen fractions: Characteristics, dynamics, and significance to soil nitrogen supply in agricultural soils,”. Doctor of Philosophy (Montreal, Canada: McGill University).
Ma, Z., Luo, M., Wang, Q., Li, C., Guo, L., Wu, S., et al. (2022). Long-term agronomic practices in reducing nitrogen and phosphorus loss from intensive croplands. ACS Earth Space Chem. 6 (6), 1627–1639. doi:10.1021/acsearthspacechem.2c00097
Meisinger, J. J., Calderón, F. J., and Jenkinson, D. S. (2008a). “Soil nitrogen budgets,” in Nitrogen in agricultural systems (Hoboken, NJ, United States: Wiley), 505–562.
Meisinger, J. J., Schepers, J. S., and Raun, W. R. (2008b). 'Crop nitrogen requirement and fertilization. Nitrogen Agric. Syst., 563–612. doi:10.2134/agronmonogr49.c14
Mellander, P.-E., Melland, A. R., Jordan, P., Wall, D. P., Murphy, P. N. C., and Shortle, G. (2012). Quantifying nutrient transfer pathways in agricultural catchments using high temporal resolution data. Environ. Sci. Policy 24, 44–57. doi:10.1016/j.envsci.2012.06.004
Meng, Q., Yue, S., Hou, P., Cui, Z., and Chen, X. (2016). Improving yield and nitrogen use efficiency simultaneously for maize and wheat in China: A review. Pedosphere 26 (2), 137–147. doi:10.1016/s1002-0160(15)60030-3
Ni, J., Xu, J., and Zhang, M. (2018). Constructed wetland modelling for watershed ecosystem protection under a certain economic load: A case study at the chaohu Lake watershed, China. Ecol. Model. 368, 180–190. doi:10.1016/j.ecolmodel.2017.11.019
Nie, X., Xiong, F., Yang, L., Li, C., and Zhou, G. (2017). Soil nitrogen storage, distribution, and associated controlling factors in the northeast Tibetan plateau shrublands. Forests 8, 416. doi:10.3390/f8110416
Patrick, W. H., and Mahapatra, I. C. (1968). “Transformation and availability to rice of nitrogen and phosphorus in waterlogged soils,” in Advances in agronomy. Editor A. G. Norman (Cambridge, MA, United States: Academic Press), 323–359.
Peng, Z., Hu, W., Liu, G., Zhang, H., Gao, R., and Wei, W. (2019). Development and evaluation of a real-time forecasting framework for daily water quality forecasts for Lake Chaohu to Lead time of six days. Sci. Total Environ. 687, 218–231. doi:10.1016/j.scitotenv.2019.06.067
Schroder, J. L., Zhang, H., Girma, K., Raun, W. R., Penn, C. J., and Payton, M. E. (2011). 'Soil acidification from long-term use of nitrogen fertilizers on winter wheat. Soil Sci. Soc. Am. J. 75 (3), 957–964. doi:10.2136/sssaj2010.0187
Srivastava, R. K., Panda, R. K., Chakraborty, A., and Halder, D. (2018). Enhancing grain yield, biomass and nitrogen use efficiency of maize by varying sowing dates and nitrogen rate under rainfed and irrigated conditions. Field Crops Res. 221, 339–349. doi:10.1016/j.fcr.2017.06.019
Sullivan, D., Moore, A., Verhoeven, E., and Brewer, L. (2020). Baseline soil nitrogen mineralization: Measurement and interpretation. Corvallis, Oregon: Oregon State University.
Swaney, D. P., and Howarth, R. W. (2019). Phosphorus use efficiency and crop production: Patterns of regional variation in the United States, 1987–2012. Sci. Total Environ. 685, 174–188. doi:10.1016/j.scitotenv.2019.05.228
Veneklaas, E. J., Lambers, H., Bragg, J., Finnegan, P. M., Lovelock, C. E., Plaxton, W. C., et al. (2012). Opportunities for improving phosphorus-use efficiency in crop plants. New Phytol. 195 (2), 306–320. doi:10.1111/j.1469-8137.2012.04190.x
Wang, J., Lü, G., Guo, X., Wang, Y., Ding, S., and Wang, D. (2015). Conservation tillage and optimized fertilization reduce winter runoff losses of nitrogen and phosphorus from farmland in the Chaohu Lake region, China. Nutrient Cycl. Agroecosyst. 101 (1), 93–106. doi:10.1007/s10705-014-9664-3
Wang, L., Liang, T., and Zhang, Q. (2013). 'Laboratory experiments of phosphorus loss with surface runoff during simulated rainfall. Environ. Earth Sci. 70 (6), 2839–2846. doi:10.1007/s12665-013-2344-9
Wang, R., Min, J., Kronzucker, H. J., Li, Y., and Shi, W. (2019). 'N and P runoff losses in China's vegetable production systems: Loss characteristics, impact, and management practices. Sci. Total Environ. 663, 971–979. doi:10.1016/j.scitotenv.2019.01.368
Xiaohong, Z., Zhongwen, M. A., Youhua, M. A., Lijuan, Z., and Liting, W., (2012). Nitrogen volatilization form plants. Bozeman, MT, United States: Montana State University.
Yang, X., Lu, Y., Ding, Y., Yin, X., Raza, S., and Tong, Y. A. (2017). Optimising nitrogen fertilisation: A key to improving nitrogen-use efficiency and minimising nitrate leaching losses in an intensive wheat/maize rotation (2008–2014). Field Crops Res. 206, 1–10. doi:10.1016/j.fcr.2017.02.016
Zhang, Q.-c., and Wang, G.-h. (2005). Studies on nutrient uptake of rice and characteristics of soil microorganisms in a long-term fertilization experiments for irrigated rice. J. Zhejiang Univ. Sci. B 6 (2), 147–154. doi:10.1631/jzus.2005.b0147
Zhou, H., and Gao, C. (2011). Assessing the risk of phosphorus loss and identifying critical source areas in the chaohu Lake watershed, China. Environ. Manag. 48 (5), 1033–1043. doi:10.1007/s00267-011-9743-z
Keywords: optimum fertilizer treatment, reduced fertilization, NUE, nitrogen loading, intensive farming
Citation: Legesse N, Sheng W, Yao W, Manqin G, Peishi L, Yu H, Hongjun X, HongXiang H and Youhua M (2023) Optimal fertilizer rates towards the improvement of nitrogen use efficiency and reduction of nitrogen export in paddy rice-wheat intensive farming. Front. Environ. Sci. 11:1239785. doi: 10.3389/fenvs.2023.1239785
Received: 14 June 2023; Accepted: 14 August 2023;
Published: 29 August 2023.
Edited by:
Wei He, China University of Geosciences, ChinaReviewed by:
Yu Gong, Chinese Academy of Sciences (CAS), ChinaCopyright © 2023 Legesse, Sheng, Yao, Manqin, Peishi, Yu, Hongjun, HongXiang and Youhua. This is an open-access article distributed under the terms of the Creative Commons Attribution License (CC BY). The use, distribution or reproduction in other forums is permitted, provided the original author(s) and the copyright owner(s) are credited and that the original publication in this journal is cited, in accordance with accepted academic practice. No use, distribution or reproduction is permitted which does not comply with these terms.
*Correspondence: Hu HongXiang, aHVob25neGlhbmdAYWhhdS5lZHUuY24=; Ma Youhua, eWhtYUBhaGF1LmVkdS5jbg==
Disclaimer: All claims expressed in this article are solely those of the authors and do not necessarily represent those of their affiliated organizations, or those of the publisher, the editors and the reviewers. Any product that may be evaluated in this article or claim that may be made by its manufacturer is not guaranteed or endorsed by the publisher.
Research integrity at Frontiers
Learn more about the work of our research integrity team to safeguard the quality of each article we publish.